
The Feature Resolution and Dimensional Control in Freeform Solidification of Alumina Systems by Stereolithography

Department of Materials Science and Engineering, Rutgers, The State University of New Jersey, Piscataway, NJ 08854, USA
*
Author to whom correspondence should be addressed.
Ceramics 2023, 6(4), 2036-2052; https://doi.org/10.3390/ceramics6040125
Submission received: 18 September 2023
/
Revised: 9 October 2023
/
Accepted: 12 October 2023
/
Published: 17 October 2023
(This article belongs to the Special Issue Advances in Ceramics, 2nd Edition)
Abstract
:Controlling the feature resolution and dimension of printed products using stereolithography requires a comprehensive understanding of compositional and printing variables. Balancing these variables adds more complexity to manufacturing near net shape products. In this study, the compositional variables examined include particle size and solid content using two resins, and printing variables include layer thickness and energy dose. Choosing the energy dose for curing depends on compositional variables and consequently affects the degree of scattering. The results shows that light scattering determines the changes in the feature resolution and lateral dimensions. The layer thickness only affects the feature resolution and not the lateral dimensions. The vertical dimension does not significantly change with the chosen variables. In this study, fine-tuning the variables is shown to produce parts with high precision and resolution. Both compositional and printing variables play a key role in achieving near net shape products.
1. Introduction
Structural integrity, dimensional control, and feature resolution are fundamental requirements in the research and industry of freeform fabrication by stereolithography [1,2,3,4,5,6]. In this process, the parts are built using sequential stacking and recoating of layers. The materials are crowded photocurable suspensions, consisting of photoactive components, cross-linkable polymer, and a high concentration of solid particles [5,7,8,9,10,11,12]. During the building process, the layers are formed through a selective photopolymerization reaction, during which photons interact with the medium through absorption and scattering modes initiating photopolymerization. Some of the light is absorbed by photoactive components, polymer, and solid particles, while the other portion is scattered in random directions by the solid particles. The uncontrolled interaction causes strong scattering and insufficient cure depth, which is described by light attenuation. The strong scattering negatively impacts the lateral dimensional resolution [13,14,15], while the insufficient cure depth reduces the interlayer adhesion, causing delamination and cracks [4,8,9,15,16,17,18,19]. An optimized energy dose is essential to achieve a strong interlayer adhesion while maintaining a low degree of scattering. A high energy dose provides a strong layer lamination, but it results in excess lateral dimensions.
The volume of a single layer is determined by the layer height and exposure area. Each layer’s height is predetermined by the building platform’s position while also constrained by how far the light travels in the vertical direction. The exposure area determines the lateral dimensions and depends on the degree of scattering. This volume can be described by cure depth and width and studied using theoretical models based on Jacob’s equation [7,9,13,14,15,16,17,18,20,21]. The depth and width depend on the compositional variables, such as particle size, solid content, refractive index difference, absorption coefficient, and printing variables, such as the energy dose [7,9,12,13,14,15,16,17,22,23]. Previous studies did not examine both compositional and printing variables together to achieve fine-tuned products. Namely, what is the correlation between compositional and printing variables? How do they impact the resolution of products? In few studies, the solid content was shown to impact the directional shrinkage, and printing variables determine the feature sizes [4,5,6,24]. The printing direction was also shown to influence the degree of deviation in shrinkage and dimensional accuracy of parts [25]. In another study, the cure depth and width were examined as a function of energy dose using a fixed compositional variable that was chosen based on its desirable rheological properties [26]. Additionally, the feature resolution, printing scale, and speed were also shown to be improved by developing a printer that uses a dynamic projection scanning lithography technique with digital super resolution [27]. In our previous study, the impact of layer thickness and energy dose on interlayer adhesion and dimensional control was examined using commercial feedstock with fixed compositional variables and a limited energy dose range [28].
Therefore, it is important to understand how both compositional and printing variables control the feature resolution and dimensions and the correlation between these variables in a stereolithography process. In this context, alumina suspensions with Newtonian-like behaviors were designed to examine these variables. This study centered around understanding the role of particle size and solid content using two different resins and studying the effects of layer thickness and energy dose, allowing us to fine-tune variables to achieve near net shape.
2. Experimental Procedure
2.1. Materials
Two alumina powders with different particle sizes, AA07 and AA3 (Sumitomo Chemical, Tokyo, Japan), were used in this study (Table 1 and Supplementary Figure S1). AA07 powder (d50 = 1.35 µm) was finer than AA3 powder (d50 = 2.76 µm) as measured with the dynamic light scattering method using Mastersizer 3000 (Malvern Panalytical Ltd., Malvern, UK). Their morphology was equiaxed (Supplementary Figure S1a), which was chosen to avoid any dimensional changes associated with particle orientation induced by the casting shear rate. Typically, the refractive index (n) of alumina at 589.0 nm was 1.752 [29], which is higher than the refractive index of resins (Resin1 = 1.477 and Resin2 = 1.483), as shown in Table 1. The photocurable resins were a proprietary acrylate-based polymer, consisting of an oligomer (70.0 %wt.), a monomer (27.0 %wt.), and diphenyl(2,4,6-trimethylbenzoyl)phosphine oxide (TPO) (3.0 %wt.) as a photoinitiator without any additional dyes and inhibitors. Resin1 (R1) had a difunctional monomer, and Resin2 (R2) had a trifunctional monomer [30]. The preparation of resins is described elsewhere [30]. During resin preparation step, the dispersant, acidic polyether (BASF, Ludwigshafen, Germany) with a density of 1.18 g/cm3, was added to the oligomer. The dispersant to alumina weight ratio was 0.5% in all suspensions.
The characteristics of resins, such as viscosity, density, refractive index, and cure depth of Resin1 and Resin2, are shown in Supplementary Table S1. Since Resin1 had lower viscosity, it allowed an increase in solid content to ~54 %vol to study the effect of the alumina concentration. Additionally, the difference in the refractive index between resins is very minimal. Therefore, we do not expect this difference to change the degree of scattering behavior when using Resin1 and Resin2. However, the difference in refractive index between a solid and resin is large, so it may impact the degree of scattering.
2.2. Suspensions Preparation
Suspensions, for which the compositions are shown in Table 1, were prepared using a dual asymmetric centrifugal (DAC) mixer (FlackTek Inc., Landrum, SC, USA) with cylindrical alumina media (12.0 mm height) using two different mixing chamber volumes for two different purposes. The chambers had maximum volumes of 40.0 mL and 200.0 mL; four media were used with the smaller chamber to prepare suspensions for characterizations, while the larger chamber used six media to prepare suspensions for printing. The materials were mixed using a stepwise method for a total of 6.0 min while maintaining a 20.0 mbar vacuum to remove trapped air. The mixing speed and duration of the stepwise method were 1050.0 rpm (2.0 min), 1250.0 rpm (2.0 min), 1950.0 rpm (1.0 min), and then 1200.0 rpm (1.0 min). The alumina powders were then added in portions depending on the chamber volume and solid content to ensure a high degree of dispersion. They were mixed in 2–3 equal portions in the 40.0 mL chamber and 4–5 equal portions in the 200.0 mL chamber. The final mixture was additionally mixed 1–3 times to ensure a high degree of dispersion in some cases. Suspensions were aged 24–27 h before characterization and 96 h before use for printing. During and after the aging step, most suspensions showed stable viscosity values indicating a stable interparticle interaction in the prepared suspensions. However, few samples with very high solid content potentially exhibited a certain degree of coalescence of particles as indicated by the very slight decrease in viscosity over time (Supplementary Figure S2).
2.3. Suspension Characterization
Two main assessments were performed: viscosity and degree of agglomeration measurements. The viscosity was measured within a shear rate of (0.1–300.0) s−1 using a Kinexus rotational rheometer (Netzsch Instruments, Selb, Germany) at 25.0 °C. A small volume of the suspension was placed gently between two parallel plates with a diameter of 25.0 mm, and the gap between them was 0.5 mm.
The level of the coarse agglomerate was identified using an automated fineness of grind (FOG) gauge, TIDAS (Labman Automation Ltd., Stokesley, UK). This apparatus consists of a metal block and scraper, and the metal block has a tapered channel, which consists of precise incremental depths. The scraper is drawn across the channel to trap the agglomerate and create striations that form at depths corresponding to their size. The agglomerates and striations were analyzed using a built-in image analysis software to provide the agglomerate size distribution. The images were divided into three regions, which were region I (green color), region II (blue color), and the transition region (the area between regions I and II). In this study, a gauge with a range of (0–100) µm was used. The drawdown velocity was changed in a few experiments to trap and visualize the agglomerates of very viscous suspensions. More details about this test and the difference between the regions are described elsewhere [31].
2.4. Cure Depth and Width Changes Measurements
The suspensions were cured with a digital light projector (DLP), Admaflex 130 (Admatec Europe BV, Alkmaar, The Netherlands), using an energy dose of 6.2–88.9 mJ/cm2 as shown in Supplementary Table S2. The curing system projects an image with a wavelength of 405.0 nm and a pixel size of 35.0 µm. The lateral dimensions of the projected image were (5.0 × 5.0) mm. The samples were cleaned with ethanol and paper towels in a consistent manner. The cure depth was measured using a high-precision micrometer, and the cure width changes were measured using an optical microscope, Keyence digital microscope (Keyence, Osaka, Japan).
2.5. Printing and Dimensional Measurements
The samples were printed using Admaflex 130. It is derived from the tape casting concept, which consists of a doctor blade with a reservoir. It casts a thin coat of suspension under the building platform, which acts as the vat for photopolymerization, as shown in Figure 1. The casting shear rate was 150.0 s−1 and the doctor blade height was 200.0 µm. The system is designed to recollect the remaining suspension into the reservoir, but this was not applied here to avoid contamination. The cured layer was detached from the foil after 5.0–10.0 s using a slow speed of 0.025 mm/s for a distance of 0.5 mm away from the foil. Two layer thicknesses, 20.0 µm and 50.0 µm, along with two energy dose levels, were utilized to understand their impact on feature resolution and dimensional control (Supplementary Table S2). The energy dose was altered depending on the suspension. However, the ratio of the targeted cure depth to layer thickness was kept consistent. The targeted cure depth is the cure depth used for printing, which is higher than the printing thickness to ensure interlayer adhesion. Here, we employed two different targeted cure depths, which were 3× and 7× the layer thickness with a tolerance of ±20.0 µm.
An hour before printing, the materials were remixed to further remove trapped air using a DAC mixer under low-shear conditions: 800 rpm for 2 min under a 20 mbar vacuum. After printing, the samples were cleaned using acetone to remove the residual uncured suspension.
The prepared samples were debound and sintered following designed heating profiles (Supplementary Figure S3). The term debound refers to thermally treated samples at 600.0 °C; thus, a low residual carbon was expected. The design of these profiles was described elsewhere [30]. The dimensions were measured at two stages: after printing and after sintering using the Keyence digital microscope. The dimensional changes of as-printed samples were calculated with respect to the CAD model, which was (5.0 × 5.0 × 5.0) mm, while the dimensional changes in as-sintered samples were calculated with respect to the dimensions of as-printed samples. The changes in dimensions were defined using positive and negative signs to distinguish the difference between the increase or reduction in dimensions. A positive value meant growth in dimensions due to the scattering effect, whereas a negative value indicated shrinkage. The lateral directions are indicated by the x and y axes, and the z axis indicates the vertical direction.
2.6. Microstructure Visualization
The microstructure of some samples was visualized. The visualization was conducted using a field emission scanning electron microscope (FESEM) (Zeiss, Oberkochen, Germany). Before imaging, the samples were polished to obtain a mirror-like finish.
3. Results and Discussion
3.1. Suspension Characterization
Figure 2 shows the viscosity and shear stress of suspensions as a function of the shear rate (0.1–300 s−1) at 25.0 °C. All the suspensions composed of fine alumina (FA-R1 and R2) exhibited shear rate-independent viscosity, except for the low- and high-end ranges of shear rates. At the low-end range of the shear rate, <~1.0 s−1, the viscosity slightly decreased with increasing shear rate. Then, it exhibited Newtonian-like behavior, followed by a drastic drop in viscosity starting at ~100.0 s−1. This drop in viscosity resulted from the instability and reduced volume of suspensions between the parallel plates at the high-end range of shear rates. The suspension consisting of coarser alumina (AA3) and Resin2, labeled CA-R2, showed a slight increase in viscosity with shear rate, indicating a shear thickening behavior. However, it also showed a drastic drop in viscosity at the high-end range of shear rates. The overall viscosity increased with solid content and decreased with coarse particles, as expected. A closer look at the shear stress-shear rate plot (Figure 2b) revealed that all suspensions had a linear behavior as a function of shear rate, indicating that these systems overall exhibited a Newtonian-like behavior except for the high-end range of shear rate. These observations might indicate a good dispersion of the alumina particles in suspensions, as hypothesized in the literature [11].
According to the literature, the stereolithography suspensions typically exhibit a shear thinning behavior and relatively low viscosity [6,22,32,33,34,35,36,37]. Yet, the suspensions with Newtonian-like behaviors were also produced in a few studies [11,38]. Our findings also support that suspensions with Newtonian-like behaviors can be printed using a stereolithography apparatus based on the tape casting method.
Figure 3 shows segmented images of the agglomeration distribution obtained using the automated FOG gauge. All the suspensions prepared showed a high level of dispersion, i.e., only a few coarse agglomerates with sizes larger than and around 10 µm were detected as indicated by the green dots on the images. The suspension with coarser particles showed a slightly higher count of coarse agglomerates than those with finer particles. The images also showed that the region II area (blue color) increased with coarser particles, which are agglomerates/features that TIDAS software cannot distinguish individually.
3.2. Cure Depth and Width Changes
Figure 4 shows the cure depth as a function of energy dose for varying suspensions. In all suspensions, the cure depth increased with energy dose and particle size. That is, the coarser particles resulted in a higher cure depth (Figure 4a). In our previous work, we found that this behavior is attributed to the increase in scattering length because of a reduced depth attenuation coefficient with particle size. In other words, the degree of scattering was reduced with larger particle size [39]. On the other hand, varying solid content did not show a significant difference in cure depth (Figure 4b). This behavior may have resulted from either the small range of solid content, which might not show any significant changes in cure depth, or the independence of the depth attenuation coefficient and critical energy dose on solid content, as we have previously shown [39].
Figure 5 shows the changes in cure width as a function of energy dose for varying suspensions. The cure width increased with the energy dose for all suspensions. Some studies reported this behavior, which is caused by the increase in scattering in lateral directions [4,13,14,19]. However, the variations in particle size and solid content did not result in a clear cure width change, which was not detectable using this method of single-layer curing. Therefore, the cure width of fully printed objects will be measured to study the changes in lateral dimensions.
3.3. Feature Resolution
In this section, the term feature resolution is used to evaluate the overall sharpness of the sample’s edges and how well the shape and edges of the letter “z” on printed samples are defined (Figure 6 and Figure 7). Next, the term surface flaws corresponds to cracks, openings, and delaminations observed using an optical microscope and FESEM.
Figure 6 shows the effect of energy dose, layer thickness, and particle size on the feature resolution of the printed objects. The images were taken perpendicular to the printing direction. The data showed that lowering the energy dose while using a 50.0 µm layer thickness (Figure 6a for fine alumina) improved the feature resolution as compared to high energy doses with a 50.0 µm layer thickness (Figure 6b) because of a lower degree of scattering. However, the reduction in energy dose (Figure 6a,d) also resulted in more surface flaws as compared to high energy dose counterparts (Figure 6b,e, respectively).
Under the same conditions, the flaws were more noticeable with coarse powder, CA-R2, than fine powder, FA-R2. The flaws potentially resulted from the shear thickening behavior, which added additional stress on the interlayer adhesion when a low targeted cure depth was applied.
However, the overall viscosity of coarse powder suspensions is still lower than fine powder (Figure 2), which makes the cause of the flaws unclear. Increasing the energy dose with thicker layers mitigated the surface flaws (Figure 6e).
Reducing layer thickness allowed a high targeted cure depth to layer thickness ratio while maintaining a lower energy dose for curing, which resulted in improvement in feature resolution (Figure 6c,f). The low energy dose used with the thinner layer produced a cure depth of 7× layer thickness, while the similar energy dose used with the thicker layer produced a cure depth of 3× layer thickness. This condition also mitigated the flaws for printed samples only with coarse powder (Figure 6f). Since the degree of scattering was reduced by lowering the energy dose, thinner layers printed with lower energy allowed the creation of conditions to provide a high interlayer adhesion and high feature resolution. Thus, overall, it seems that 20.0 µm layer thickness and a low energy dose are favorable conditions for printing.
Figure 7 shows the effect of solid content on the feature resolution of the printed objects using 20.0 µm layer thickness and a low energy dose. Overall, it seems that the increase in solid content reduced the resultant feature resolution. All printed samples with higher solid content showed more surface flaws than what shown above.
It is worth noting that more surface flaws were seen in Resin1 samples using a low energy dose and 50.0 µm layer thickness. The high energy dose and 50.0 µm layer thickness resulted in a very low resolution, as seen previously with Resin2 samples.
A closer examination of the microstructure of selected samples showed that some of these flaws were interlayer delaminations (Figure 8 and Figure 9). They were located at or closer to the surface. Most of the samples had none to less than ~300.0 µm delaminations; however, cracks reached ~800.0 µm as noted in the 75.0 %wt. FA-R1 sample. Additional images of the samples are shown at a lower magnification in the Supplementary Materials.
Another type of defect was also noted from closer microstructure observation (Figure 8 and Figure 9), which is a stair-wise pattern along edges. It was more clear with thicker layers and when the degree of scattering was stronger. The finer alumina samples with thinner layers did not show a strong stair-wise layer pattern mainly because of their thin layers (Figure 8c and Figure 9). However, the 50.0 µm layer thickness prints of finer alumina samples showed a stair-wise pattern when an equivalent low energy dose was used (Figure 8a,c). Increasing the energy dose while printing using thicker layers resulted in an odd pattern along the edges (Figure 8b), which is caused by very strong scattering. They form extra dimensions with an abnormal shape. The edges were bent concave downwards towards the foil. We assume that the bending was caused by the pulling force in the high-viscosity suspension during the building platform movements. Using coarser powder combined with a low energy dose and 50.0 µm layer thickness did not result in a very strong stair-wise pattern. However, under the same conditions, the high energy dose caused a strong stair-wise pattern (Figure 8d,e). The energy dose, in this case, was lower than what was used for finer alumina samples printed using a similar layer thickness and targeted cure depth.
How the light interacts and scatters in lateral directions creates the stair-wise pattern, specifically, the shape of the edges. The light tends to attenuate as it travels far from the edges of the projected image, creating the “V” shape at the edges (Figure 8f). In general, the stair-wise pattern caused a loss in feature resolution. Therefore, reducing the scattering degree resulted in a reduction in the stair-wise pattern, and printing with a thinner layer helped mitigate this problem. Additional data about the effect of scattering on the interlayer between the base and first few layers can be found in the Supplementary Materials.
3.4. Dimensional Changes after Printing
The data in Section 3.2 demonstrated that it is possible to select an energy dose that produces a targeted cure depth for printing while monitoring the growth in lateral dimensions. For example, if we targeted the layer thickness of 20.0 µm and a cure depth of ~150 µm, the energy dose for finer alumina would be 2.5× higher than that for coarser alumina to reach the same level of cure depth. This higher energy dose is expected to cause ~5% growth in the lateral dimension for finer alumina suspensions as compared to <0% growth for coarse alumina suspensions as measured in the single layer (Figure 4a and Figure 5b). Therefore, if we need to maintain a high targeted cure depth and reduce the energy dose, we need to control the layer thickness and composition in 3D printed objects.
Figure 10 shows the effect of energy dose and layer thickness on the lateral and vertical dimensions of samples. Three different samples were prepared using two powders and two resins at a fixed solid content of 75.0 %wt. Figure 10a shows the impact of energy dose on samples printed using a layer thickness of 50.0 µm. The targeted cure depth was 3× the layer thickness for the low energy dose prints and 7× the layer thickness for the high energy dose prints. However, the actual value for energy dose depended on the composition. That is, samples with finer particles, AA07 powder, required a higher energy dose to reach a similar targeted cure depth as observed in samples with coarser particles, AA3 powder (Figure 4). The high energy dose resulted in larger lateral dimensions when it was projected on fine alumina since this interaction between high energy dose and fine particles resulted in strong scattering polymerizing a larger area. These data agree with the previous observations on the cure width–energy dose relation of a single layer (Figure 5). This growth in dimensions was smaller to nonexistent when using coarser particles because of the low degree of scattering at the energy dose (Supplementary Table S2). Overall, the lateral dimensions of coarse alumina and fine alumina printed using a low energy dose were close to the net shape and size: < ±3% changes in the lateral direction. In the literature, it was mentioned that this type of unwanted growth could also be a mismatch between the CAD borders and pixel borders [4]. However, we believe its impact was minimal compared to the impact of energy dose in our study. Additionally, when the z direction was examined, the energy dose showed ineffective impact on the dimension. There was a very small decrease in the degree of shrinkage with a high energy dose, which was not significant for most samples (Figure 10a).
Figure 10b shows the effect of layer thickness on lateral and vertical dimensions using the three samples described above. In this case, the printing conditions included a low energy dose and 20.0 µm and 50.0 µm layer thicknesses. The 20.0 µm layer thickness resulted in a targeted cure depth of 7× layer thickness, whereas a 50.0 µm layer thickness resulted in a 3× layer thickness. The changes in dimensions were not significantly large as a function of layer thickness in all samples. Overall, regardless of the layer thickness, the data of lateral dimensions showed that fine alumina had a small increase in lateral dimensions. However, coarse alumina had a reduction in lateral dimensions, which was caused by the energy dose and scattering degree-related behaviors. The changes in dimensions in the z direction did not follow a specific trend as a function of layer thickness (Figure 10b).
Figure 11 shows the effect of solid content on lateral and vertical dimensions. The samples consisted of AA07 powder and Resin1. They were printed using 20.0 µm layer thickness and a low energy dose, producing a targeted cure depth equal to 7× the layer thickness. The data showed that the lateral dimensions increased slightly with solid content. However, the degree of shrinkage in the z direction reduced slightly with solid content. In the literature, conflicting observations regarding lateral dimensions were reported. Chartier et al. (2012) [35] showed that the lateral dimensions of silica suspensions depended on the solid content. However, Gentry and Halloran (2015) [14] showed that both critical energy and attenuation factors of excess lateral dimensions were independent of the solid content of alumina. In other words, the excess lateral dimensions were independent of the solid content. Our study showed some dependency of lateral dimensions on solid content.
It is worth noting that the excess lateral dimensions after printing for all conditions described above were also related to the stair-wise pattern along the edges (Figure 8 and Figure 9). Specifically, forming these patterns on the edges contributed to the excess dimensions and inaccuracy.
In all samples, the dimensional changes were anisotropic, meaning that the vertical dimension changed at a higher rate than lateral dimensions. This was clearer when no large growth occurred in lateral dimensions. An examination of the layers across the prints revealed nonuniformity in their thickness (Figure 12). The first few layers near the base showed a smaller thickness compared to the rest of the layers. These data showed a significant thickness reduction of about 80.0% in the first few layers. Then, the data indicated an approximately 0% change. These observations might explain the large reduction in the dimensions of the building direction, which was about 6.0–8.0% overall in the printed samples. A discussion with the manufacturer revealed that the thickness of glass plate caused this issue. Here, thin glass bends under pressure of the building platform resulting in a miscalculation of layer thickness in the first few layers. Increasing the glass thickness could solve this issue. Therefore, additional measurements were conducted using a thicker glass on the 75.0 %wt. FA-R2 sample printed using 20.0 µm layer thickness and targeted cure depth equal to 7× the layer thickness. The results showed that the amount z shrinkage was reduced by about half as the number of miscalculated thickness was reduced by half using thicker glass plate, as shown Table S3 Supplementary Materials. Additional data are shown in the Supplementary Materials.
3.5. Dimensional Changes after Sintering
The dimensional change after sintering was measured only on samples composed of AA07 powder and printed using 20.0 µm layer thickness. The details of debinding are described in the Supplementary Materials.
Figure 13 shows optical and scanning electron microscope images of the sintered samples. The images showed an opening at the surface, which originated from poor interlayer adhesion at an early stage of the process. However, these small openings did not impact the dimensional measurements. The difference between the dimensions on the crack side and the noncrack side was within ~1.2%, which was negligible compared to the large changes in dimensions in sintered samples. The uneven surfaces seen in the microstructure were due to the anisotropic shrinkage upon sintering.
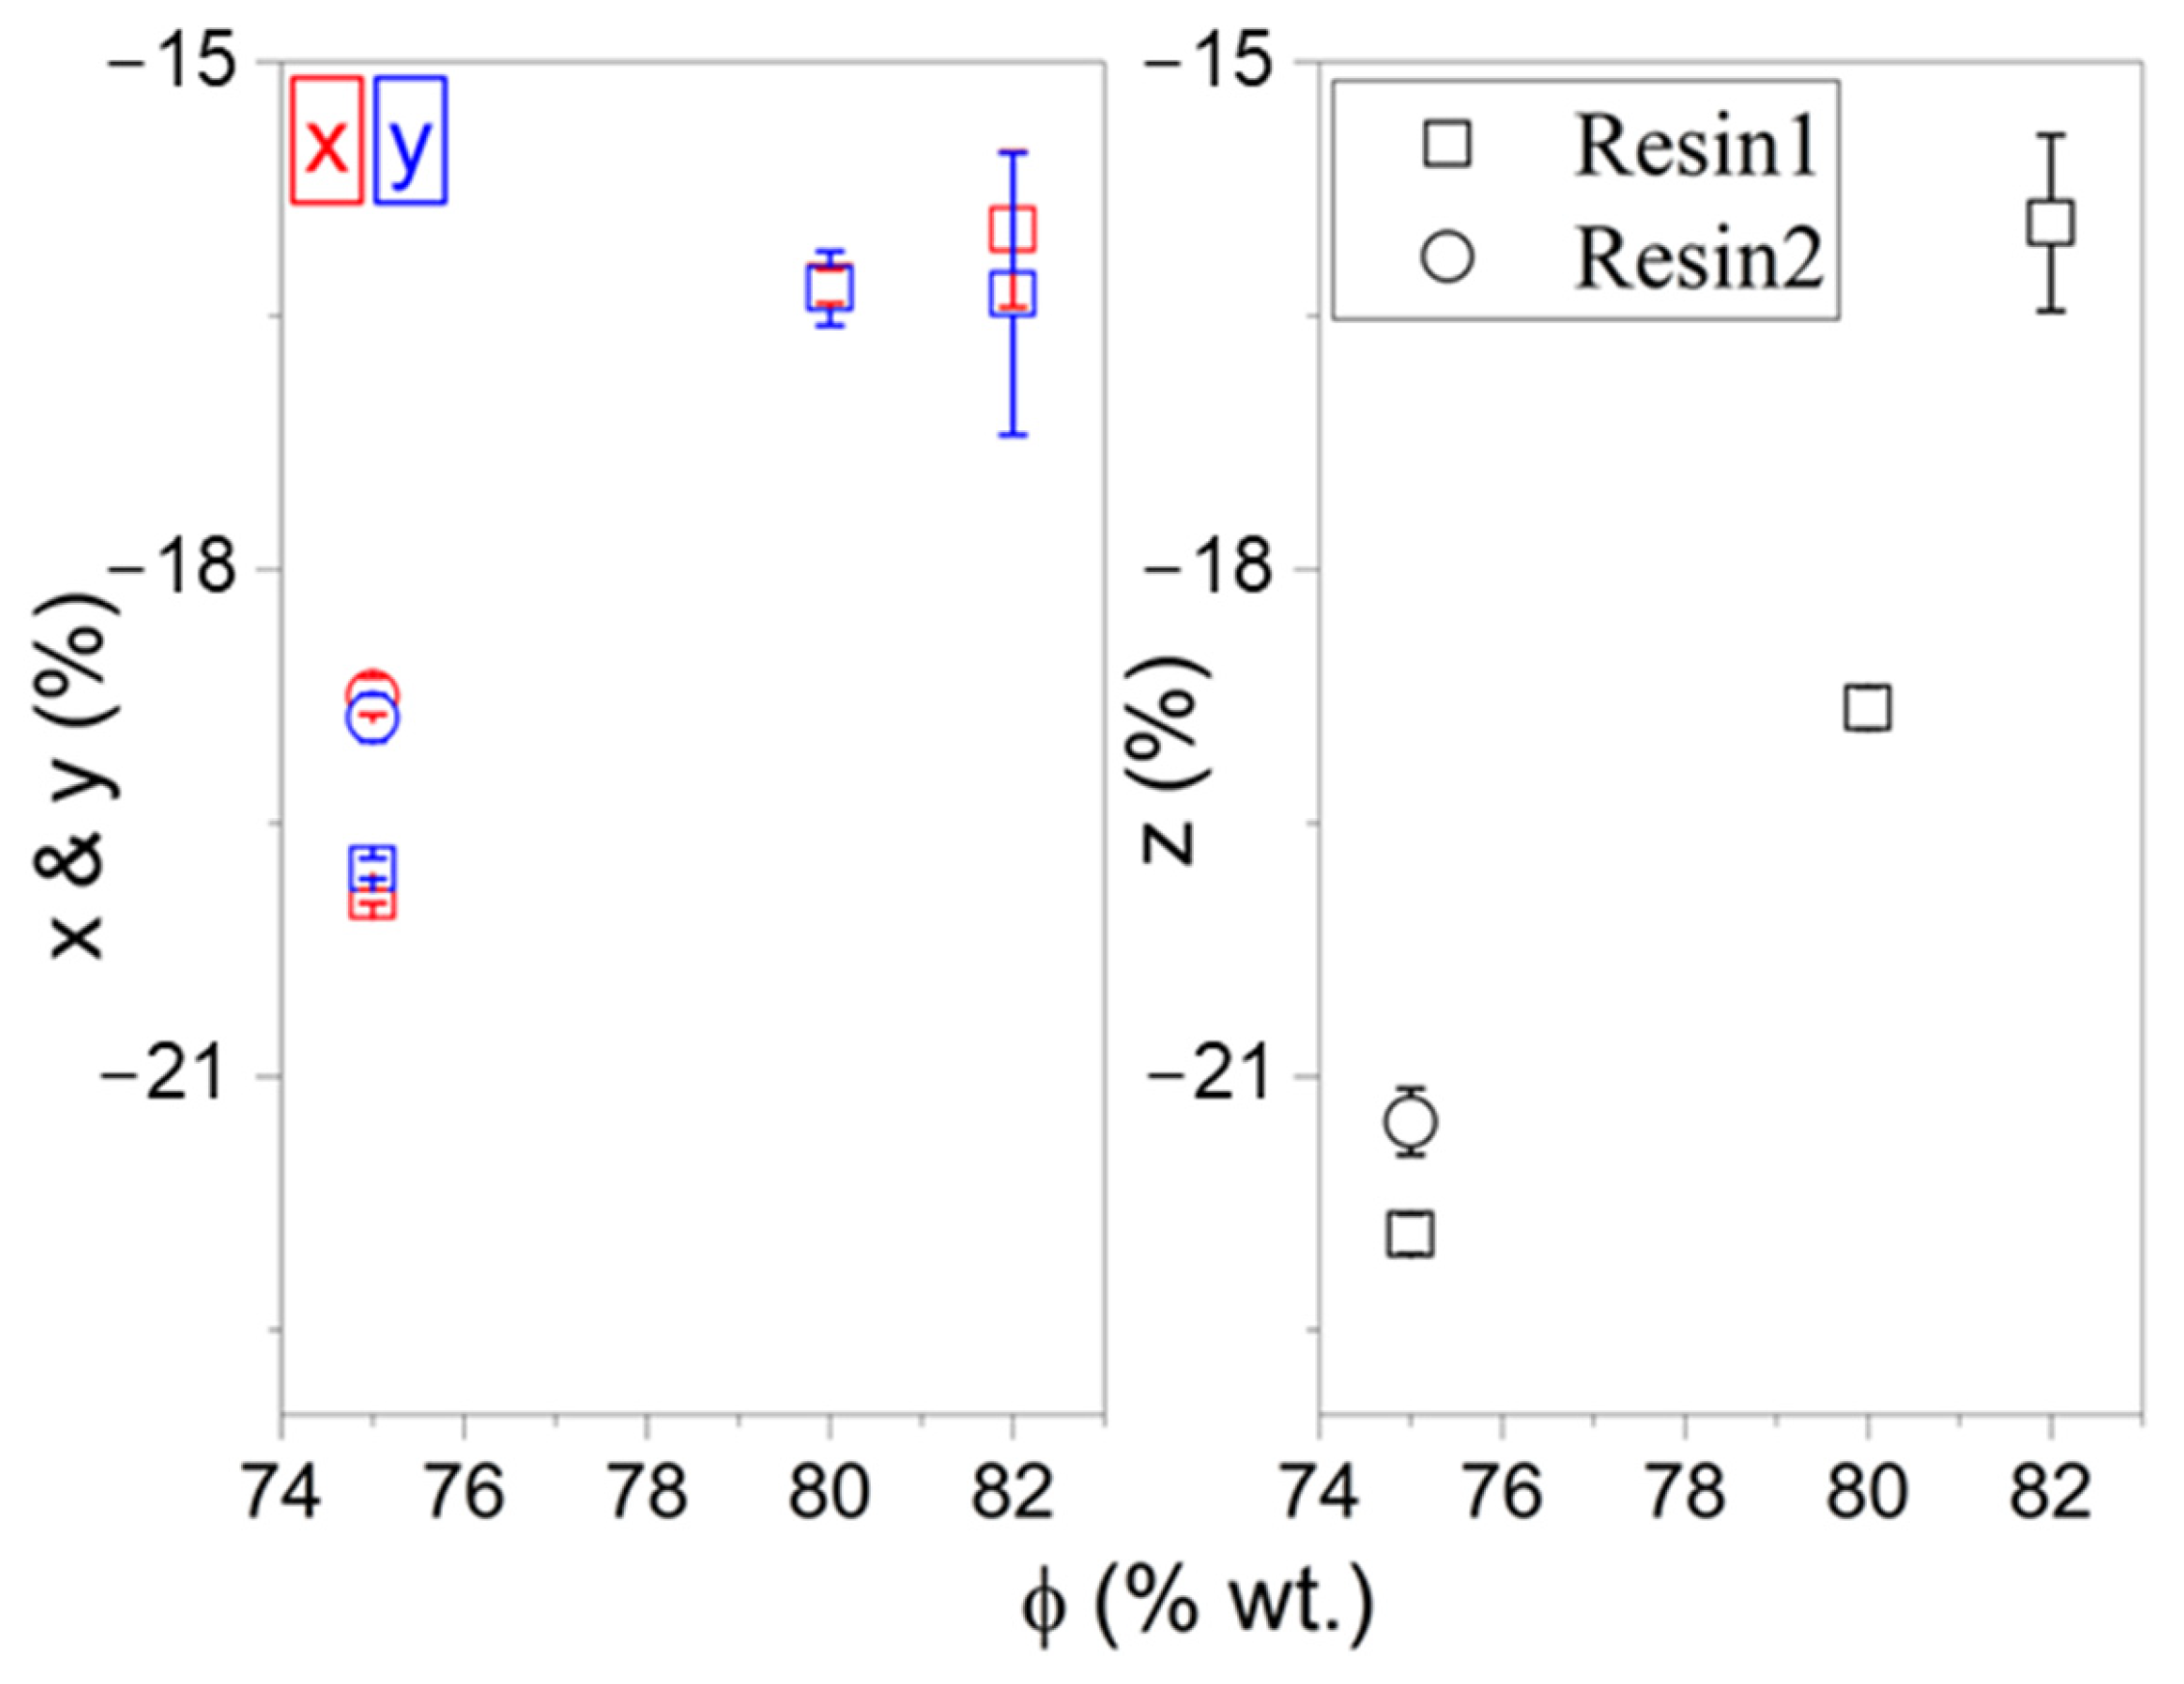
Figure 14 shows dimensional changes with respect to the as-printed dimensions of the samples. The results showed that the sintering shrinkage in lateral directions and building direction were reduced significantly with solid content. The lower shrinkage is caused by the reduction of interparticle spacing with increasing solid content. The separation between particles in any given volume is shorter as the concentration of particles increases. Hence, the structure is more compact. It should be noted that the vertical shrinkage was similar to lateral shrinkage at 82.0 %wt. of solid.
When the dimensional changes of samples were calculated with respect to CAD dimensions, we can still see the anisotropy. At 82.0 %wt. solid, the final degree of shrinkage was x = −13.9 ± 0.5%, y = −14.2 ± 0.9%, and z = −21.7 ± 0.49% for Resin1 sample. When the solid content of the same sample was reduced to 75.0 %wt., the values were x = −18.8 ± 0.04%, y = −18.7 ± 0.06%, and z = −27.8 ± 0.11%. The shrinkage calculation with respect to CAD dimensions took into account the lateral growth and vertical shrinkage that happened at the early stage of the process. It is clear that the accuracy post printing impacted the final part, which needed to be controlled by balancing the compositional and printing variables to control the degree of scattering and cure depth as seen above.
4. Conclusions
In this study, the role of compositional and printing variables on feature resolution and dimensional control was studied. The compositional variables were particle size and solid content using two different resins. The printing parameters were layer thickness and energy dose. The targeted cure depth to layer thickness ratios were consistent at 3× and 7×. The suspensions behaved as Newtonian-like suspensions and had a high degree of dispersion.
The feature resolution was shown to be affected by the degree of scattering. The scattering degree increased with energy dose. The interlayer adhesion improved with a high targeted cure depth, which required a high energy dose. However, it impacted the feature resolution negatively. In fine particle systems, the feature resolution was high when printed using a low energy dose and thinner layers while maintaining a high targeted cure depth to layer thickness ratio. However, in coarse particle systems, the required energy dose was lower to maintain a similar targeted cure depth to layer thickness ratio. This allowed for the reduction of scattering degree in lateral directions; thus, it produced high feature resolution parts.
The surface flaws depended on composition and printing conditions. These surface flaws were mainly delamination at or closer to the surface. The strong scattering degree resulted in a stair-wise pattern, which was more noticeable when thicker layers were used. Thinner layers and reducing the energy dose mitigated the stair-wise pattern.
The dimensional changes were shown to depend on printing and compositional variables. The lateral dimensions depended on the degree of scattering in a similar manner to the feature resolution. The strong scattering degree resulted in significant growth in lateral dimensions, which was associated with fine particle suspensions when exposed to a high energy dose. The coarse particles reduced the required energy dose for printing. Hence, it reduced the scattering degree, which resulted in more controlled lateral dimensions. This growth, however, was not substantial when the thinner layer was used, and there was not a large growth with solid content. The vertical dimension showed significant shrinkage compared to lateral dimensions in post printing. The microstructure of layers showed a nonuniformity in their thickness. The first few layers near the base were thinner than the rest of the layers across the samples depending on the thickness of the printer glass plate, explaining the anisotropic dimensional changes. The shrinkage in all directions during sintering was reduced and became more uniform with solid content.
Supplementary Materials
The following supporting information can be downloaded at: https://www.mdpi.com/article/10.3390/ceramics6040125/s1, Figure S1: The powders, AA3 and AA07, were used with this study’s suspensions. (a) Particle morphology, which is visualized by the use of a field emission scanning electron microscope (FESEM) (Zeiss, Oberkochen, German), and (b) particle size distribution, which is measured using a dynamic light scattering method using Mastersizer 3000 (Malvern Panalytical Ltd., Malvern, UK); Table S1: Acrylate based resins. The materials were a mixture of an oligomer as a backbone of the resins, and a monomer. The monomer is used to lower the viscosity of the oligomer. The cure depth was measured using an energy dose of 91.4 mJ/cm2. The test reflects five trials with a standard deviation error. The viscosity was measured at a shear rate of 1.0 s−1 and 25.0 °C. The refractive index was measured using Abbe Refractometer C10 (Vee Gee Scientific, LLC., Vernon Hills, IL, USA) at 589 nm; Figure S2: Viscosity of suspensions over time. The viscosity was measured at a shear rate of 1.0 s−1 at 25.0 °C using a parallel plate with a diameter of 25.0 mm, and the gap between them was 1.0 mm. The test reflects three trials with a standard deviation error; Table S2: Energy doses and targeted cure depth that used for printing. The energy dose for printing was referred to as high energy dose when it is > 20.0 mJ/cm2 and low energy dose when < 20.0 mJ/cm2; Figure S3: Thermal gravimetric analysis and thermal degradation and sintering profiles of Resin1 and Resin2. Prior debinding, the samples were submerged in warm deionized water for 24 hours, followed by drying for a minimum of 12 hours in air or a shorter duration using vacuum oven. However, this practice showed no impact on the samples; Figure S4: Scanning electron microscope images of as-printed samples. It is a low magnification to show the length of the cracks at the surface in few samples. Samples (Resin1 and AA07 powder) with solid content of (a) 75.0 %wt. and (b) 82.0 %wt., they were printed using 20.0 µm layer thickness and low energy dose. Samples (Resin2 and 75.0 %wt. AA07 powder) were printed using (c) 20.0 µm layer thickness and low energy dose, (d) 50.0 µm layer thickness and low energy dose, and (e) 50.0 µm layer thickness and high energy dose; Figure S5: Optical and scanning electron microscope images of the first few layers and the first interlayer between the base and first layer of samples composed of Resin2 and 75.0 %wt. solid. They were printed using 50.0 µm layer thickness with different energy doses. (a) A single layer with a base only and (b–d) full prints. (a) and (b) as-printed samples (AA07 powder) that were printed using high energy dose. (c) as-printed sample (AA07 powder) that was printed using low energy dose. (d) as-debound sample (AA3 powder) that was printed using high energy dose; Figure S6: Scanning electron microscope images of as-debound samples. Samples (Resin1 and AA07 powder) with solid content of (a) 75.0 %wt. and (b) 82.0 %wt., they were printed using 20.0 µm layer thickness and low energy dose. Samples (Resin2 and 75.0 %wt. AA07 powder) were printed using (c) 20.0 µm layer thickness and low energy dose, (d) 50.0 µm layer thickness and low energy dose, and (e) 50.0 µm layer thickness and high energy dose; Figure S7: Scanning electron microscope images of as-printed samples using printer with thin glass plate vs thick glass plate. The 75.0 %wt. FA-R2 samples printed using 20 µm layer thickness; Table S3: dimensional changes of samples using thin glass plate vs thick glass plate printers. The 75.0 %wt. FA-R2 samples printed using 20 µm layer thickness; Figure S8: The changes in layer thickness across the prints of samples using thin glass plate vs thick glass plate printers. The 75.0 %wt. FA-R2 samples printed using 20 µm layer thickness.
Author Contributions
Conceptualization, M.K.A.; methodology, M.K.A.; validation, M.K.A.; formal analysis, M.K.A.; investigation, M.K.A. and V.R.T.; writing—original draft preparation, M.K.A.; writing—review and editing, M.K.A., C.H., V.R.T. and R.A.H.; visualization, M.K.A.; supervision, R.A.H.; project administration, R.A.H.; funding acquisition, R.A.H. All authors have read and agreed to the published version of the manuscript.
Funding
This research and APC were funded by the National Science Foundation I/UCRC grant number [1540027].
Institutional Review Board Statement
Not applicable.
Informed Consent Statement
Not applicable.
Data Availability Statement
The data presented in this research are available within the article and Supplementary Materials.
Acknowledgments
The views and conclusions contained in this document are those of the authors and should not be interpreted as representing the official policies, either expressed or implied, of the National Science Foundation or the US Government. The US Government is authorized to reproduce and distribute reprints for Government purposes notwithstanding any copyright notation herein. The authors would like to thank Eliza Wirkijowski, Kaavya Krishna- Kumar, and Berra Beyoglu (Rutgers University) for their help and Eoin McAleer (Rutgers University) for input and discussions.
Conflicts of Interest
The authors have no conflict of interest to declare.
References
- Osman, R.B.; van der Veen, A.J.; Huiberts, D.; Wismeijer, D.; Alharbi, N. 3D-printing zirconia implants; a dream or a reality? An in-vitro study evaluating the dimensional accuracy, surface topography and mechanical properties of printed zirconia implant and discs. J. Mech. Behav. Biomed. Mater. 2017, 75, 521–528. [Google Scholar] [CrossRef]
- Tahayeri, A.; Morgan, M.; Fugolin, A.P.; Bompolaki, D.; Athirasala, A.; Pfeifer, C.S.; Ferracane, J.L.; Bertassoni, L.E. 3D printed versus conventionally cured provisional crown and bridge dental materials. Dent. Mater. 2018, 34, 192–200. [Google Scholar] [CrossRef]
- Bae, C.J.; Halloran, J.W. Integrally cored ceramic mold fabricated by ceramic stereolithography. Int. J. Appl. Ceram. Technol. 2011, 8, 1255–1262. [Google Scholar] [CrossRef]
- Conti, L.; Bienenstein, D.; Borlaf, M.; Graule, T. Effects of the Layer Height and Exposure Energy on the Lateral Resolution of Zirconia Parts Printed by Lithography-Based Additive Manufacturing. Materials 2020, 13, 1317. [Google Scholar] [CrossRef]
- Dehurtevent, M.; Robberecht, L.; Hornez, J.-C.; Thuault, A.; Deveaux, E.; Béhin, P. Stereolithography: A new method for processing dental ceramics by additive computer-aided manufacturing. Dent. Mater. 2017, 33, 477–485. [Google Scholar] [CrossRef]
- Borlaf, M.; Serra-Capdevila, A.; Colominas, C.; Graule, T. Development of UV-curable ZrO2 slurries for additive manufacturing (LCM-DLP) technology. J. Eur. Ceram. Soc. 2019, 39, 3797–3803. [Google Scholar] [CrossRef]
- Griffith, M.L.; Halloran, J.W. Ultraviolet curing of highly loaded ceramic suspensions for stereolithography of ceramics. In Proceedings of the 1994 International Solid Freeform Fabrication Symposium, Austin, TX, USA, 8–10 August 1994; pp. 396–403. [Google Scholar]
- Johansson, E.; Lidström, O.; Johansson, J.; Lyckfeldt, O.; Adolfsson, E. Influence of resin composition on the defect formation in alumina manufactured by stereolithography. Materials 2017, 10, 138. [Google Scholar] [CrossRef]
- Griffith, M.L.; Halloran, J.W. Freeform fabrication of ceramics via stereolithography. J. Am. Ceram. Soc. 1996, 79, 2601–2608. [Google Scholar] [CrossRef]
- Halloran, J.W.; Griffith, M.; Chu, T.-M. Stereolithography Resin for Rapid Prototyping of Ceramics and Metals. US Patent 6117612A, 12 September 2000. [Google Scholar]
- Zhang, K.; Xie, C.; Wang, G.; He, R.; Ding, G.; Wang, M.; Dai, D.; Fang, D. High solid loading, low viscosity photosensitive Al2O3 slurry for stereolithography based additive manufacturing. Ceram. Int. 2019, 45, 203–208. [Google Scholar] [CrossRef]
- Hinczewski, C.; Corbel, S.; Chartier, T. Stereolithography for the fabrication of ceramic three-dimensional parts. Rapid Prototyp. J. 1998, 4, 104–111. [Google Scholar] [CrossRef]
- Gentry, S.P.; Halloran, J.W. Depth and width of cured lines in photopolymerizable ceramic suspensions. J. Eur. Ceram. Soc. 2013, 33, 1981–1988. [Google Scholar] [CrossRef]
- Gentry, S.P.; Halloran, J.W. Light scattering in absorbing ceramic suspensions: Effect on the width and depth of photopolymerized features. J. Eur. Ceram. Soc. 2015, 35, 1895–1904. [Google Scholar] [CrossRef]
- Hinczewski, C.; Corbel, S.; Chartier, T. Ceramic suspensions suitable for stereolithography. J. Eur. Ceram. Soc. 1998, 18, 583–590. [Google Scholar] [CrossRef]
- Chartier, T.; Hinczewski, C.; Corbel, S. UV curable systems for tape casting. J. Eur. Ceram. Soc. 1999, 19, 67–74. [Google Scholar] [CrossRef]
- Griffith, M.L.; Halloran, J.W. Scattering of ultraviolet radiation in turbid suspensions. J. Appl. Phys. 1997, 81, 2538–2546. [Google Scholar] [CrossRef]
- Tomeckova, V.; Halloran, J.W. Critical energy for photopolymerization of ceramic suspensions in acrylate monomers. J. Eur. Ceram. Soc. 2010, 30, 3273–3282. [Google Scholar] [CrossRef]
- Mitteramskogler, G.; Gmeiner, R.; Felzmann, R.; Gruber, S.; Hofstetter, C.; Stampfl, J.; Ebert, J.; Wachter, W.; Laubersheimer, J. Light curing strategies for lithography-based additive manufacturing of customized ceramics. Addit. Manuf. 2014, 1–4, 110–118. [Google Scholar] [CrossRef]
- Tomeckova, V.; Halloran, J.W. Predictive models for the photopolymerization of ceramic suspensions. J. Eur. Ceram. Soc. 2010, 30, 2833–2840. [Google Scholar] [CrossRef]
- Tomeckova, V.; Halloran, J.W. Cure depth for photopolymerization of ceramic suspensions. J. Eur. Ceram. Soc. 2010, 30, 3023–3033. [Google Scholar] [CrossRef]
- Li, K.; Zhao, Z. The effect of the surfactants on the formulation of UV-curable SLA alumina suspension. Ceram. Int. 2017, 43, 4761–4767. [Google Scholar] [CrossRef]
- Adake, C.V.; Bhargava, P.; Gandhi, P. Effect of surfactant on dispersion of alumina in photopolymerizable monomers and their UV curing behavior for microstereolithography. Ceram. Int. 2015, 41, 5301–5308. [Google Scholar] [CrossRef]
- Wang, W.; Feng, M.; Wang, Z.; Jiang, Y.; Xing, B.; Zhao, Z. Precision control in vat photopolymerization based on pure copper paste: Process parameters and optimization strategies. Materials 2023, 16, 5565. [Google Scholar] [CrossRef] [PubMed]
- Arora, P.; Mostafa, K.G.; Russell, E.; Dehgahi, S.; Butt, S.U.; Talamona, D.; Qureshi, A.J. Shrinkage compensation and effect of building orientation on mechanical properties of ceramic stereolithography parts. Polymers 2023, 15, 3877. [Google Scholar] [CrossRef] [PubMed]
- Zhang, S.; Sutejo, I.A.; Kim, J.; Choi, Y.-J.; Gal, C.W.; Yun, H.-s. Fabrication of complex three-dimensional structures of mica through digital light processing-based additive manufacturing. Ceramics 2022, 5, 562–574. [Google Scholar] [CrossRef]
- Lin, C.; Xu, W.; Liu, B.; Wang, H.; Xing, H.; Sun, Q.; Xu, J. Three-dimensional printing of large objects with high resolution by dynamic projection scanning lithography. Micromachines 2023, 14, 1700. [Google Scholar] [CrossRef]
- Alazzawi, M.K.; Beyoglu, B.; Haber, R.A. A study in a tape casting based stereolithography apparatus: Role of layer thickness and casting shear rate. J. Manuf. Process. 2021, 64, 1196–1203. [Google Scholar] [CrossRef]
- Polyanskiy, M.N. Refractive Index Database. Available online: https://refractiveindex.info (accessed on 17 August 2020).
- Alazzawi, M.K. Stereolithography of Alumina Systems: Cure Depth and Dimensional Control; Rutgers University-School of Graduate Studies: New Brunswick, NJ, USA, 2021. [Google Scholar]
- Alazzawi, M.K.; Beyoglu, B.; Maniaci, F.F.; Haber, R.A. Degree of dispersion assessments of highly filled stereolithography suspension using fineness of grind measurement. Powder Technol. 2021, 382, 318–330. [Google Scholar] [CrossRef]
- Xing, H.; Zou, B.; Liu, X.; Wang, X.; Chen, Q.; Fu, X.; Li, Y. Effect of particle size distribution on the preparation of ZTA ceramic paste applying for stereolithography 3D printing. Powder Technol. 2020, 359, 314–322. [Google Scholar] [CrossRef]
- Song, S.Y.; Park, M.S.; Lee, J.W.; Yun, J.S. A study on the rheological and mechanical properties of photo-curable ceramic/polymer composites with different silane coupling agents for SLA 3D printing technology. Nanomaterials 2018, 8, 93. [Google Scholar] [CrossRef]
- Schwentenwein, M.; Homa, J. Additive manufacturing of dense alumina ceramics. Int. J. Appl. Ceram. Technol. 2015, 12, 1–7. [Google Scholar] [CrossRef]
- Chartier, T.; Badev, A.; Abouliatim, Y.; Lebaudy, P.; Lecamp, L. Stereolithography process: Influence of the rheology of silica suspensions and of the medium on polymerization kinetics–cured depth and width. J. Eur. Ceram. Soc. 2012, 32, 1625–1634. [Google Scholar] [CrossRef]
- Li, X.; Zhong, H.; Zhang, J.; Duan, Y.; Bai, H.; Li, J.; Jiang, D. Dispersion and properties of zirconia suspensions for stereolithography. Int. J. Appl. Ceram. Technol. 2020, 17, 239–247. [Google Scholar] [CrossRef]
- Gonzalez, P.; Schwarzer, E.; Scheithauer, U.; Kooijmans, N.; Moritz, T. Additive manufacturing of functionally graded ceramic materials by stereolithography. J. Vis. Exp. 2019, 143, e57943. [Google Scholar]
- Tomeckova, V.; Halloran, J. Flow behavior of polymerizable ceramic suspensions as function of ceramic volume fraction and temperature. J. Eur. Ceram. Soc. 2011, 31, 2535–2542. [Google Scholar] [CrossRef]
- Alazzawi, M.K.; Kondapalli, S.S.; Haber, R.A. Degree of dispersion and cure depth of photocurable ceramic and metal suspensions. J. Mater. Res. 2021, 36, 4275–4286. [Google Scholar] [CrossRef]
Figure 1.
Schematic of the tape casting-based printer, Admaflex 130. The printer uses a digital light processing system for curing and a doctor blade for spreading the materials. The z coordinate is the building direction, and the x and y coordinates are the casting substrate.
Figure 1.
Schematic of the tape casting-based printer, Admaflex 130. The printer uses a digital light processing system for curing and a doctor blade for spreading the materials. The z coordinate is the building direction, and the x and y coordinates are the casting substrate.

Figure 2.
(a) The viscosity and (b) shear stress of suspensions measured within a shear rate of (0.1–300.0) s−1 at 25.0 °C.
Figure 2.
(a) The viscosity and (b) shear stress of suspensions measured within a shear rate of (0.1–300.0) s−1 at 25.0 °C.
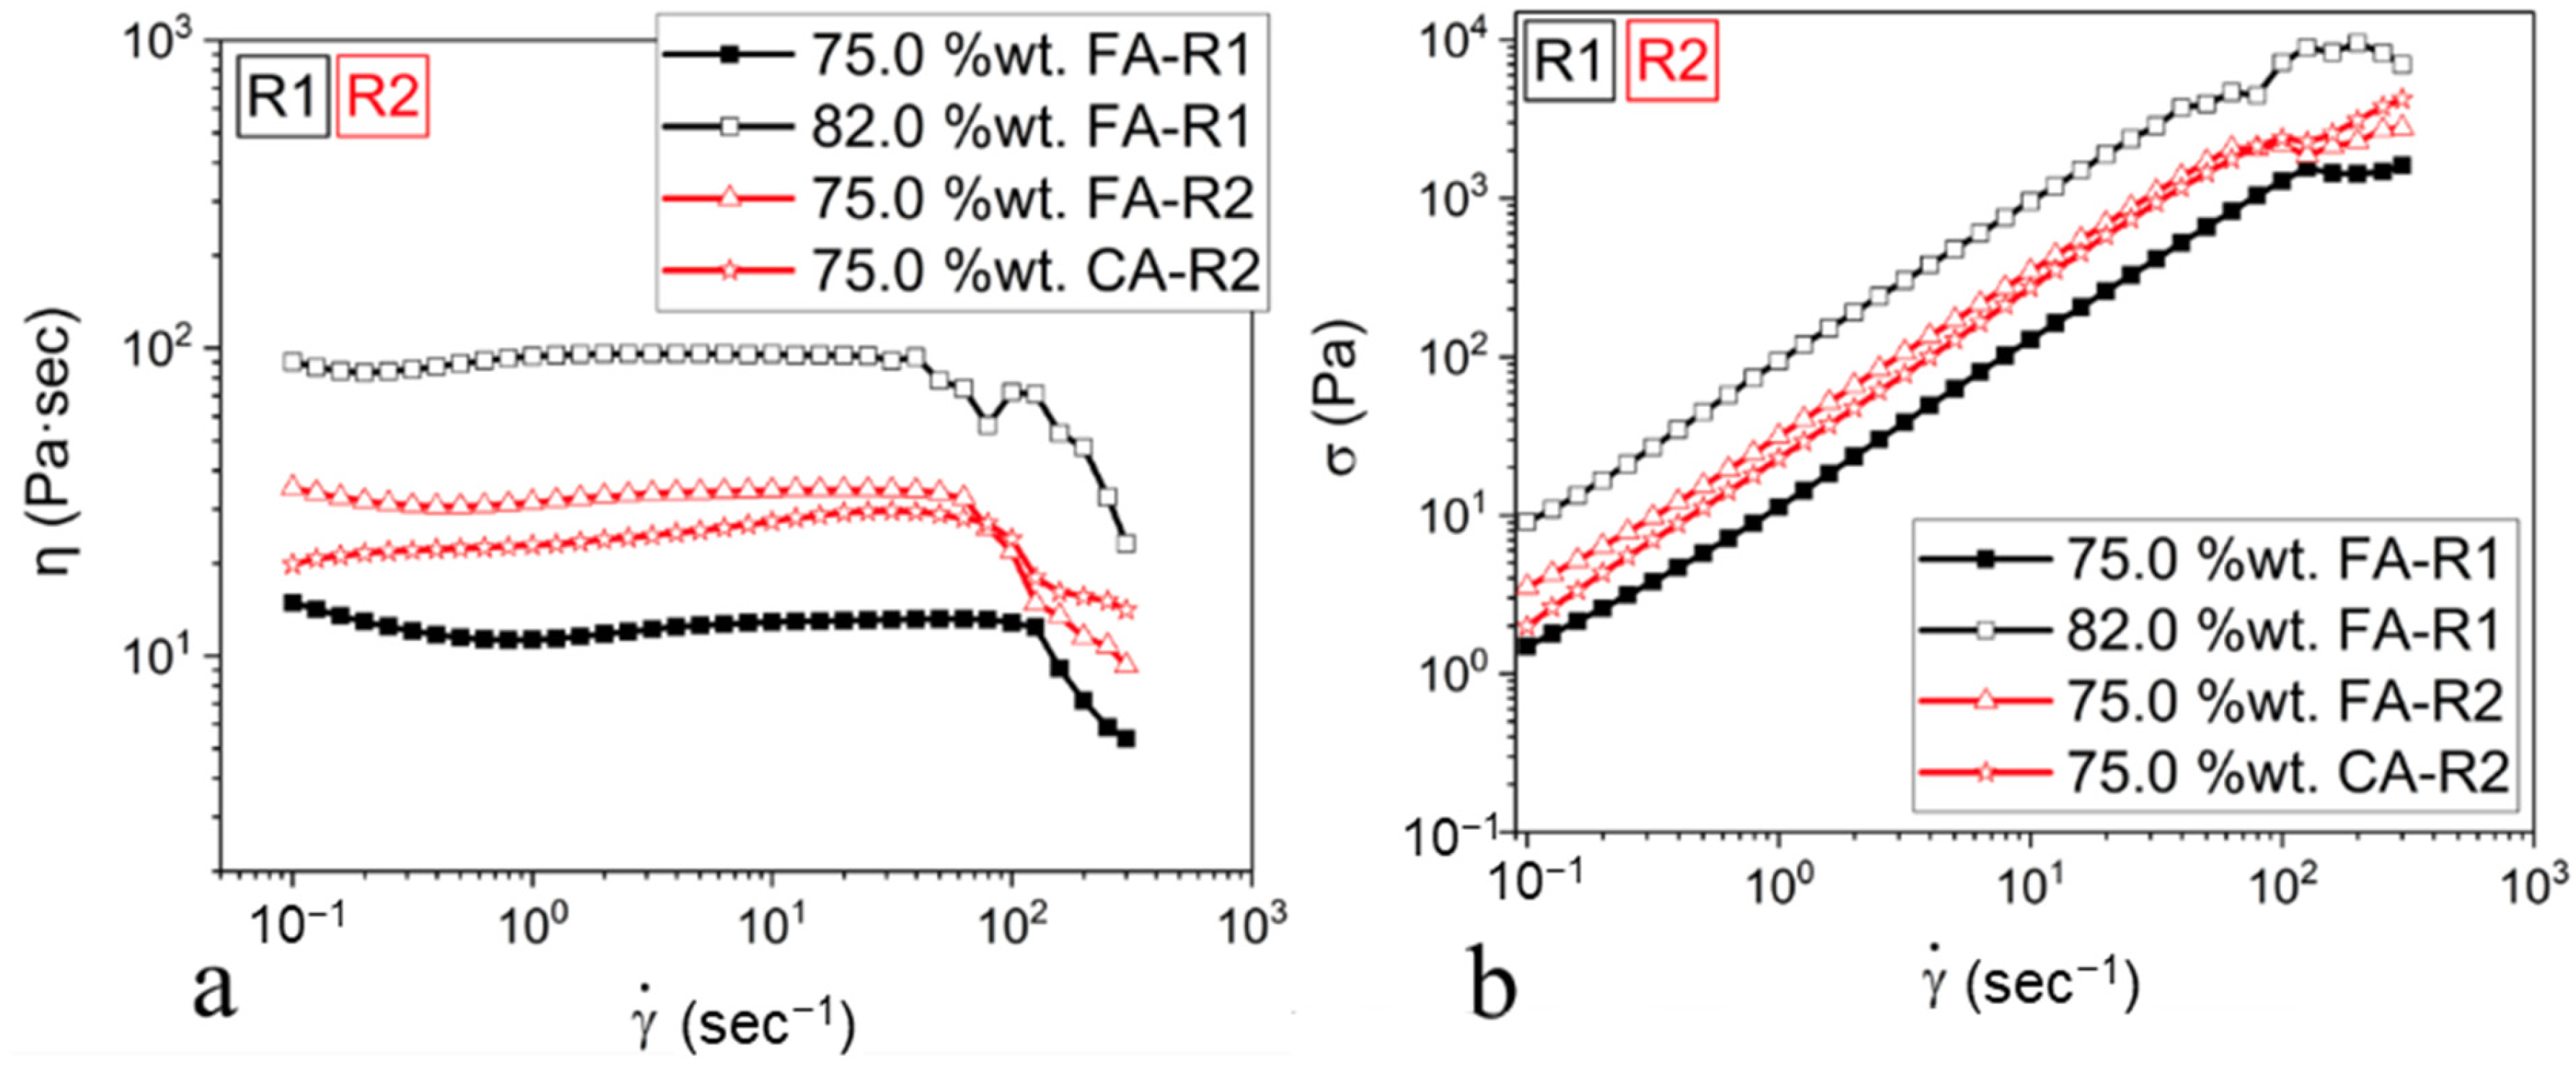
Figure 3.
Analyzed images of the automated FOG gauge surface of the suspensions. (a) Suspensions composed of Resin1 and AA07 powder with different solid contents. (b) Suspension composed of Resin2 and AA07 powder. (c) Suspension composed of Resin2 and AA3 powder. The solid content is indicated underneath the images. AA07 powder was finer than AA3 powder.
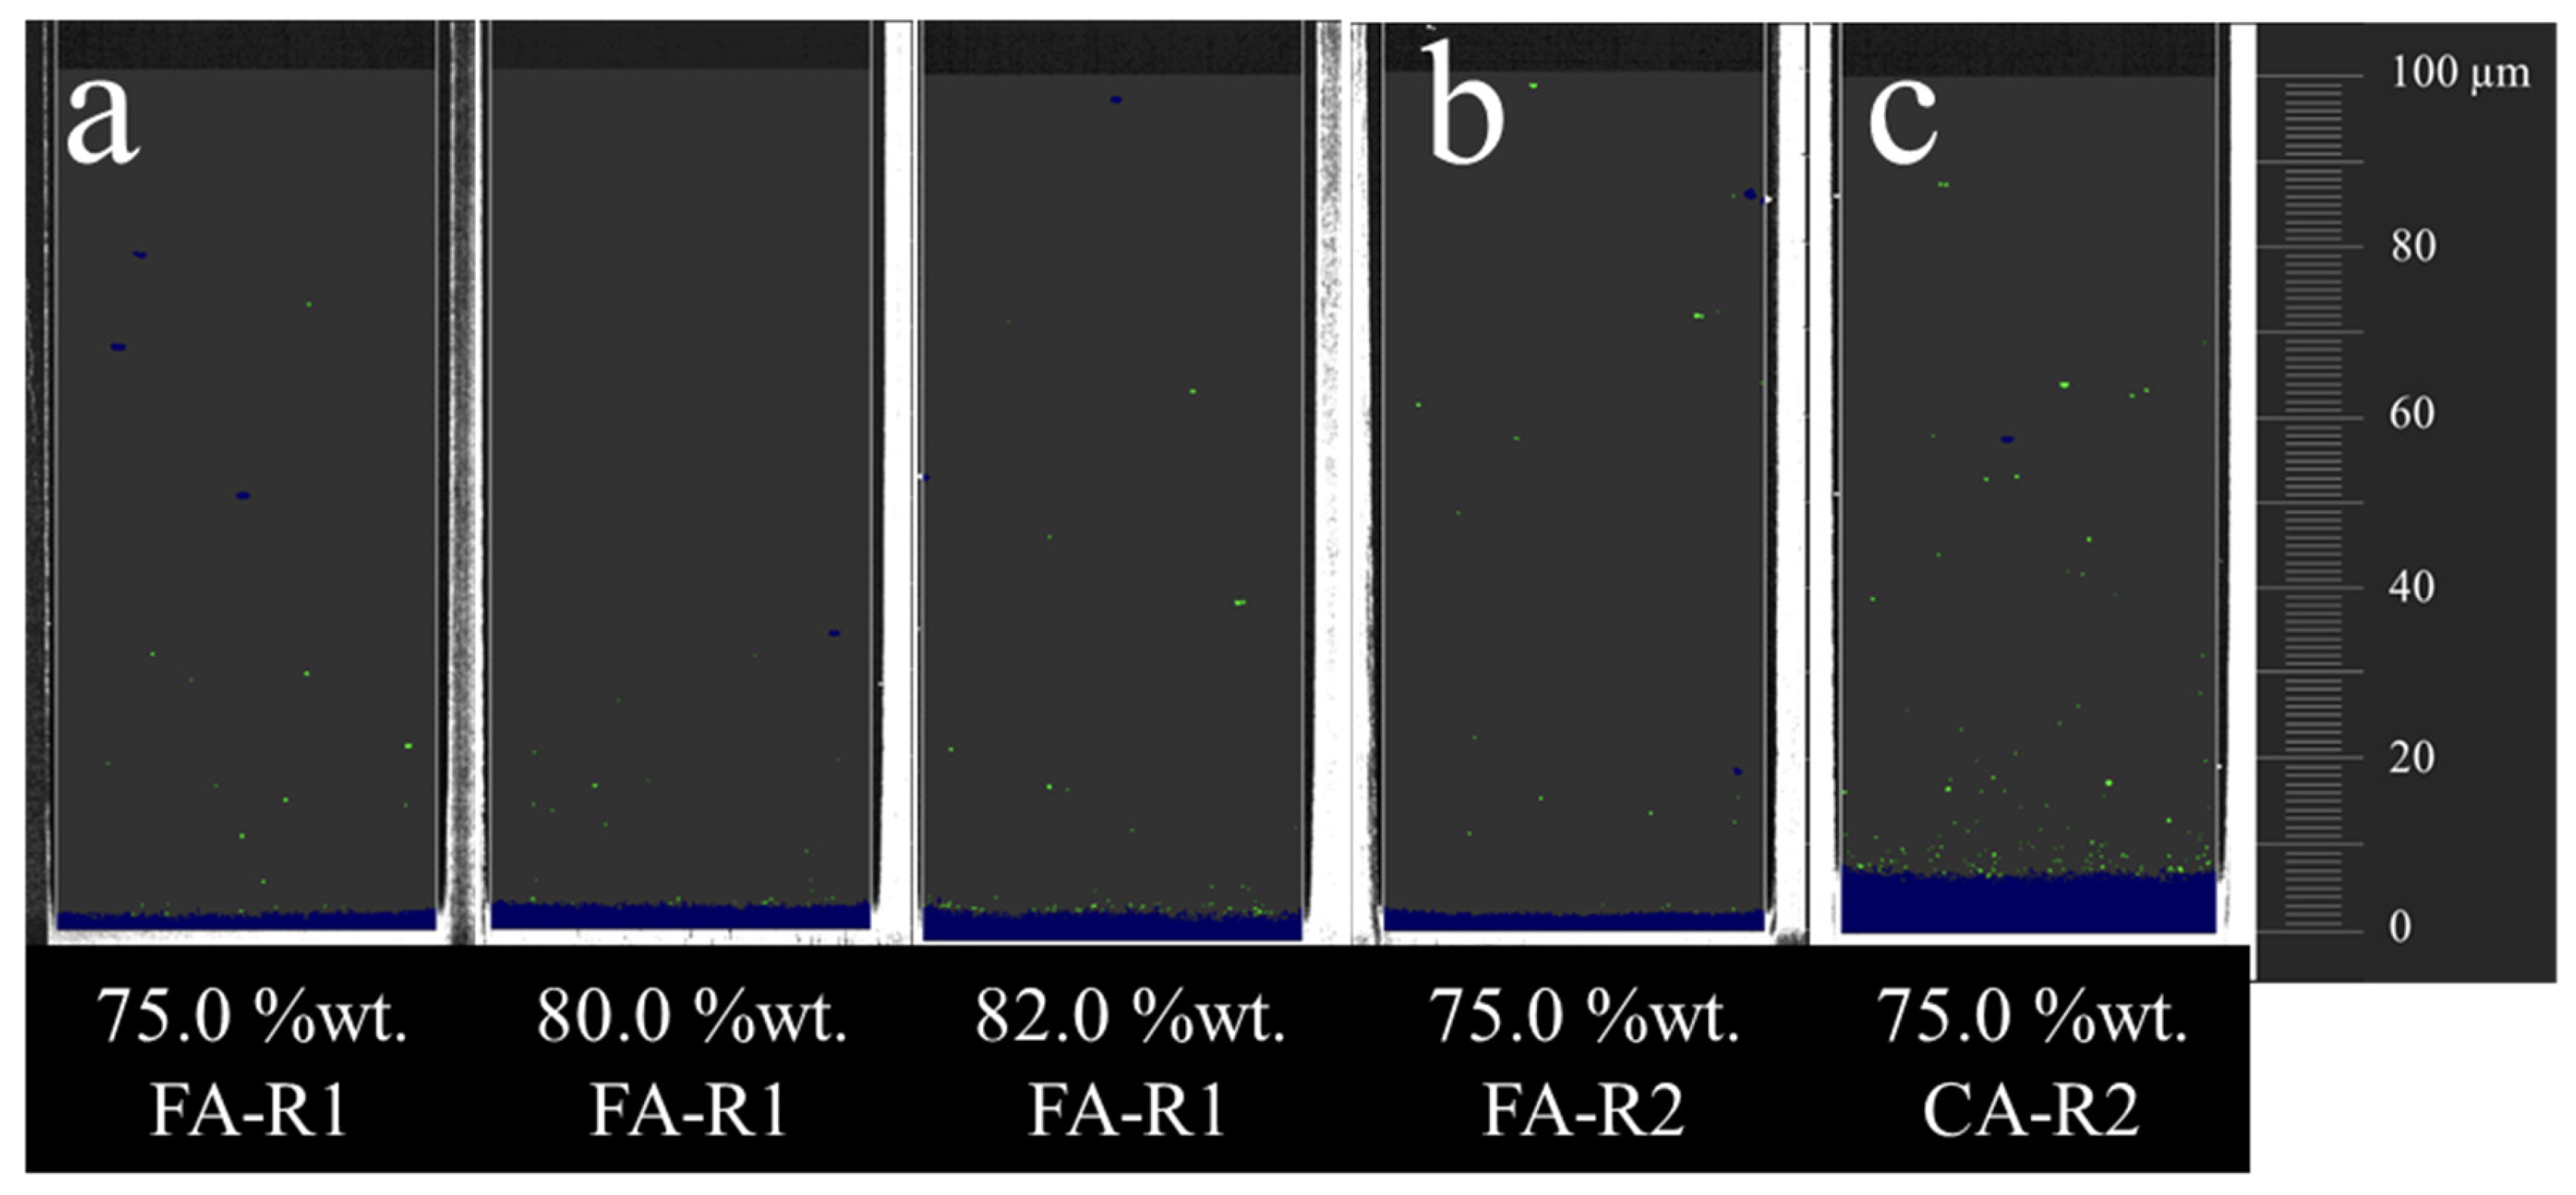
Figure 4.
Cure depth (Cd) as a function of energy dose. (a) Three suspensions with a solid content of 75.0 %wt.; one suspension consisted of Resin1 with fine powder, and two others consisted of Resin2 with fine and coarse powders. (b) The suspensions consisted of Resin1 with fine powder, and the solid content varied (75.0–82.0 %wt).

Figure 5.
Cure width changes in lateral dimensions (x and y) as a function of energy dose. (a) Three suspensions with a solid content of 75.0 %wt.; one suspension consisted of Resin1 with fine powder, and two others consisted of Resin2 with fine and coarse powders. (b) The suspensions consisted of Resin1 with fine powder, and the solid content varied (75.0–82.0 %wt).
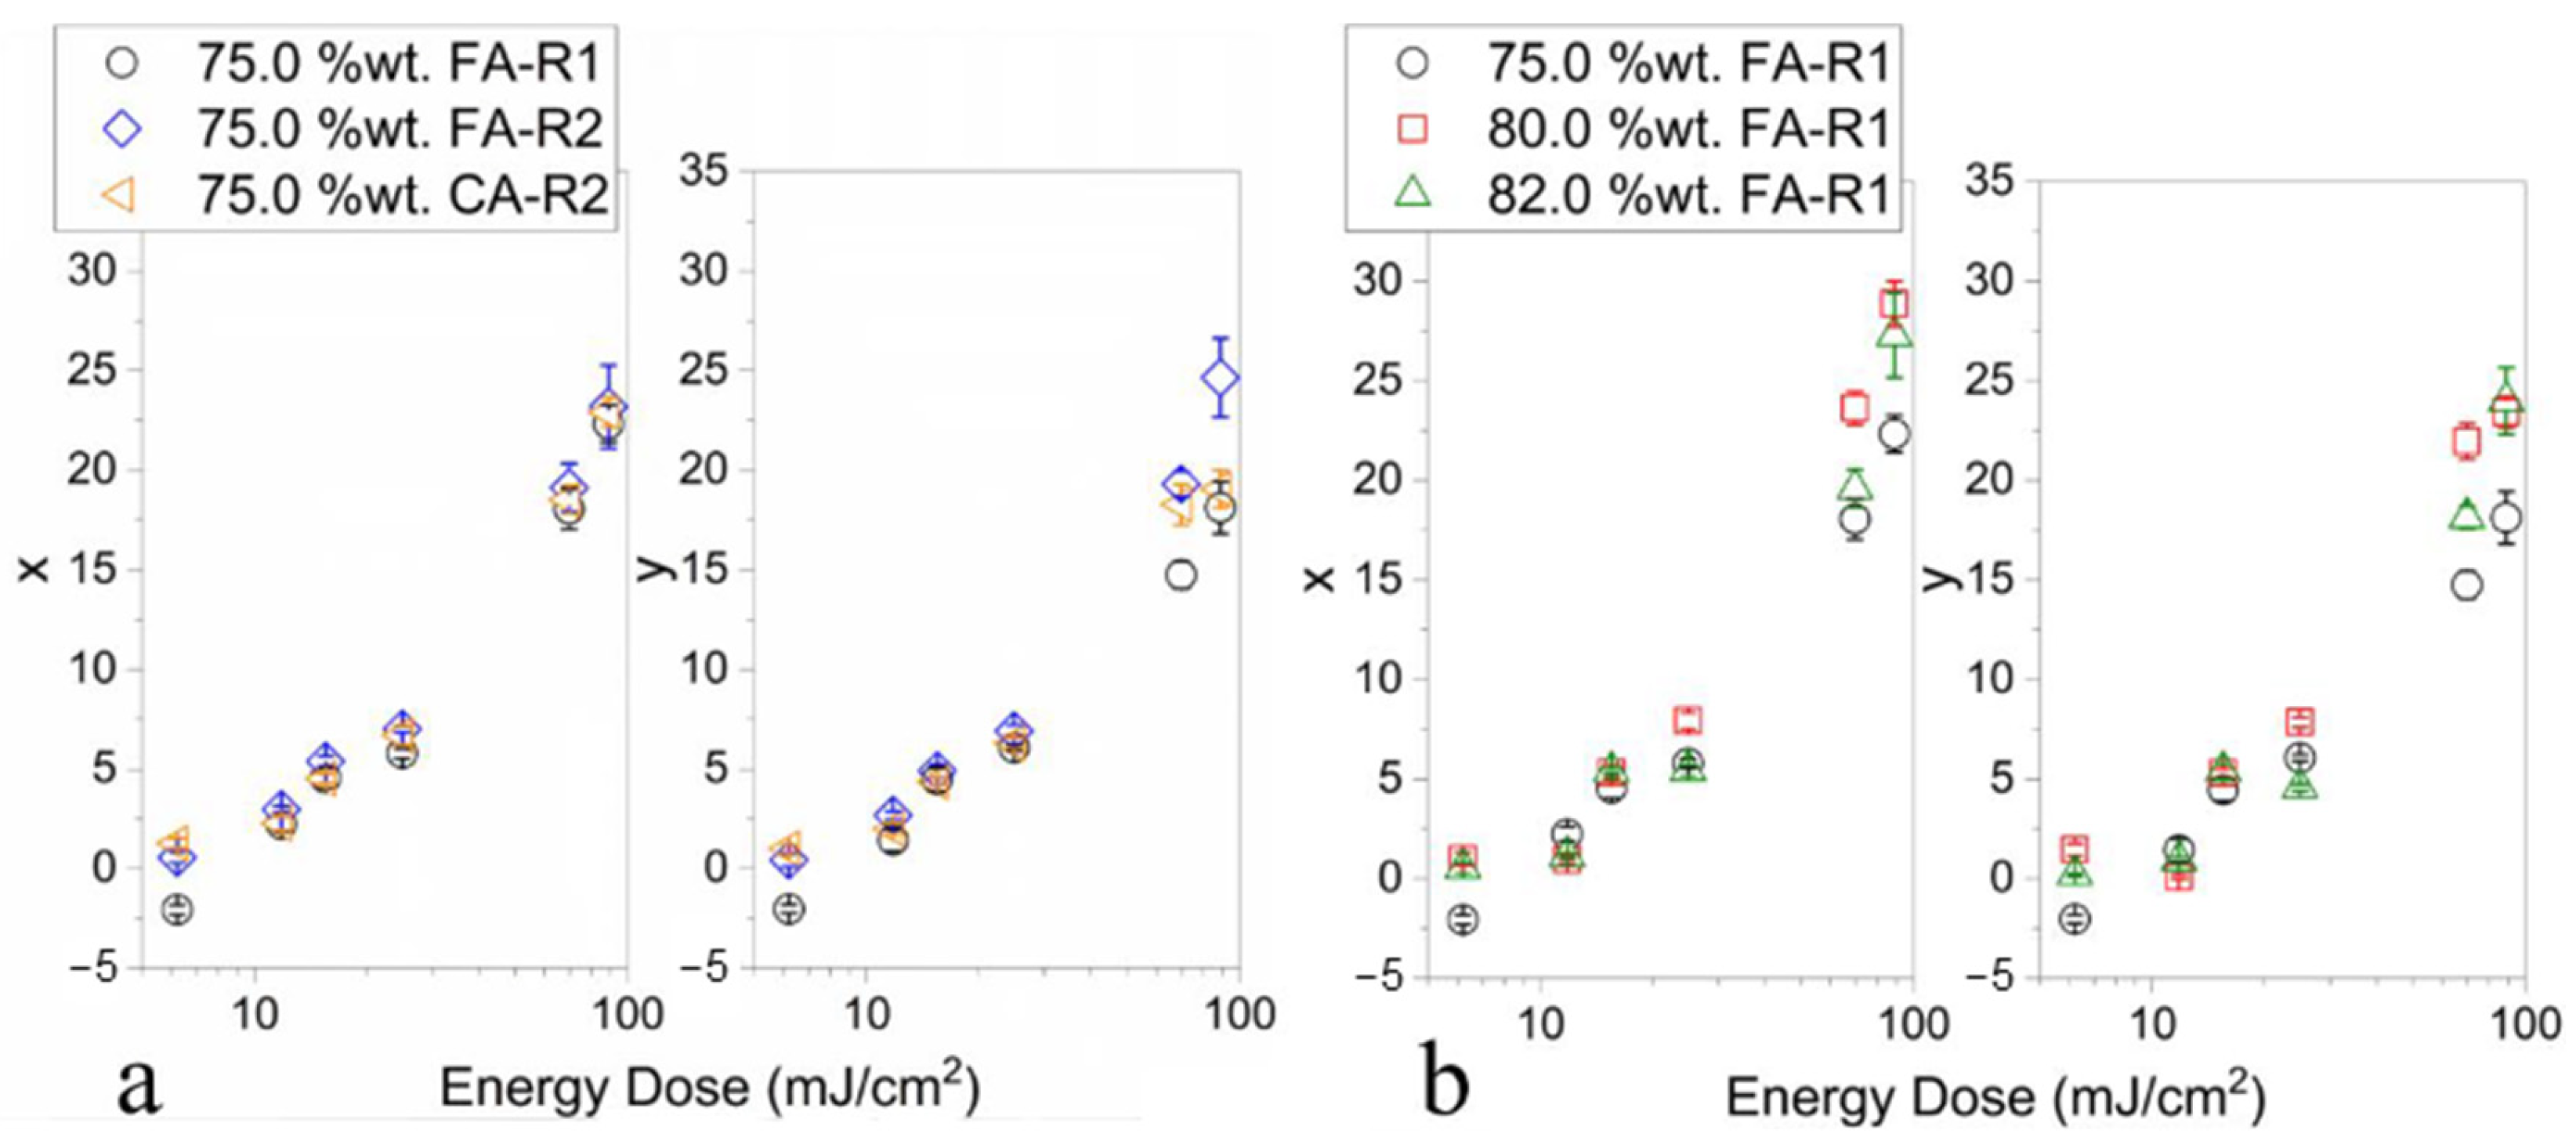
Figure 6.
Optical microscope images of as-printed ceramics perpendicular to the printing direction (z axis). The effects of layer thickness and energy dose on feature resolution and flaws are shown using samples with two different particle sizes. They contained a solid content of 75.0 %wt. The samples with fine alumina, AA07, were printed under the conditions of (a) low energy dose and 50.0 µm layer thickness, (b) high energy dose and 50.0 µm layer thickness, and (c) low energy dose and 20.0 µm layer thickness. The samples with coarse alumina, AA3, were printed under the conditions of (d) low energy dose and 50.0 µm layer thickness, (e) high energy dose and 50.0 µm layer thickness, and (f) low energy dose and 20.0 µm layer thickness.
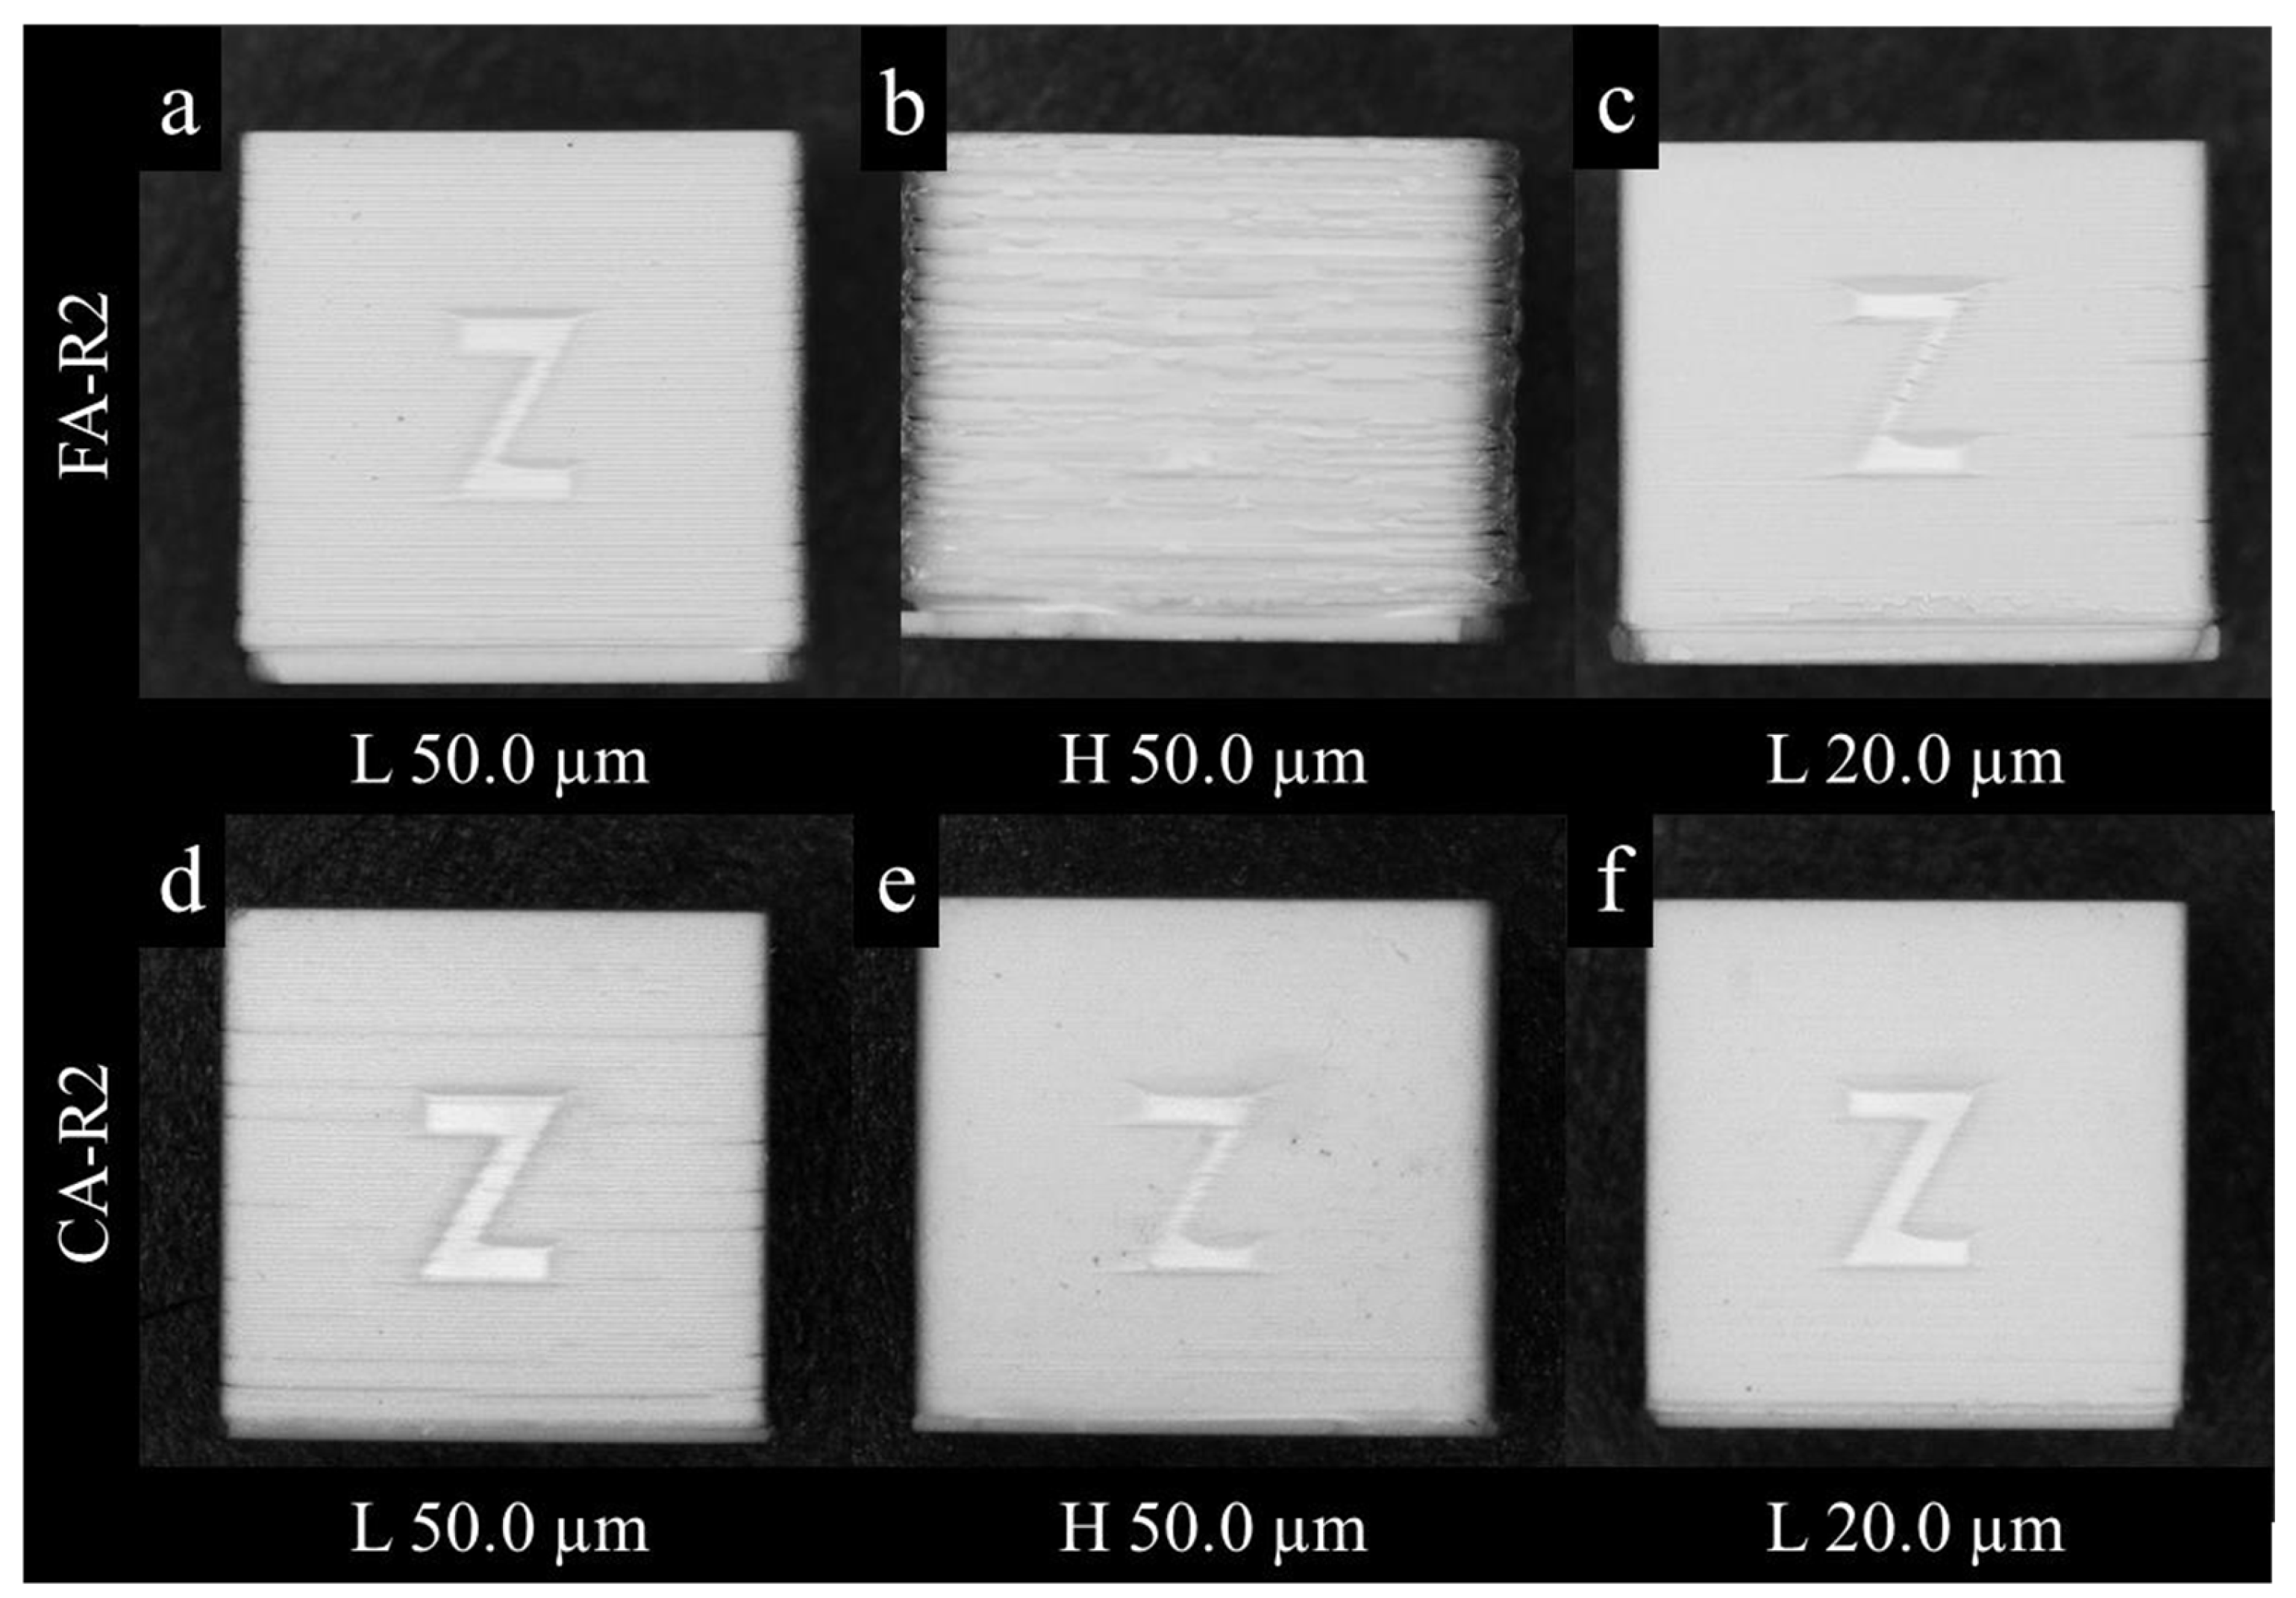
Figure 7.
Optical microscope images of as-printed ceramics perpendicular to the printing direction (z axis). The effects of the solid content on feature resolution and flaws are shown using samples composed of AA07 and Resin1. The solid content was (a) 75.0 %wt. and (b) 82.0 %wt. They were printed using a low energy dose and 20.0 µm layer thickness.
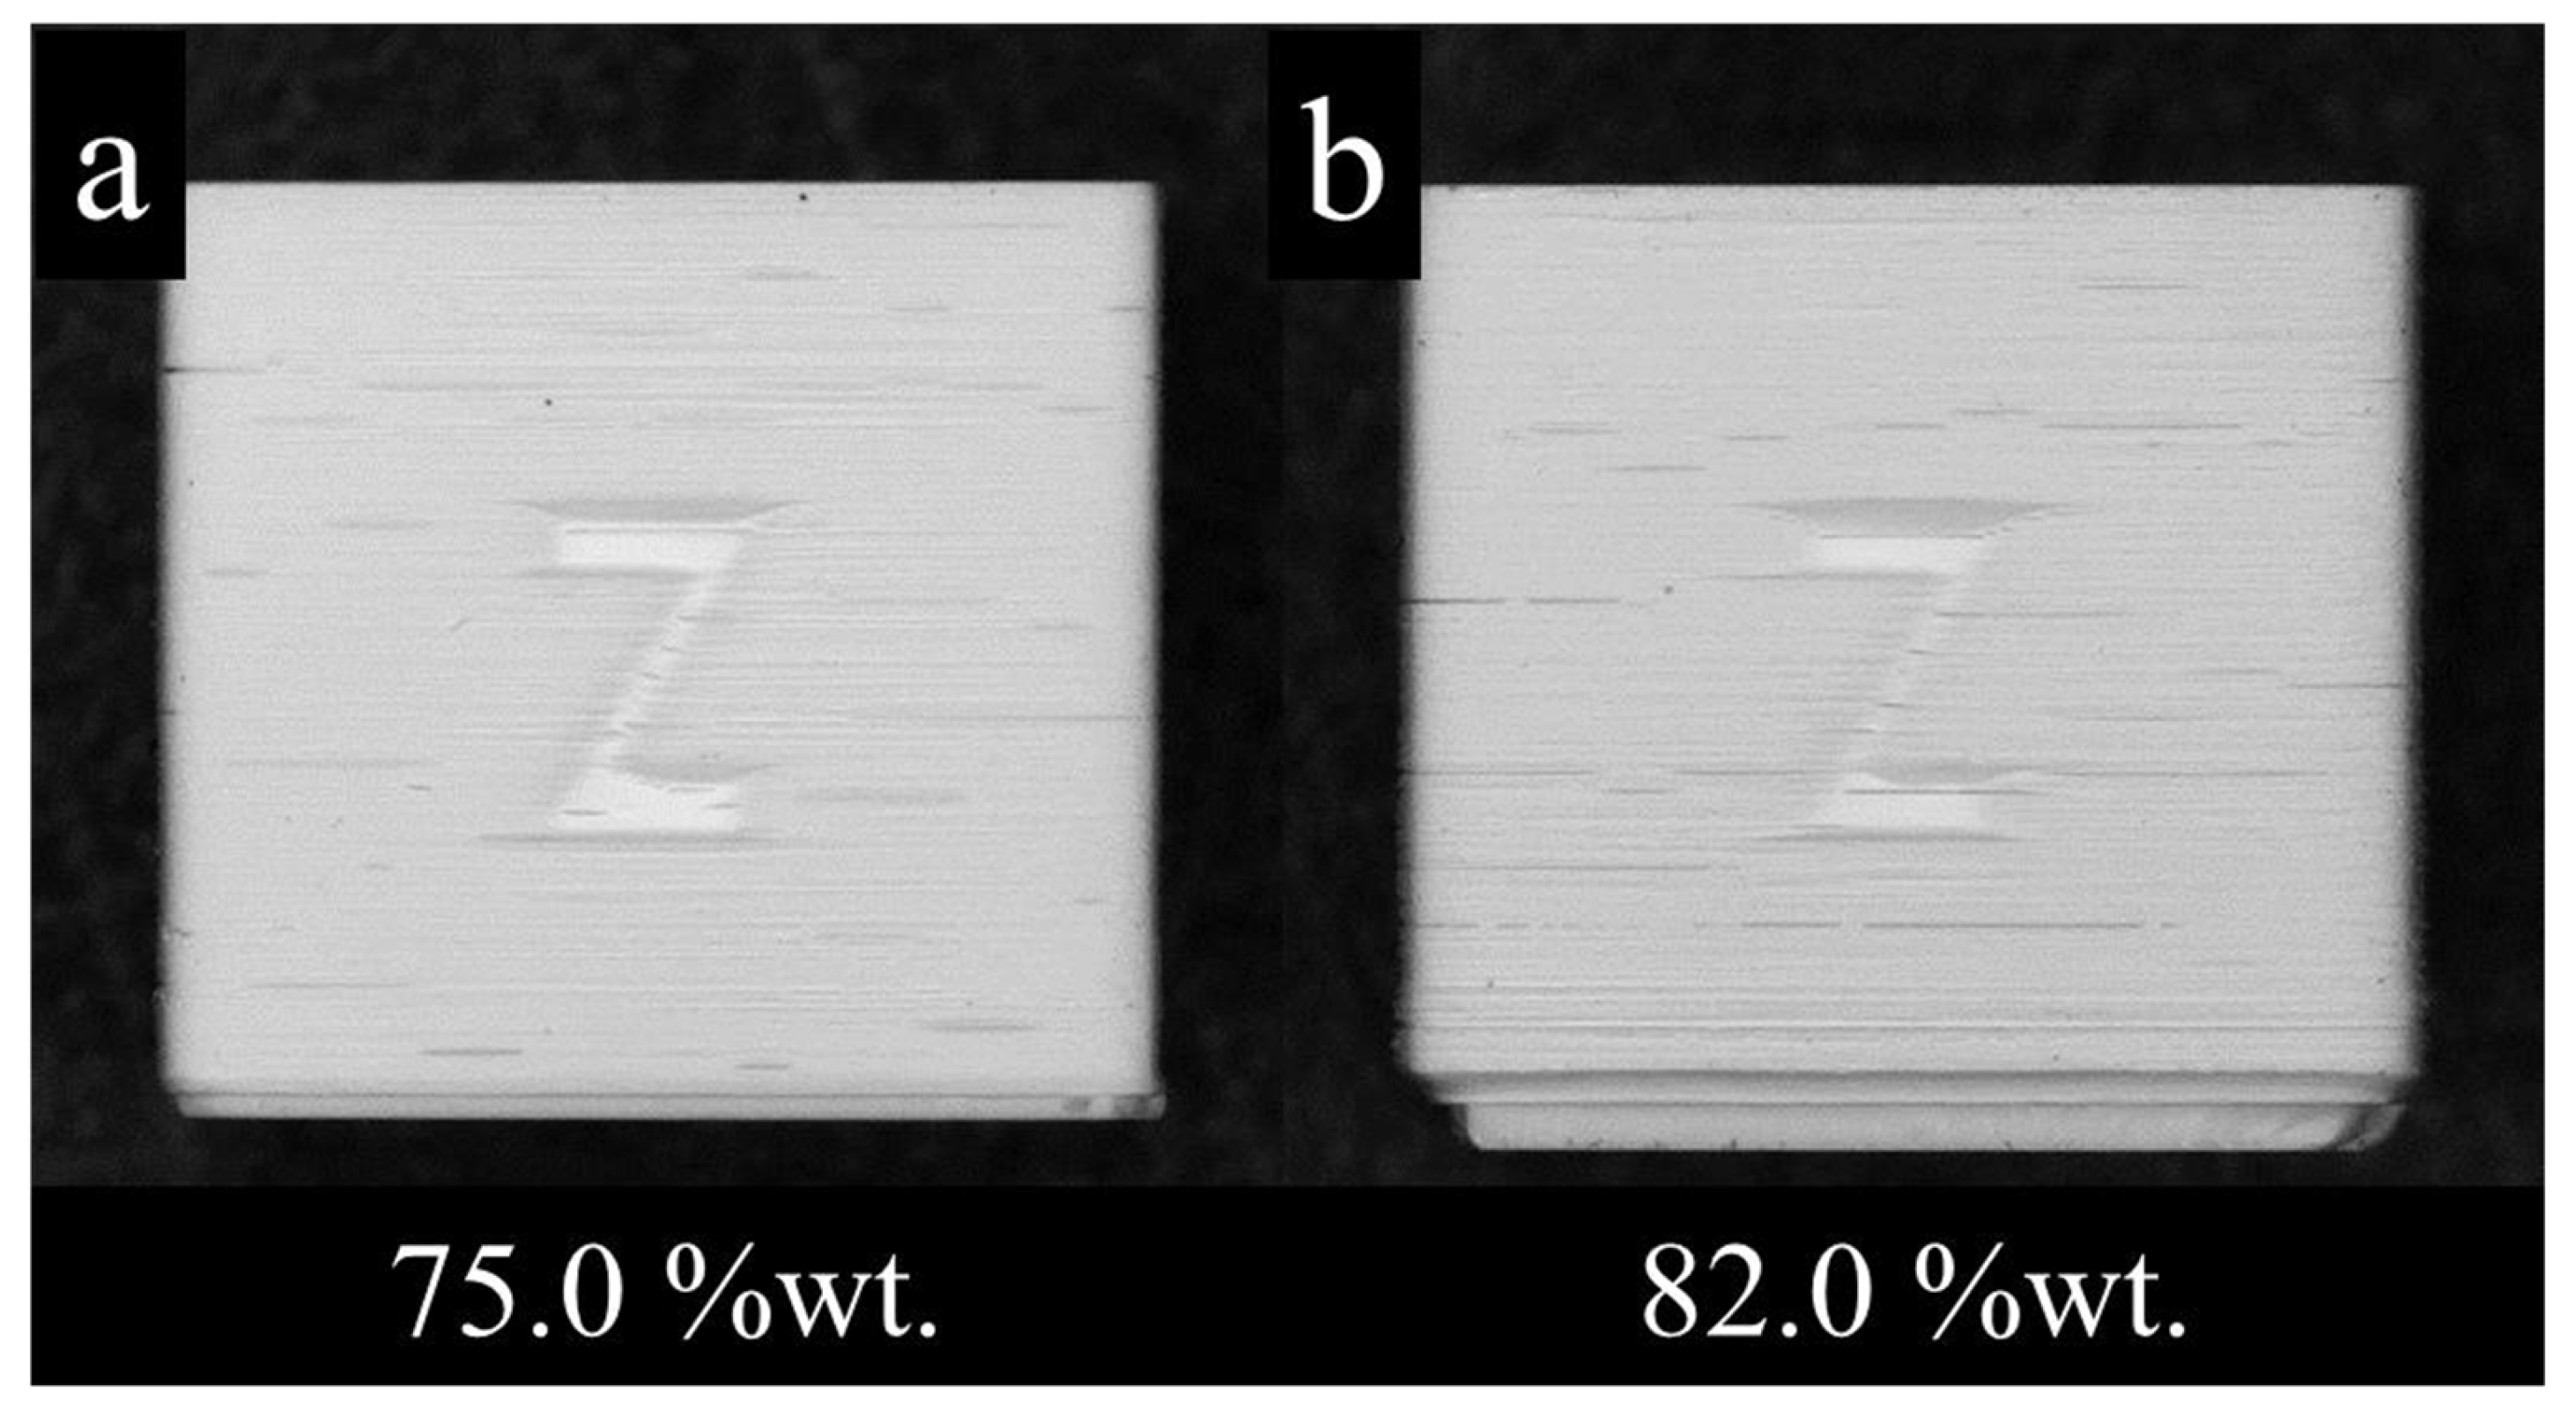
Figure 8.
Scanning electron microscope images show the effect of layer thickness and energy dose using samples with two different particle sizes. They contained a solid content of 75.0 %wt. The as-printed samples with fine alumina, AA07, were printed under the conditions of (a) low energy dose and 50.0 µm layer thickness, (b) high energy dose and 50.0 µm layer thickness, and (c) low energy dose and 20.0 µm layer thickness. The as-debound samples with coarse alumina, AA3, were printed under the conditions of (d) low energy dose and 50.0 µm layer thickness as well as (e) high energy dose and 50.0 µm layer thickness. (f) Schematic shows how the stair-wise pattern is formed.
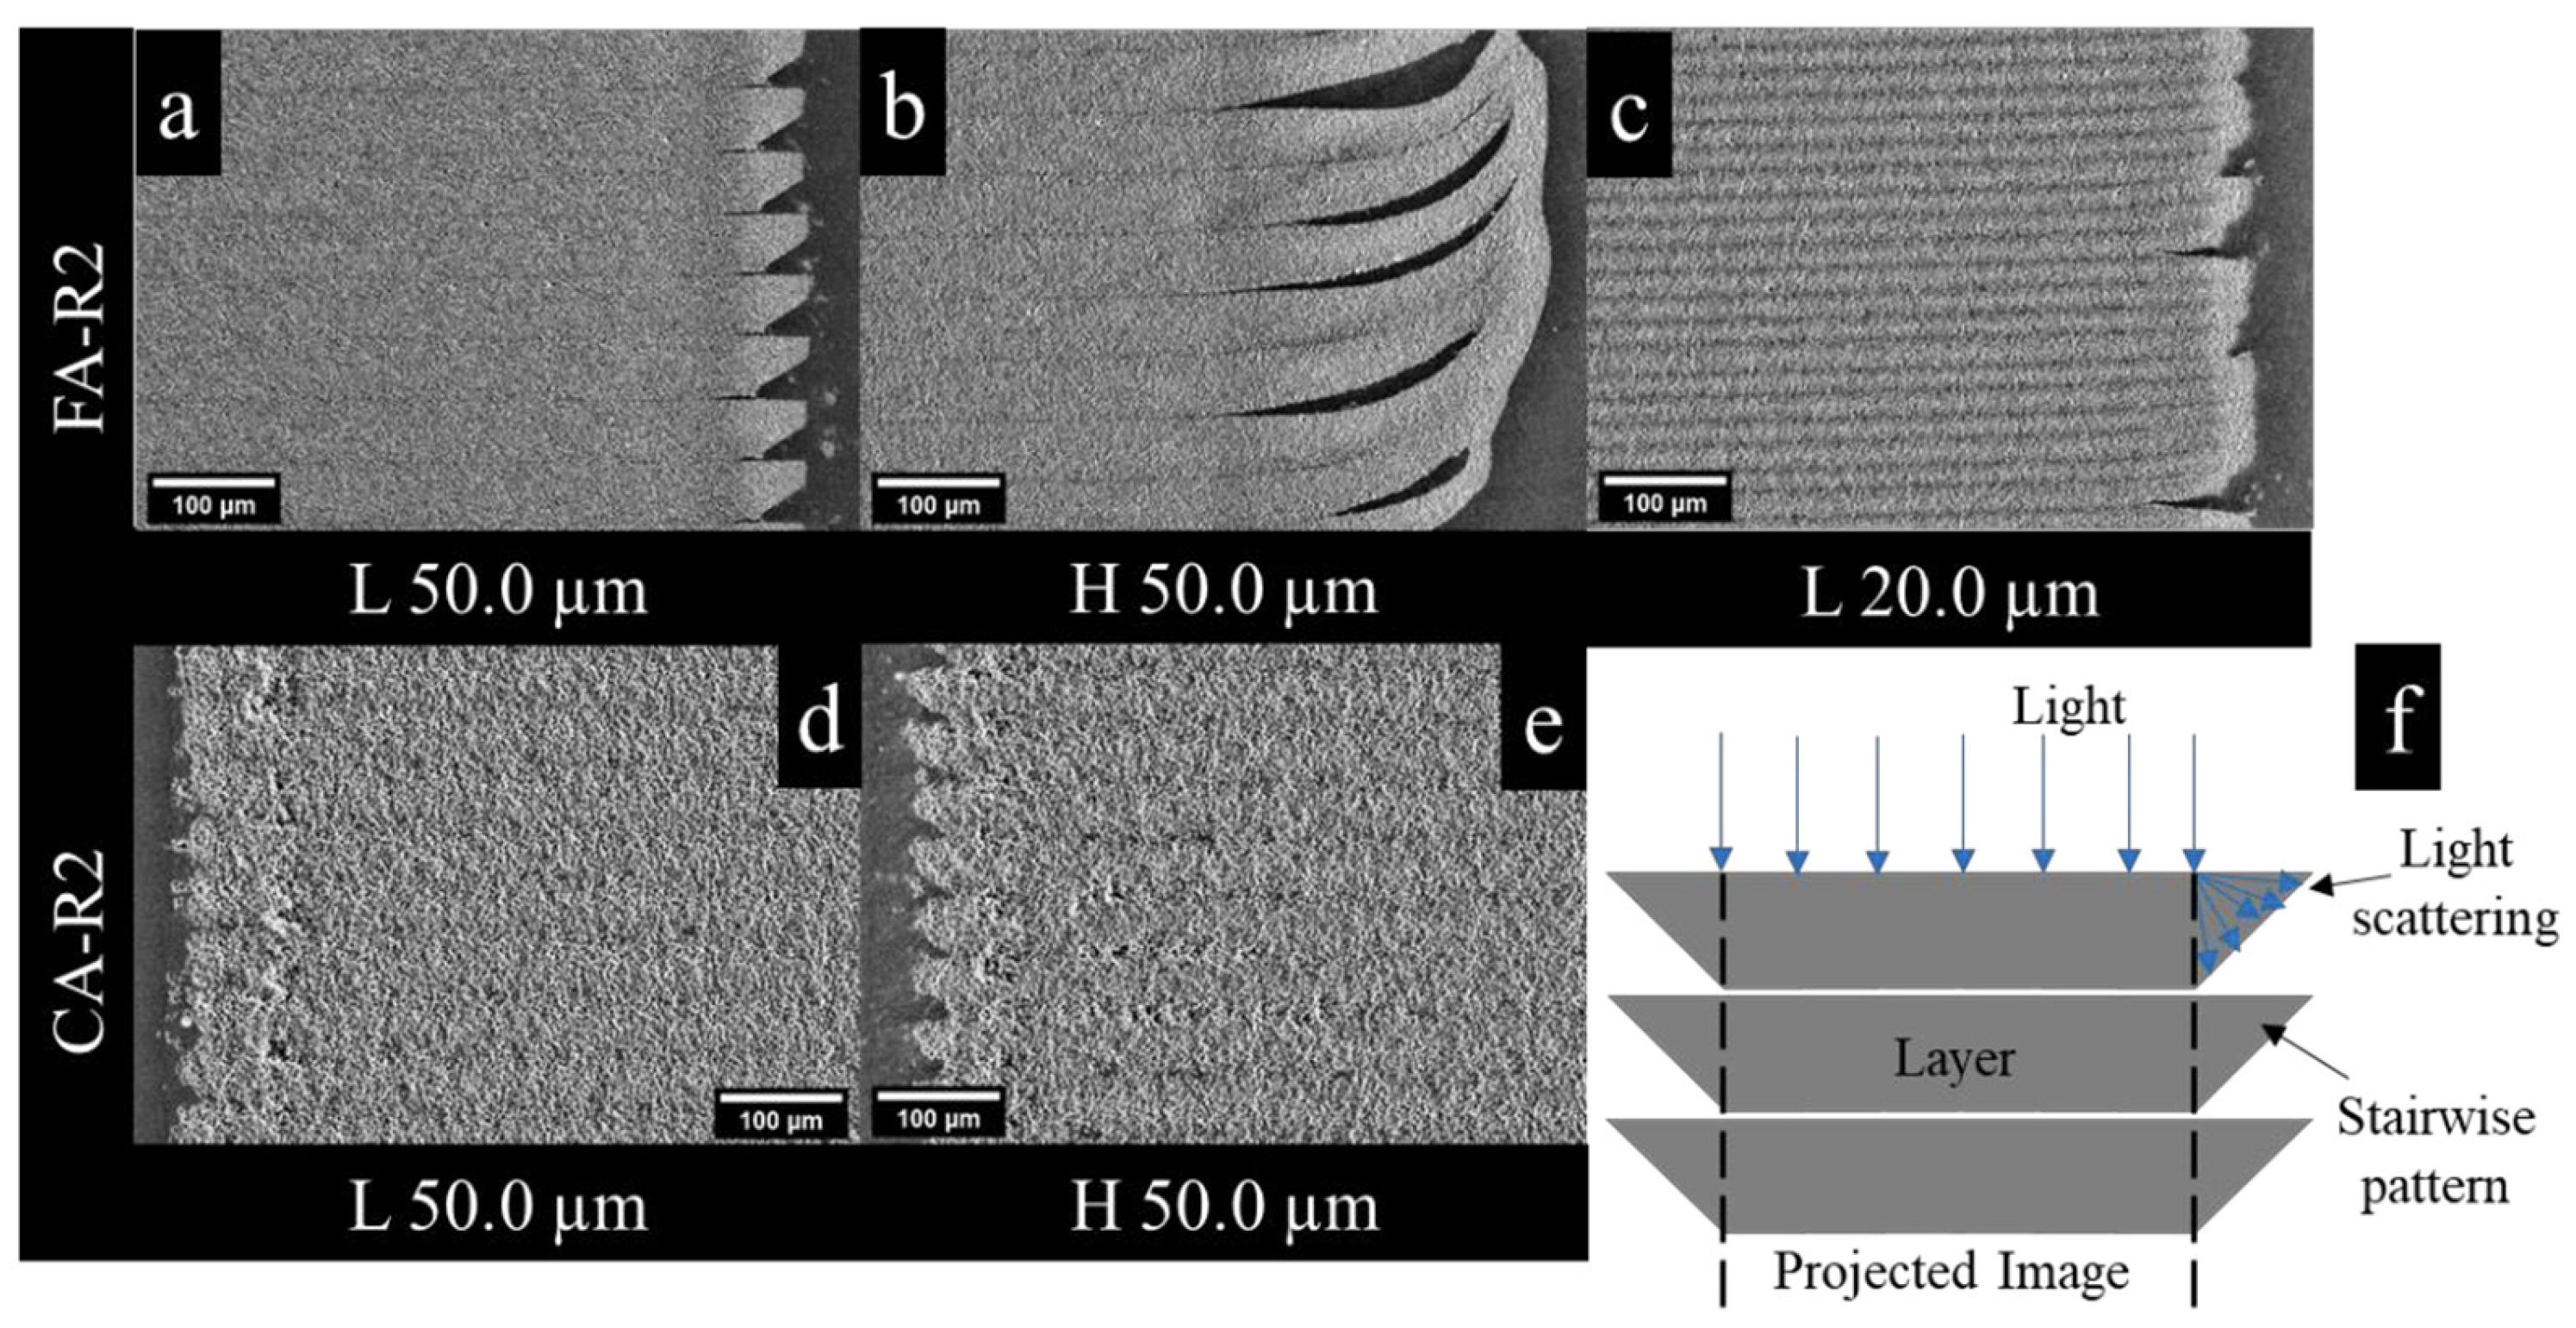
Figure 9.
Scanning electron microscope images show the effect of solid content using as-printed samples composed of AA07 and Resin1. The solid content was (a) 75.0 %wt. and (b) 82.0 %wt. They were printed using low energy dose and 20.0 µm layer thickness.
Figure 9.
Scanning electron microscope images show the effect of solid content using as-printed samples composed of AA07 and Resin1. The solid content was (a) 75.0 %wt. and (b) 82.0 %wt. They were printed using low energy dose and 20.0 µm layer thickness.
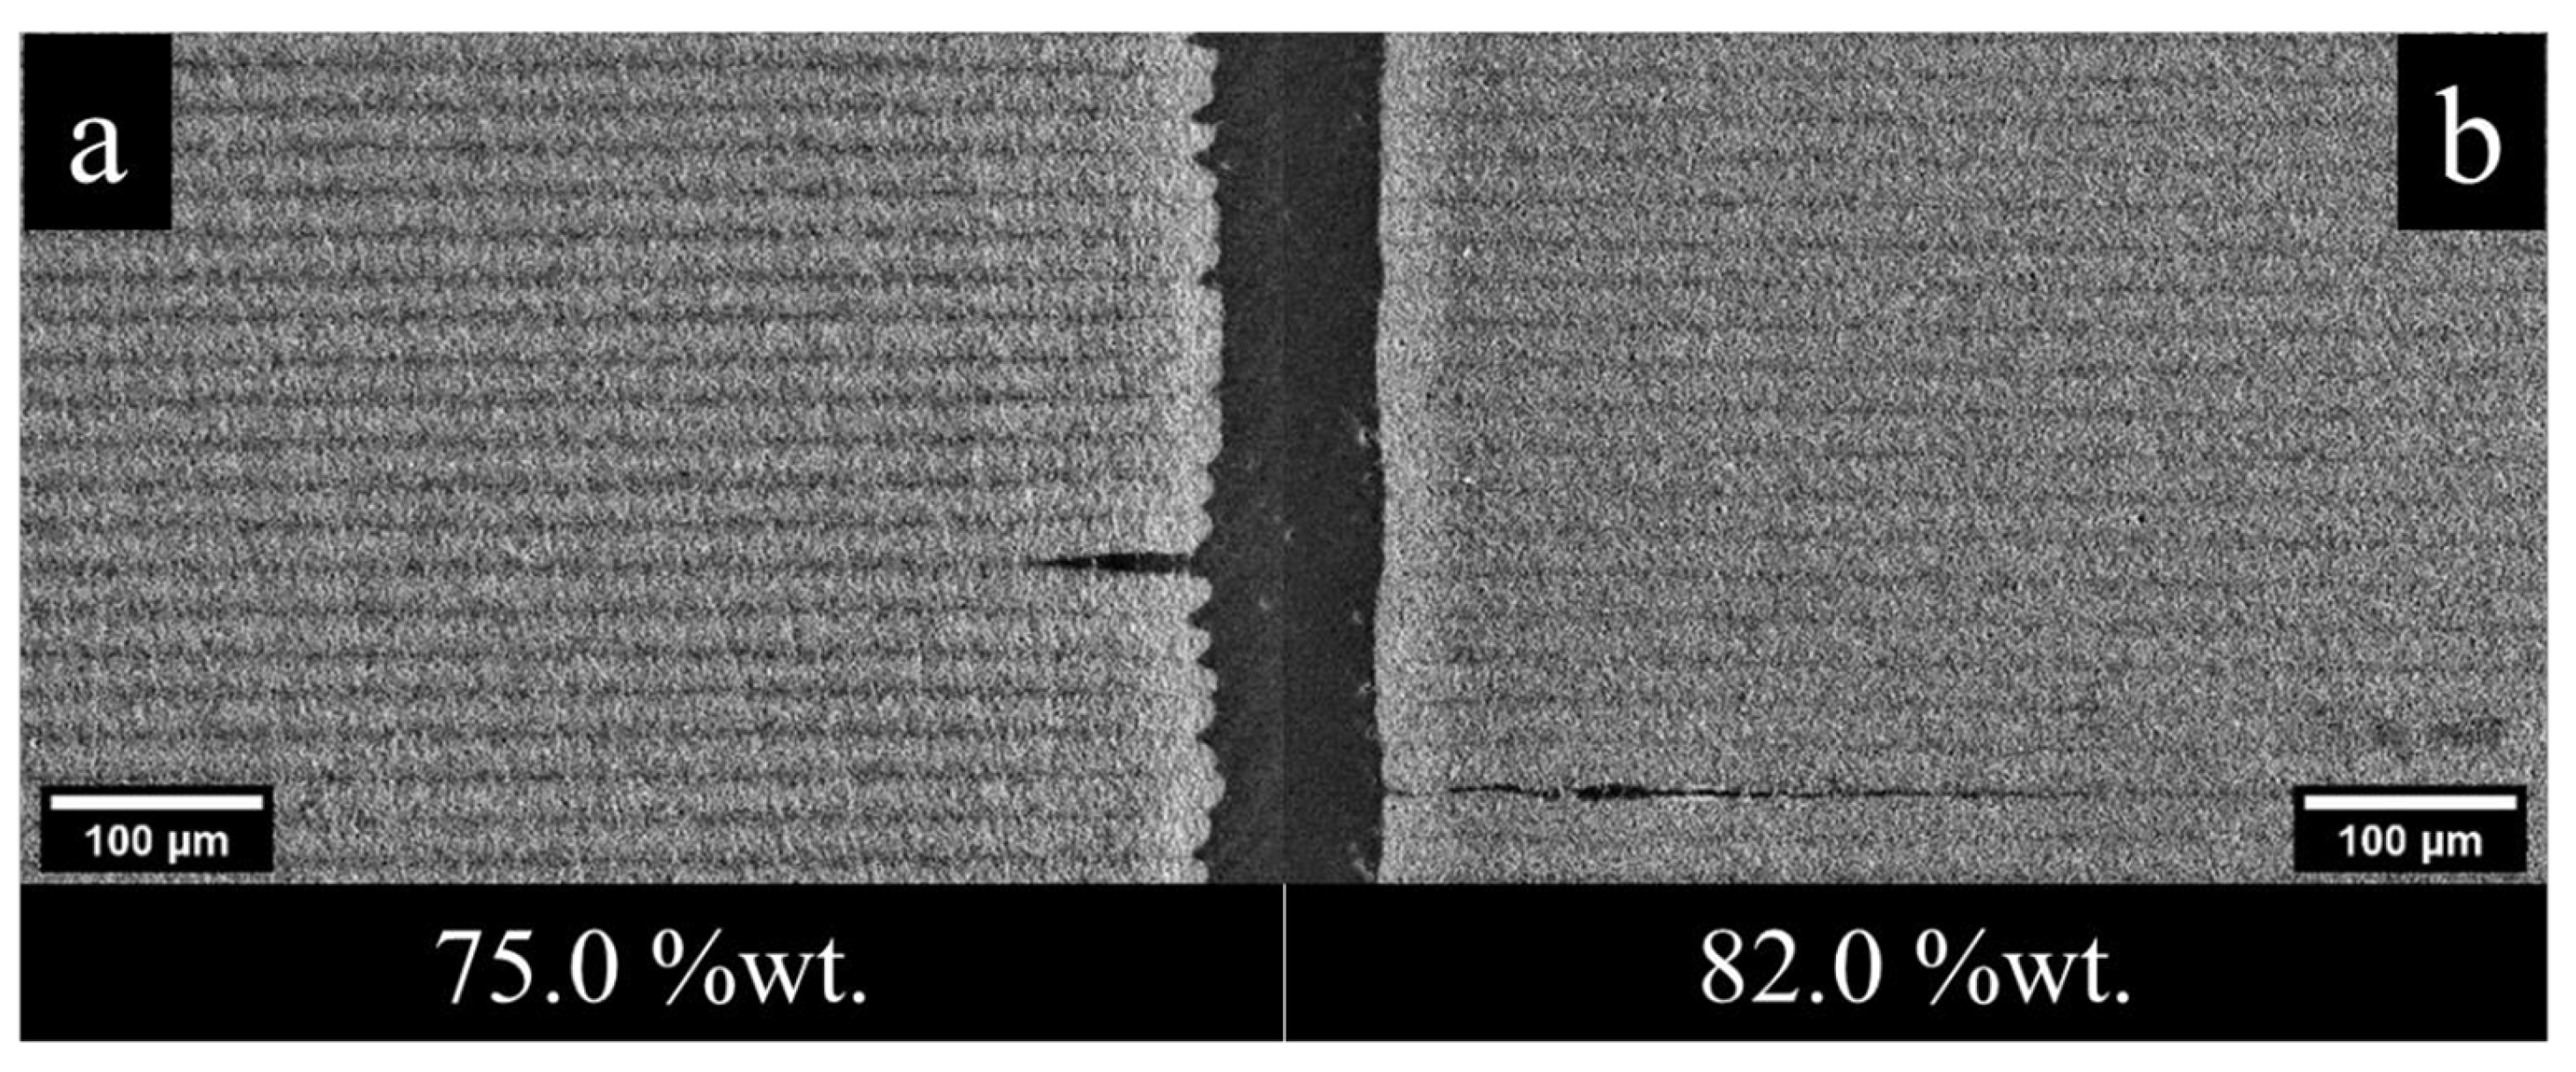
Figure 10.
The dimensional changes of as printed samples as a function of (a) energy dose and (b) layer thickness. Three samples with a solid content of 75.0 %wt., one sample consisted of Resin1 with fine powder, and two others consisted of Resin2 with fine and coarse powders.
Figure 10.
The dimensional changes of as printed samples as a function of (a) energy dose and (b) layer thickness. Three samples with a solid content of 75.0 %wt., one sample consisted of Resin1 with fine powder, and two others consisted of Resin2 with fine and coarse powders.
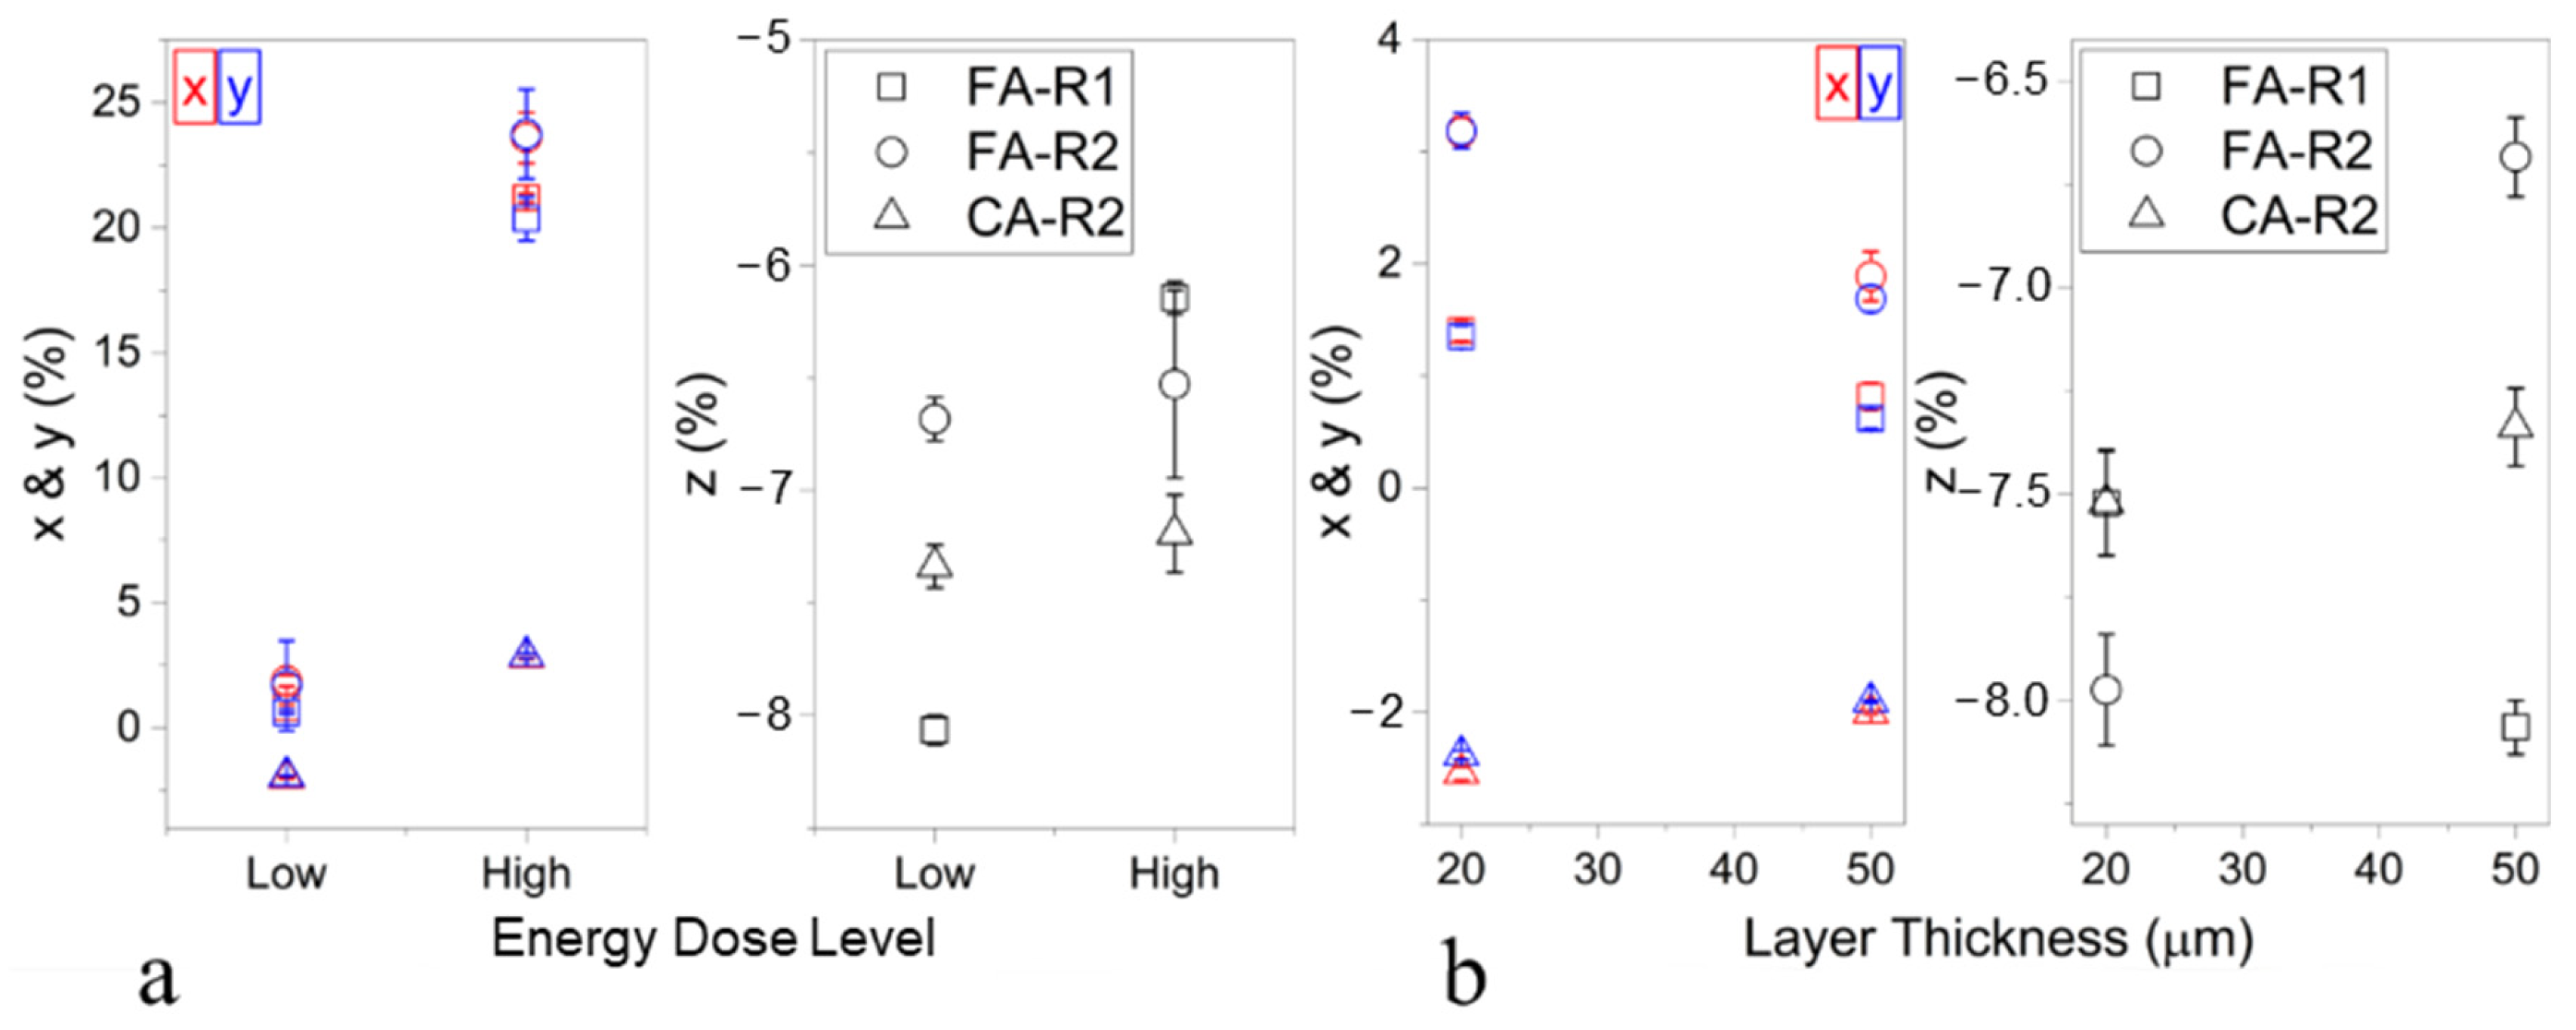
Figure 11.
The dimensional changes of as printed samples as a function of solid content. The samples composed of AA07 and Resin1. They were printed using 20.0 µm layer thickness and a low energy dose.
Figure 11.
The dimensional changes of as printed samples as a function of solid content. The samples composed of AA07 and Resin1. They were printed using 20.0 µm layer thickness and a low energy dose.
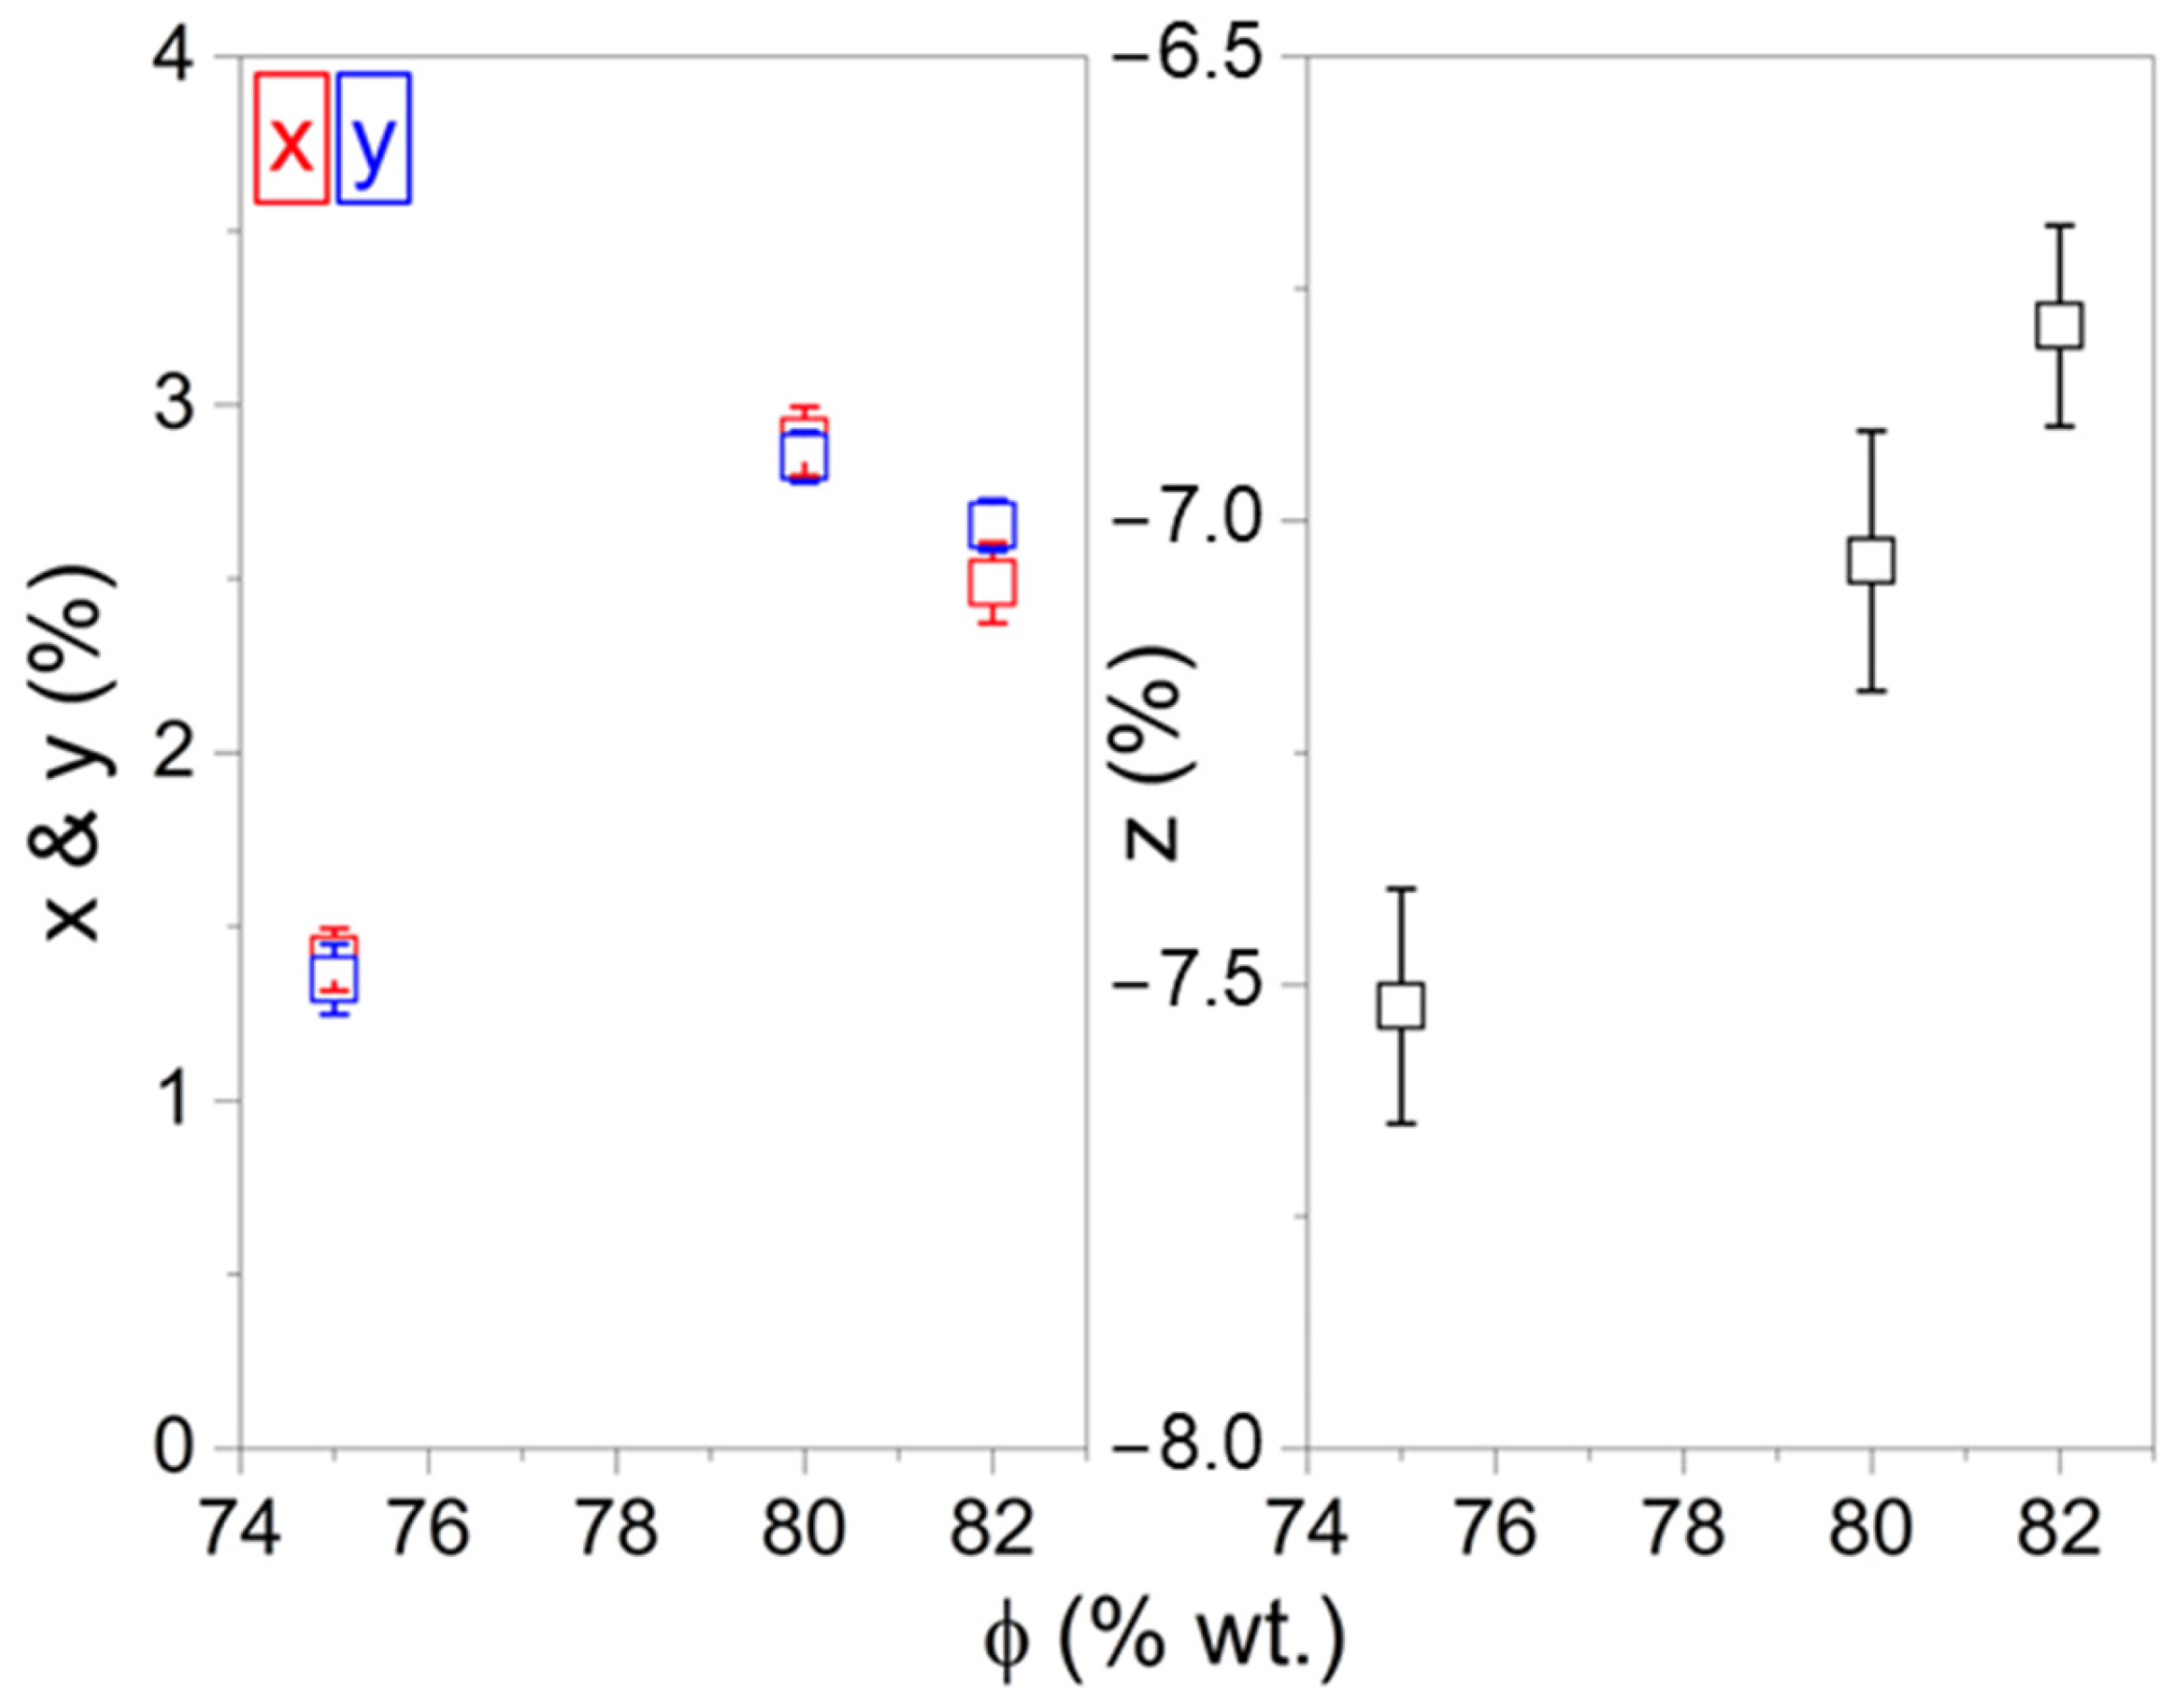
Figure 12.
The changes in layer thickness across the prints and their microstructure images. Images were taken at three locations which were near the base, middle layers, and last layers. The layers near the base were printed first. The samples and print conditions varied. (a) Sample (Resin1 and 75.0 %wt. AA07 powder) was printed using 20.0 µm layer thickness and low energy dose conditions. (b) Sample (Resin2 and 75.0 %wt. AA07 powder) was printed using 20.0 µm layer thickness and low energy dose conditions. (c) Sample (Resin2 and 75.0 %wt. AA07 powder) was printed using 50.0 µm layer thickness and low energy dose conditions.
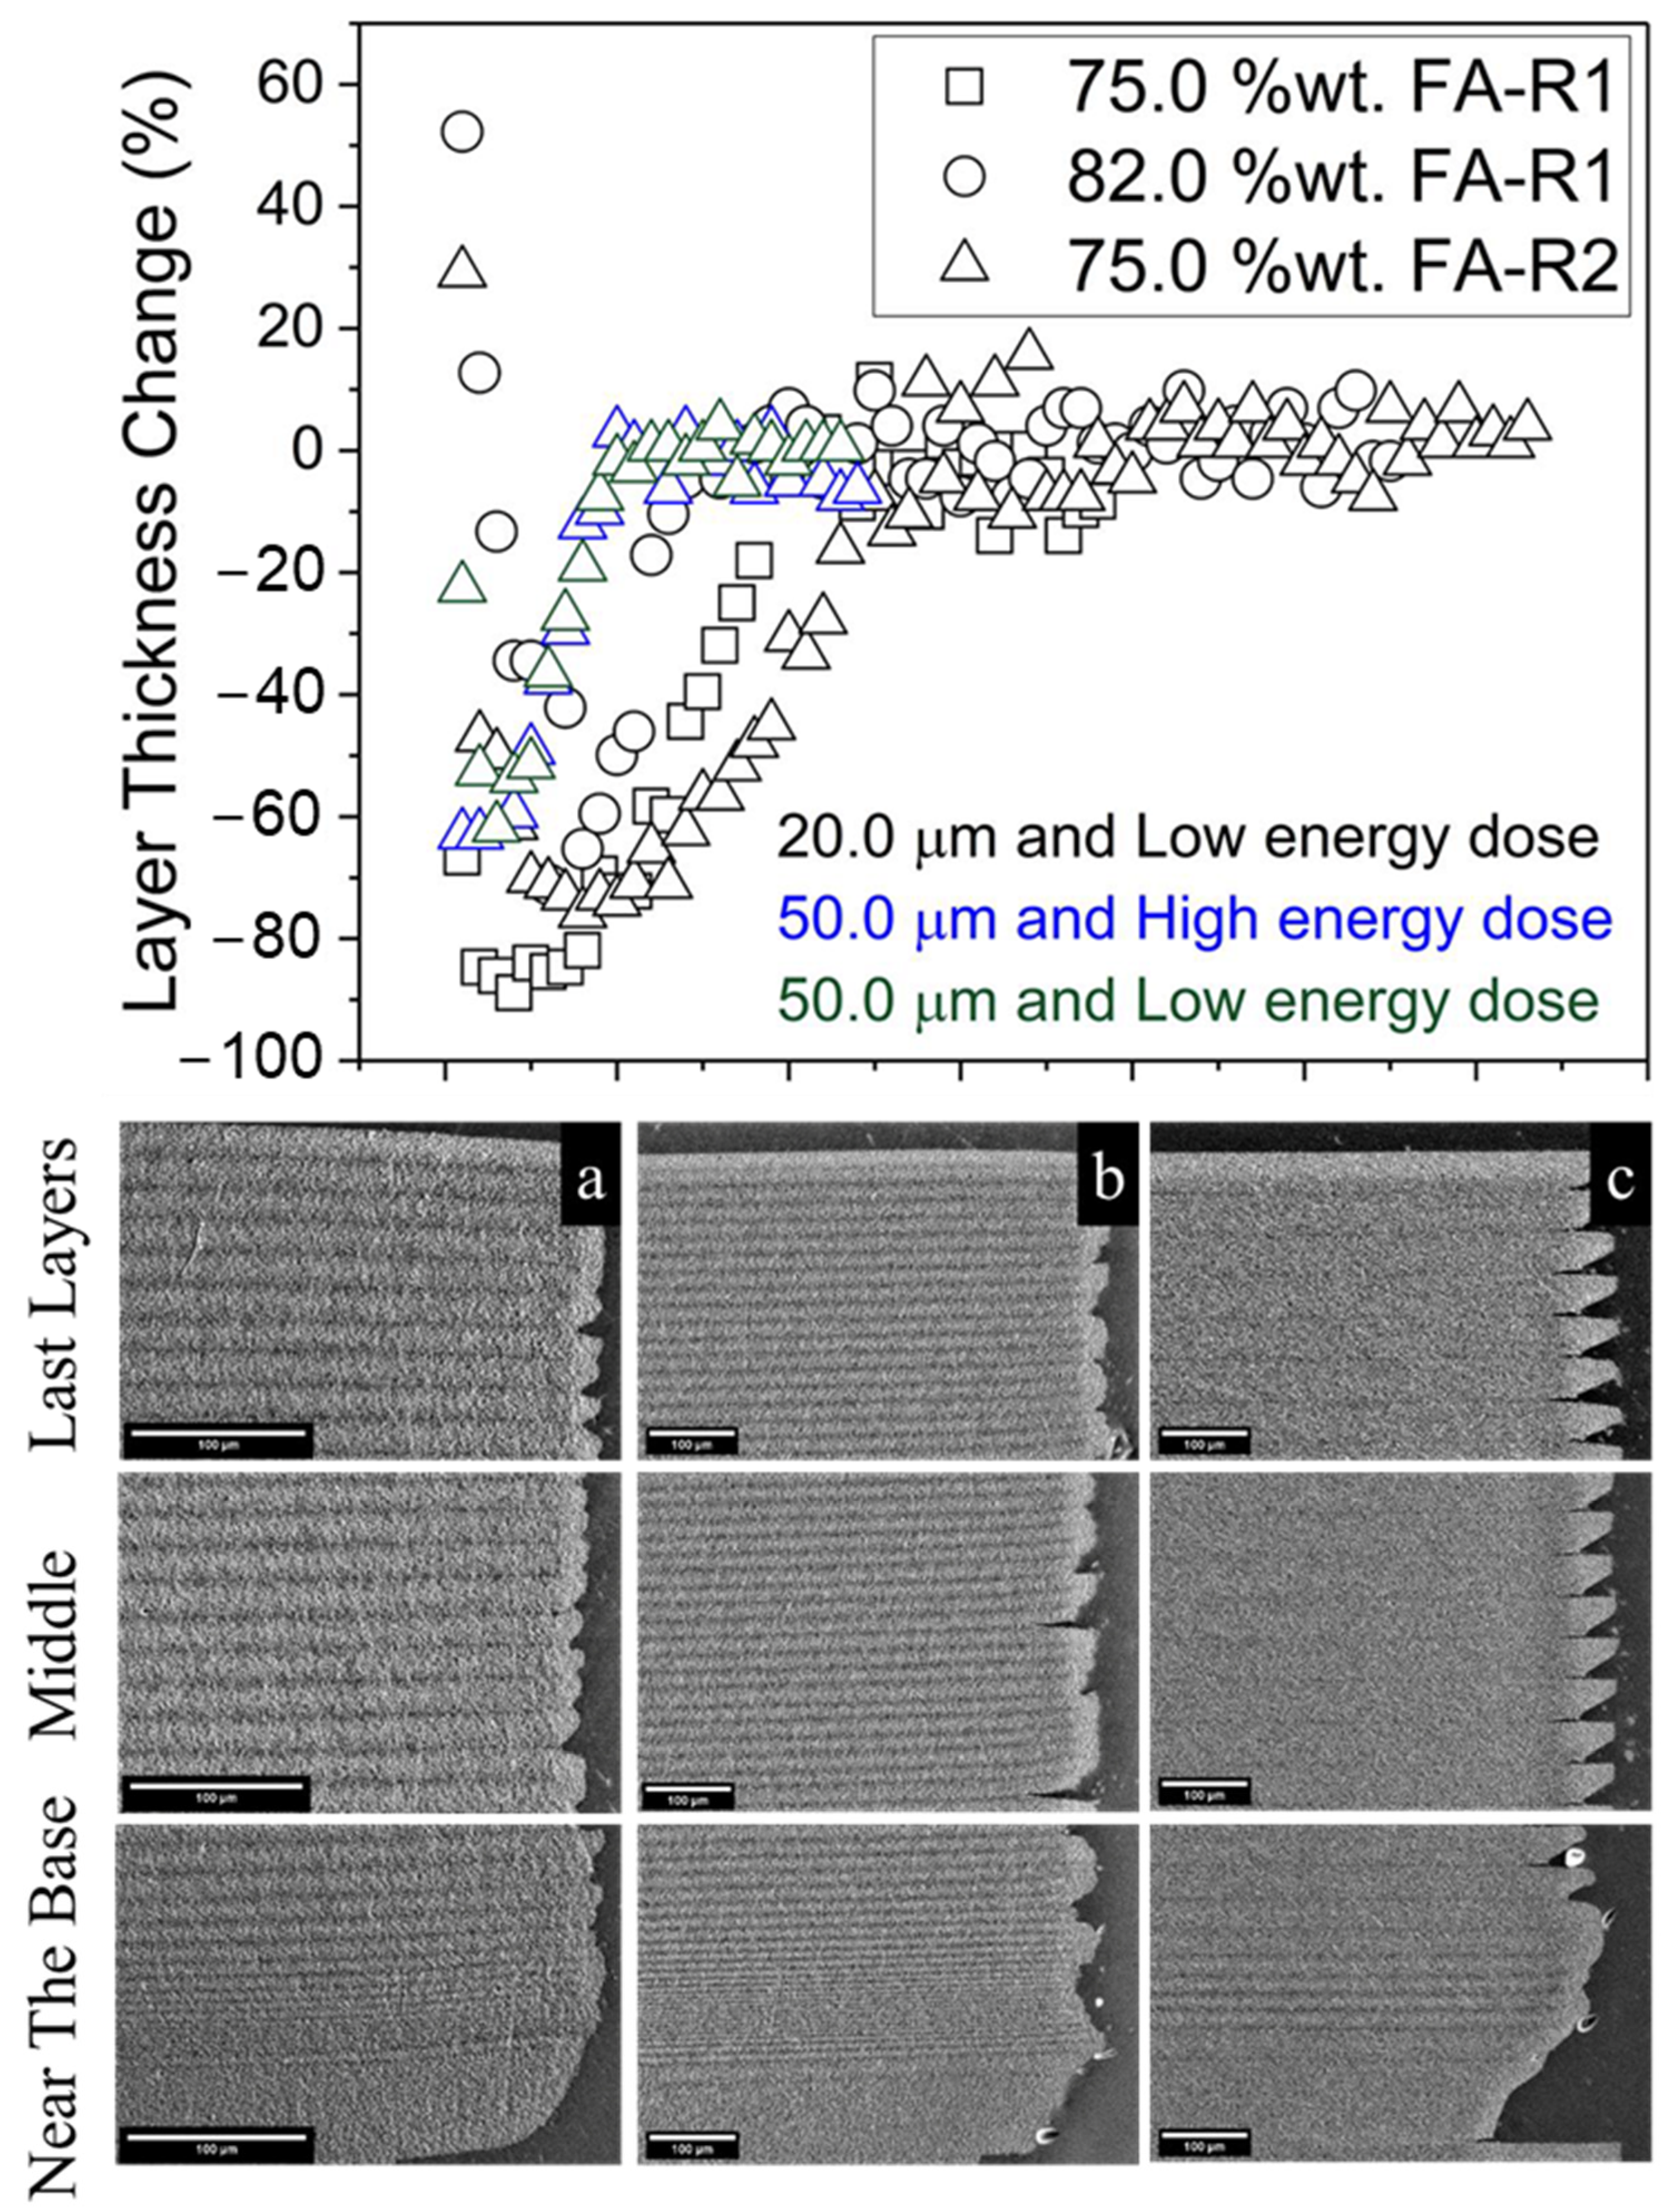
Figure 13.
Sintered samples composed of Resin1 and (a) 75.0 %wt. and (b) 82.0 %wt. AA07 powder. (c) Sintered sample composed of Resin2 and 75.0 %wt. AA07 powder. They were printed using 20.0 µm layer thickness and low energy dose conditions.
Figure 13.
Sintered samples composed of Resin1 and (a) 75.0 %wt. and (b) 82.0 %wt. AA07 powder. (c) Sintered sample composed of Resin2 and 75.0 %wt. AA07 powder. They were printed using 20.0 µm layer thickness and low energy dose conditions.

Figure 14.
The dimensional changes of sintered samples as a function of solid content using two resins.
Figure 14.
The dimensional changes of sintered samples as a function of solid content using two resins.

Table 1.
Different particle size of alumina powders, a range of solid content used with varying resins, and the difference in refractive index between solid and resin. The density of alumina was measured using a helium pycnometer, Autopyc II (Micromeritics, Norcross, USA). The solid content reflected a range of (~45.0–54.0) %vol. Regarding the sample labels, FA stands for fine alumina, and CA stands for coarse alumina. R1 stands for Resin1, and R2 stands for Resin2. Our d50 values were slightly different from the values on data sheets provided by the manufacturer, which were 0.83 µm for AA07 and 3.4 µm for AA3 powders.
| Samples | Solid Content (%wt.) | Powder | Particle Size, d50 (µm) | Density (g/cm3) | Refractive Index Difference | Resin |
|---|---|---|---|---|---|---|
| FA-R1 | 75–82 | AA07 | 1.35 | 4.01 | 0.275 | Resin1 |
| FA-R2 | 0.269 | Resin2 | ||||
| CA-R2 | 75.0 | AA3 | 2.76 | 4.06 | Resin2 |
Disclaimer/Publisher’s Note: The statements, opinions and data contained in all publications are solely those of the individual author(s) and contributor(s) and not of MDPI and/or the editor(s). MDPI and/or the editor(s) disclaim responsibility for any injury to people or property resulting from any ideas, methods, instructions or products referred to in the content. |
© 2023 by the authors. Licensee MDPI, Basel, Switzerland. This article is an open access article distributed under the terms and conditions of the Creative Commons Attribution (CC BY) license (https://creativecommons.org/licenses/by/4.0/).
Share and Cite
MDPI and ACS Style
Alazzawi, M.K.; Hwang, C.; Tsarkova, V.R.; Haber, R.A. The Feature Resolution and Dimensional Control in Freeform Solidification of Alumina Systems by Stereolithography. Ceramics 2023, 6, 2036-2052. https://doi.org/10.3390/ceramics6040125
AMA Style
Alazzawi MK, Hwang C, Tsarkova VR, Haber RA. The Feature Resolution and Dimensional Control in Freeform Solidification of Alumina Systems by Stereolithography. Ceramics. 2023; 6(4):2036-2052. https://doi.org/10.3390/ceramics6040125
Chicago/Turabian StyleAlazzawi, Mustafa K., Chawon Hwang, Victoria R. Tsarkova, and Richard A. Haber. 2023. "The Feature Resolution and Dimensional Control in Freeform Solidification of Alumina Systems by Stereolithography" Ceramics 6, no. 4: 2036-2052. https://doi.org/10.3390/ceramics6040125