Article

Experimental Study of a Nonthermal DBD-Driven Plasma Jet System Using Different Supply Methods

1
LAPLACE Laboratory, Université de Toulouse, CNRS, INPT, UPS, 2 rue Charles Camichel, F-31071 Toulouse, France
2
Laboratory of Optical Radiation, Immanuel Kant Baltic Federal University, 236001 Kaliningrad, Russia
3
Department of Electronic Engineering, Pontificia Universidad Javeriana, Carrera 7 # 40-62, 110231 Bogota, Colombia
4
Escuela de Ciencias Exactas e Ingenieria, Universidad Sergio Arboleda, Calle 74 # 14-14, 110221 Bogota, Colombia
*
Authors to whom correspondence should be addressed.
Plasma 2022, 5(1), 75-97; https://doi.org/10.3390/plasma5010007
Submission received: 13 August 2021 / Revised: 20 January 2022 / Accepted: 25 January 2022 / Published: 1 February 2022
(This article belongs to the Special Issue Plasma Biology)

Abstract

:
This article presents an experimental study of a DBD-driven plasma jet system. The aim of the study is to design a whole system (the jet reactor, its electrical power supply, and a gas-feeding apparatus) suitable for biomedical applications. The article describes the test bench developed for this purpose and discusses the parameters it controls. The measurements show that the studied solutions can be used to control critical parameters such as the jet temperature and dimensions. The best results were obtained for a bipolar short-pulse voltage power supply in the 10–20 kHz frequency range and for a series resonant inverter current power supply operated in “burst mode”, allowing low-frequency modulation.

1. Introduction

In the near future, the growing antibiotic resistance of bacteria may prevent effective clinical use of the drugs that have saved millions of lives. Therefore, developing a new safe nondrug treatment method is critical for the wellbeing of humanity.
Nonthermal plasmas are well-known sources of excited species capable of destroying pathogenic microorganisms [1,2]. These plasmas, containing ionized particles and active radicals, produce ultraviolet radiation. When a plasma jet and oxygen in the air or in the working gas interact, they also generate ozone. All these factors can destroy pathogenic microorganisms or at least damage their DNA, preventing their multiplication. Unlike drug treatment methods, gas-discharge plasma cannot result in the acquired resistance of pathogens. Therefore, these properties of nonthermal plasma are promising for curing infected wounds. The literature abounds with recent research into the application of nonthermal plasma in treating septic wounds [3], skin diseases (acne, chronic ulcers, dermatitis, seborrhea, keratosis, fungal skin lesions, papilloma, psoriasis, herpes, and warts) [4,5,6,7], and dental conditions [8].
Excited species, emitted UV, and the generated ozone have powerful disinfection properties. Under specific conditions, it is possible to keep the gas temperature close to that of the human body (below 42 °C). Treatment at such a low temperature can be effective and painless, with minimum side-effects.
The dielectric barrier discharge (DBD) reactor is a safe option for medical applications; barrier capacitance limits the current and prevents voltage breakdown. An electrode system with only one dielectric barrier or without dielectric barriers poses a greater risk of voltage breakdown from the internal high-voltage electrode, thereby harming the patient.
The injection of electrical energy into this reactor is of considerable importance; superhigh-frequency sine voltage generators (SHF supplies in the 3–30 GHz range) are commonly used to produce a plasma jet with a low gas temperature at a low working gas flow rate (<1 L/min) [9]. Typically, these power supplies are bulky, expensive, and energy-inefficient. At lower frequencies, a high-frequency sine voltage has the benefit of requiring smaller-sized power supplies, currently using linear amplifiers. In this case, however, gas temperatures below 42 °C can be achieved at high working gas flow rates only (>3 L/min) [10]. Below, we consider modern power electronic circuits using switched solid-state semiconductors as a solution.
This paper focuses on the technical aspects of the plasma-based treatment of infected wounds, system design parameters, and the impact of the plasma excitation method [11,12]. Section 1 presents plasma jet specifications, and Section 2 focuses on jet reactor design. Two alternative power supplies for plasma pumping designed on the basis of an equivalent electrical model of the jet reactor are described in Section 2.2. The article sets out the assembly of the system and its control and monitoring on a test bench, and it discusses system-level experimental results, including the measurement of relevant parameters of the plasma jet. Temperature control is one of the main criteria of our investigation.

2. Materials and Methods

2.1. System Specifications and Reactor Setup

In this section, we review the operating principle of DBD-driven plasma jets and identify system performance criteria for medical applications.

2.1.1. Plasma Jet Requirements for Wound Disinfection

From the early stages of the investigation, we paid special attention to the applicability of studied solutions to wound disinfection and other medical uses. We considered the following parameters associated with plasma jet properties:
  • Gas temperature is a principal indicator of applicability; if the temperature of the jet differs substantially from body temperature, treatment will be painful. Temperatures above 42 °C denature proteins, and exposed tissues die. The power injected into the discharge determines the temperature of the gas in the plasma.
  • Plasma plume length is the distance from the end of the reactor to the treated surface. It is related to the electrical isolation requirements, to prevent the patient and the caregiver from receiving an electric shock. A longer plasma plume length guarantees noncontact treatment and decreases the probability of high-voltage breakdown with the treated surface. Long plasma plumes are also convenient when processing surfaces with complex shapes.
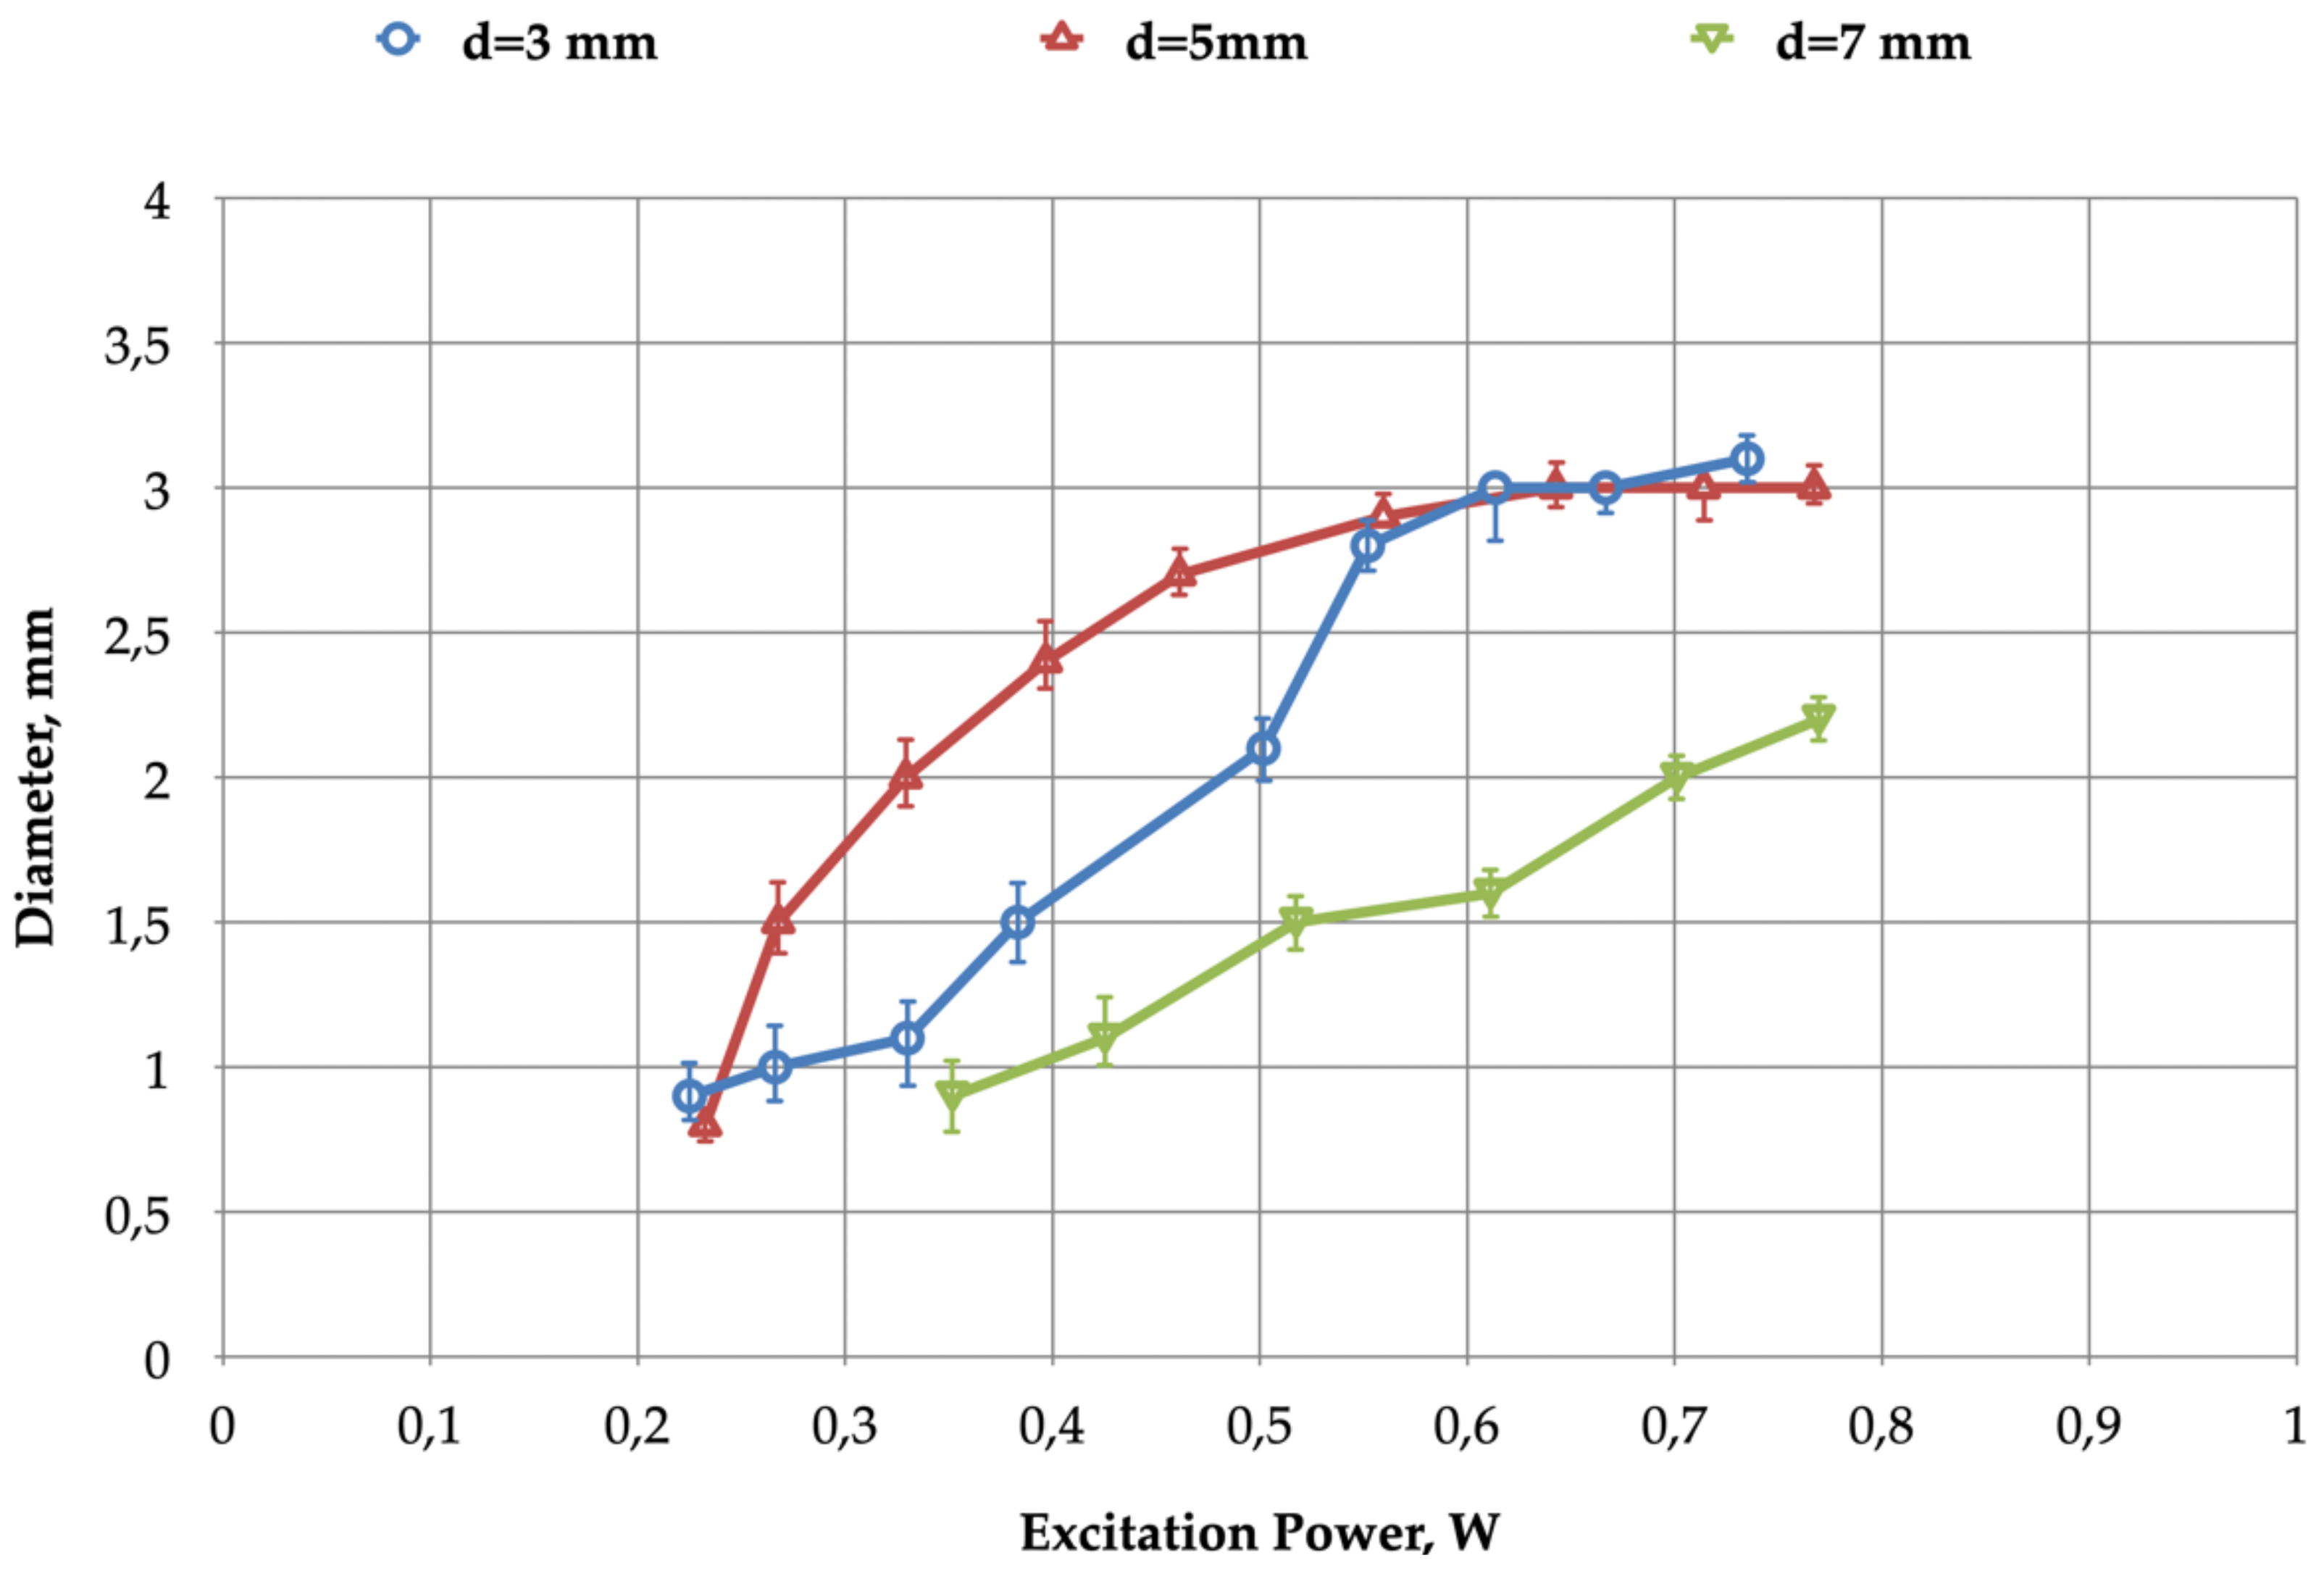
  • Plasma jet diameter. The shape of the plume is generally conical; the diameter of the spot should match the surface of the wound. A wide plasma–surface contact area shortens treatment time. An increase in the plasma jet diameter reduces current density in the jet and ensures a more uniform gas temperature distribution.
  • The plasma composition and the concentration of reactive species are essential for the treatment. Although the plasma composition is expected to have a lethal effect on pathogenic agents [13], healthy tissues near the infected wound should not be severely affected [14,15].
These system specifications are determined by the chosen design parameters of the reactor, which are provided below.

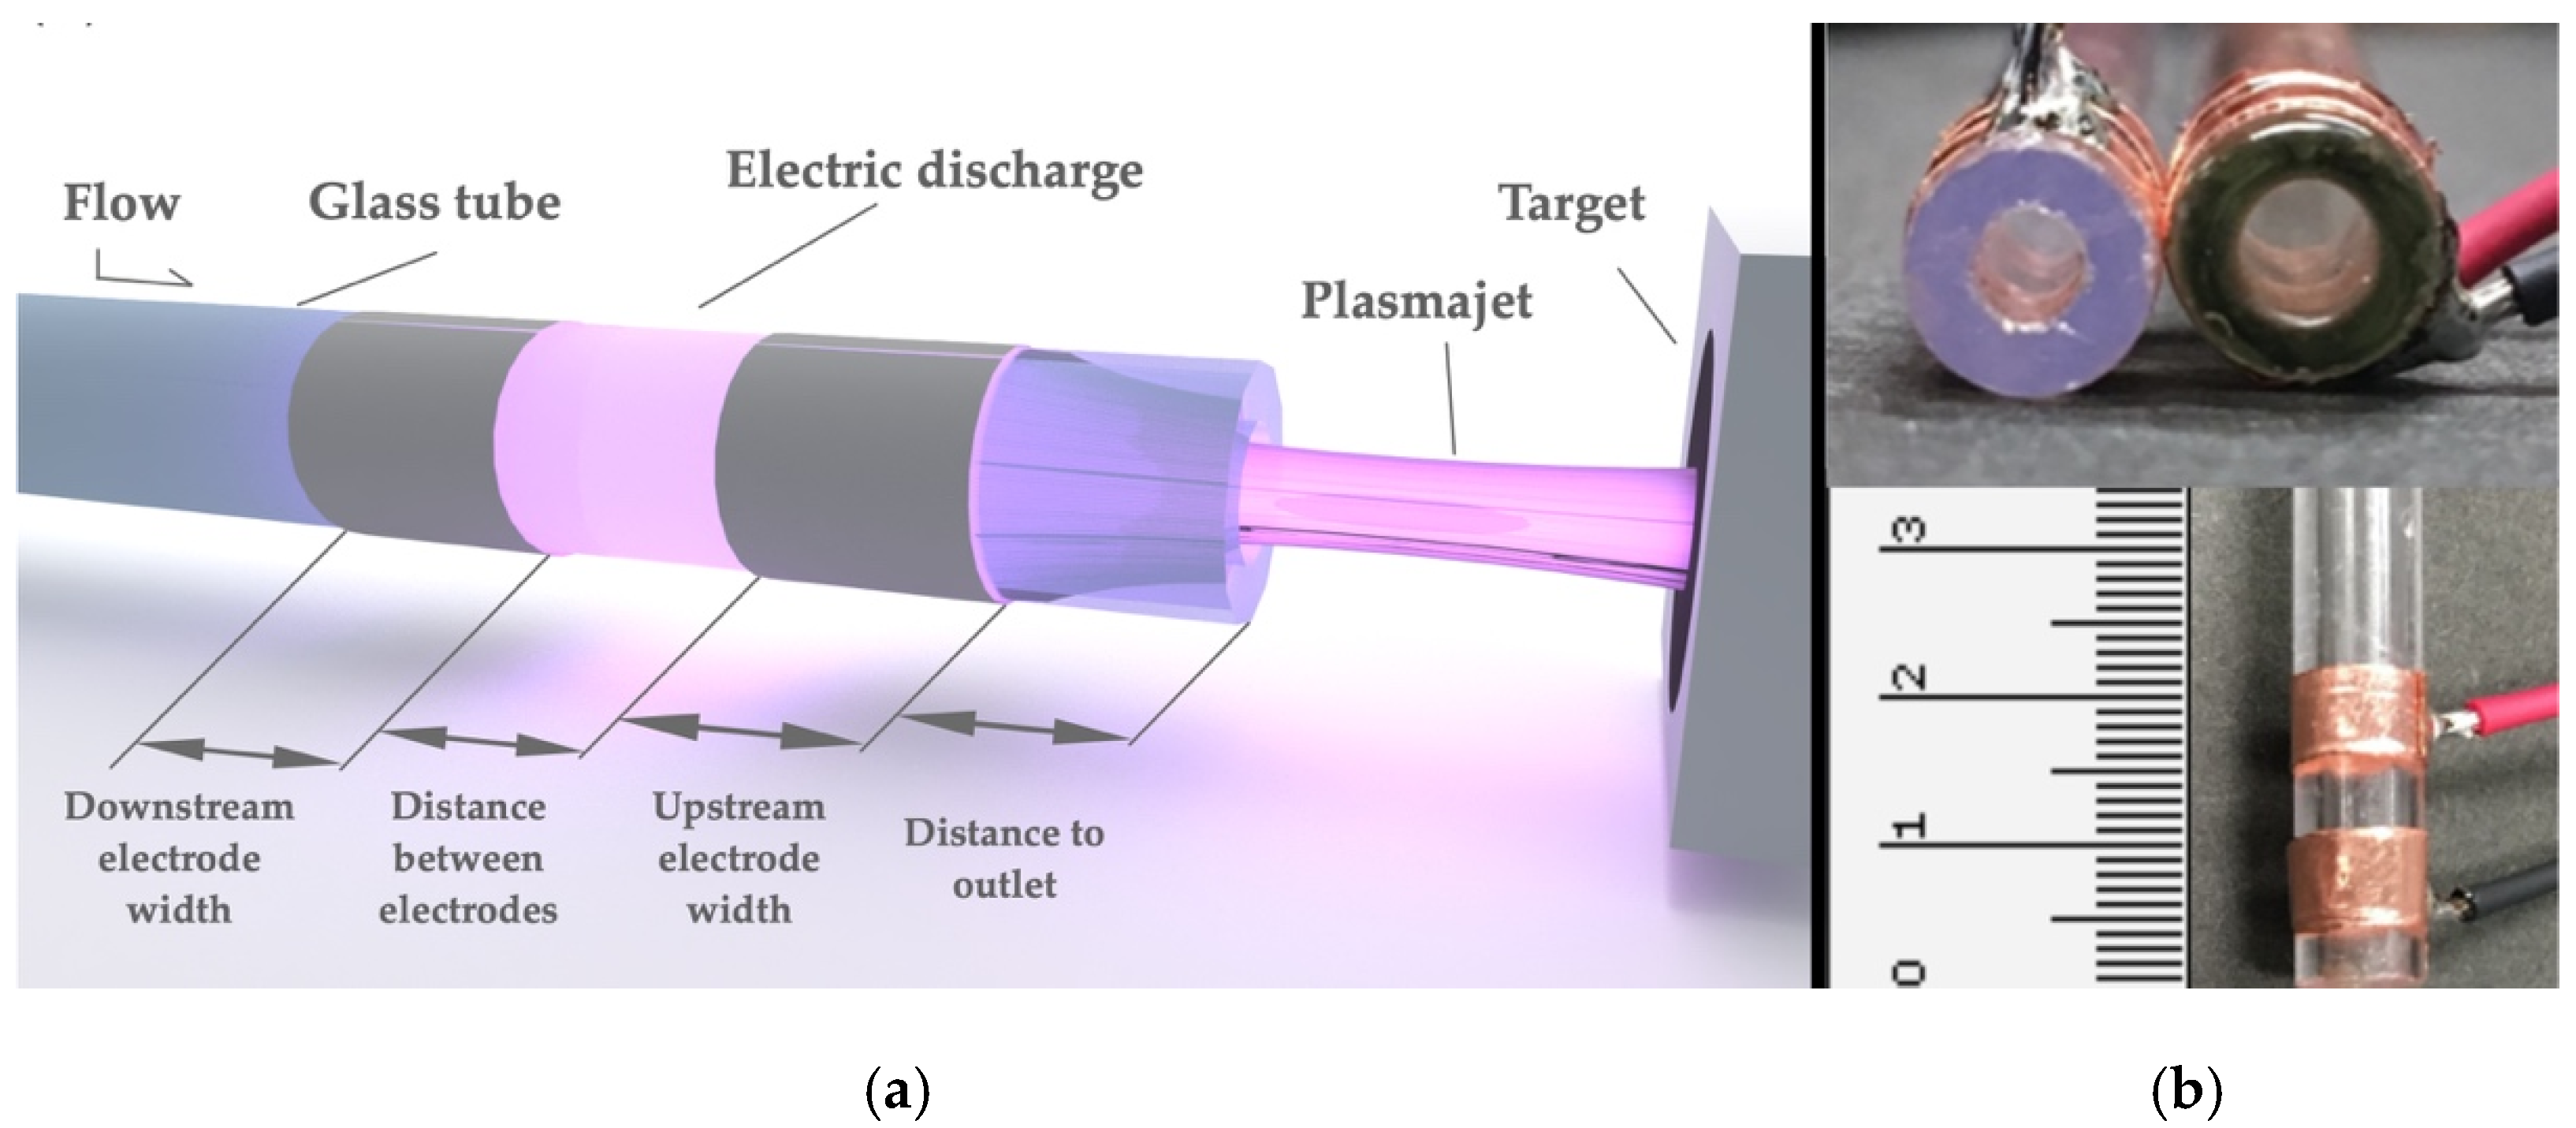
2.1.2. Plasma Jet Reactor Setup

There are various electrode arrangements for generating nonthermal plasma jets [16,17] and several modes of working gas excitation [9,18]. The safest configuration to prevent discharges between the high-voltage electrode and the treated surface is an electrode system with two dielectric barriers [16]; metal rings are placed on an insulating tube. A high-voltage power supply (see Section 2.2) connected to these rings creates plasma in the tube. The gas flow carries ionized particles out of the electrode system. Subsequent voltage pulses create additional current channels (including those directed toward the target), which form the jet. The properties of the excited species created in the gas flow are suitable for medical treatments at the outlet of the tube. Figure 1 shows an effective reactor structure.
This simple, low-cost solution has been used in many previous studies [19]. Having performed multiple evaluations using available parts and materials, we elected for the plasma reactor parameters in Table 1.
The input gas flow rate is a critical operating parameter. This value determines treatment efficacy and accounts for much of the operating cost. From an economic point of view, the optimal treatment solution is when the plasma is fully controlled at the lowest input flow rate, thus reducing the gas cost. Helium was selected as the input gas because it requires a relatively low ignition voltage at atmospheric pressure.

2.2. Power Supplies

We considered two power supply solutions. Both were in line with the electrical characteristics of the reactor. Firstly, we describe the equivalent circuit of the reactor and the method used to determine its electrical parameters. Secondly, both supply topologies are presented, and their electrical performance related to the reactor characteristics is highlighted.

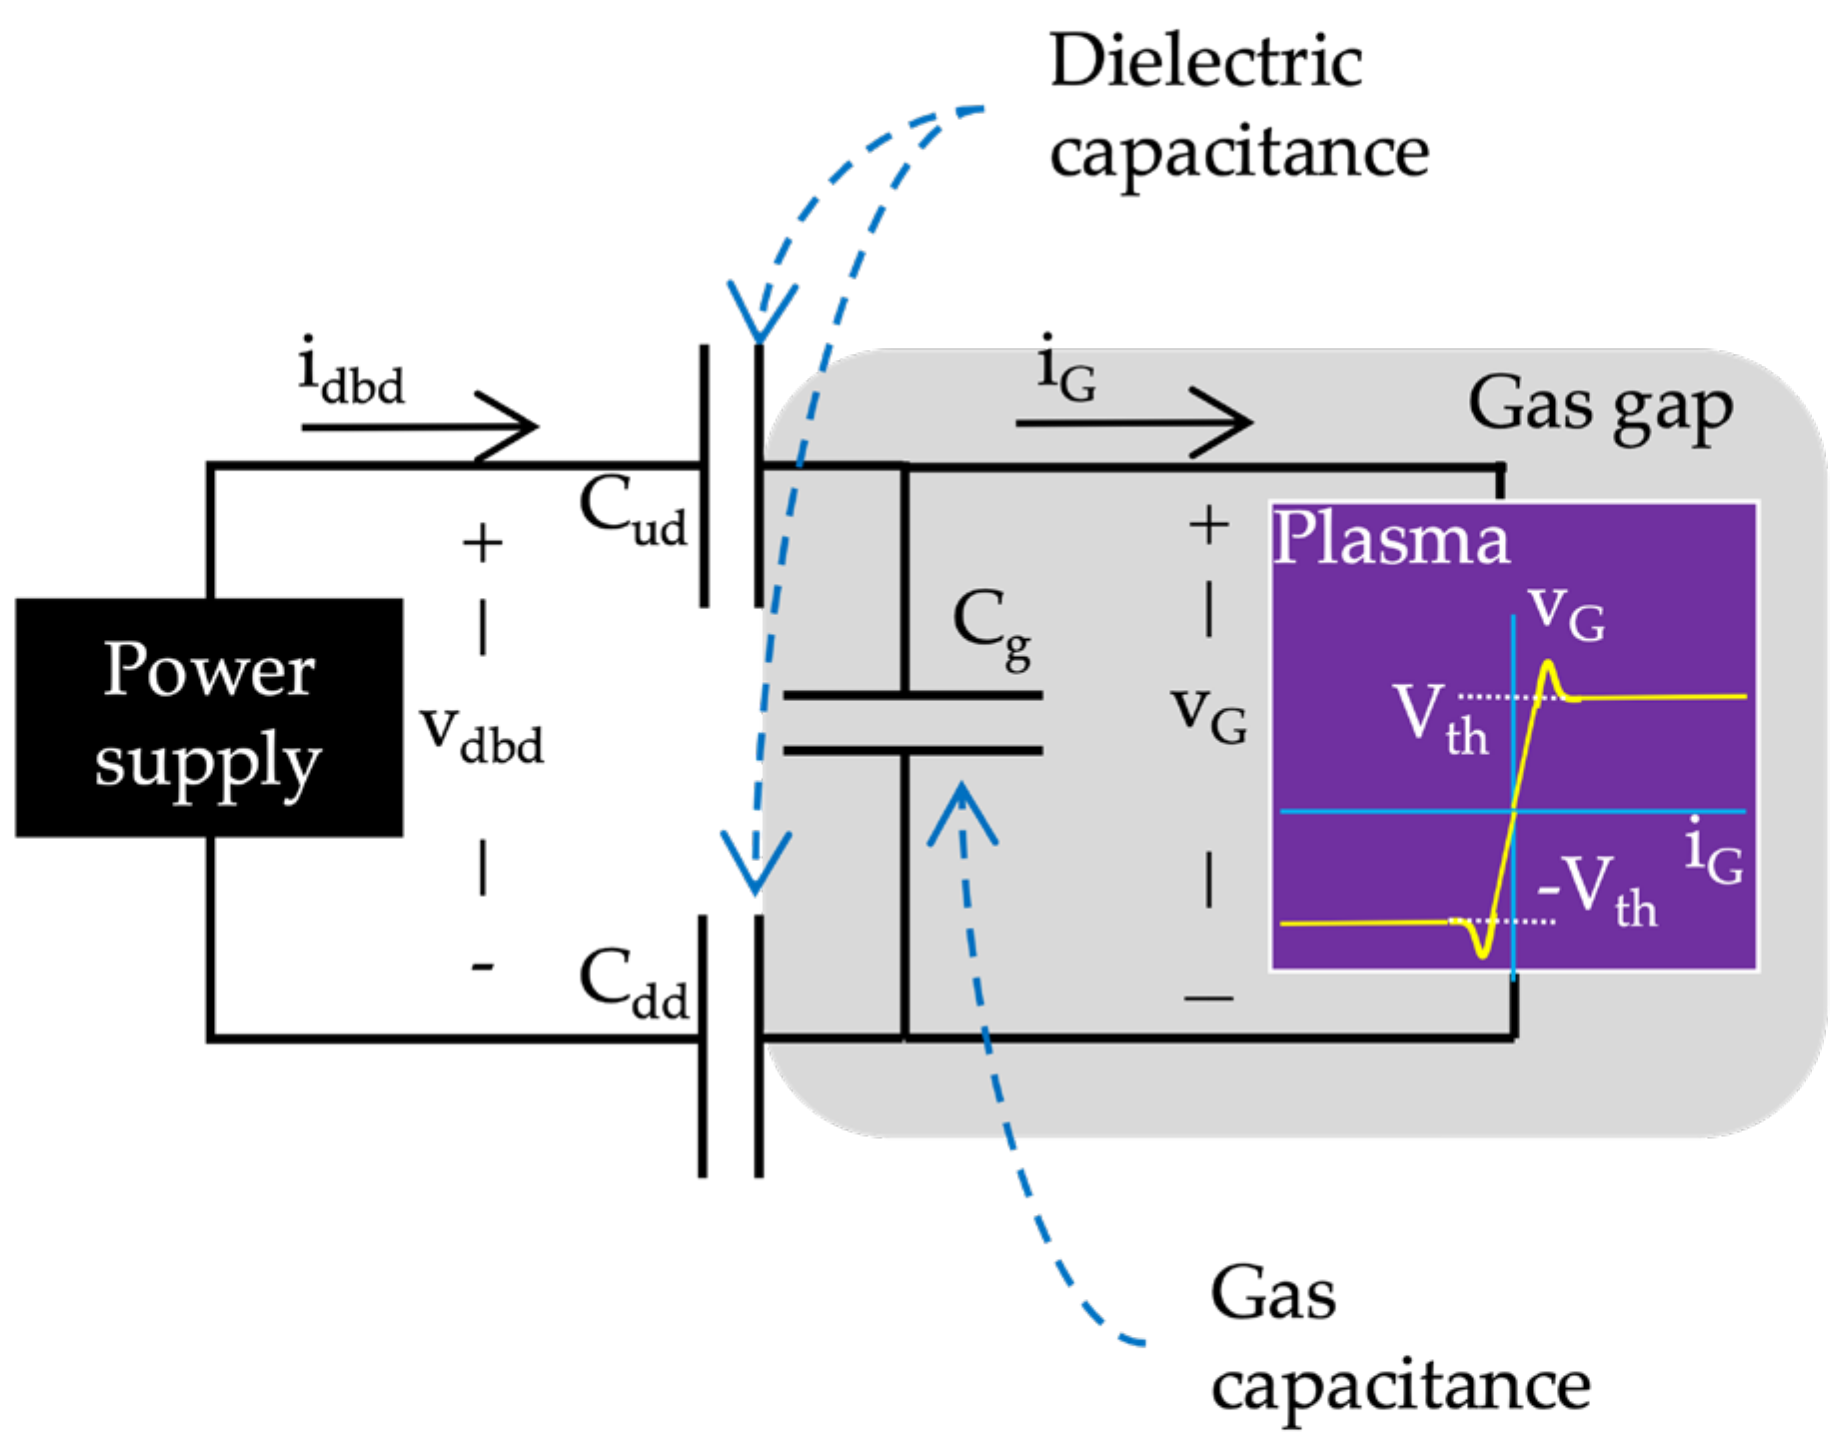
2.2.1. Equivalent Circuit of the Plasma Jet (DBD)

Figure 2 shows the conventional electrical model of a DBD reactor. This model has been successfully employed for modeling reactors with the gas fully contained between the electrodes, such as DBD lamps [13,20].
In the plasma jet, the gas is not confined between the electrodes. As the general arrangement of the reactor in Figure 1 shows, some plasma is produced outside the borosilicate tube. Part of the current injected into the reactor is diverted through the plume, and this is not accounted for in this conventional model. Nevertheless, the model can be used for an initial estimation of DBD parameters and power. More accurate and complex plasma jet models can be found in [9,21].
When the voltage applied across the DBD electrodes is too low to ignite an electric discharge in the gas, the reactor operates in the off state. In this state, the reactor is composed of capacitors connected in series (Figure 2). Capacitance values Cud and Cdd are the equivalent capacitance values of the dielectric barrier sections in contact with the upstream and downstream electrode rings, respectively. Capacitance Cd simplifies the series connection between Cud and Cdd. Since the gas conductance in this state is very low, the gas can be modeled by the equivalent capacitance of the discharge gap, Cg. In the off state, the DBD behaves as the series Ceq combination of Cd and Cg. In this state, the conventional DBD model is valid for the plasma jet.
When the applied DBD voltage creates the gas voltage, vG, which exceeds the Vth gas breakdown threshold, an electric discharge is produced, and the gas becomes ionized (on state). The DBD equivalent circuit in the on state consists of the Cd dielectric capacitance in series with the gas conductance, G. According to the gas conductance characteristics, the gas voltage remains almost constant after the electric breakdown. The DBD model in the on state can be simplified to a series connection of the capacitance, Cd, and a constant voltage source of the ±Vth value. As previously stated, this model is greatly simplified since the target current is not considered.
The Q–V Lissajous figure obtained for the voltage across the DBD, Vdbd, with the electric charge, Qdbd during T, the operation cycle of the supply, can be used to characterize the reactor, identify the values of its equivalent circuit (Figure 2), and determine the energy transferred to the plasma. The electric charge, Qdbd, is computed as the integral of the DBD current, Idbd, as defined in Equation (1).
Q d b d = 0 T I d b d t d t .
Figure 3 presents the Q–V Lissajous figure (usually named the “Manley diagram”) of the plasma jet reactor operating at Pdbd = 0.69 W, fsw = 100 kHz, Vin = 60 V, and flow = 1 L/min. The conventional model parameters (Cg, Cd, and Vth) are obtained as explained below.
As can be seen, the Lissajous figure forms a parallelogram. The upper and lower segments are acquired when the reactor operates in the off state, and their slope is related to the equivalent DBD Ceq capacitance in this state, described in Equation (2).
C e q = C g × C d C g + C d = d Q d b d d V d b d , O F F   s t a t e .
Conversely, the right and left segments are acquired when the plasma is ignited (on state). The slope of these segments determines the dielectric capacitance, Cd, in the conventional model. The differences between the ideal model and experimental data become evident at this stage. In particular, the left and right segments of the plasma jet figure are not straight. Therefore, a linear approximation of the segment is used to determine the dielectric capacitance, Cd (Equation (3)).
C d = Q d b d V d b d , O N   s t a t e .
Knowing Cd and using Ceq calculated according to Equation (2), the gas capacitance, Cg, is obtained. Finally, the breakdown voltage, Vth, is found according to Equation (4), using the charge variation in the off state.
V t h = Q d b d O F F 2 × C g , O F F   s t a t e
The total energy delivered to the DBD in one operating cycle, Edbd, is equivalent to the area enclosed by the Lissajous figure and can be calculated according to Equation (5):
E d b d = Q d b d . d V d b d = 4 V t h × C d × V d b d ^ V t h C g C e q  
where fsw is the frequency of the supply, and the total average power delivered to the DBD can be calculated as shown in Equation (6).
P d b d = E d b d T = f s w × E d b d = 4 f s w × V t h × C d V d b d ^ V t h C g C e q .
This result corresponds to the equation proposed by Manley [22]. The discharge power depends on the reactor peak voltage, V d b d ^ , not on the voltage waveform. V d b d ^   depends on the power supply topology.
We used this equivalent electrical circuit of the jet reactor to design the two different power supplies shown below.

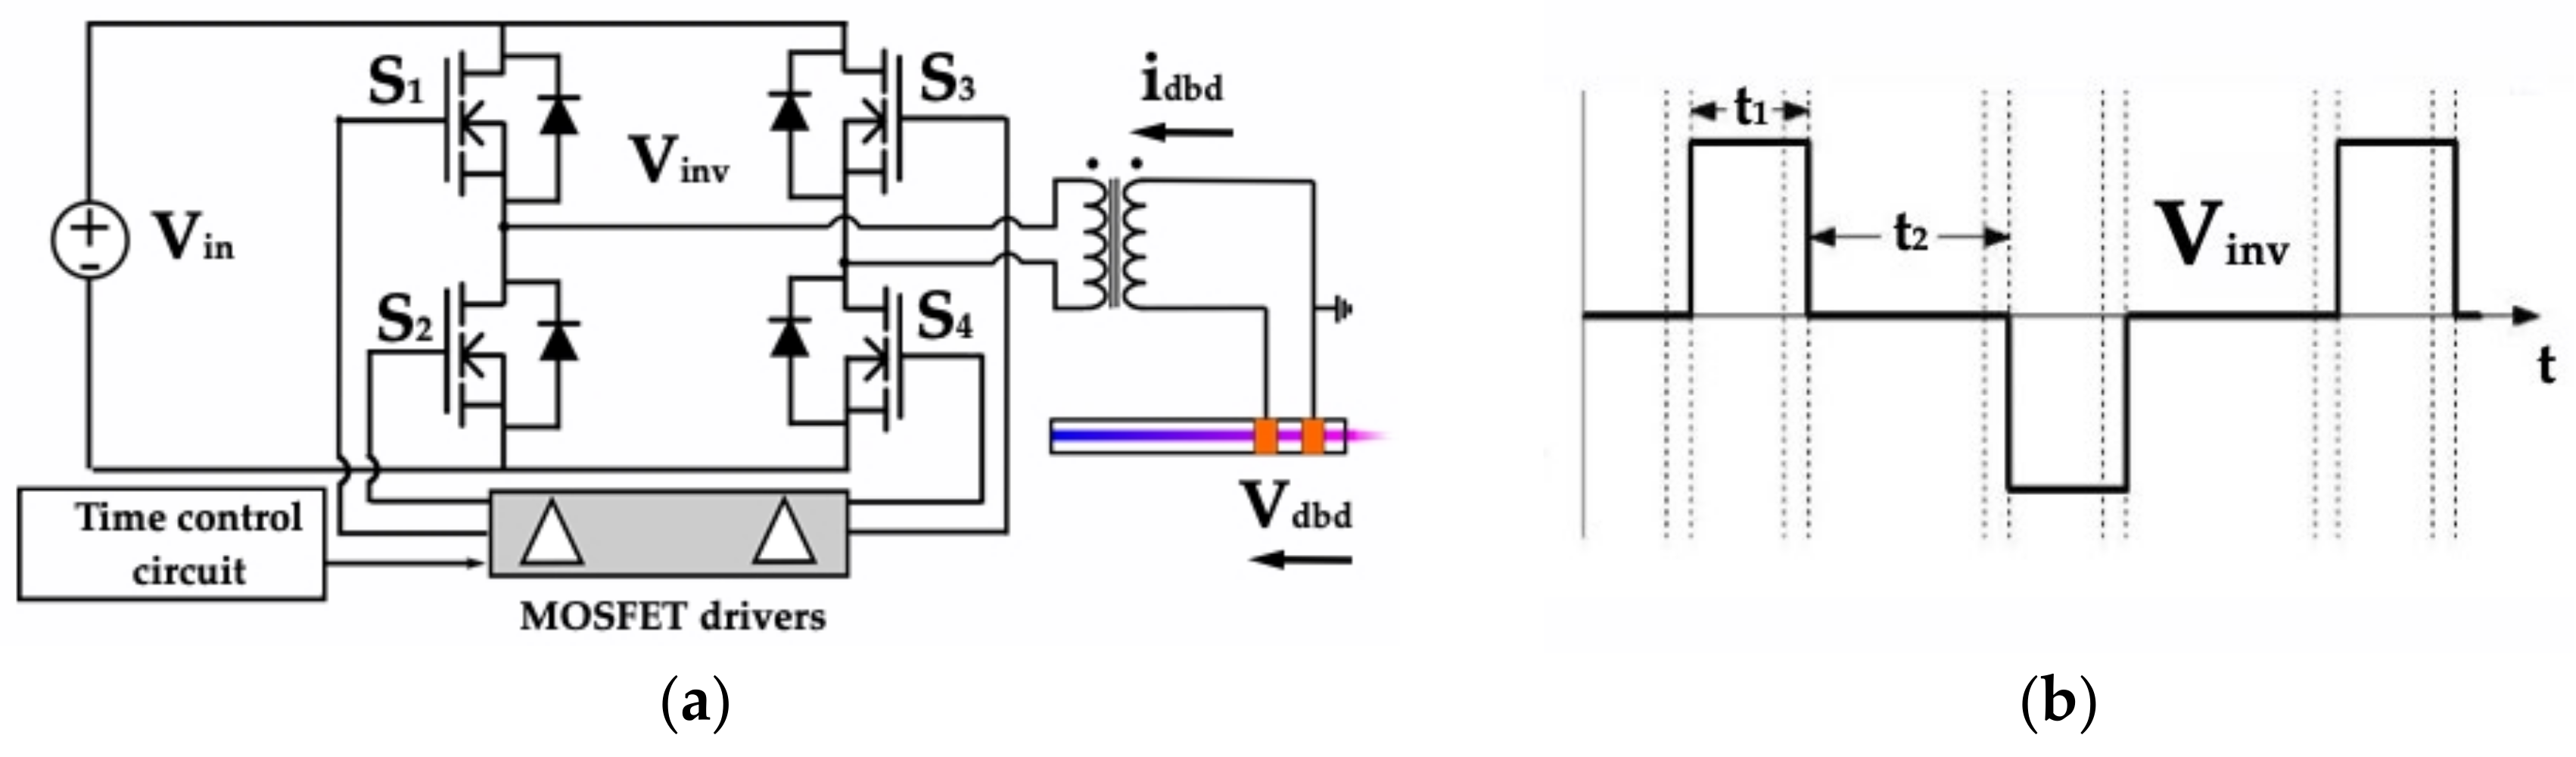
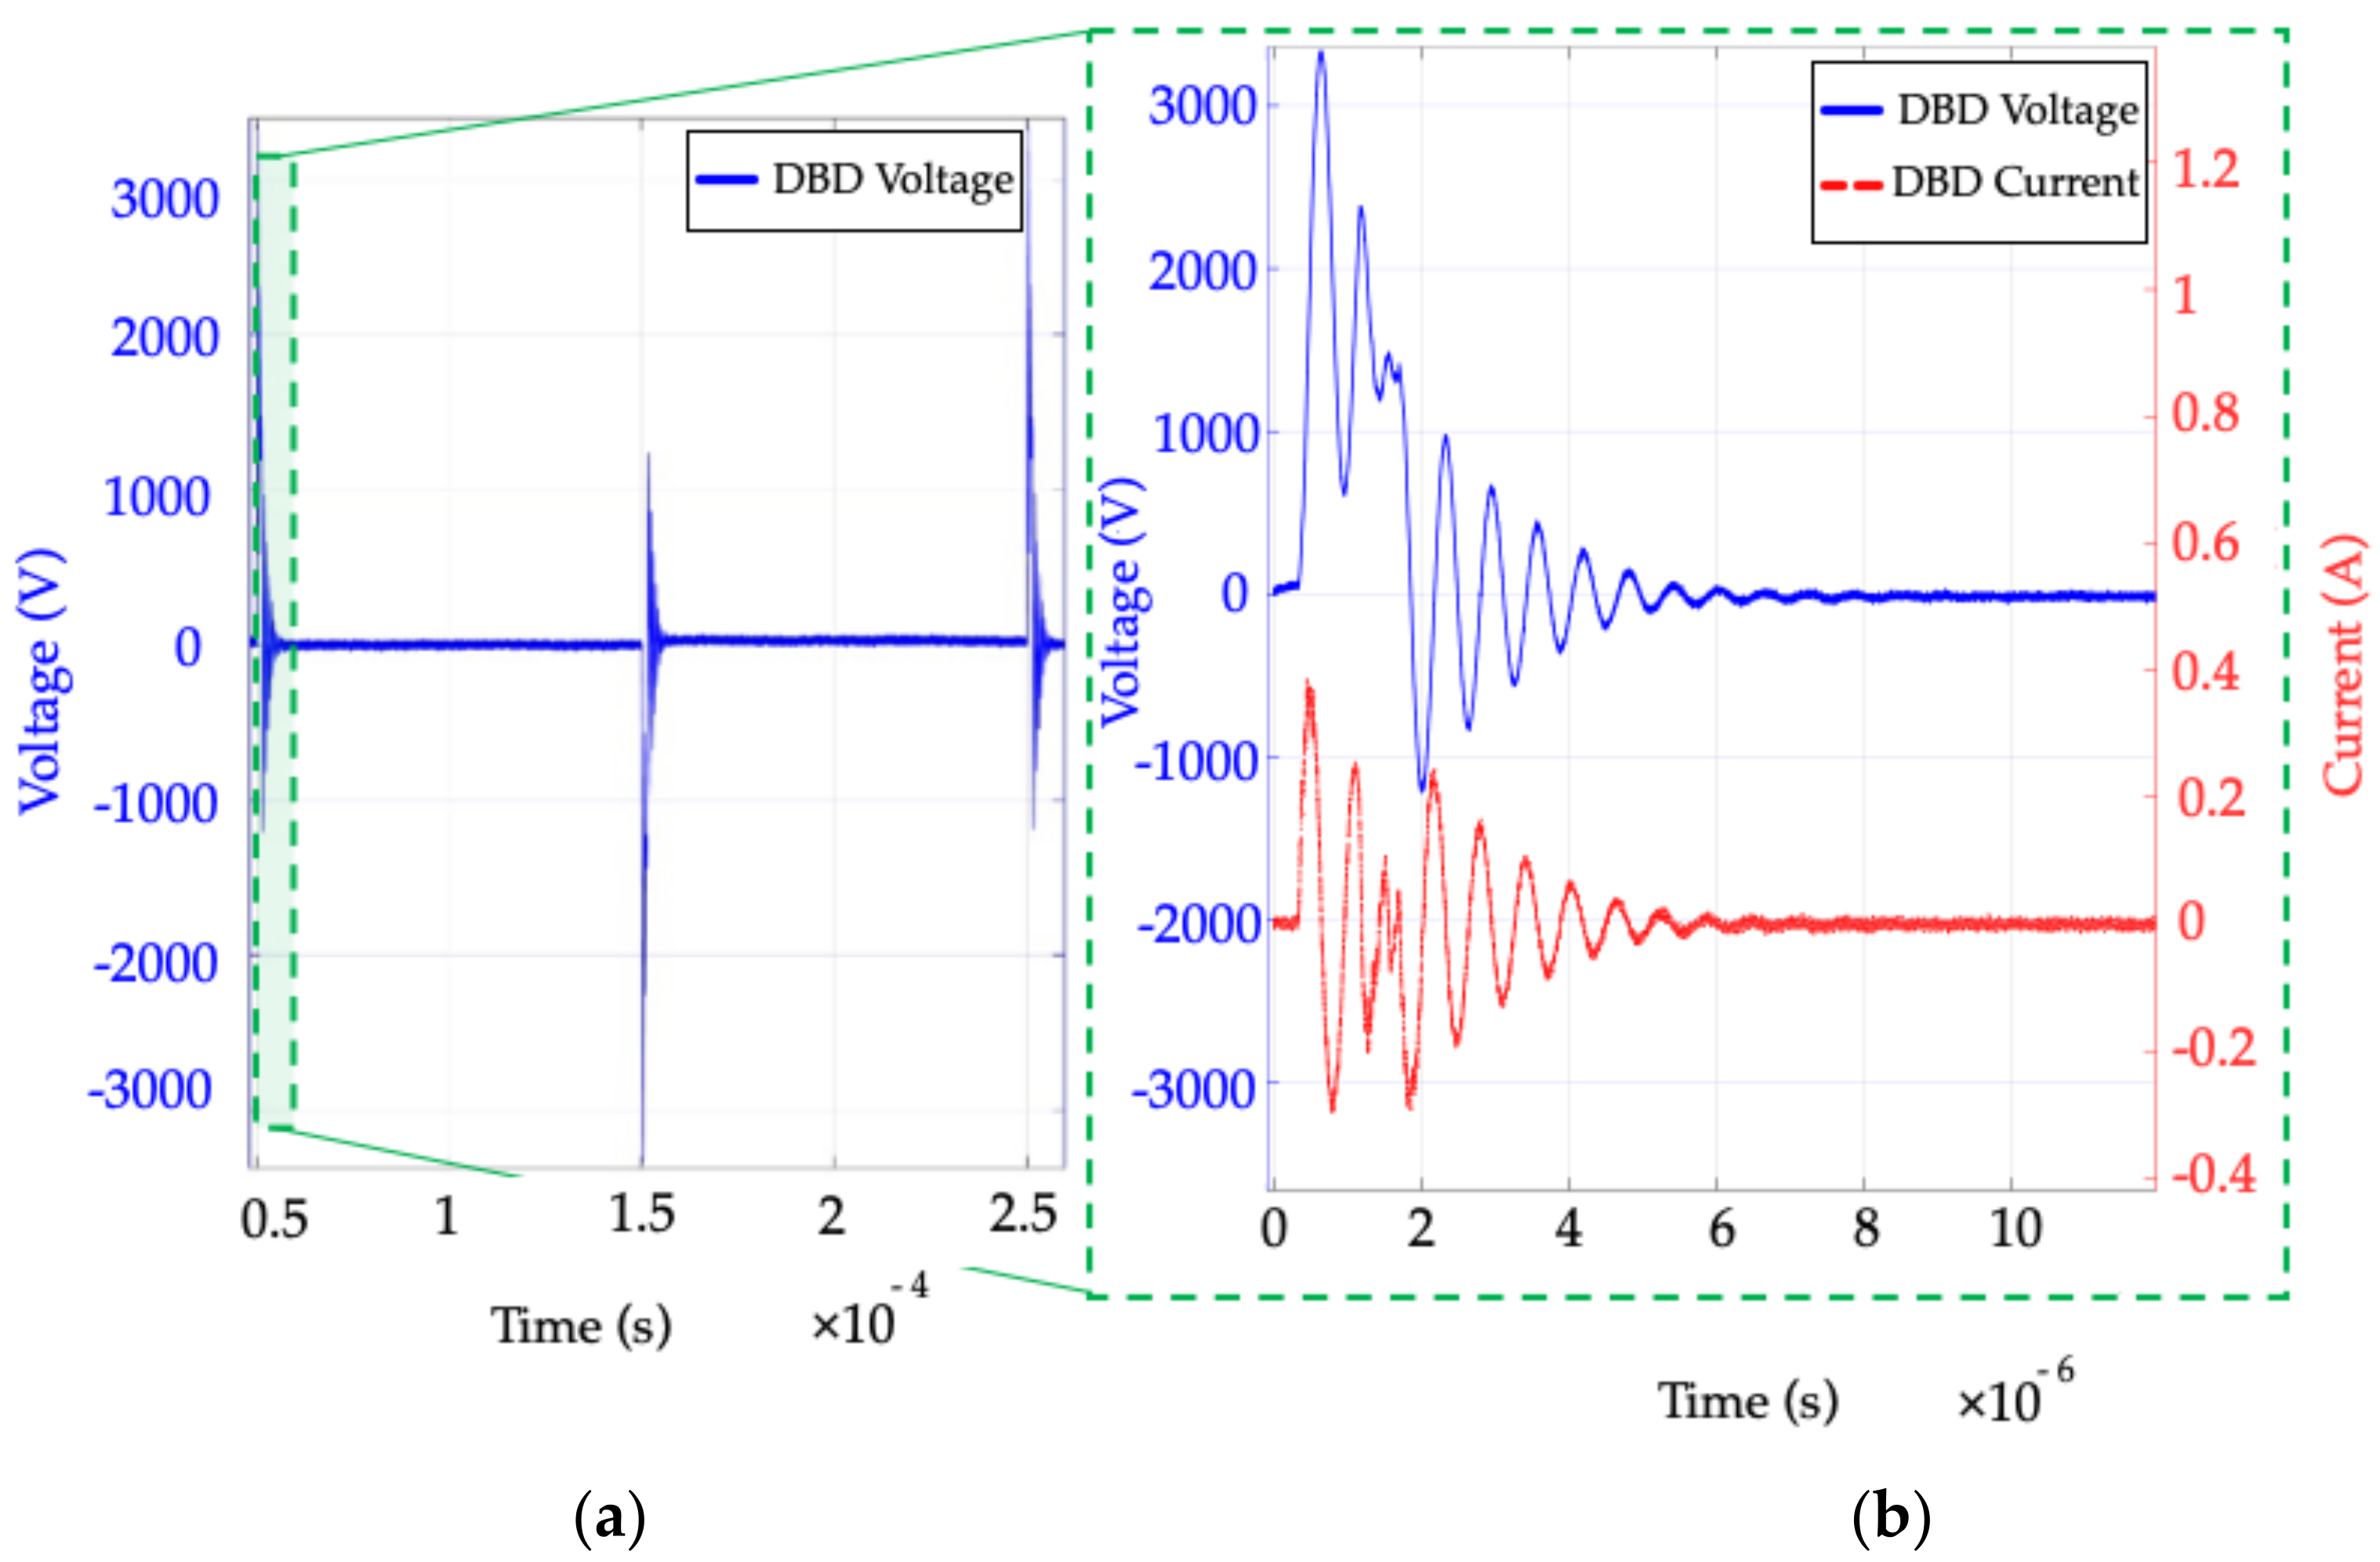
2.2.2. Bipolar Short-Pulse (BSP) Voltage Supply

The power supply, for which the circuit is presented in Figure 4a, is built around a voltage inverter [13], which controls its switching legs to apply short bipolar voltage pulses across the primary winding of a step-up transformer. The secondary winding is connected to the metal electrodes of the plasma reactor.
The waveform presented in Figure 4b is fully controllable as follows:
  • The magnitude of the positive and negative levels is linearly adjusted using the Vin voltage; the typical range is 100–300 V.
  • The pulse duration (t1) is adjustable in the range of 0.75–1.5 µs.
  • Frequency varies in the range of 5–20 kHz, considering the limitations of the step-up transformer. The latter provides an additional degree of freedom with regard to designing the system through its turns ratio; the selected turns ratio is 1:10.
The purely theoretical waveform of Vinv (Figure 4b) is applied to the primary winding of the transformer, which introduces parasitic elements into the circuit, mainly leakage inductance, forming a resonant circuit with the capacitive characteristic of the plasma jet reactor. Figure 5 shows the experimental waveforms of the voltage, Vdbd, and the current, Idbd. The resonant behavior of the circuit is responsible for the damped oscillations.

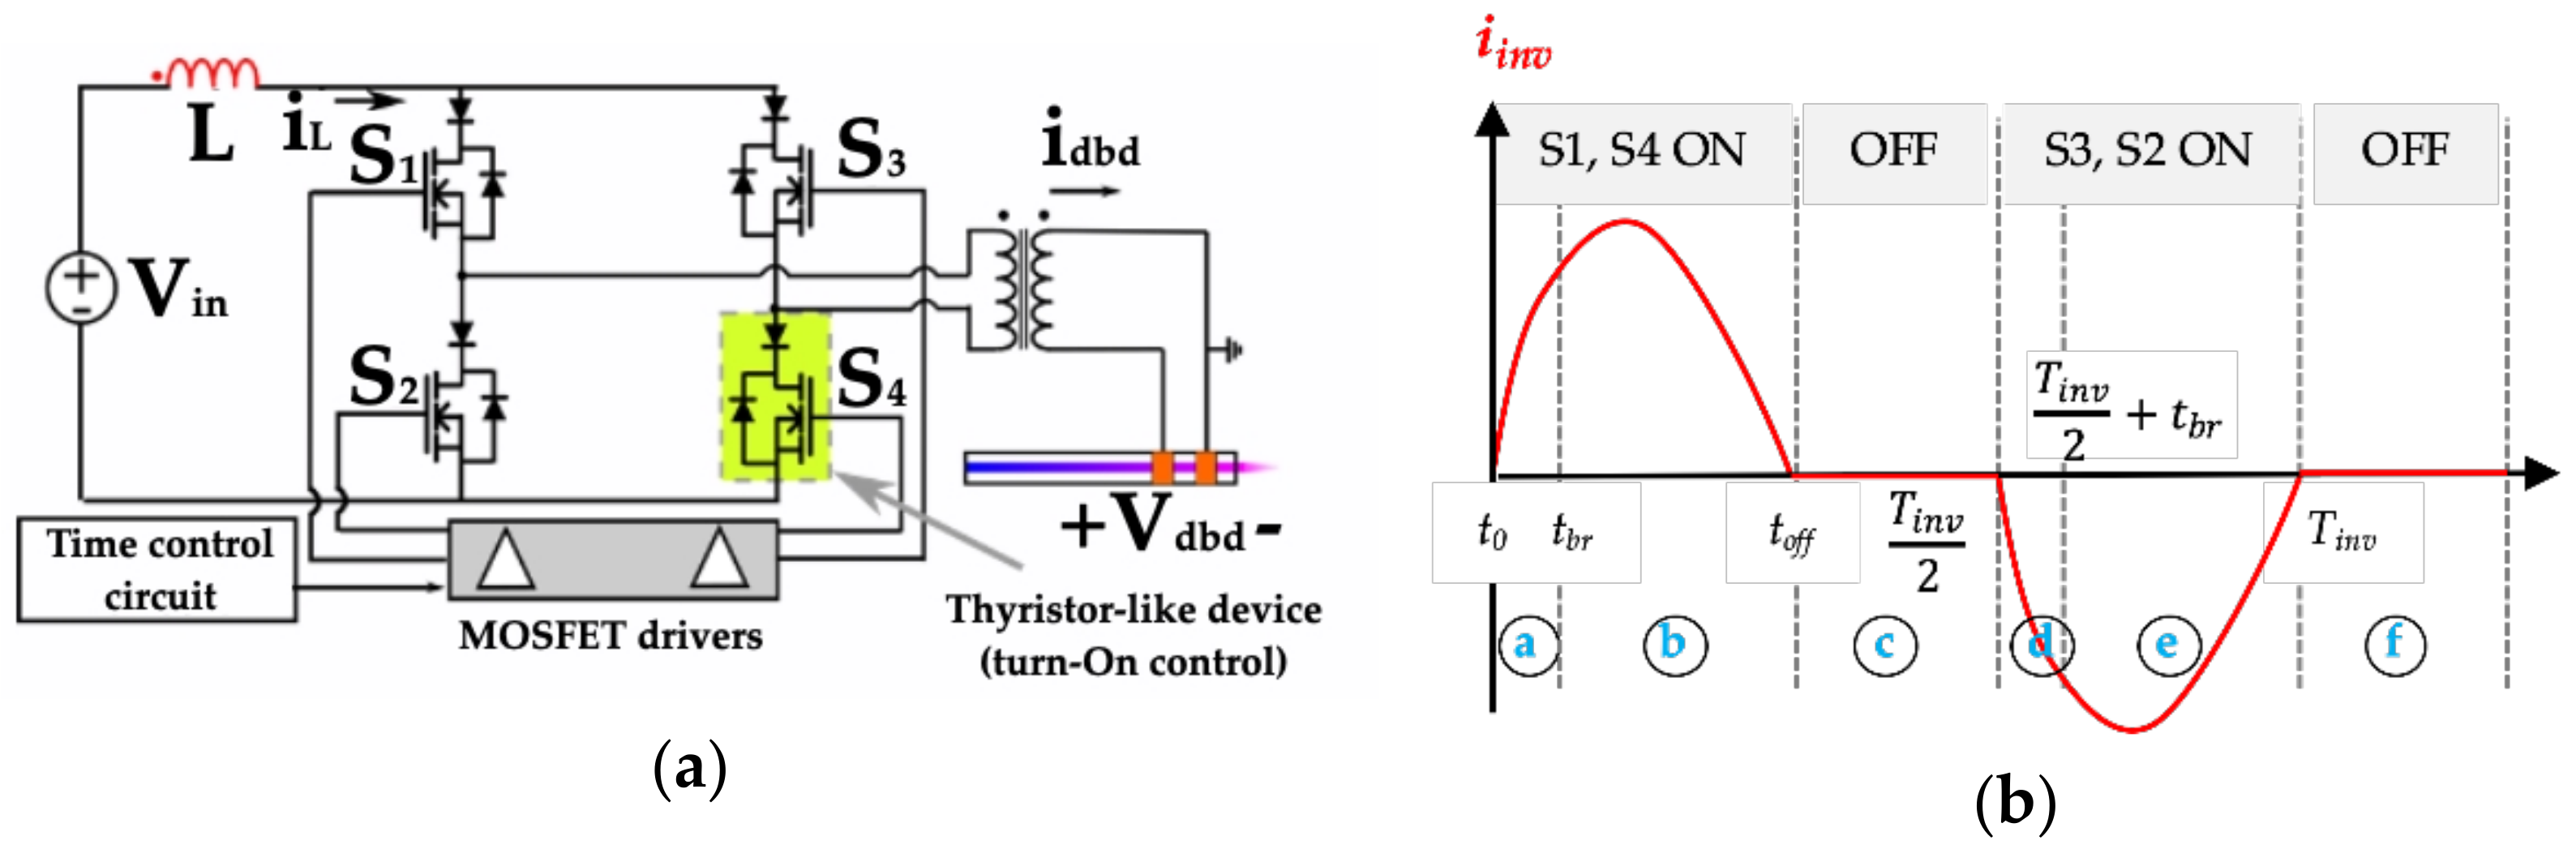
2.2.3. Series Resonant Inverter (SRI) Current Supply

The SRI produces DBD current pulses with a longer duration than the other topologies (around several μs). In the SRI topology, the inductor, L, is connected in series (through a current inverter and a step-up transformer) with the capacitive jet reactor, producing a resonant circuit and a quasi-sinusoidal waveform current, the resonance frequency of which determines the DBD current pulse width. A higher L value results in a longer current pulse.
Figure 6 shows a full-bridge current inverter and a step-up transformer connected between L and the jet reactor used to provide the required symmetrical AC current to the DBD. Additionally, the transformer reduces the voltage stress on the semiconductor switches. When switches S1 and S4 are on, a positive current pulse is injected into the jet reactor, followed by a blanking time until switches S2 and S3 are turned on, injecting a negative current pulse of the same intensity as the previous pulse (Figure 6).
The inverter has unidirectional spontaneous turn-off switches to attain high efficiency and to control the delivered power. This arrangement allows ZCS operation, blocks additional oscillations, and guarantees the discontinuous conduction mode (DCM).
The bridge switching frequency, fsw, determines the frequency of the DBD current (45–100 kHz in the present case) [13]. The DCM feature (Figure 6b) makes it possible to predict the energy injected into the jet during each current pulse, using Equation (7).
E d b d = 4 V t h × C d 2 V i n V t h + ξ g
where ξ g is a value associated with the gas capacitance, Cg, which is negligible in most cases. The power delivered to the jet, linearly proportional to the bridge operating frequency, fsw, is calculated using Equation (6).
More details on SRI operation for DBDs can be found in [20]. As for the BSP voltage power supply, the measured waveforms on the secondary side of the step-up transformer, presented in Figure 7, exhibit the impact of the couplings between the parasitic elements of the transformer and the capacitive load.

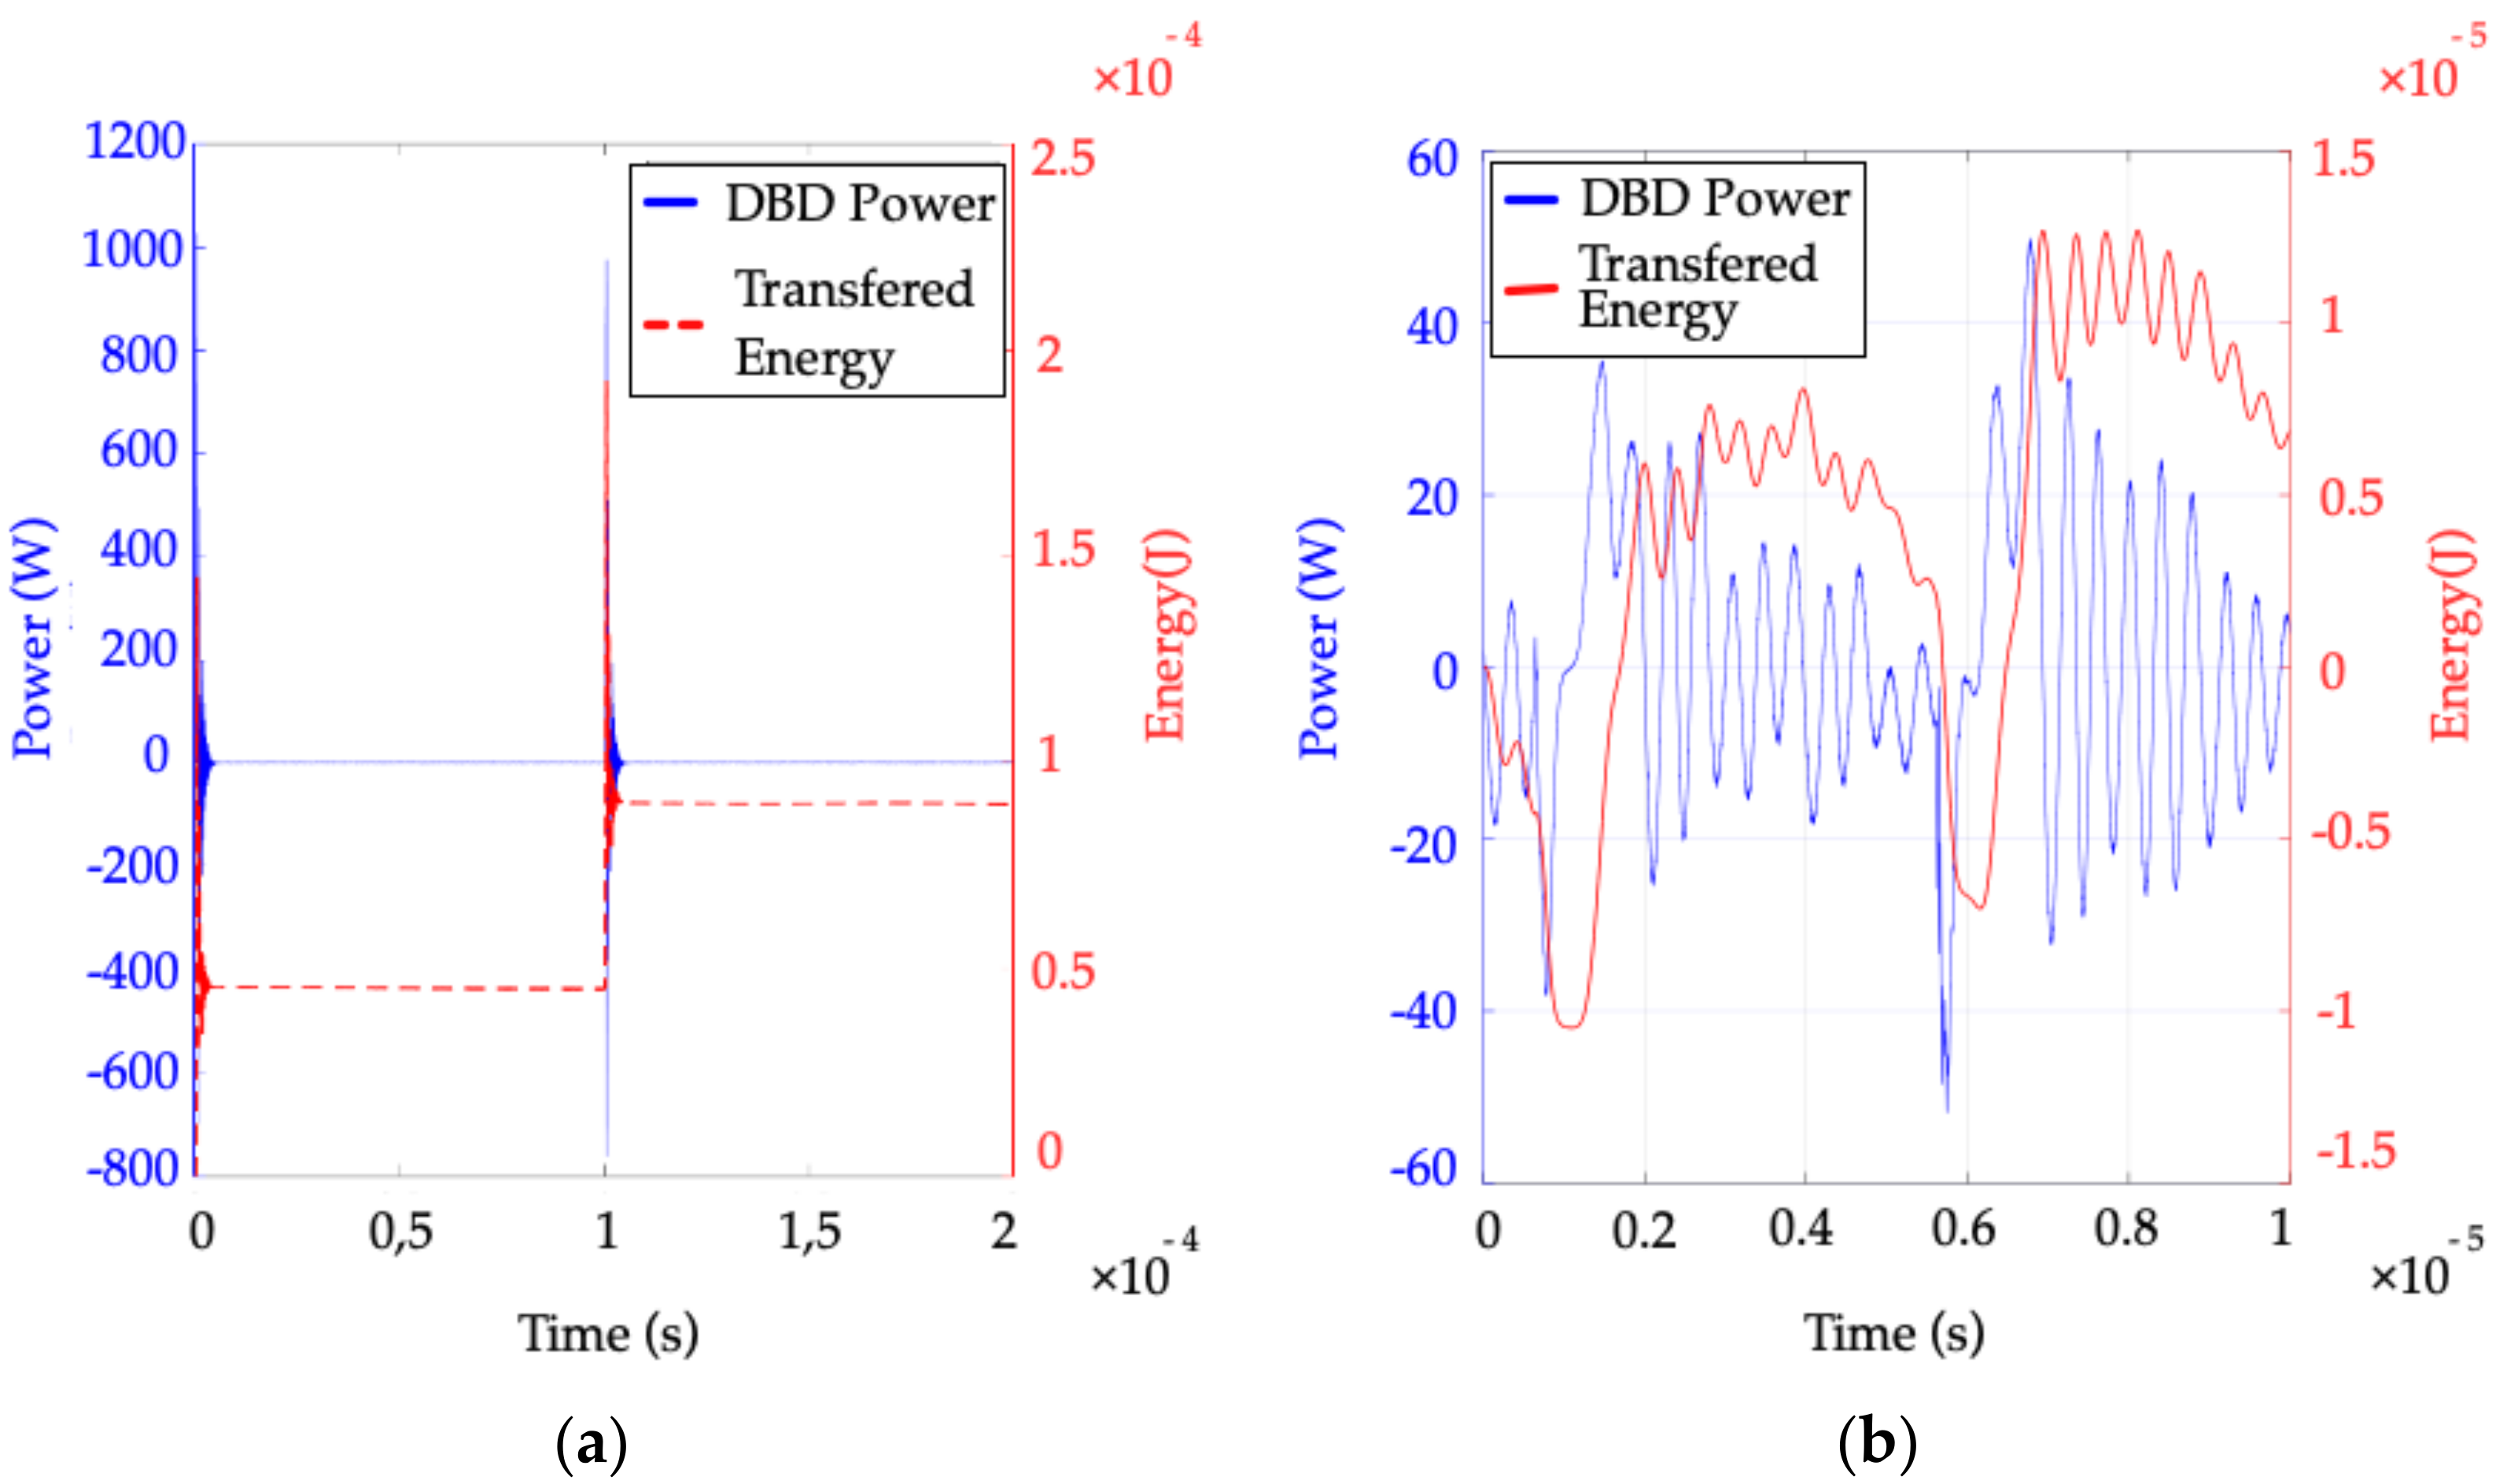
2.2.4. Power Injection, Energy Transfers, and Control of Supply Operation

The plots in Figure 8 show the difference in the power injection obtained using the two power supplies. Figure 8a shows the BSP power supply providing power spikes (blue curve), which occur only at the edges of voltage Vdbd and energy (Edbd, red curve), which increases stepwise.
The SRI power solution with parameters provided in Figure 8b provides a much more continuous power injection (blue curve) almost throughout the current pulses. The injection is followed by oscillations mainly involving the parasitic components of the high-voltage transformer. Nevertheless, net power injection due to such oscillations is null. As the red curve shows, the shape of the energy, Edbd, presents a stepwise profile, as for the BSP.
Control of the power injection features is different for the BSP and for the SRI supplies, as outlined below.
  • The BSP voltage supply allows adjustment of the jet power, using three degrees of freedom (DOF): the input voltage, Vin, the bridge switching frequency, fsw, and the pulse duration, t1. As indicated previously, the DBD jet is capacitive; thus, its current depends on the rise and fall times of the voltage pulses, as does the jet power, Pdbd. The switch response times and transformer parasitic elements affect the rise and fall times of the voltage pulses delivered to the jet, making it difficult to determine the output power analytically [13]. The output power, however, can be estimated using Manley’s diagram or Equation (6) to find out the energy transferred to the plasma over one period. The average power is then calculated using Equation (5). In practice, due to parasitic elements of the circuit, the DBD peak voltage used in Equation (5) is difficult to define accurately. The input voltage, Vin, is adjusted to obtain the desired average power. The power injection pause (the time interval during which no energy is injected) plays an important role in the efficiency of the DBD-driven process [12]. In the BSP, t2 (see Figure 4) is set directly by the inverter’s control board.
  • As the previous section shows, two DOFs are available in the SRI for operating condition control: the input voltage, Vin, and the bridge switching frequency, fsw. However, the current pulse duration is fixed and depends on the L value. As stated in the comment for Figure 8, power delivery is much longer (throughout the current pulse), and the power injection pause interval is the difference between the operating period and the duration of the current pulse; this is a much lower percentage of the Tsw period than for the BSP converter.
Concerning system control by means of the Vin DC voltage, it is important to reiterate that the properties of the two converters are different. The SRI topology is a (voltage) step-up converter; hence, the acceptable range for the Vin voltage is 70–90 V. The BSP, on the other hand, is a step-down converter and requires a voltage, Vin, greater than 160 V with the selected high-voltage transformer (turns ratio 1:10).
Burst mode operation: Burst mode is used to introduce and control a low-frequency (with respect to the fsw supply frequency) power injection pause in the SRI supply, which makes it possible to obtain a dimming functionality; it is also applicable to the BSP. In this operating mode, a burst (or train) of MBurst semi-resonant pulses (pulses delivered at the fsw frequency) is generated, followed by an idle time without any excitation of the DBD (Figure 9). In the steady state, each pulse of the burst provides the energy described in Equation (7). Hence, the total burst energy is given in Equation (8).
E B u r s t = M B u r s t × E d b d
After the MBurst burst pulses, the full bridge remains off during the idle time, Toff, which is determined by the low-frequency (fBurst) signal modulating the high-frequency (fsw) switching of the inverter. The average jet power is calculated throughout the burst modulation period TBurst using Equation (9).
P d b d T B u r s t = f B u r s t × M B u r s t × E d b d
f B u r s t = 1 / T B u r s t = 1 / T s w × M B u r s t + T o f f
Figure 9 shows that the DBD voltage during the idle time has a damped oscillation, which is a consequence of the transformer magnetizing inductance coupled with the jet capacitance. As a result, the voltage returns to a low value; for the specific case of the experiment shown in this figure, the steady state is not achieved during the 11 burst pulses of this experiment, resulting in a more complex theoretical computation of the injected power.
However, as pointed out in Figure 9, the burst mode offers a very useful advantage, as the energy injection is controlled on two different timescales:
  • With the short Tsw timescale of the power supply operation (high-frequency fsw), Edbd is controlled by the parameters shown in Equations (5) and (7).
  • At average values, considering TBurst = 1/fBurst time (much longer than Tsw; see Equation (10)), the injected power is adjusted using the MBurst and Toff variables, with Equations (9) and (10) in the low-frequency domain, at fBurst.

3. Results

This section summarizes the results. Firstly, we present the test bench developed for the analysis, as well as its control tool. Secondly, the experimental performance is described and discussed.

3.1. Test Bench

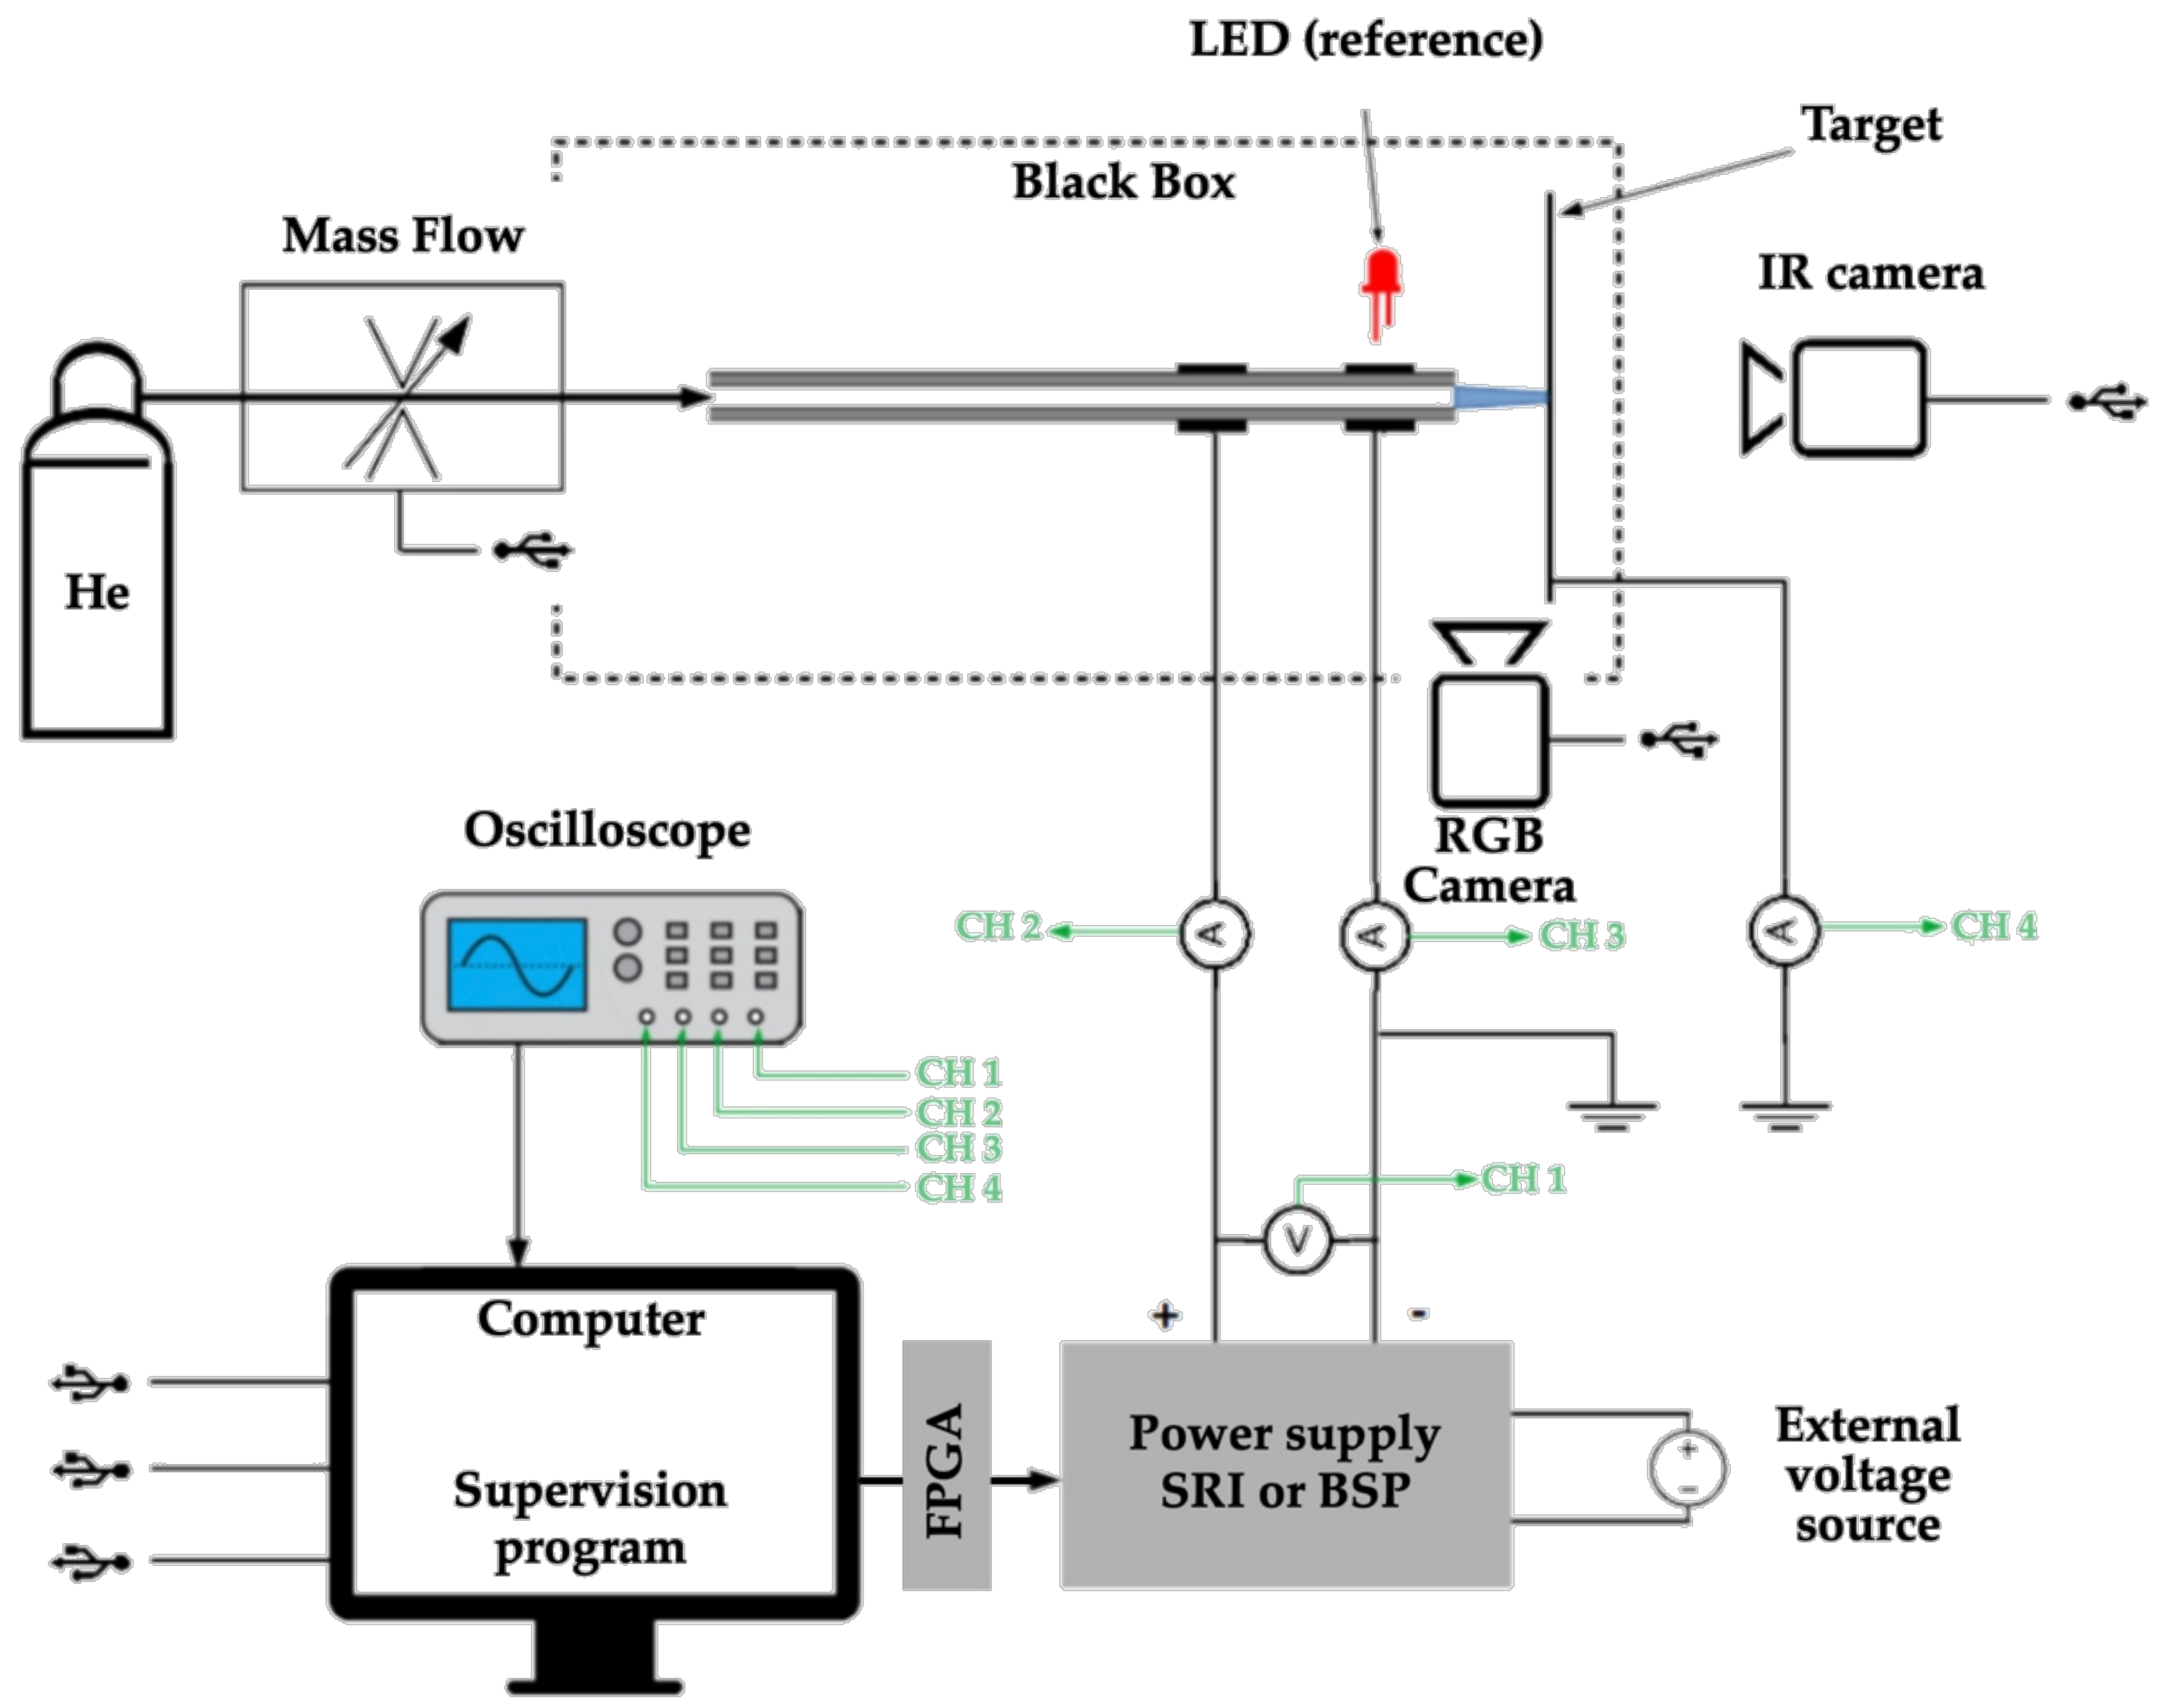
3.1.1. Overall Setup

An experimental test bench was set up to investigate system performance, with two main constraints:
  • Good ability to reproduce tests with selected operating conditions;
  • Full storage of the experimental records and conditions under which these records were obtained.
As Figure 10 shows, the bench comprised a plasma jet supplied with helium. The gas inlet was controlled using a mass flow controller.
The jet electrodes were electrically supplied using one of our two power supplies (BSP or SRI), the operation of which was controlled via an FPGA board.
The supervision computer controlled the gas supply (mass-flow controller) and the electrical conditions via the FPGA board. It received several sets of measurements:
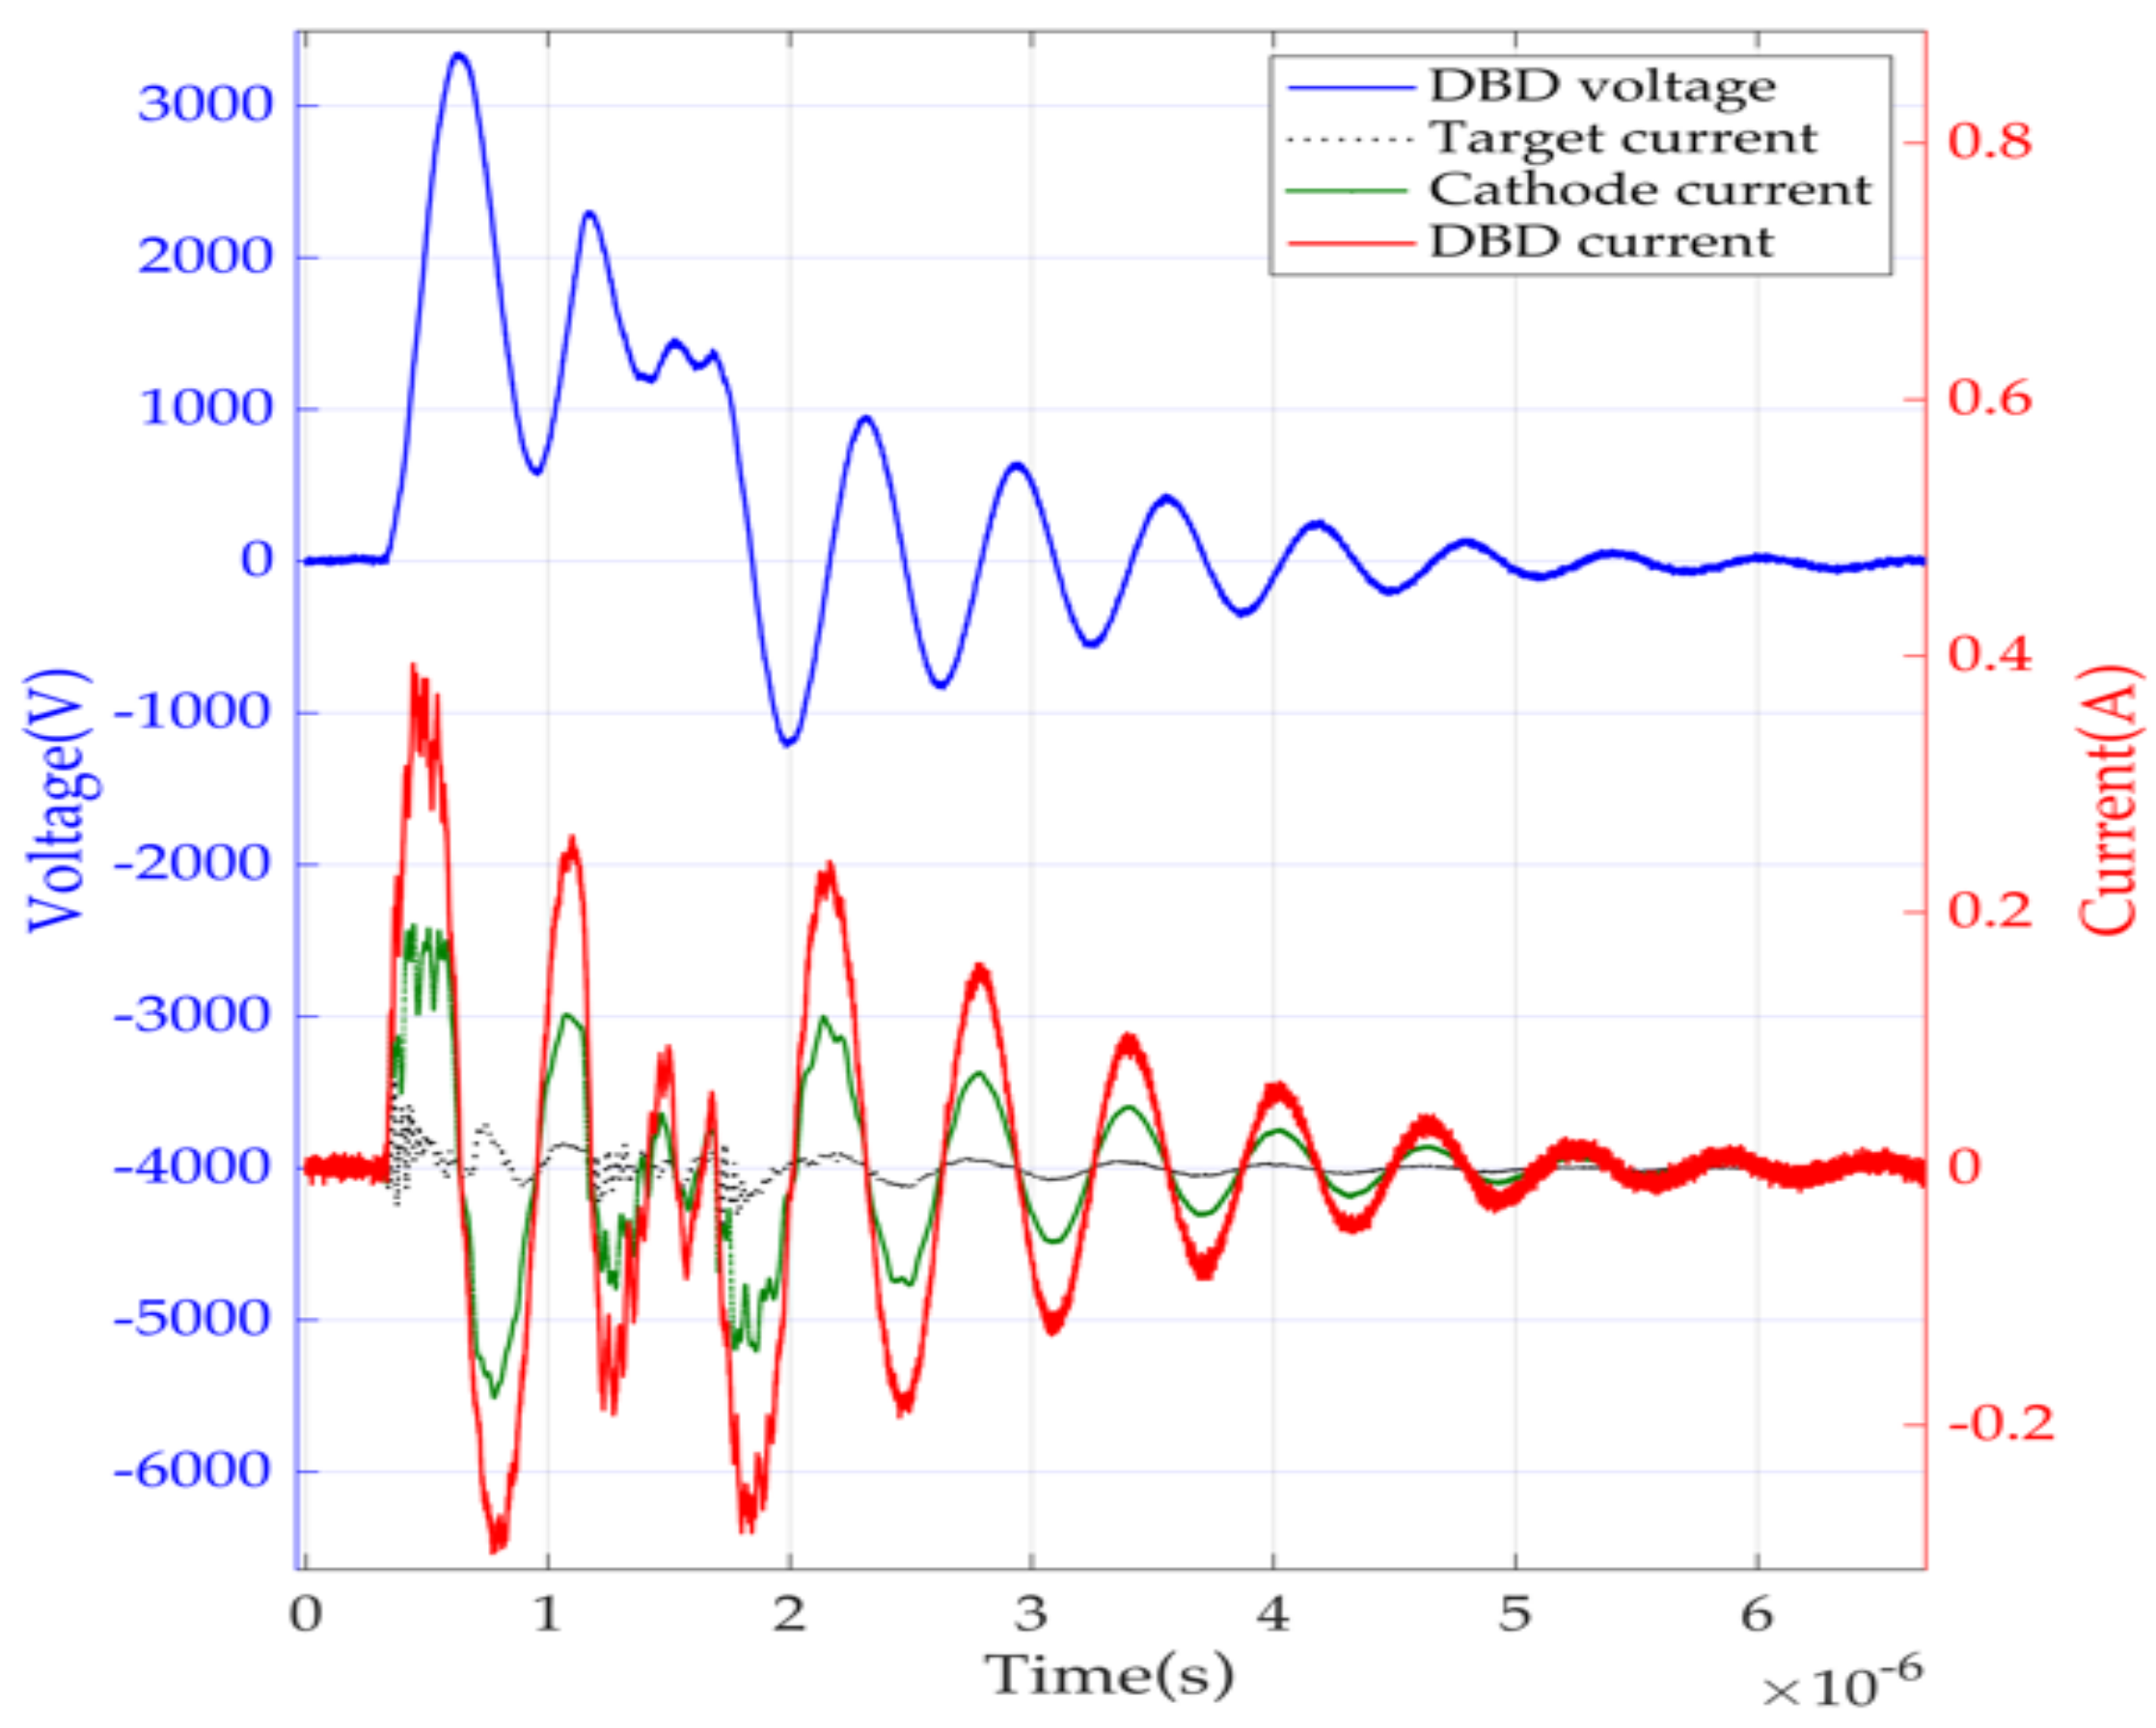
  • An oscilloscope provided full measurements of the electrical conditions: Vdbd (channel 1 in Figure 10) and Idbd, measured on both electrodes (channels 2 and 3). The current flowing from the screen target (copper foil connected to the ground) was also measured for jet electrical diagnostics (channel 4).
  • An IR camera focused on the rear side of the copper foil target measured the temperature.
  • A digital RGB camera took pictures of the jet to measure its dimensions. The jet and the camera were installed in a closed box painted black to enhance the images.

3.1.2. Measurements

The oscilloscope was a Teledyne Lecroy HDO4024 used with Testec TT-SI-9010A differential probes allowing high-voltage measurements up to 7 kV and with Pearson probes for current measurements up to 5 Arms. The accuracy of synchronization between the voltage and current measurements, which is essential for power calculation precision, was checked using a DCS015 calibration source.
A Bronkhorst F-201CV-5K0 mass-flow controller adjusted and measured the helium flow rate. This device allowed a flow range from 0.04 to 5 L/min.
An FLIR E75 IR camera was used to take temperature measurements. It captured the back of the target to acquire its temperature distribution when exposed to plasma. The temperature range was from 20 to 40 °C, i.e., the range of interest for our application.
An Ocean Optics HR4000 fiber-optic spectrometer was used for spectroscopic analysis to identify the plasma composition.
The digital camera was a Sony (1/3.2”) IMX179 with a 5–50 mm varifocal lens. The camera focus was adjusted manually for better accuracy. Settings did not change automatically during the operations. Jet images were taken for further investigation of the jet geometry (length and spot diameter).

3.1.3. Supervision and Post-Treatments

The LabVIEW program (whose user interface panel is shown on Figure 11) running on the supervision computer enabled the following:
  • Configuration of all the devices;
  • Monitoring of data acquisition. Each operating condition was characterized by a series of at least five different sets of measurements, allowing experimental identification of margins of error;
  • The setup and monitoring of measurement batches with variations in the operating conditions: gas flow and common and specific parameters to the BSP or SRI power supply (Vin, fsw).
  • Storage of a whole set of data for each operating point as follows:
    The configuration of each device, making it possible to reproduce any experiment;
    Storage of all the electrical waveforms (raw numerical data and oscilloscope screen copies);
    Storage of all jet measurements (temperature, geometry, and spectroscopy results).
  • Start of post-treatment calculation scripts;
  • Organization of all the parameters and measurements into a database.
Post-treatment scripts, developed using Matlab and Python, were used (a) with electrical measurements to build a Q–V Manley diagram and identify the parameters of the plasma jet equivalent circuit (Figure 3; the method is described in Section 2.2.1), and (b) with images taken by the digital RGB camera (see the sample given in Figure 11) to calculate the shape and dimensions of the jet. For this purpose, an LED was installed near the jet; its known size was used as the length reference.

3.2. Experimental Results

The data collected by the test bench and its supervision tool covered around 100 different operating points. Some of them did not produce jet ignition. This section presents the most relevant trends with a focus on the temperature of the cold-plasma jet.

3.2.1. Power Supply Evaluation

Figure 12 emphasizes that both SRI and BSP power supplies can turn on a cold-plasma jet and maintain its temperature close to that of the human body. The comparison of performance focuses on the input power range associated with acceptable temperatures (below 40 °C in our case). It is worth mentioning that the experiments were repeated several times on different days; no noticeable changes in the temperature measurements were recorded, except for variations which could be attributed to the differences in ambient temperature. For this reason, a uniform error bar of 1 °C represents the variation of the ambient temperature on these temperature curves; this is also the case for Figures 14, 17 and 18.
According to the temperature criterion presented here, performance in this configuration was best when the system was supplied by a BSP converter operating at 10 kHz. The second-best performance was linked to an SRI supply at 100 kHz, followed by BSP at 5 kHz.
As shown in Figure 12, when supplied by an SRI electrical source operating at a high frequency (147.5 kHz), system behavior was unstable. A similar unstable trend can also be observed in Figure 13, with varying jet diameter performance. The length estimation was also unstable in configurations where the target was located at a long distance from the tube outlet and, therefore, had a low influence on the jet length (this variant is not presented here).
This unstable, undesirable behavior was attributed to the absence of a power injection pause interval in the energy injection when the SRI operated at a high frequency (the burst mode with a lower frequency rest time interval appears to be a viable solution to this problem).
The choice of the energy injection frequency has to balance several criteria:
  • Performance obtained at lower frequencies (100 kHz for SRI, 5 kHz and 10 kHz for BSP) is much smoother and more controllable.
  • A lower operating frequency of the supply means lower switching losses.
  • From an electrical design perspective, higher frequencies are associated with more compact and lighter solutions.
As a preliminary conclusion, the design of the plasma jet system, therefore, appears to be an optimization issue, with clearly oppositely varying trends.

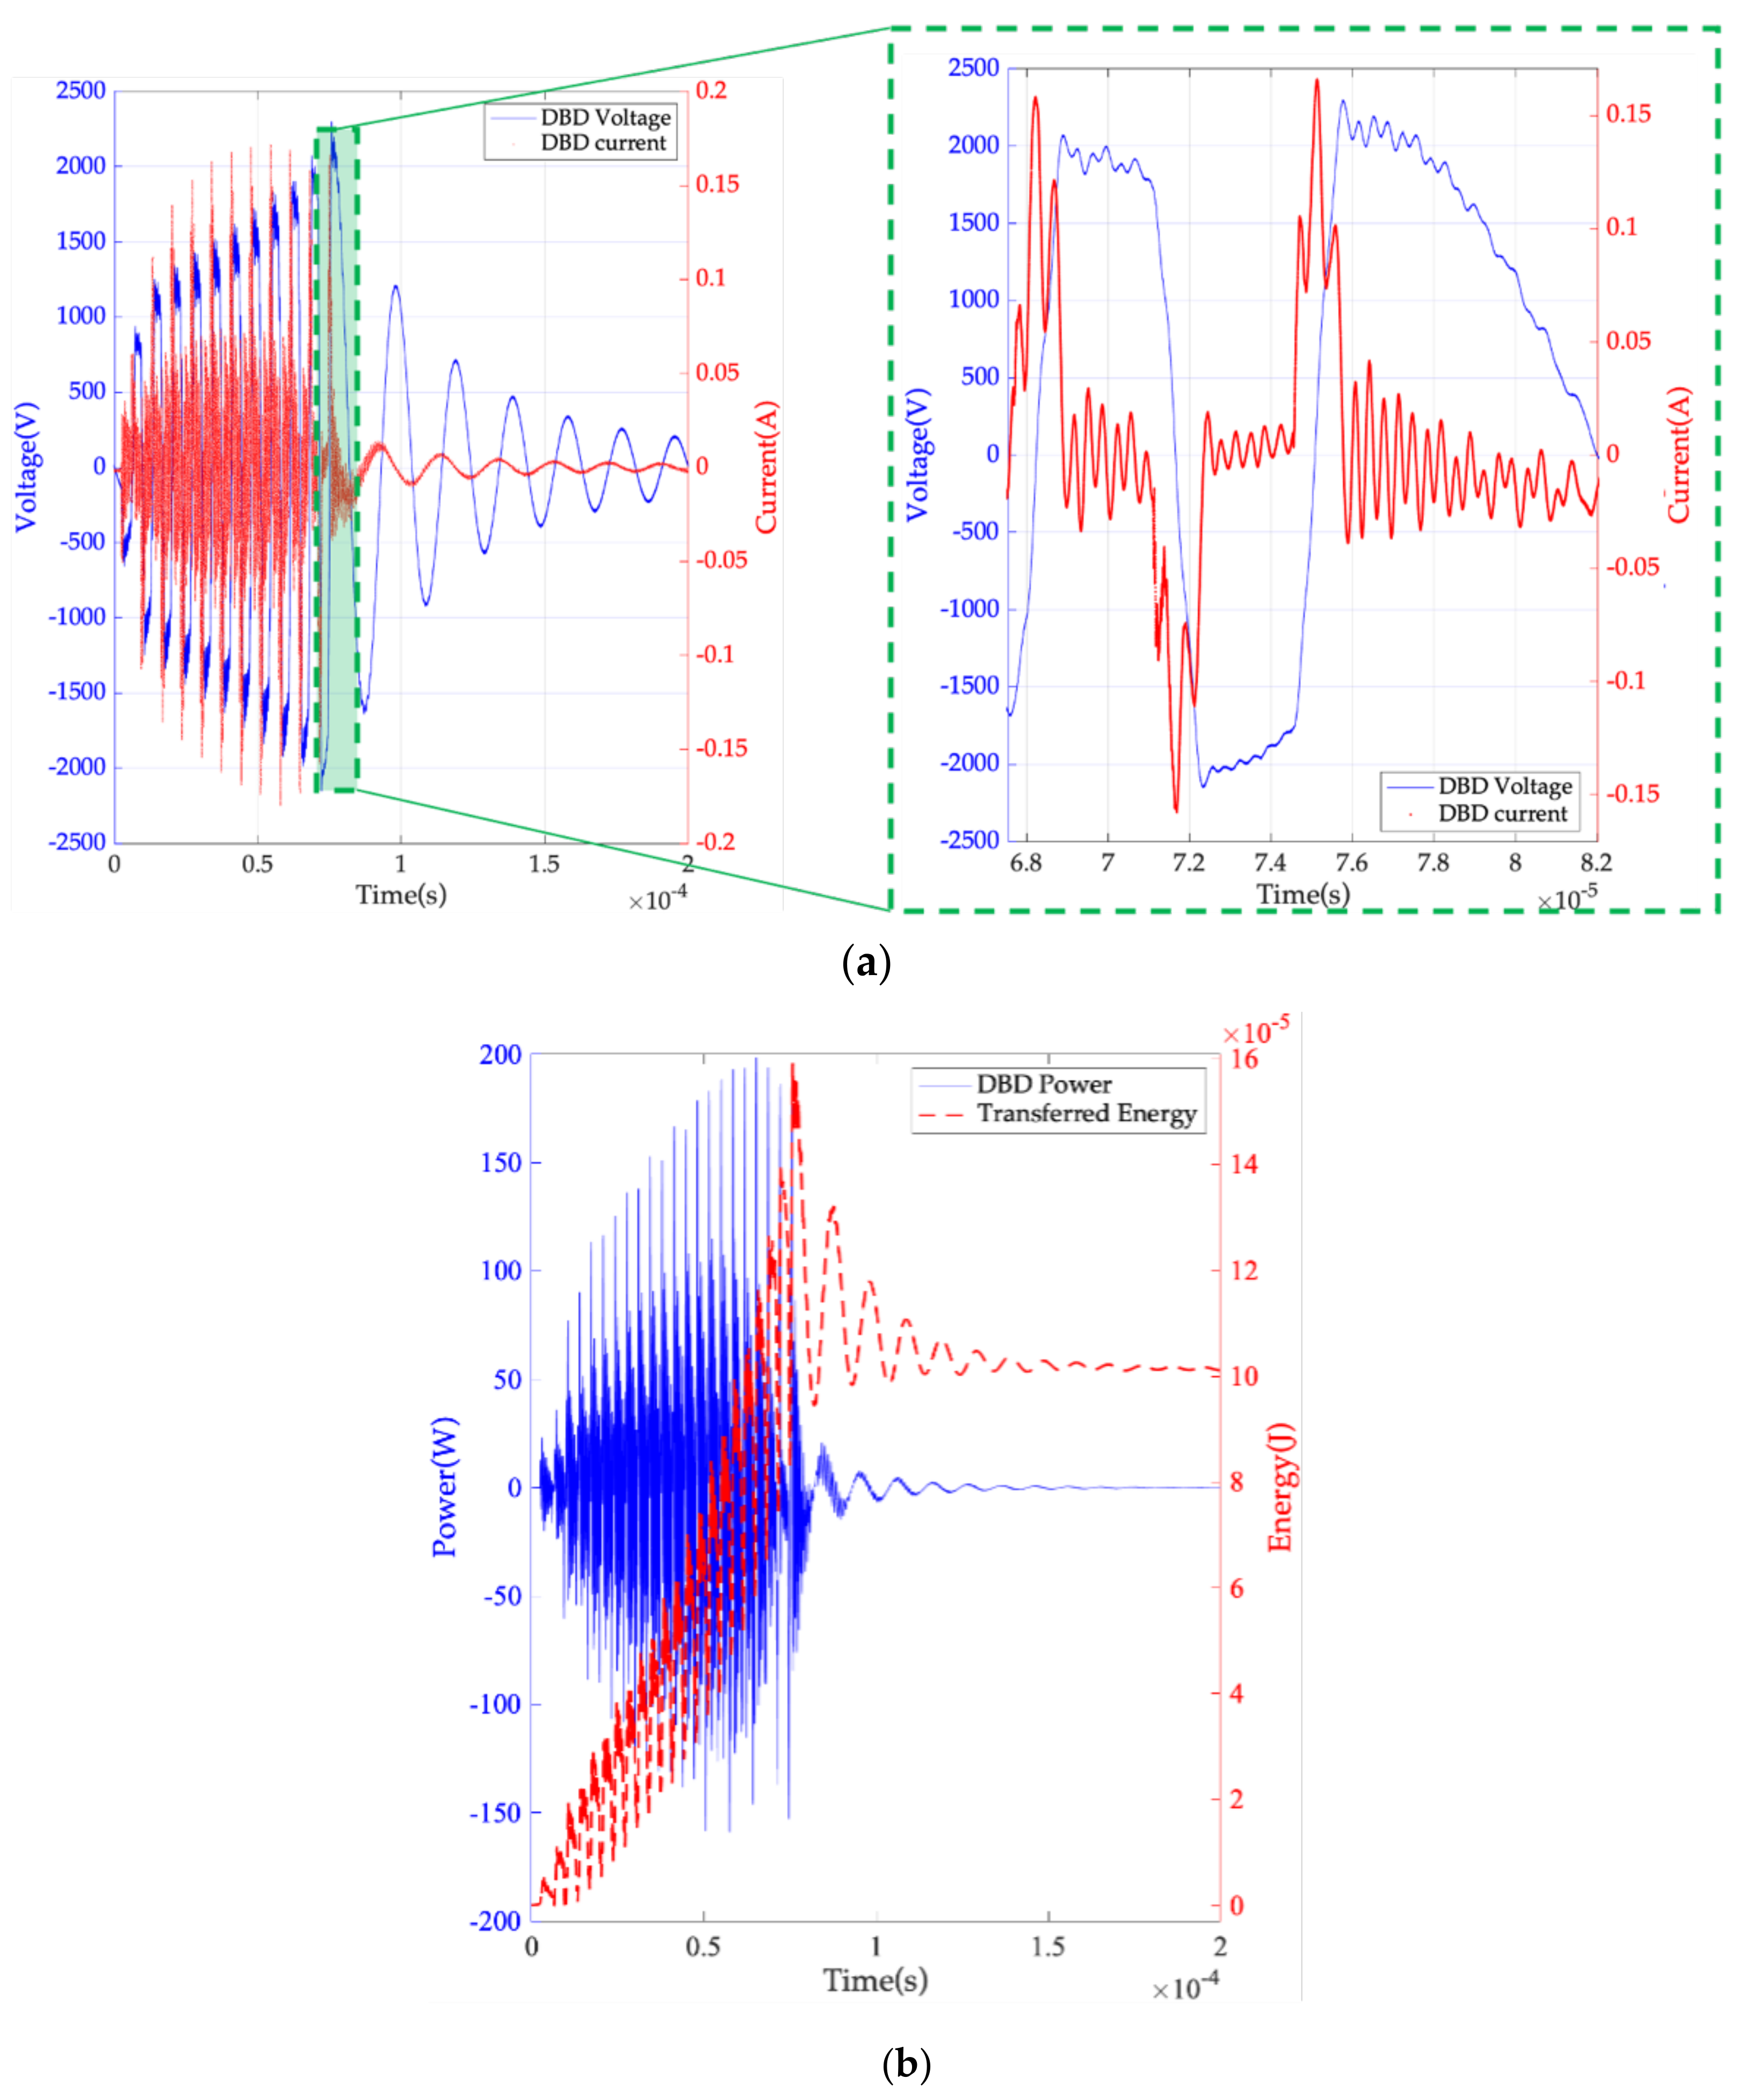
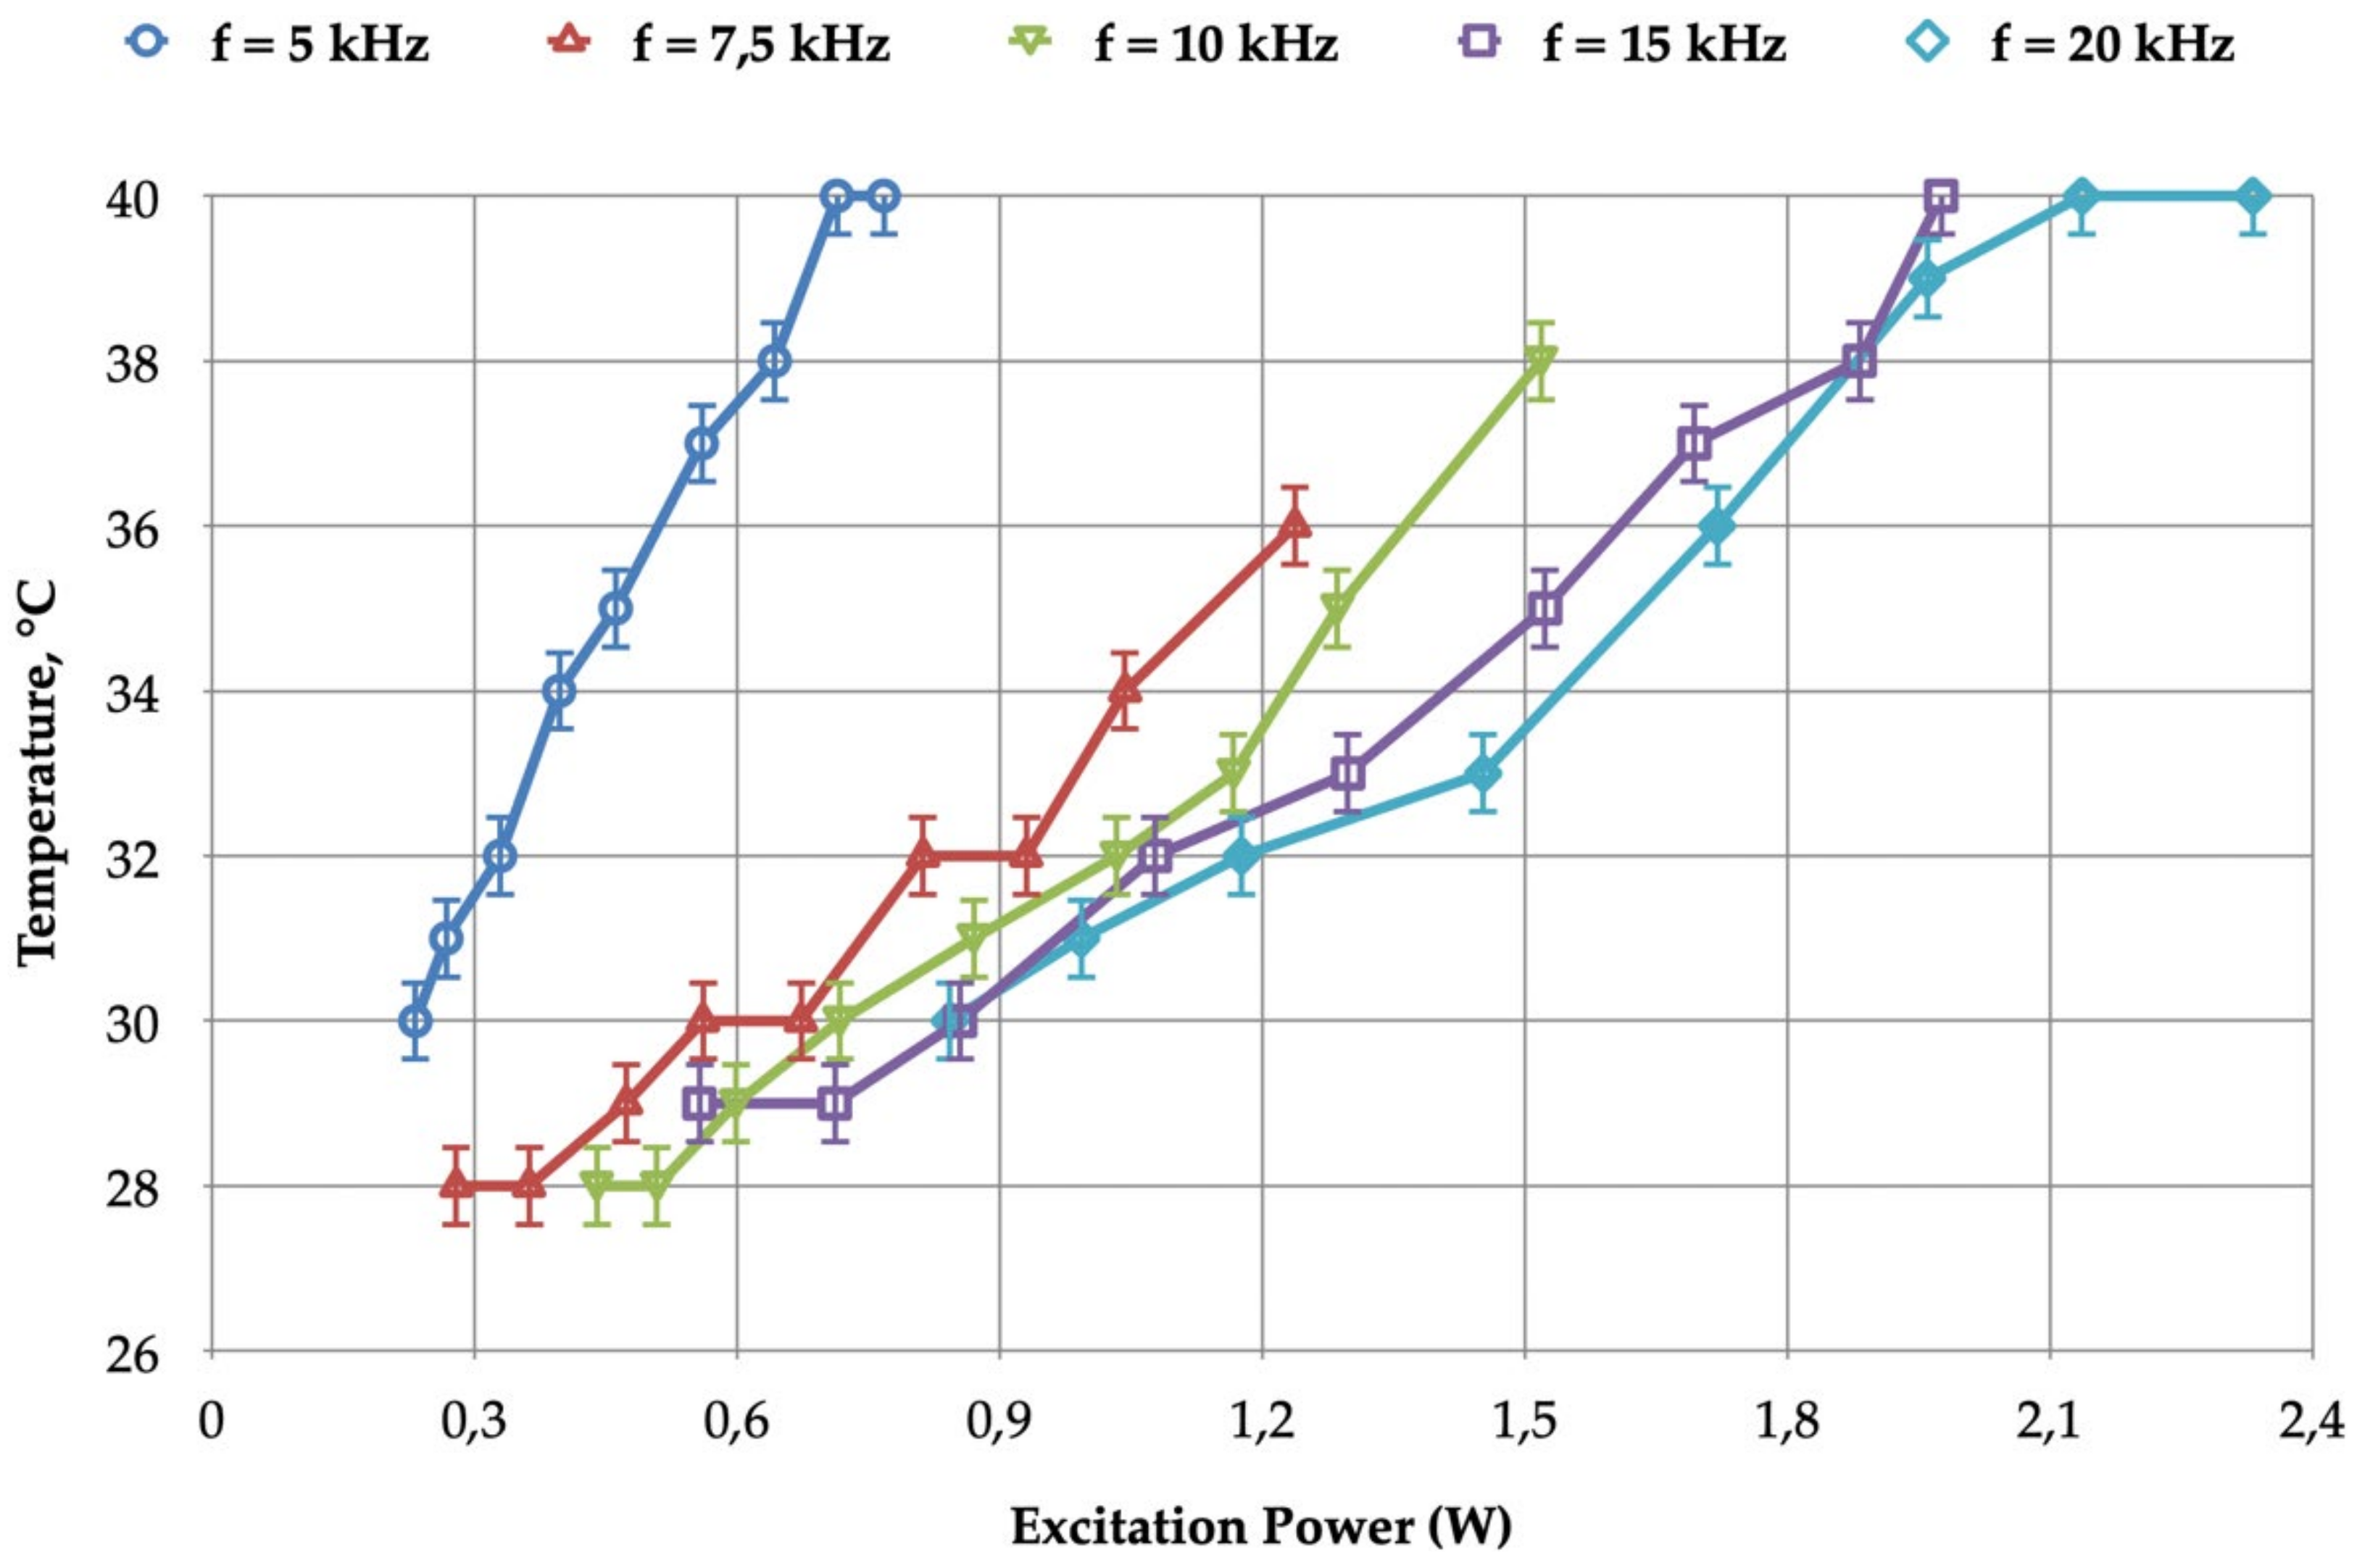
3.2.2. BSP Power Supply Investigations

The promising results of the BSP obtained in the previous section suggest systematic scanning for this topology.
Figure 14 presents plots of the jet temperature versus the injected power, Pdbd, with five different fsw frequency values. For a given fsw value, the power, Pdbd, was continuously adjusted using the voltage, Vin, which supplies the voltage inverter of the BSP. Vin directly controls Vdbd, which appears in Equation (5) and consequently in Equation (6). The distance, d, between the tube and the target was kept constant (5 mm).
The results show that operation in the 15–20 kHz range can keep the jet temperature of the spot on target below 40 °C; the power, Pdbd, can be varied without reaching the upper temperature limit.
As for the BSP-supplied system, the impact of the distance, d, between the tube outlet and the target is crucial. Figure 15 shows the variation in the appearance of the cold-plasma jet with three different distances, d (same supply conditions). The three images were captured using the digital RGB camera; the red LED was used to set a reference to calculate the jet’s dimensions.
The length varied, but the plume kept its conical shape. Therefore, the diameter of the spot changed with the distance, d. This effect can also be seen with the curves of Figure 16. If the spot diameter needs to be accurately controlled, adjusting the input power, Pdbd, can compensate for diameter variations due to distance fluctuations.
Figure 17 shows plots of the temperature of the spot on the target versus the injected power, Pdbd, with three different values of distance d between the tube outlet and the target. Regardless of the distance between the tube and the target, adequate power adjustment appears to be able to ensure that the target temperature remains constant.
Lastly, Figure 18 shows the impact of gas flow rate on plasma jet temperature. The rising temperature of the first points of the curves reflects weak plasma jet contact with the target located at a distance of 7 mm. Subsequently, once the flow rate was high enough to allow plasma jet contact with the target, the temperature of the jet, measured on the rear side of the copper foil target (IR camera), decreased as the flow rate increased.

4. Discussion

4.1. Plasma Jet Equivalent Circuit Used for Supply Design

In Section 2.2.1, we described the equivalent circuit of the plasma jet used to design two (BSP and SRI) electrical generators, and we described the method used to identify its parameters. This equivalent circuit does not explicitly incorporate all the behavior of the plasma plume and, notably, does not incorporate a possible current flow through the plume and the grounded target.
The test bench included three current probes (Figure 10) measuring the current flowing through the two copper rings of the jet (connected to the power supply terminals). Another current probe was located at the tube outlet, which was connected to both the ground and the target for safety reasons. Figure 19 shows the experimental waveforms of these three currents, obtained using the BSP (during a positive voltage pulse).
Considering the difference between the two currents measured on the rings (red and green curves), the equivalent circuit of Figure 2 can be clearly improved and should only be considered as an electrical model “seen from the terminals”, for design purposes. The choice of parameters was very useful for the sizing of converters; semi-conductors and electrical components were achieved on the basis of a reliable representation of the electrical load, and the theoretical performance expected with this approach was obtained experimentally.
Nevertheless, at present, we believe that further investigation [23] of the equivalent plasma jet circuit and the identification of its parameters will provide a better understanding of energy transfers through the jet and advance EMC modeling of the entire system.

4.2. Comparison with Behavior Described in the Literature

A comparison of system-level performance measured using our experimental setup with results provided in the literature is also very interesting.
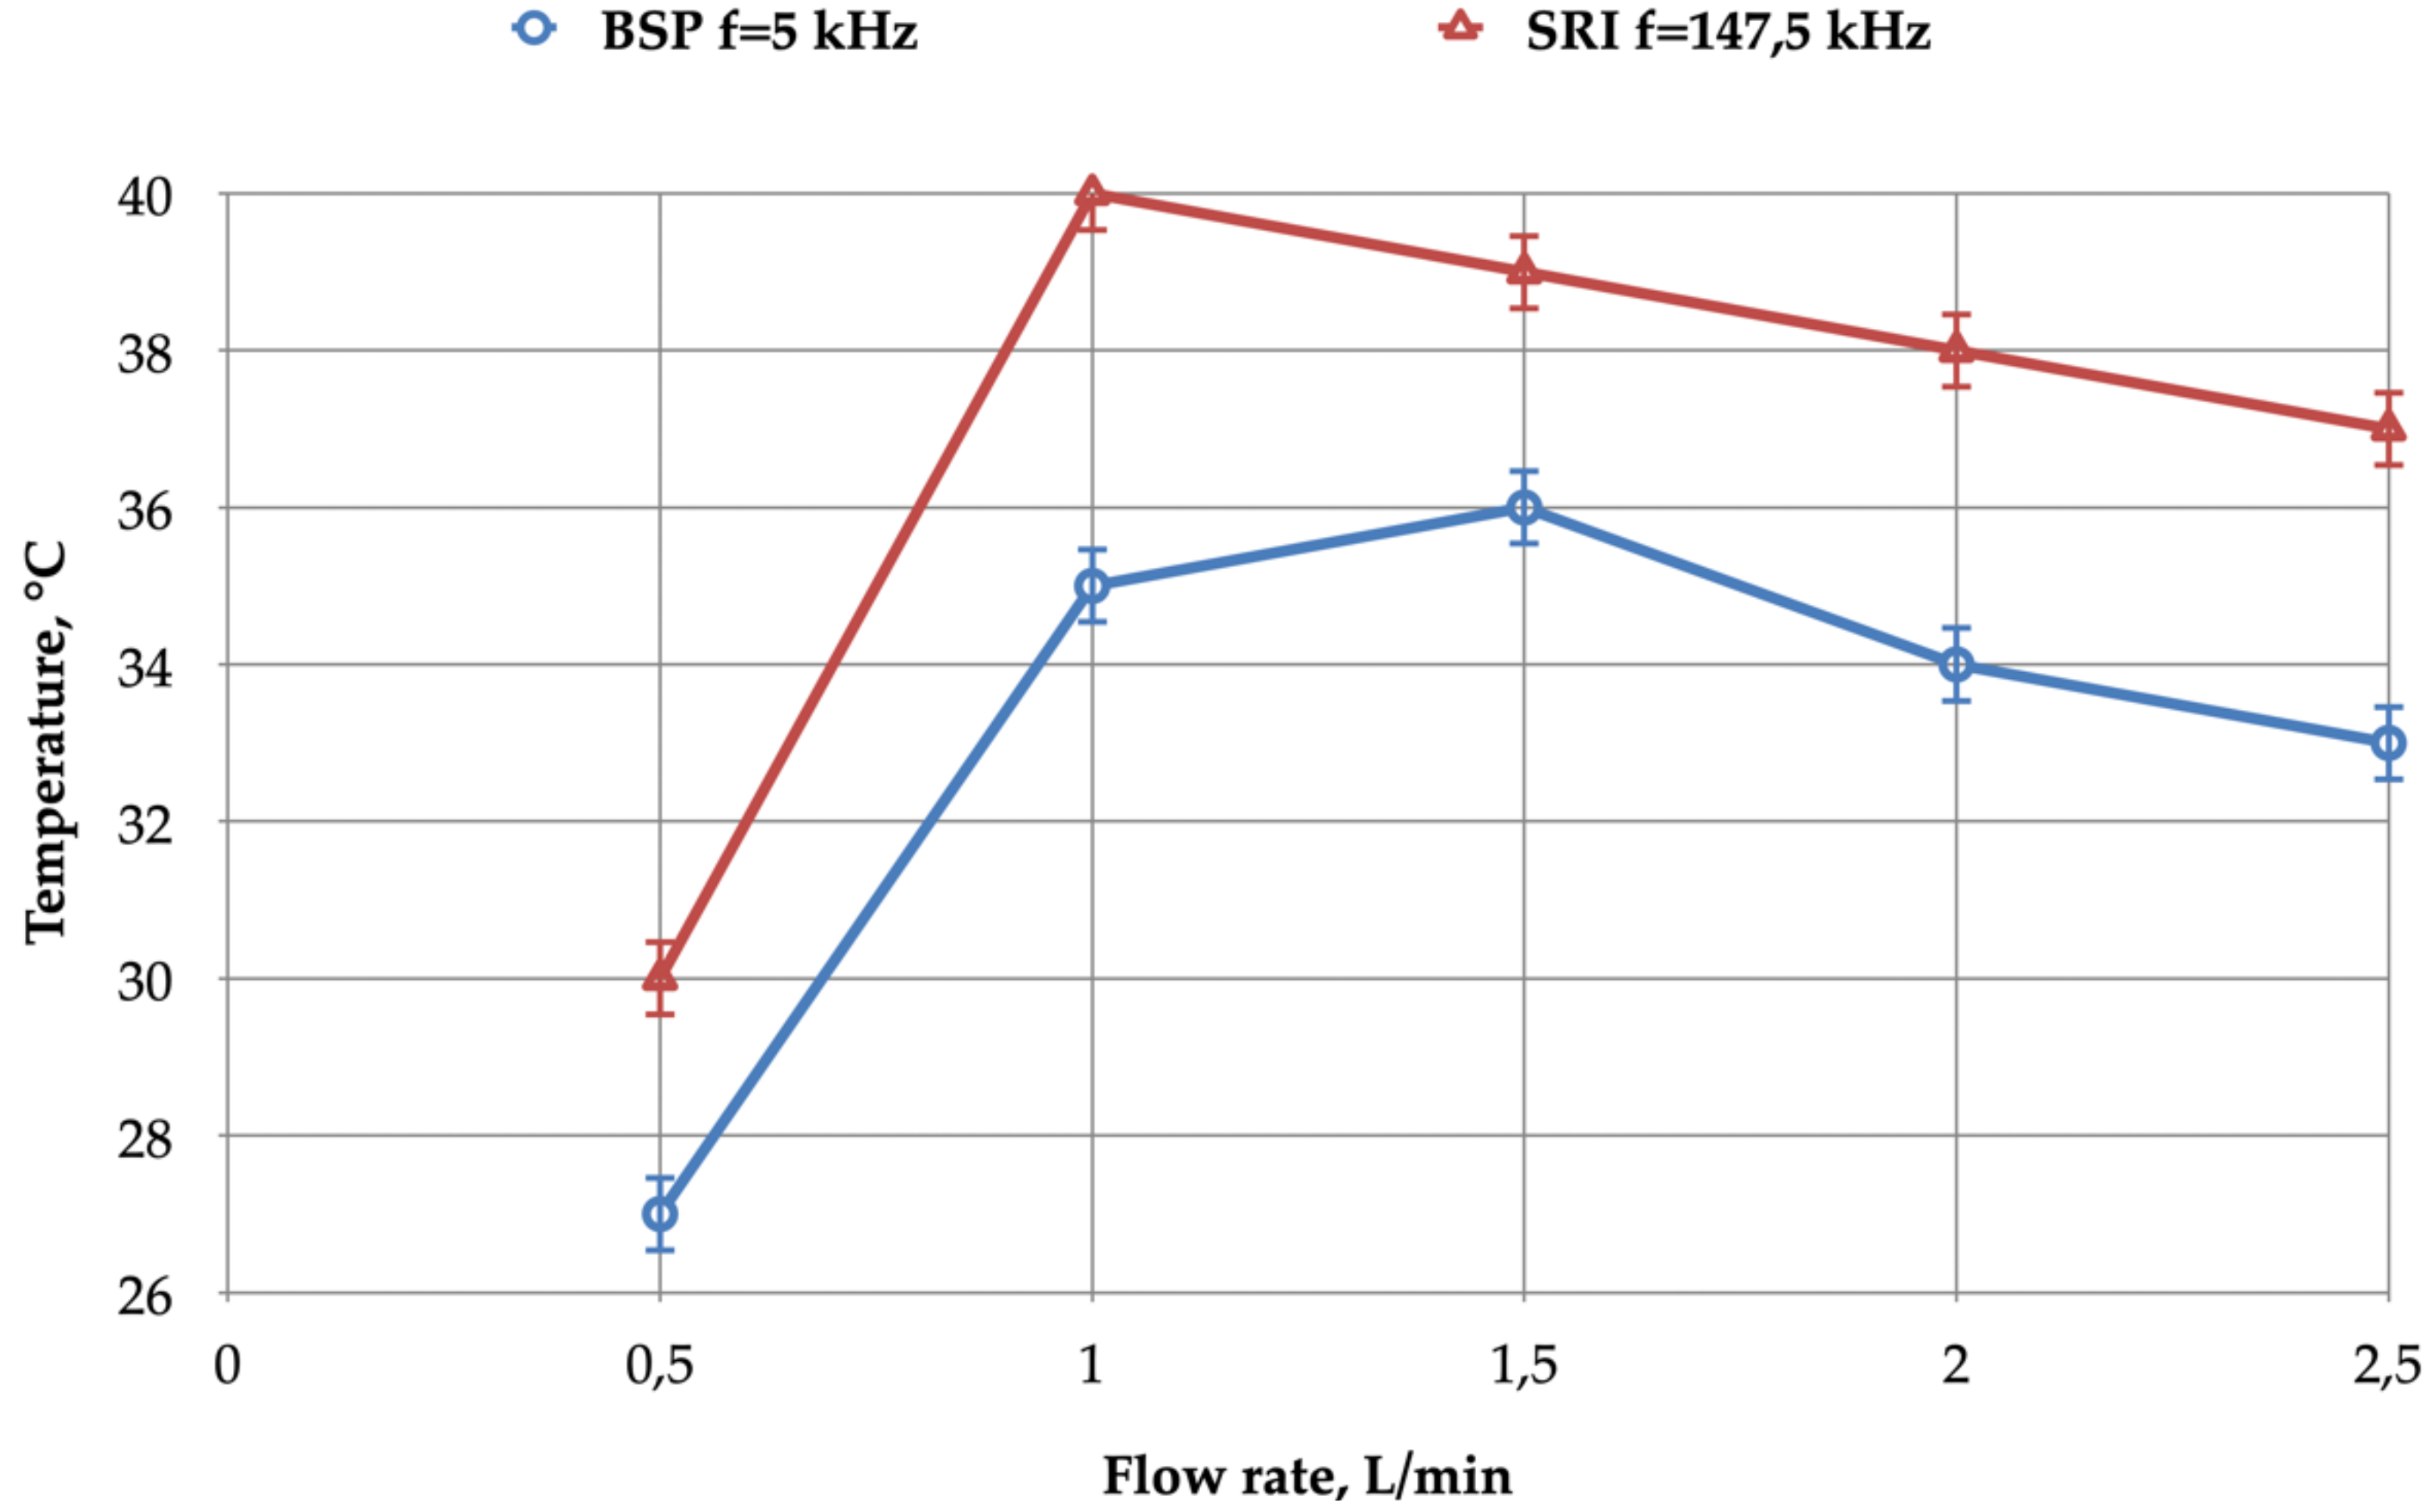
  • Our jet setup has many similarities with the configuration described in [4]. For the latter, different power supplies were considered: USP (unipolar short voltage pulses) and sine excitation voltage supplies. The gas temperature of the plasma, measured with a bimetal thermometer as shown in [4], had a variation trend with regard to the gas flow rate very similar to that presented here in Figure 18 (considering the operating points observed, once the gas flow was high enough to obtain plume contact with the target). Moreover, the experimental parameters of both supplies used in [4] were set in a range compatible with our investigations: frequency of 33 kHz and excitation power of 4.2 W.
  • The authors of [24] described experiments on a plasma jet generated using helium as a working gas. The authors used an AC power supply unit (providing 8 to 10 kVpp voltages at a frequency of 20 kHz), operating in a range comparable to ours. The temperature measurements in [24] were carried out using a method different from ours, with a mercury thermometer placed at the end of the plasma jet, and not at a set distance; in our case, the temperature was measured on the rear side of the target (a thin copper foil) using an IR camera. The authors of [24] presented the following results with similar trends to ours, especially:
    The dependence of the plasma temperature versus the flow rate (corresponding to Figure 18);
    The increase in the spot diameter as a result of the increase in the injected power (with a fixed gas flow, as depicted in Figure 16) was in line with the observations made in [4], with regard to the dependence of the plume dimensions on the rise in excitation power.

4.3. Power Injection Pause

From the perspective of injecting energy into the plasma, the BSP and SRI power supplies differ mainly in the form of the injected currents, as the voltage across the gas varies relatively little once the discharge has started. The BSP provides very short and intense spikes (at the edges of the delivered voltage pulse), while the SRI delivers much longer current pulses. The SRI solution potentially offers the possibility, for a given peak current value, of injecting a much higher energy than the BSP during the supply period. In fact, Figure 5 and Figure 7 present almost the same power levels (averaged at the Tsw timescale), but the much longer current pulse of the SRI was adjusted with a much lower amplitude.
Concerning the effect of these two strategies on the plasma, the main differences between the two power modes is the idle time interval between two consecutive pulses: the “power injection pause” [13]. This parameter has a significant impact, resulting from the level of plasma recombination taking place during the pause between the pulses; a long “power injection pause” allows the medium to regain its fundamental original state, while short pauses prohibit significant recombination.
Indeed, a short “power injection pause”, during a time interval shorter than the time constants related to the recombination phenomena, does not allow the excited species to return to their ground state and promotes the “memory effect”, as analyzed in [25,26,27]. The medium remains very conductive between consecutive pulses and the electric field in the discharge gap remains weak for subsequent pulses.
Conversely, the recombination process permitted by a longer power injection pause restores the electrical properties of the discharge space, and the next pulse develops in a nonconductive medium subject to a high electric field (requiring higher voltage levels than in the previous case). The high value of the reduced electric field, E/n, obtained in the presence of the recombination process, results in a significant redistribution of the discharge energy favorable to the excitation of the electronic levels without significant heating [28].
In practice, for applications other than nonthermal plasma jets (excimer lamps [13,26,29] and surface treatments [25]), each solution shows different levels of performance, and this was the main motivation in considering the two solutions for the present investigations. SRI (and similar current-controlled power supplies) was the best solution for applications where the gas was permanently renewed by the flow, such as surface treatments [25] and gas treatments. BSP was very suitable for a confined gas application, such as excimer lamps.
According to the results presented here, for the same power injection levels, BSP showed the best performance with respect to both the expansion of the plasma jet and the temperature rise, which are of utmost importance for applications targeting wound disinfection.
Considering this observation, and attributing this difference between the BSP and SRI supplies to opposite behaviors regarding the power injection pause, the burst modulation was experimented for the SRI. As a result, increased performance was observed, and we currently believe that the Toff idle time introduced in the burst strategy offers the missing “power injection pause”, which is permanently and naturally provided by the t2 interval between the voltage pulses of the BSP. Furthermore, the preferable trend for power injection is to produce current pulses of high amplitude (or bursts of such pulses), followed by power injection pauses (typically the Toff parameter).
It is important to mention that, with the burst mode, the introduction of the idle Toff time requires an increase in the amplitude of the SRI’s current pulses, if an unchanged power level (average value at TBurst timescale—Equation (9)) is sought. The optimal combination of such a power injection pattern really deserves future investigation.

4.4. Applicability of the Investigated System

Our findings are expected to help medical specialists using plasma jet solutions to determine the best feasible distance, temperature, and exposure area configurations for their tasks, as well as the excitation power injection. To summarize our experience using this test bench, the following schedule is proposed for designing a “cold-plasma” jet system dedicated to wound disinfection:
  • According to our communications with healthcare professionals, it is necessary to start by ensuring that the configuration is financially feasible; thus, a maximum gas flow has to be defined;
  • Subsequently, it must be ensured that the configuration will allow operation at a safe and comfortable distance from the application area, i.e., a distance of at least 5 mm;
  • From this step, temperature should be considered, in order to ensure comfortable and safe use of the device, without exceeding the limit (human body temperature);
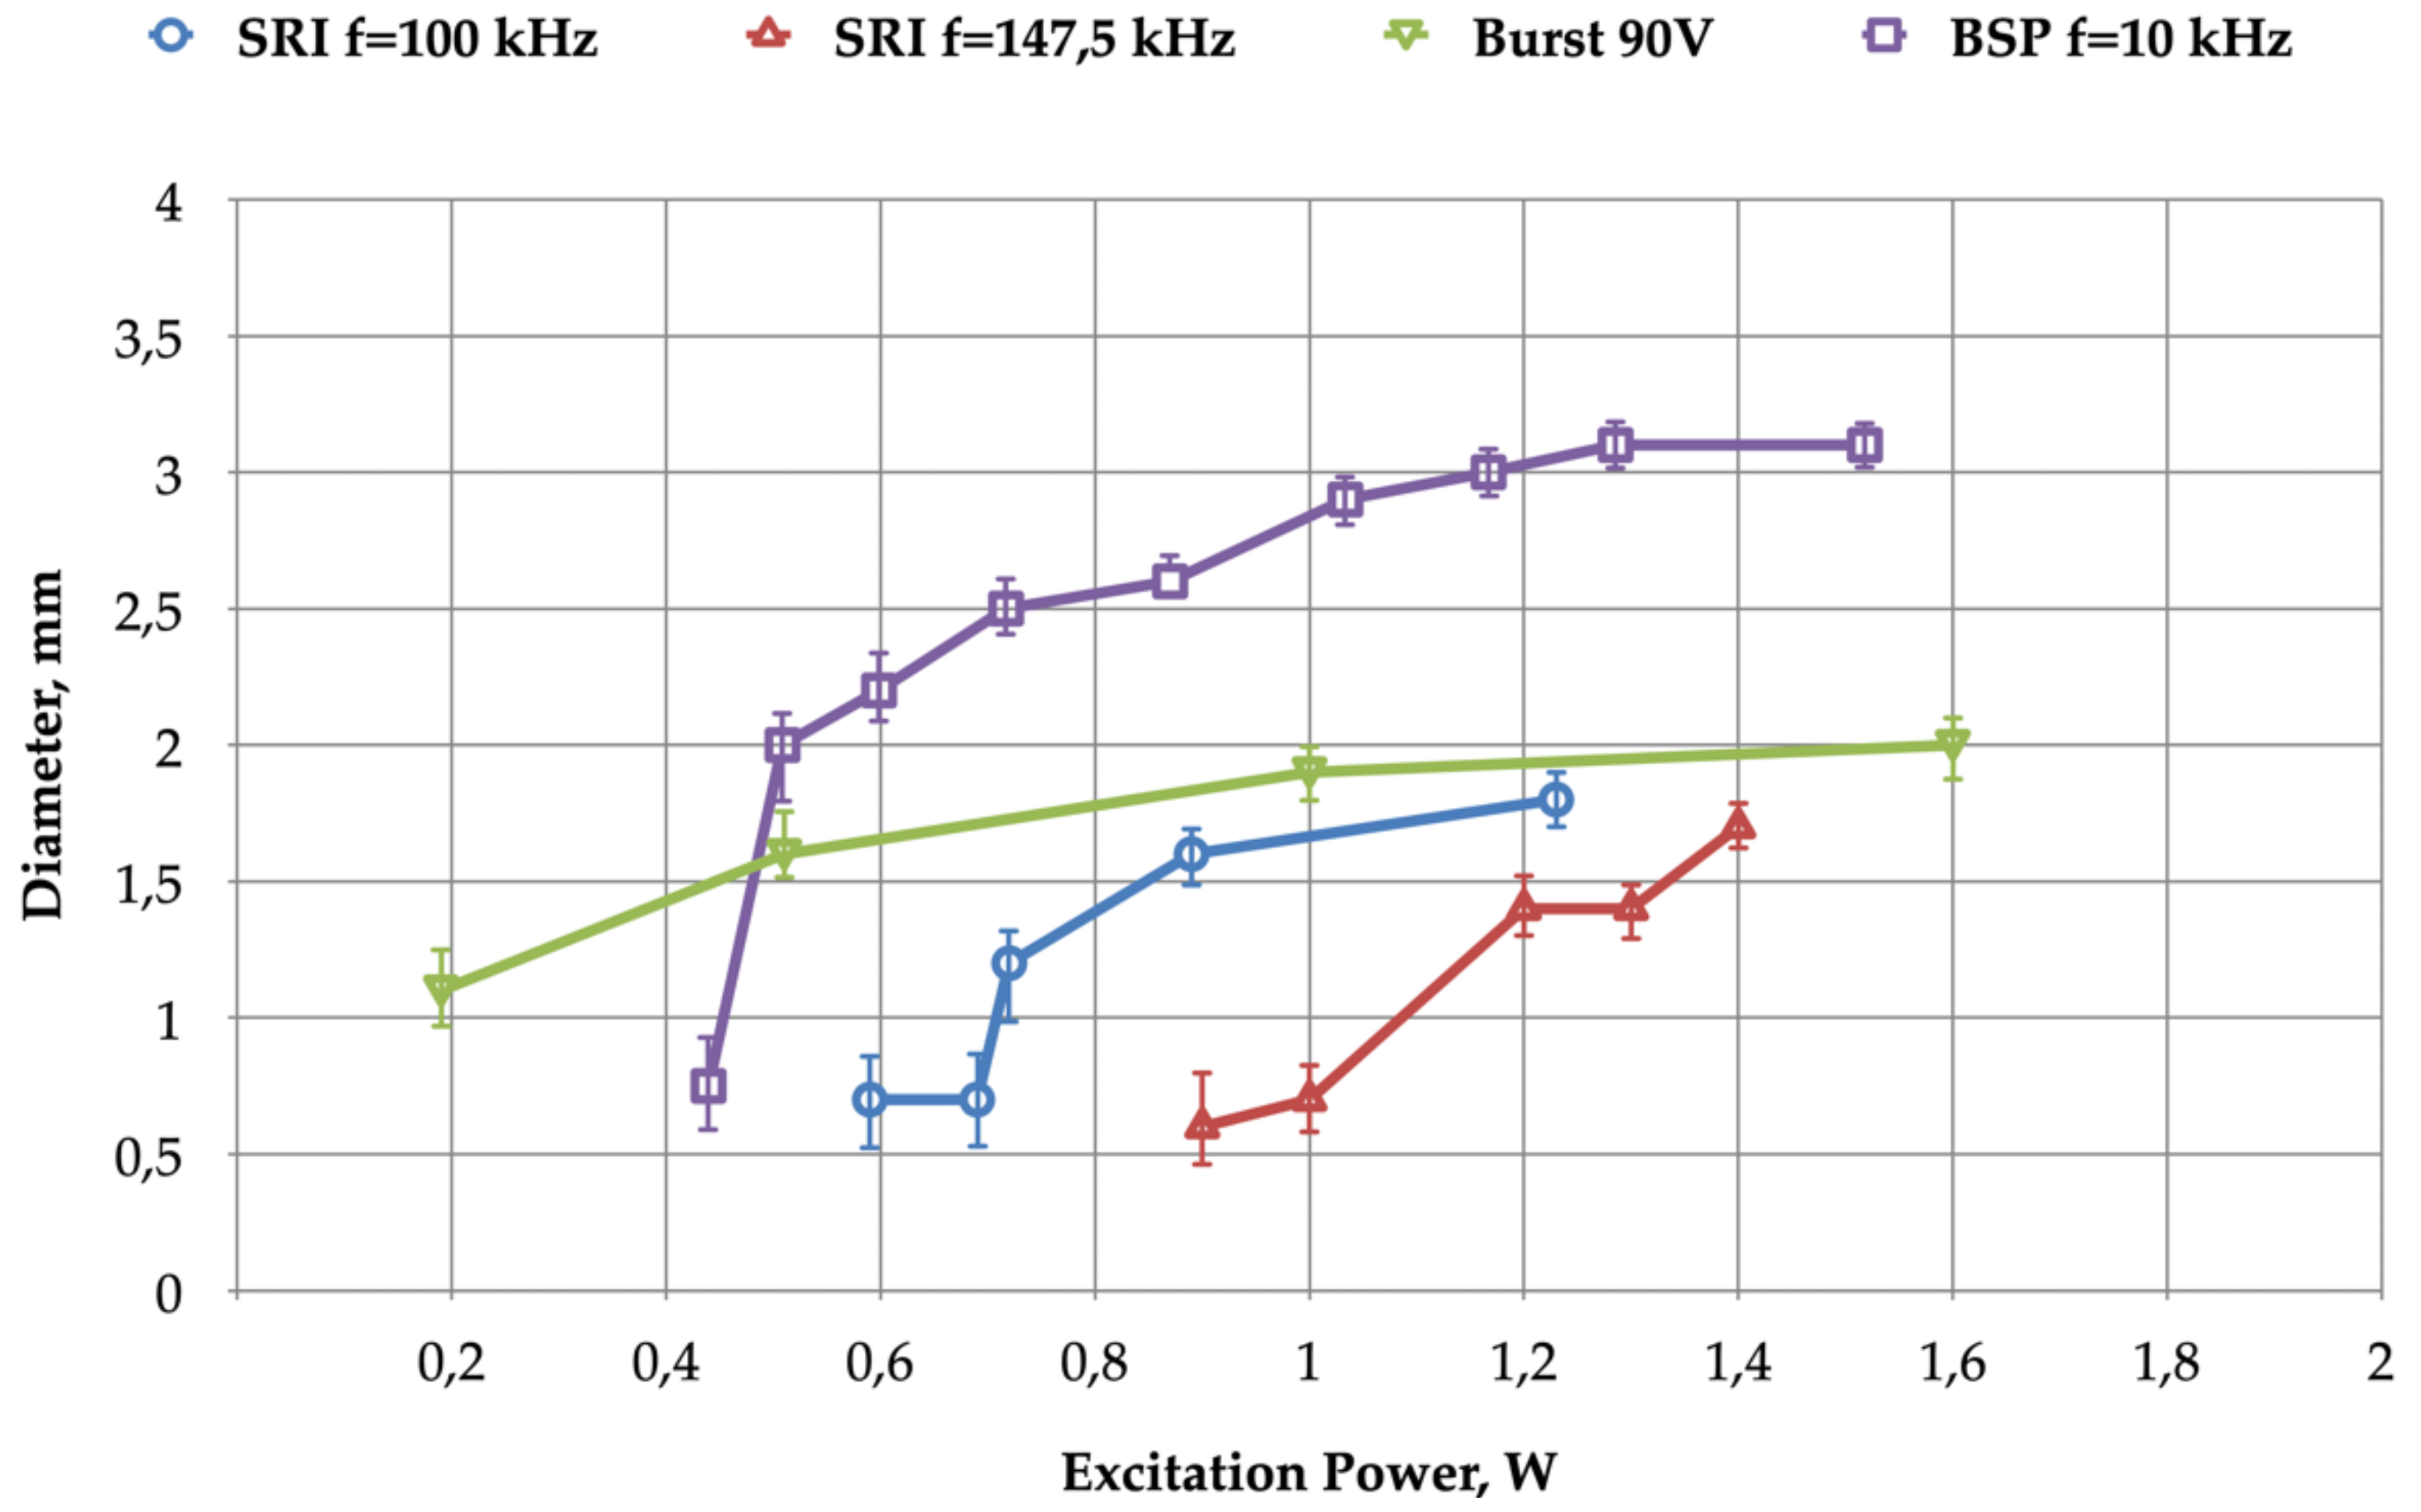
  • The diameter of the plasma will determine both efficacy of use and the speed of the treatment procedure; this will also affect the operating cost.
  • According to the results of the previous four steps, the plots provided in this paper can be used (provided the jet configuration is the same as it is here) to select the necessary excitation level. Accordingly, the power supply and its operating conditions that offer best performance matching can be selected.
With the parameters and performance ranges drawn from the analyses in this paper, two typical solutions are summarized below.
For use on open surfaces, a BSP (bipolar short pulses) configuration can be selected at a pulse frequency of 10 kHz with gas consumption = 1 L/min, output power = 1.21 W, plasma temperature at a distance of 5 mm = 32 °C, and plasma spot diameter = 3 mm.
Potential use in hard-to-reach areas may require a configuration with a smaller plasma diameter. In this case, we consider the SRI (serial resonant inverter) solution operated at a frequency of 100 kHz, with gas consumption = 1 L/min, output power = 0.7 W, plasma temperature at a distance of 5 mm = 33 °C, and plasma diameter = 0.7 mm.

5. Conclusions

This paper provided a proof of concept for the feasibility of a “cold-plasma” jet system intended to allow nondrug and contactless disinfection of wounds. It also proposes guidelines for the design and control of such a setup.
The parametric study carried out was geared toward the performance provided with two different power supplies specifically developed for this application—a bipolar short-pulse (BSP) voltage source and a serial resonant inverter (SRI) pulsed current generator. At the current stage of the investigation, a 15–20 kHz frequency range with 2 µs voltage pulses produced by the BSP topology seems the best system control solution according to the selected criteria: jet temperature, length, and spot diameter.
In our opinion, the power injection pause (the interval during which no energy is transferred to the plasma) is an important element. The differences in this parameter between the two supplies is key to interpreting the differences in the jet’s properties (dimensions and temperature). Burst mode, which achieves a low-frequency modulation of the energy injection and dissociates the level of instantaneous power injection from the average power, showed very good results for the jet’s performance control.
The developed test bench also proved to be a useful tool for parametric studies required to optimize the system. Its monitoring and control guarantee the experiment’s repeatability and systematic extraction, with automated scripts, of the relevant system characteristics from the raw results. Moreover, it can be used in preindustrial prototype optimization, especially concerning the gas flow, thus minimizing operating costs.

Author Contributions

Conceptualization, D.S., A.I., R.D. and H.P.; methodology, A.I. and H.P.; software, V.R. and T.C.; validation, A.I., V.R., D.F. and D.S.; investigation, E.B., A.I., T.C., D.F. and V.R.; data curation, A.I., D.S. and H.P.; writing—original draft preparation, H.P.; writing—review and editing, A.I., D.S., V.R., D.F. and H.P.; visualization, A.I., V.R. and D.F.; funding acquisition, H.P. All authors have read and agreed to the published version of the manuscript.

Funding

This research was partly funded by the Ministry of Science and Education of the Russian Federation under project #FZ-2020-0003 “The study of new materials and methods for plasma and phototherapy of cancer, dermatitis, and suppurated complications”.

Institutional Review Board Statement

Not applicable.

Informed Consent Statement

Not applicable.

Acknowledgments

The authors would like to thank the French–Colombian cooperation program, ECOS Nord, Colciencias-ICETEX for mobility support and the French Embassy in Russia for the Ostrogradski internship grant.

Conflicts of Interest

The authors declare no conflict of interest.

References

  1. Machala, P.Z.; Hensel, K.; Akishev, Y. Plasma for Bio-Decontamination, Medicine and Food Security; NATO Science for Peace and Security Series A: Chemistry and Biology; Springer: Berlin, Germany, 2012. [Google Scholar] [CrossRef]
  2. Laroussi, M. Nonthermal decontamination of biological media by atmospheric-pressure plasmas: Review, analysis, and prospects. IEEE Trans. Plasma Sci. 2002, 30, 1409–1415. [Google Scholar] [CrossRef]
  3. Zhdanova, O.S.; Kuznetsov, V.S.; Panarin, V.A.; Skakun, V.S.; Sosnin, É.A.; Tarasenko, V.F. A Planar Source of Atmospheric-Pressure Plasma Jet. Plasma Phys. Rep. 2018, 44, 153–156. [Google Scholar] [CrossRef]
  4. Schitz, D.; Ivankov, A.; Pismennyi, V. Nonthermal Plasma Jet for Biomedical Applications. KnE Energy 2018, 3, 456–461. [Google Scholar] [CrossRef]
  5. Isbary, G.; Zimmermann, J.; Shimizu, T.; Li, Y.-F.; Morfill, G.; Thomas, H.; Steffes, B.; Heinlin, J.; Karrer, S.; Stolz, W. Non-thermal plasma—More than five years of clinical experience. Clin. Plasma Med. 2013, 1, 19–23. [Google Scholar] [CrossRef]
  6. Heinlin, J.; Morfill, G.; Landthaler, M.; Stolz, W.; Isbary, G.; Zimmermann, J.L.; Shimizu, T.; Karrer, S. Plasma medicine: Possible applications in dermatology. JDDG J. Deutsch. Dermatol. Ges. 2010, 8, 968–976. [Google Scholar] [CrossRef] [PubMed]
  7. Lopes, B.B.; Kraft, M.B.D.P.L.; Rehder, J.; Batista, F.R.X.; Puzzi, M.B. The Interactions between Non-thermal Atmospheric Pressure Plasma and Ex-vivo Dermal Fibroblasts. Procedia Eng. 2013, 59, 92–100. [Google Scholar] [CrossRef] [Green Version]
  8. Kolb, J.F.; Mohamed, A.-A.; Price, R.O.; Swanson, R.J.; Bowman, A.; Chiavarini, R.L.; Stacey, M.; Schoenbach, K.H. Cold atmospheric pressure air plasma jet for medical applications. Appl. Phys. Lett. 2008, 92, 241501. [Google Scholar] [CrossRef] [Green Version]
  9. Gerling, T.; Brandenburg, R.; Wilke, C.; Weltmann, K.-D. Power measurement for an atmospheric pressure plasma jet at different frequencies: Distribution in the core plasma and the effluent. Eur. Phys. J. Appl. Phys. 2017, 78, 10801. [Google Scholar] [CrossRef] [Green Version]
  10. Asenjo, J.; Mora, J.; Vargas, A.; Brenes, L.; Montiel, R.; Arrieta, J.; Vargas, V. Atmospheric-Pressure Non-Thermal Plasma Jet for biomedical and industrial applications. J. Phys. Conf. Ser. 2015, 591, 012049. [Google Scholar] [CrossRef] [Green Version]
  11. Friedman, P.C.; Miller, V.; Fridman, G. Use of cold atmospheric pressure plasma to treat warts: A potential therapeutic option. Clin. Exp. Dermatol. 2019, 44, 459–461. [Google Scholar] [CrossRef]
  12. Nicol, M.J.; Brubaker, T.R.; Ii, B.J.H.; Simmons, A.N.; Kazemi, A.; Geissel, M.A.; Whalen, C.T.; Siedlecki, C.A.; Bilén, S.G.; Knecht, S.D.; et al. Antibacterial effects of low-temperature plasma generated by atmospheric-pressure plasma jet are mediated by reactive oxygen species. Sci. Rep. 2020, 10, 3066. [Google Scholar] [CrossRef] [PubMed] [Green Version]
  13. Florez, D.; Schitz, D.; Piquet, H.; Diez, R. Efficiency of an Exciplex DBD Lamp Excited Under Different Methods. IEEE Trans. Plasma Sci. 2017, 46, 140–147. [Google Scholar] [CrossRef] [Green Version]
  14. Stepanova, O.; Rybalchenko, O.; Pinchuk, M.; Astafiev, A.; Orlova, O.; Spodobin, V.A.; Kudryavtsev, A. Bactericidal Effect of a Dielectric Barrier Discharge Plasma Jet Generated in Laminar and Preturbulent Helium Flows. Plasma Med. 2017, 7, 187–200. [Google Scholar] [CrossRef]
  15. Sosnin, E.A.; Stoffels, E.; Erofeev, M.V.; Kieft, I.E.; Kunts, S.E. The Effects of UV Irradiation and Gas Plasma Treatment on Living Mammalian Cells and Bacteria: A Comparative Approach. IEEE Trans. Plasma Sci. 2004, 32, 1544–1550. [Google Scholar] [CrossRef]
  16. Joh, H.M.; Kang, H.R.; Chung, T.H.; Kim, S.J. Electrical and Optical Characterization of Atmospheric-Pressure Helium Plasma Jets Generated With a Pin Electrode: Effects of the Electrode Material, Ground Ring Electrode, and Nozzle Shape. IEEE Trans. Plasma Sci. 2014, 42, 3656–3667. [Google Scholar] [CrossRef]
  17. Lee, H.W.; Nam, S.H.; Mohamed, A.-A.H.; Kim, G.C.; Lee, J.K. Atmospheric Pressure Plasma Jet Composed of Three Electrodes: Application to Tooth Bleaching. Plasma Process. Polym. 2010, 7, 274–280. [Google Scholar] [CrossRef]
  18. Fang, Z.; Shao, T.; Yang, J.; Zhang, C. Discharge processes and an electrical model of atmospheric pressure plasma jets in argon. Eur. Phys. J. D 2016, 70, 1–8. [Google Scholar] [CrossRef]
  19. Daeschlein, G.; Scholz, S.; Ahmed, R.; von Woedtke, T.; Haase, H.; Niggemeier, M.; Kindel, E.; Brandenburg, R.; Weltmann, K.-D.; Juenger, M. Skin decontamination by low-temperature atmospheric pressure plasma jet and dielectric barrier discharge plasma. J. Hosp. Infect. 2012, 81, 177–183. [Google Scholar] [CrossRef]
  20. Florez, D. Power Supplies for Dielectric Barrier Discharges—Toward an Efficient Use of Ultraviolet Exciplex Lamps; Editorial Pontificia Universidad Javeriana: Bogota, Colombia, 2018. [Google Scholar]
  21. Choi, J.H.; Song, Y.S.; Song, K.; Lee, H.J.; Hong, J.W.; Kim, G.C. Skin renewal activity of non-thermal plasma through the activation of β-catenin in keratinocytes. Sci. Rep. 2017, 7, 6146. [Google Scholar] [CrossRef] [Green Version]
  22. Manley, T.C. The Electric Characteristics of the Ozonator Discharge. Trans. Electrochem. Soc. 1943, 84, 83. [Google Scholar] [CrossRef]
  23. Nguyen, D.B.; Trinh, Q.H.; Hossain, M.; Lee, W.G.; Mok, Y.S. Improvement of Electrical Measurement of a Dielectric Barrier Discharge Plasma Jet. IEEE Trans. Plasma Sci. 2019, 47, 2004–2010. [Google Scholar] [CrossRef]
  24. Hammoodi, R.; Khalaf, M.; Abbas, A. Construction of the Non-Thermal Helium Plasma Jet using Two Electrodes and studying its Characteristics. Int. J. Sci. Res. IJSR 2018, 8, 1372–1378. [Google Scholar] [CrossRef]
  25. Bouzidi, M.C.; Bonnin, X.; Naudé, N.; Piquet, H.; Belinger, A.; Gherardi, N. Maximization of the working domain of an Atmospheric Pressure Townsend Discharge (APTD) using a current-source static converter. J. Phys. Conf. Ser. 2014, 550, 012044. [Google Scholar] [CrossRef] [Green Version]
  26. Belinger, A.; Naudé, N.; Gherardi, N. Transition from diffuse to self-organized discharge in a high frequency dielectric barrier discharge. Eur. Phys. J. Appl. Phys. 2017, 79, 10802. [Google Scholar] [CrossRef] [Green Version]
  27. Zhao, Z.; Li, J. Repetitively pulsed gas discharges: Memory effect and discharge mode transition. High Volt. 2020, 5, 569–582. [Google Scholar] [CrossRef]
  28. Starikovskiy, A.; Aleksandrov, N. Plasma-assisted ignition and combustion. Prog. Energy Combust. Sci. 2013, 39, 61–110. [Google Scholar] [CrossRef] [Green Version]
  29. Piquet, H.; Bhosle, S.; Diez, R.; Erofeev, M.V. Pulsed Current-Mode Supply of Dielectric Barrier Discharge Excilamps for the Control of the Radiated Ultraviolet Power. IEEE Trans. Plasma Sci. 2010, 38, 2531–2538. [Google Scholar] [CrossRef] [Green Version]
Figure 1. The general arrangement of a plasma jet reactor: (a) electrode arrangement, placed on plastic and borosilicate tubes (b).
Plasma 05 00007 g001
Figure 2. Classic DBD equivalent circuit.
Plasma 05 00007 g002
Figure 3. Q-V Manley diagram.
Plasma 05 00007 g003
Figure 4. Bipolar short-pulse (BSP) voltage supply: circuit topology (a) and typical waveforms of the Vinv inverter output voltage (b).
Plasma 05 00007 g004
Figure 5. Bipolar short-pulse (BSP) voltage supply experimental measurements: (a) the Vdbd voltage over one period (200 µs, fsw = 5 kHz); (b) transient during the positive voltage pulse (t1 = 1.5 µs) with Vdbd (blue) and Idbd (red). Pdbd = 0.45 W, Vin = 190 V, flow = 1 L/min.
Plasma 05 00007 g005
Figure 6. Series resonant inverter (SRI) current supply: circuit topology (a) and typical waveforms of the inverter current (b).
Plasma 05 00007 g006
Figure 7. Series resonant inverter (SRI) current supply: experimental measurements of the Vdbd voltage (a) over two periods; (b) Vdbd voltage (blue curve) and Idbd current (red curve) during a single period. Pdbd = 0.69 W, fsw = 100 kHz, Vin = 60 V, flow = 1 L/min, current pulse duration = 1.5 µs.
Plasma 05 00007 g007
Figure 8. Instantaneous power, pdbd (blue curves), and energy, Edbd, transferred into the plasma (red curves) during one supply operating period for both supplies: (a) BSP with Pdbd = 0.45 W (average value), fsw = 5 kHz, Vin = 190 V; (b) SRI with Pdbd = 0.69 W (average value), fsw = 100 kHz, Vin = 60 V.
Plasma 05 00007 g008
Figure 9. Burst mode: implementation on an SRI current source. Experimental measurements of the voltage, Vdbd ((a) - blue), the current, Idbd ((a) - red), the power, Pdbd ((b) - blue), and the energy, Edbd ((b) - red). PdbdTBurst = 0.51 W, fBurst = 5 kHz, Vin = 90 V, MBurst = 11 pulses, Flow = 1 L/min, jet to target distance, d = 5 mm, fsw = 147.5 kHz.
Plasma 05 00007 g009
Figure 10. Schematic of test bench.
Plasma 05 00007 g010
Figure 11. Test bench: configuration and monitoring interface panel.
Plasma 05 00007 g011
Figure 12. Jet temperature versus electrical power, Pdbd: BSP (t1 = 1.5 µs) and SRI (pulse duration 1.5 µs) power supplies at different fsw frequencies; flow = 1 L/min; tube to target distance = 5 mm.
Plasma 05 00007 g012
Figure 13. Jet diameter versus excitation power, Pdbd: SRI (current pulse duration: 1.5 µs, fsw = 147.5 kHz, Vin = 70–90 V), SRI in burst mode (MBurst = 11, fBurst = 5 kHz, fsw = 147.5 kHz), BSP (t1 = 1.5 µS, Vin = 150–230 V); flow = 1 L/min; tube to target distance, d = 5 mm.
Plasma 05 00007 g013
Figure 14. Jet temperature versus electrical power, Pdbd, for BSP (t1 = 1.5 µs) at six different fsw frequencies (Pdbd adjusted with Vin); flow = 1 L/min; tube to target distance = 5 mm.
Plasma 05 00007 g014
Figure 15. Variation in jet shape with tube-target distance, d, of (a) 3 mm, (b) 5 mm, and (c) 7 mm. BSP power supply with Pdbd = 0.46 W, Vin = 190 V, fsw = 5 kHz, t1 = 1.5 µs, flow = 1 L/min.
Plasma 05 00007 g015
Figure 16. Spot diameter versus excitation power, Pdbd, for different tube-target distances: BSP power supply with Vin = 150–230 V, fsw = 5 kHz, t1 = 1.5 µs; flow = 1 L/min.
Plasma 05 00007 g016
Figure 17. Jet temperature versus excitation power, Pdbd, for different tube-target distances: BSP power supply with Vin = 150–230 V, fsw = 5 kHz, t1 = 1.5 µs; flow = 1 L/min.
Plasma 05 00007 g017
Figure 18. Jet temperature versus flow rate for a 7 mm tube–target distance: BSP power supply with Vin = 230 V, fsw = 5 kHz, t1 = 1.5 µs; SRI power supply with Vin = 70 V, fsw = 147.5 kHz, current pulse duration = 1.5 µs.
Plasma 05 00007 g018
Figure 19. DBD equivalent circuit: waveforms of Vdbd, Idbd, upstream electrode current (cathode current, acquisition channel 2 in Figure 10), and the target current for BSP supply. Pdbd = 0.45 W, fsw = 5 kHz, Vin = 190 V; flow = 1 L/min.
Plasma 05 00007 g019
Table 1. Plasma reactor parameters.
Pipe (Borosilicate)Electrodes (Copper Rings)
Permittivity7Width5 mm
External diameter4.5 mmDistance between electrodes3 mm
Thickness0.8 mmDistance to outlet5 mm
Publisher’s Note: MDPI stays neutral with regard to jurisdictional claims in published maps and institutional affiliations.

