1. Introduction
Wildfire is a major hazard in Mediterranean ecosystems [
1], and particularly in southwestern California, USA, in part due to the extensive and complex wildland-urban interface [
2]. Prior to European settlement, fire-adapted vegetation and climatic conditions facilitated large, infrequent wildfires that occurred primarily when summer ignitions were held over into autumn and then exploded across the landscape during autumn katabatic wind events, known locally as ‘Santa Ana’ winds [
3]. Today, the high density of anthropogenic ignitions has increased the frequency of large fires and expanded the fire season to year-round, fundamentally altering fire regimes [
4,
5]. Improved understanding of altered fire regimes and their impacts is crucial to both regional fire management agencies seeking to reduce catastrophic wildfires [
6] and to those seeking to protect threatened ecosystems in the face of changing climate and ex-urban growth.
There have been many impacts of human-driven alteration of fire activity in southwestern California, including the emergence of two divergent fire regimes across the region [
7]. Globally, most fire-prone regions are characterized by a singular type of fire regime that is prescribed by dominant vegetation, climatology, and ignitions [
8,
9,
10]. Southwestern California, by contrast, has two distinct types of wildfires that are delineated seasonally through atmospheric circulation patterns [
7,
11]. One fire regime is associated with Santa Ana winds that occur when a strong regional pressure gradient produces downslope offshore katabatic wind events across the southward and westward facing slopes of the peninsular and transverse ranges. The other fire regime, which was previously designated a ‘non-Santa Ana’ regime [
7], is characterized by the absence of Santa Ana conditions. Santa Ana winds occur predominately during the cool season (October–April), and often peak in terms of frequency and intensity in mid-winter [
12], but due to the typical seasonal cycle of precipitation in Mediterranean climates, Santa Ana-driven fires often peak during the autumn prior to the seasonal onset of precipitation when fuel moisture remains low. By contrast, non-Santa Ana fires predominately occur during the summer months when synoptic-scale winds are generally weak. Several recent studies have begun to demonstrate the distinctions between these two regimes, including modeling their dominant drivers and socioeconomic impacts [
7,
11,
12,
13], but they have not yet delineated spatial extents to determine if well-defined boundaries exist between regimes.
Parallel to rapid ex-urban population growth in southwestern California and observations of human-induced changes in fire regimes, there have been numerous, high-profile, ‘disaster’ wildfires over the last several decades [
1]. These wildfire disasters are characterized by both civilian and firefighter fatalities, extensive loss of homes and infrastructure, and state or federal declarations of a disaster area due to the widespread losses and economic impacts [
1,
13]. As southwestern California has experienced more wildfire disasters than anywhere else in the US [
14], it is critical to improving our understanding of wildfires in this region. The primary objectives of this study were to delineate the spatial extents of these two distinct wildfire regimes in southern California and to improve our understanding of the causes of these fires for decision-support needs, particularly in fire prevention and conservation. The potential geographic differentiation of southern California wildfire regimes is a key gap in the literature, and necessary to determine if a “one-size-fits-all” management strategy is appropriate or if it can be improved upon.
First, we sought to spatially represent locations on the landscape associated with high frequency of wildfire, and to delineate between the two primary fire regimes based on the presence of katabatic winds coincident with ignition dates. A novel aspect added here is that no prior study has delineated a small but important subset of wind-driven fires within the larger southern California fire history. This subset of fires occurs only in the area around Santa Barbara, California, where a mesoscale weather pattern produces katabatic winds known locally as ‘Sundowners’ [
15]. Sundowner winds occur in a narrow (<100 km) stretch of coastal plain where the Santa Ynez mountains run almost due east-west and rise dramatically above the coastal plain, producing a steep elevational gradient and contrast between maritime and interior air masses. Sundowners are a mesoscale circulation that arises due to the interaction of synoptic atmospheric circulation with topography and can produce localized hot and dry winds similar to Santa Ana winds [
16], although the two do not often occur concurrently due to the prevailing circulation required. Owing to the close proximity of densely populated Santa Barbara and surrounding communities, Sundowner-associated fires have been some of the most destructive wildfires regionally, despite relatively smaller sizes (e.g., the 2009 Jesusita Fire consumed 80 homes despite burning only 3534 ha). These conflagrations have often occurred in spring months, suggesting a third key period of fire danger for regional fire management outside of the summer and autumn peaks [
17,
18]. However, the proportion of the southwestern California fire history attributable to Sundowner events has not been quantified.
Second, we sought to understand how patterns of fire frequency were related to various sources of ignitions. As dry lightning in the region is limited [
19] and most wildfires are human-caused [
5], one of the keys for preventing wildfire disasters is identifying and mitigating controllable human ignition sources. Such delineation helps to direct public education and outreach efforts, which have been shown to significantly reduce certain types of wildfire ignitions, particularly those that were accidental [
20]. It can also support policy development by identifying where municipalities can focus regulatory code revisions to reduce ignitions associated with regulated activities such as power tool use or power line construction.
In addition to addressing these two primary objectives, we include a short case study on the 2017 Thomas Fire, which, as of this writing, is the largest fire in the recorded history of California. While the media coverage of the fire focused on fire size and homes consumed, we found that the Thomas Fire was also notably anomalous in the context of our spatial analysis. Here, we build on previous research from [
7] and expand the temporal range to spatially and temporally delineate fires into those that are driven primarily by katabatic winds, including both Santa Ana and Sundowner winds, and those that are not.
2. Materials and Methods
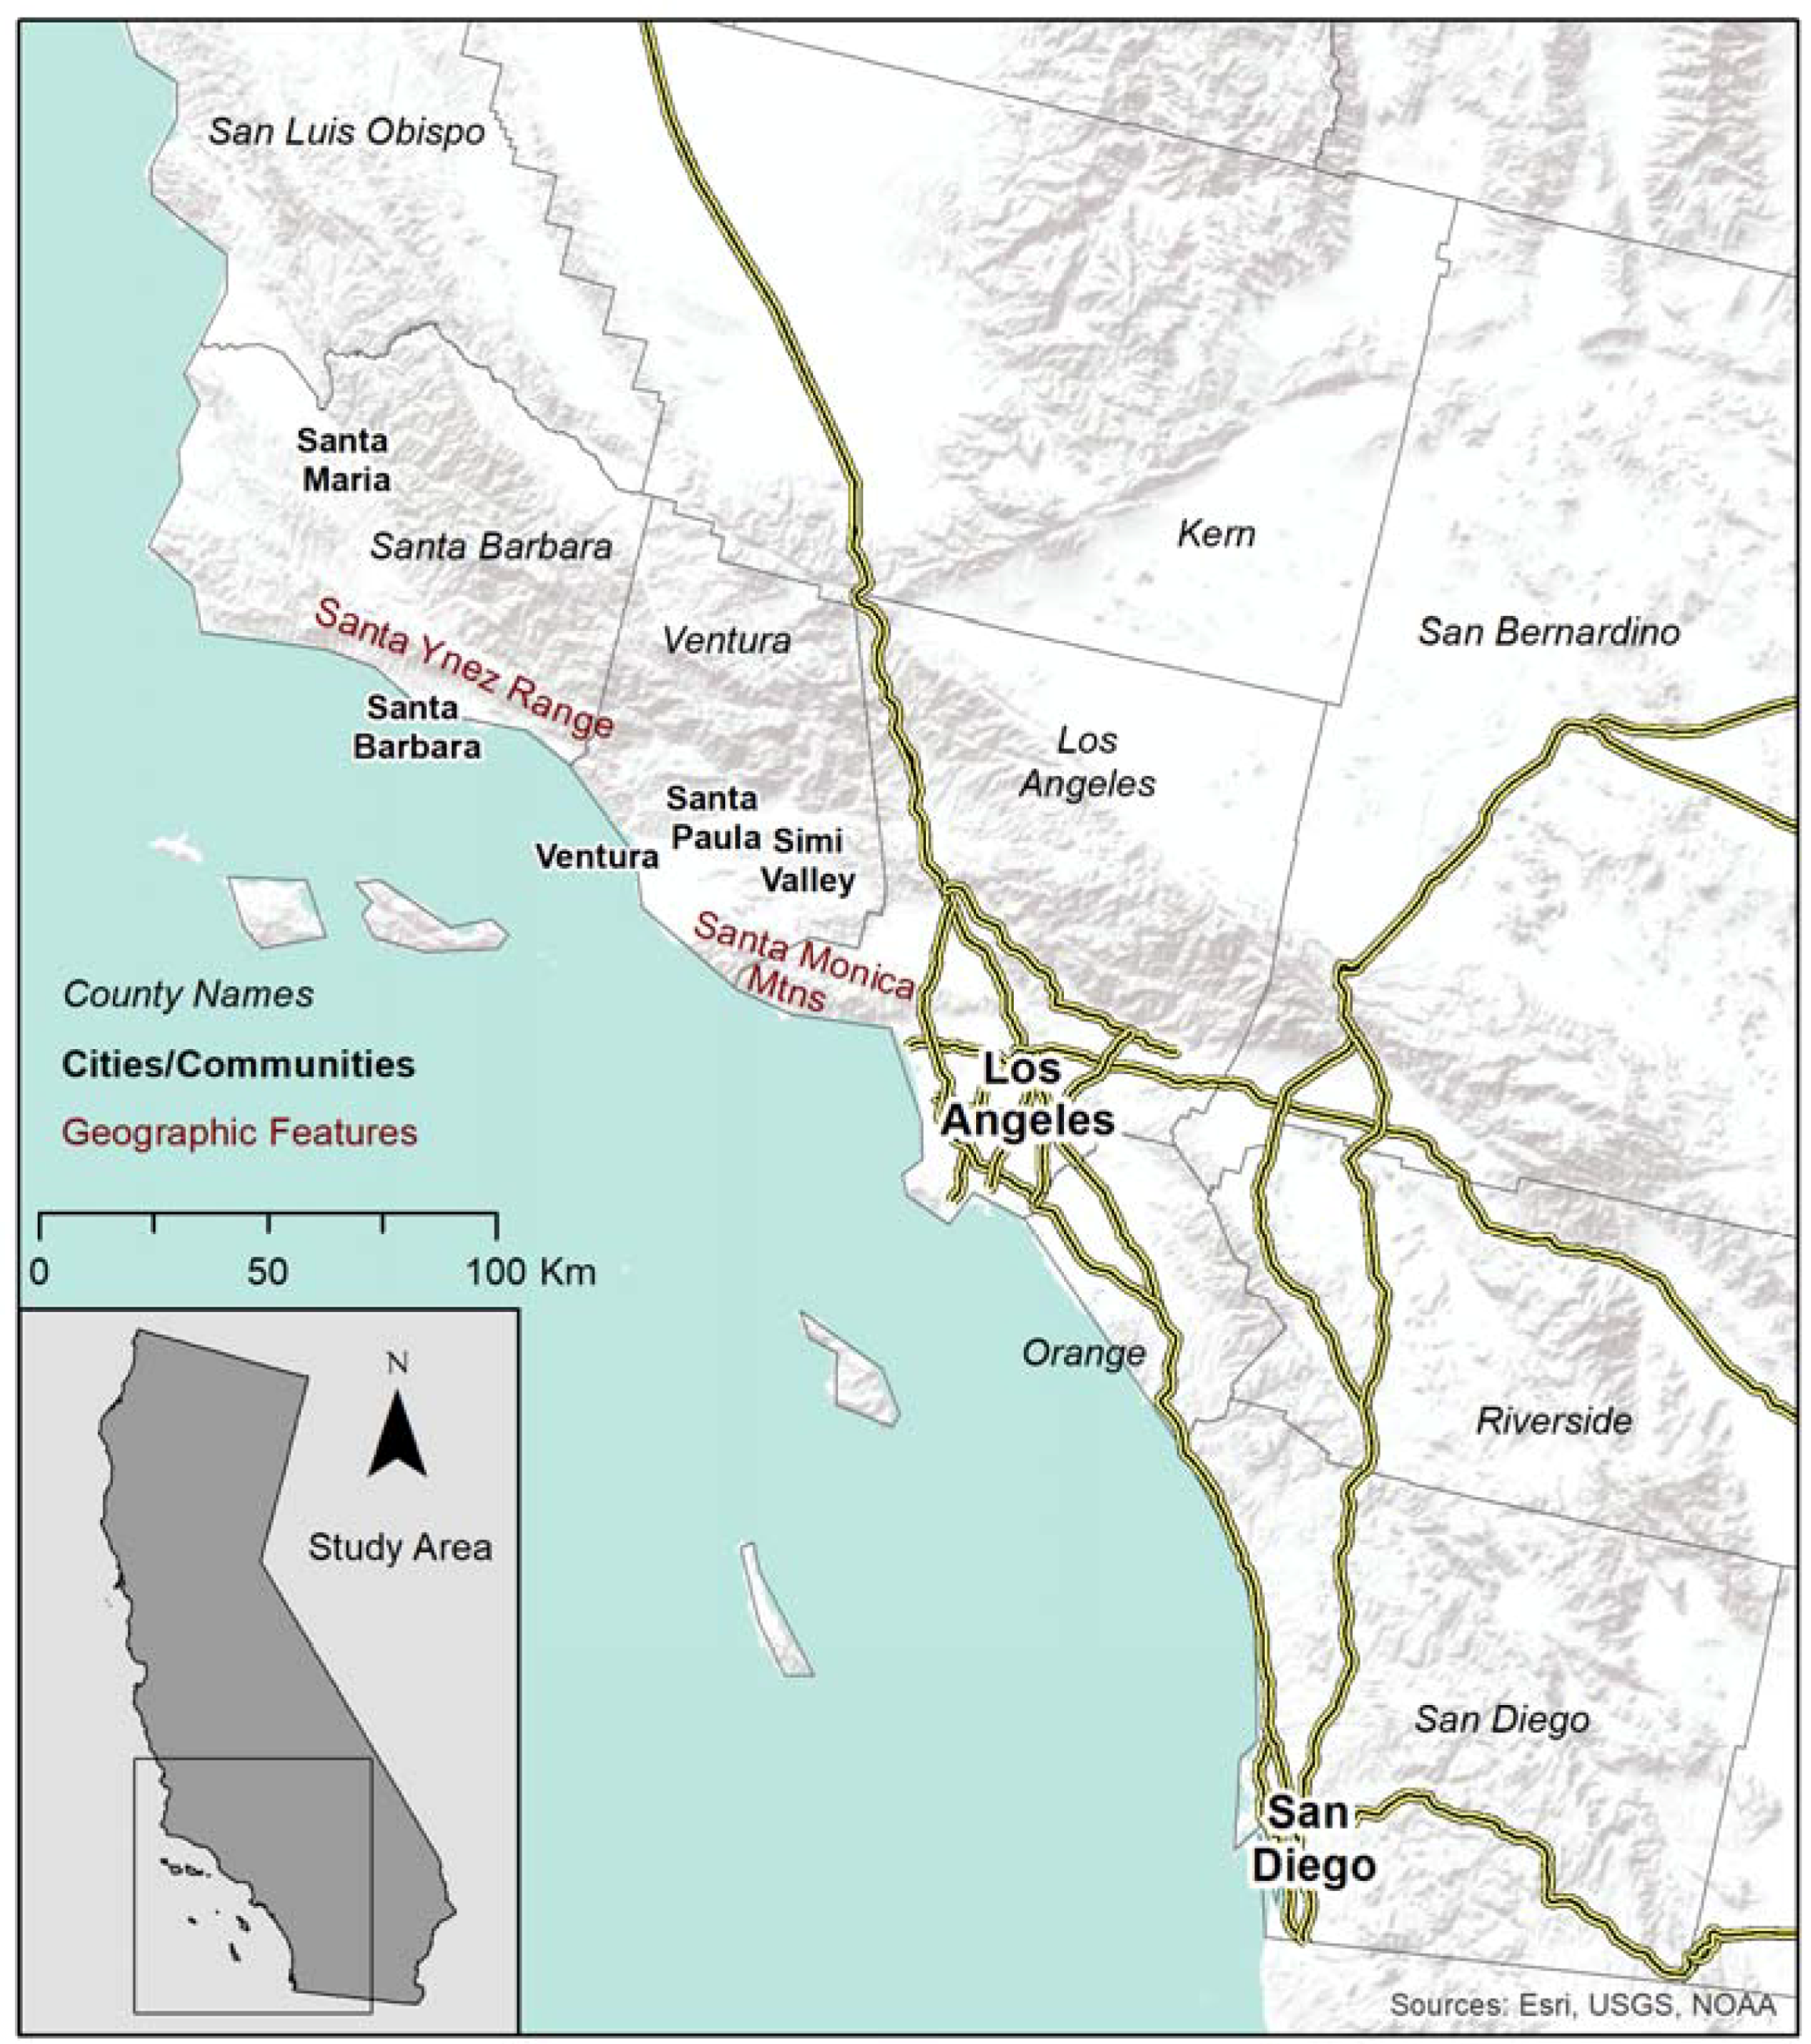
The study area comprises the topographically-complex coastal and transverse mountain ranges of southern California (
Figure 1) and is limited to Mediterranean ecosystems between the USA–Mexico border and the northern boundary of San Luis Obispo County. This includes the greater area encompassing the public lands managed by the Angeles, Cleveland, San Bernardino, and Los Padres (excluding the Monterey District) National Forests, as well as the Santa Monica Mountains National Recreation Area, and includes the relatively urbanized coastal plains but excludes the inland desert and valley regions. This covers all or portions of eight counties from north to south, including San Luis Obispo, Santa Barbara, Ventura, Los Angeles, San Bernardino, Orange, Riverside, and San Diego. This region is characterized by a long, dry summer and a wet winter, and sees primarily anthropogenically-ignited fires. The historical fire return interval (i.e., prior to European settlement) is difficult to quantify due to a lack of long-term dendrochronological records and relatively early settlement by Spanish in the 16th century. However, widespread fire-adapted vegetation capable of resprouting quickly after fire supports ecological investigations suggests that the region has always experienced very large, wind-driven, stand-replacing wildfires [
3].
2.1. Fire Frequency and Pattern
We utilized the California Department of Forestry and Fire Protection (CAL FIRE) Fire and Resource Assessment Program (FRAP) fire perimeter database to classify fires from 1948 to 2017 according to whether Santa Ana (SA), Sundowner (SUN), or non-katabatic (NK) conditions were coincident with ignition. We further characterized spatiotemporal patterns of classified fires and assessed ignition causes for katabatic versus non-katabatic wind fires. A chronology of Santa Ana katabatic wind events delineated by Abatzoglou et al. [
12] from reanalysis was updated here through 2017. At time of analysis, CAL FIRE had not yet updated its database with the 2017 fire perimeters, so we downloaded 2017 fire perimeters for the study region from GeoMac [
21] and attributed them with ignition dates and cause (if known) using CAL FIRE and Inciweb official reports for the fires [
22,
23].
No publicly available chronology of Sundowner wind events exists. In the interest of having a consistent database compatible with the period of record for the fire database and Santa Ana wind chronology, we used reanalysis data and the synoptic characteristics of Sundowners as defined by [
24]. Specifically, we diagnose Sundowner winds based on two criteria: (a) a strong positive mean sea level pressure gradient between airports at Santa Maria, California (SMX) and Santa Barbara, California (SBA); and (b) strong northerly winds at 850hPa. These criteria were developed using station-based data [
24], but were applied to coarser resolution (2.5°) 6-hourly NCEP-NCAR reanalysis. To facilitate an equitable comparison between station-based thresholds from [
24] and reanalysis data, we used thresholds in reanalysis data corresponding to equivalent quantiles of established station-based thresholds (e.g., SMX minus SBA sea level pressure difference > 1.8 hPa) using a shorter overlapping record of station and reanalysis data. The resulting criteria were a SMX minus SBA pressure difference > 0.5 hPa, and 850 hPa winds > 7 m/s from the north (315° to 45°). A Sundowner day was further qualified as any calendar day when at least one of the four 6-hourly data periods met the stated criteria.
We utilized the alarm (or detection) date attributed to each fire by CAL FIRE as a proxy for ignition date and classified each fire as SA, SUN, or NK. For more recent fires, it is unlikely these dates differ due to modern detection technologies, but for older fires the true date of ignition may precede the alarm date by a day or two, although it is likely that little growth occurred during this gap window based on lack of detection. Although individual wildfires may experience a range of atmospheric conditions during active fire, we sought to identify the conditions under which fires experienced most of their initial growth and hence constrained our focus to ignition dates. We classified any fire that burned on the south face of the Santa Ynez Range as SUN if it had an ignition date within three days of a Sundowner event. Next, we classified all other fires with ignition dates within three days of a Santa Ana wind event as SA, and classified all remaining fires not associated with Santa Ana or Sundowner winds as NK. The three-day window was chosen because it conservatively encompasses what is known in fire management as the ‘initial attack’ period: the first 24–48 h after the fire is reported when fire suppression resources are focused on responding to and suppressing the fire (rather than developing an extended plan of attack) and when the vast majority of fires are controlled.
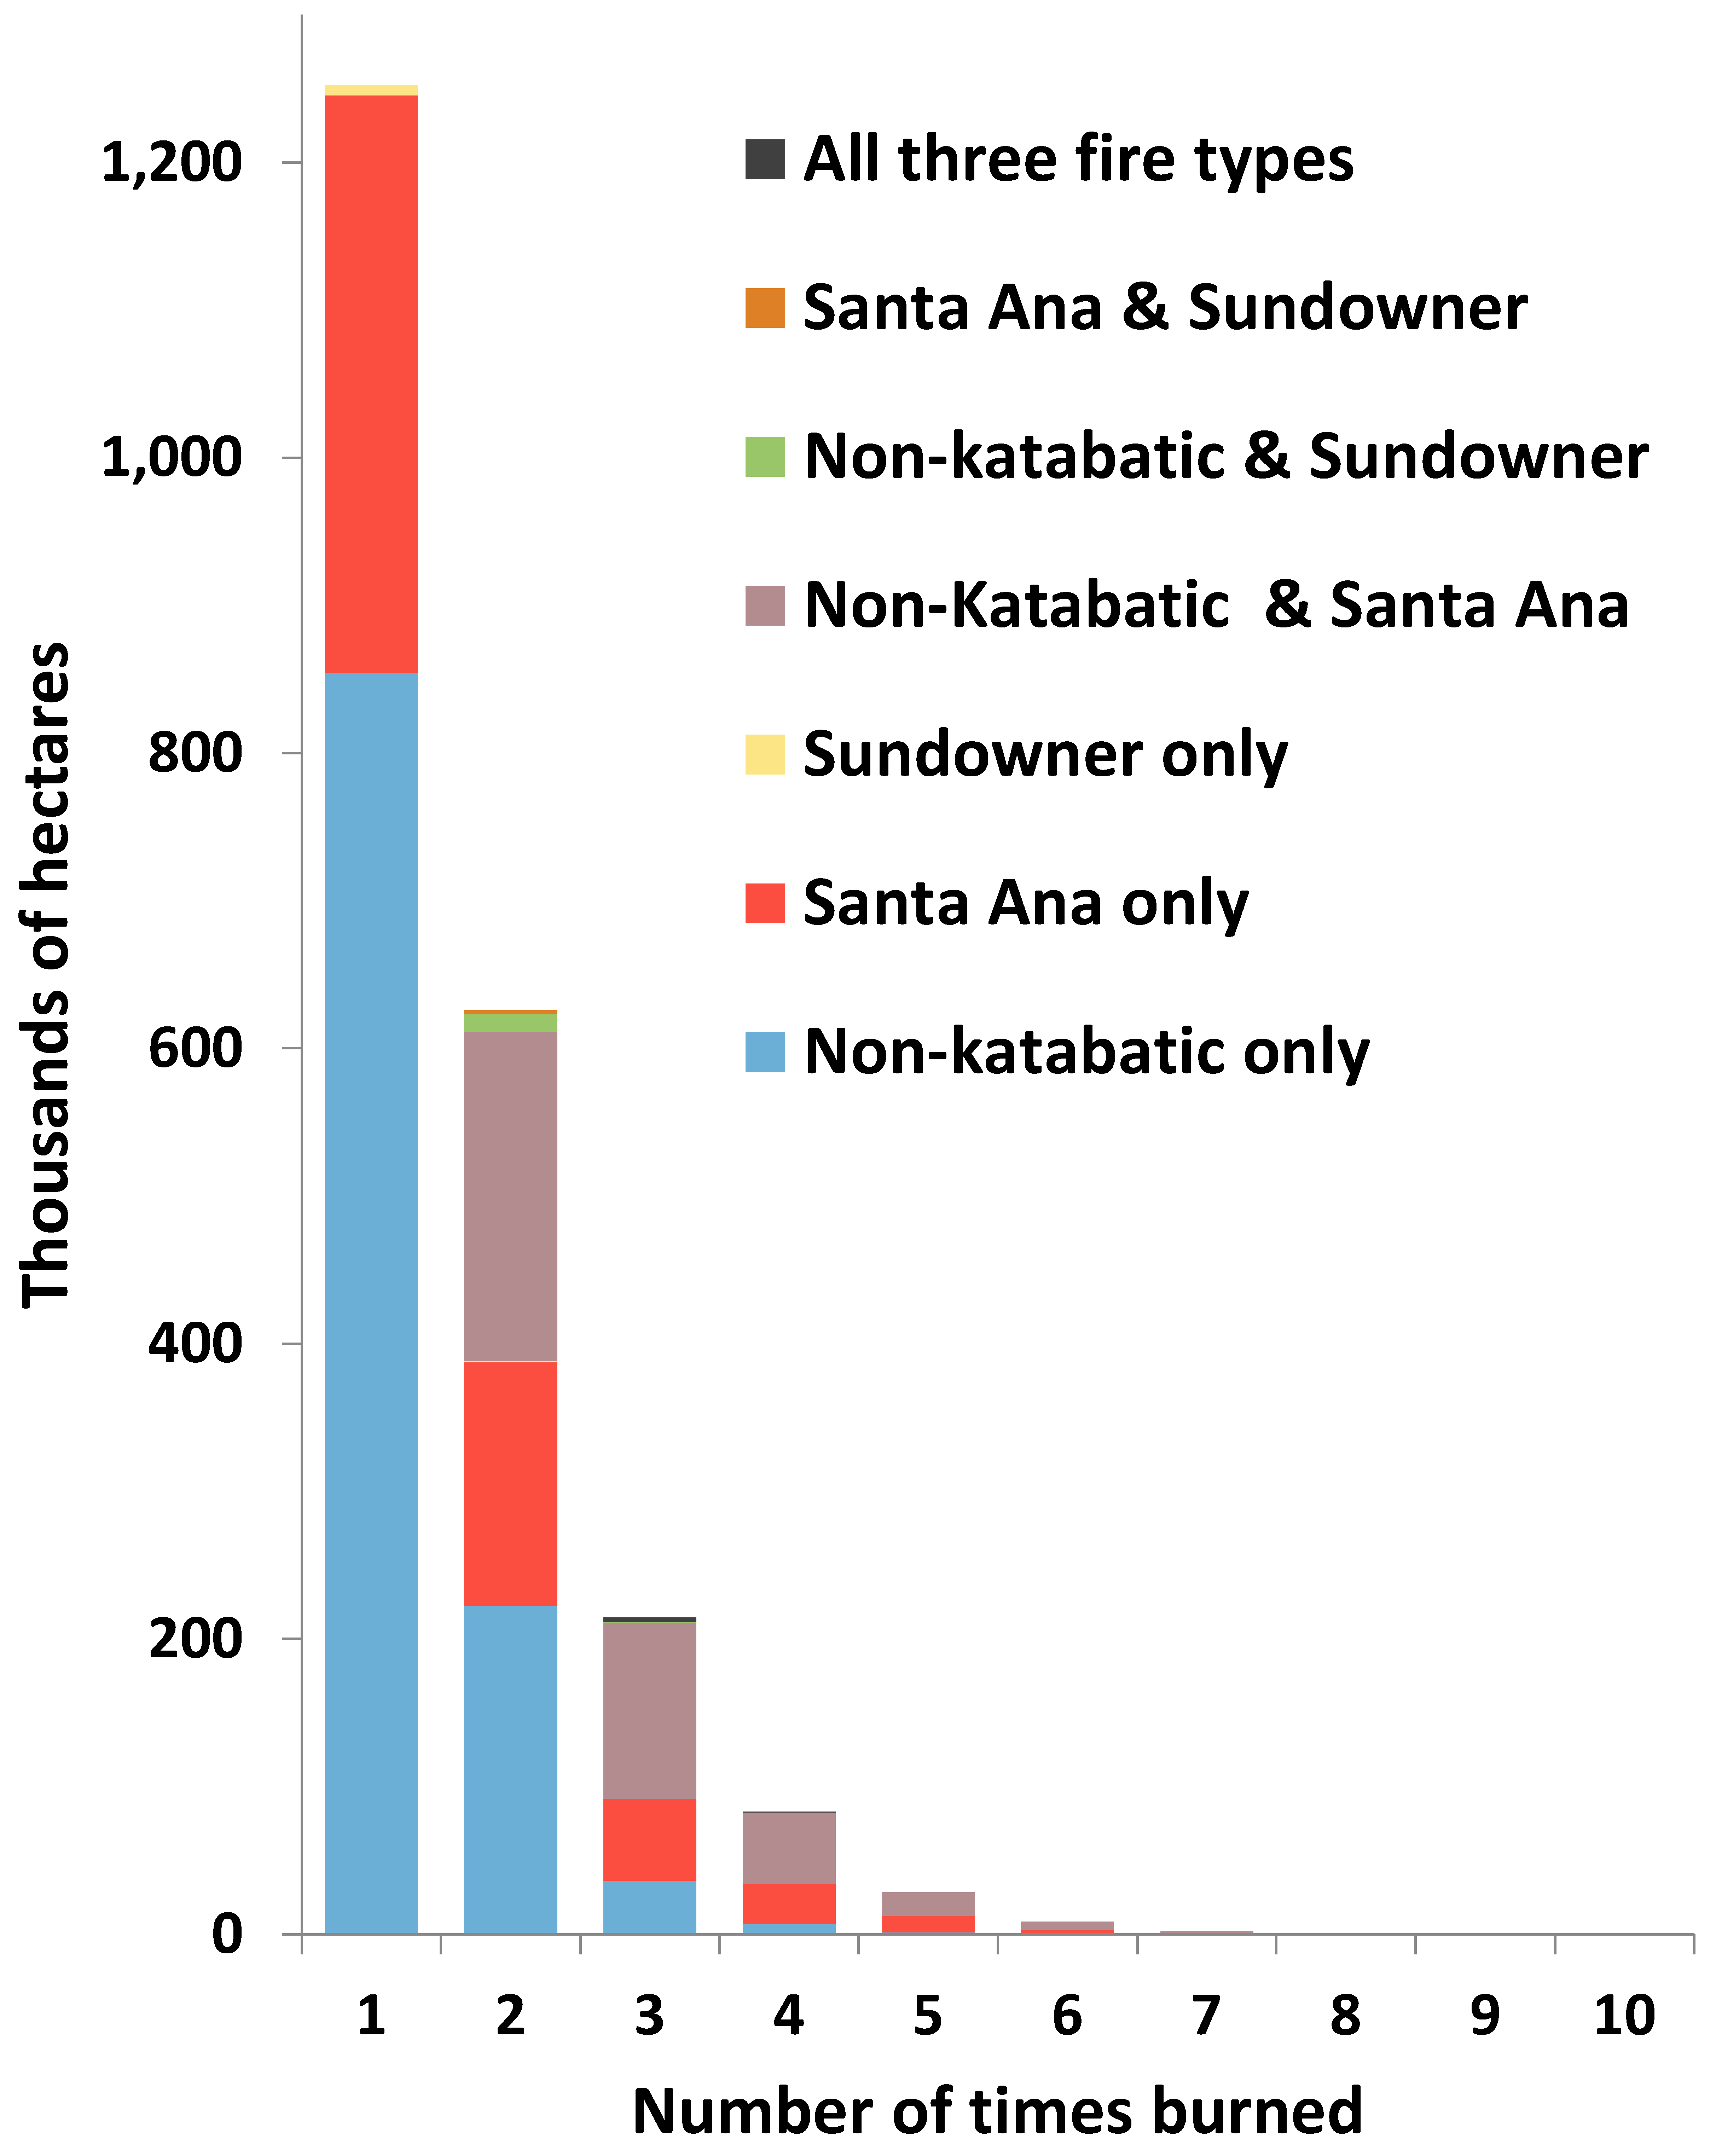
We counted the overlapping polygons to quantify the number of times each location on the landscape had burned for each class of wildfire for the period 1948–2017. We conducted this classification and spatial analysis for 4411 total fires that burned a collective total of 3,695,060 ha. A total of 894 out of 5306 fires representing 158,655 ha burned (4% of the total area burned) did not have alarm dates attributed, nor could we find these alarm dates through basic searches and cross-checking with other historical fire datasets (e.g., the Fire Program Analysis data [
25]). As such, we excluded these undated fires (Supplemental Data S1) for the analysis. We note that while this dataset is not complete for the period of record due to omissions in the FRAP data, it is representative of the fire regimes of the study area.
2.2. Ignition Analysis
We stratified the ignition causes identified in the FRAP data by whether the fire was classified as katabatic or not and tested for significant differences in the expected proportion of fires ignited by each cause using a Chi-square test with an α value of 0.05. We similarly tested for differences in area burned by ignition type. For the ignition analysis, we combined SUN and SA fires into a single katabatic wind category, as the number of Sundowner-associated fires was too low for a separate analysis.
2.3. Thomas Fire Case Study
The Thomas Fire ignited near Santa Paula in Ventura County on 4 December 2017, during a strong and prolonged Santa Ana wind event. Ultimately, the fire burned 113,885 ha, becoming the largest fire in the modern record for the state of California. The fire also resulted in one firefighter fatality and consumed 1063 structures (with an additional 280 structures damaged); most of these were destroyed in the first 48 h of the event. In addition to the size of the fire, several anomalies were observed during the Thomas Fire in the context of this study, warranting a more in-depth case study analysis of this fire. We utilized reports and data from the National Interagency Fire Center FTP site (
ftp.nifc.gov), the USFS Inciweb fire incident reporting website (
www.inciweb.gov), the CAL FIRE incident reporting website (
http://cdfdata.ca.fire.gov), and the National Interagency Situation Report (
www.nifc.gov/nicc/) to analyze the event.
4. Discussion
4.1. Fire Frequency and Pattern
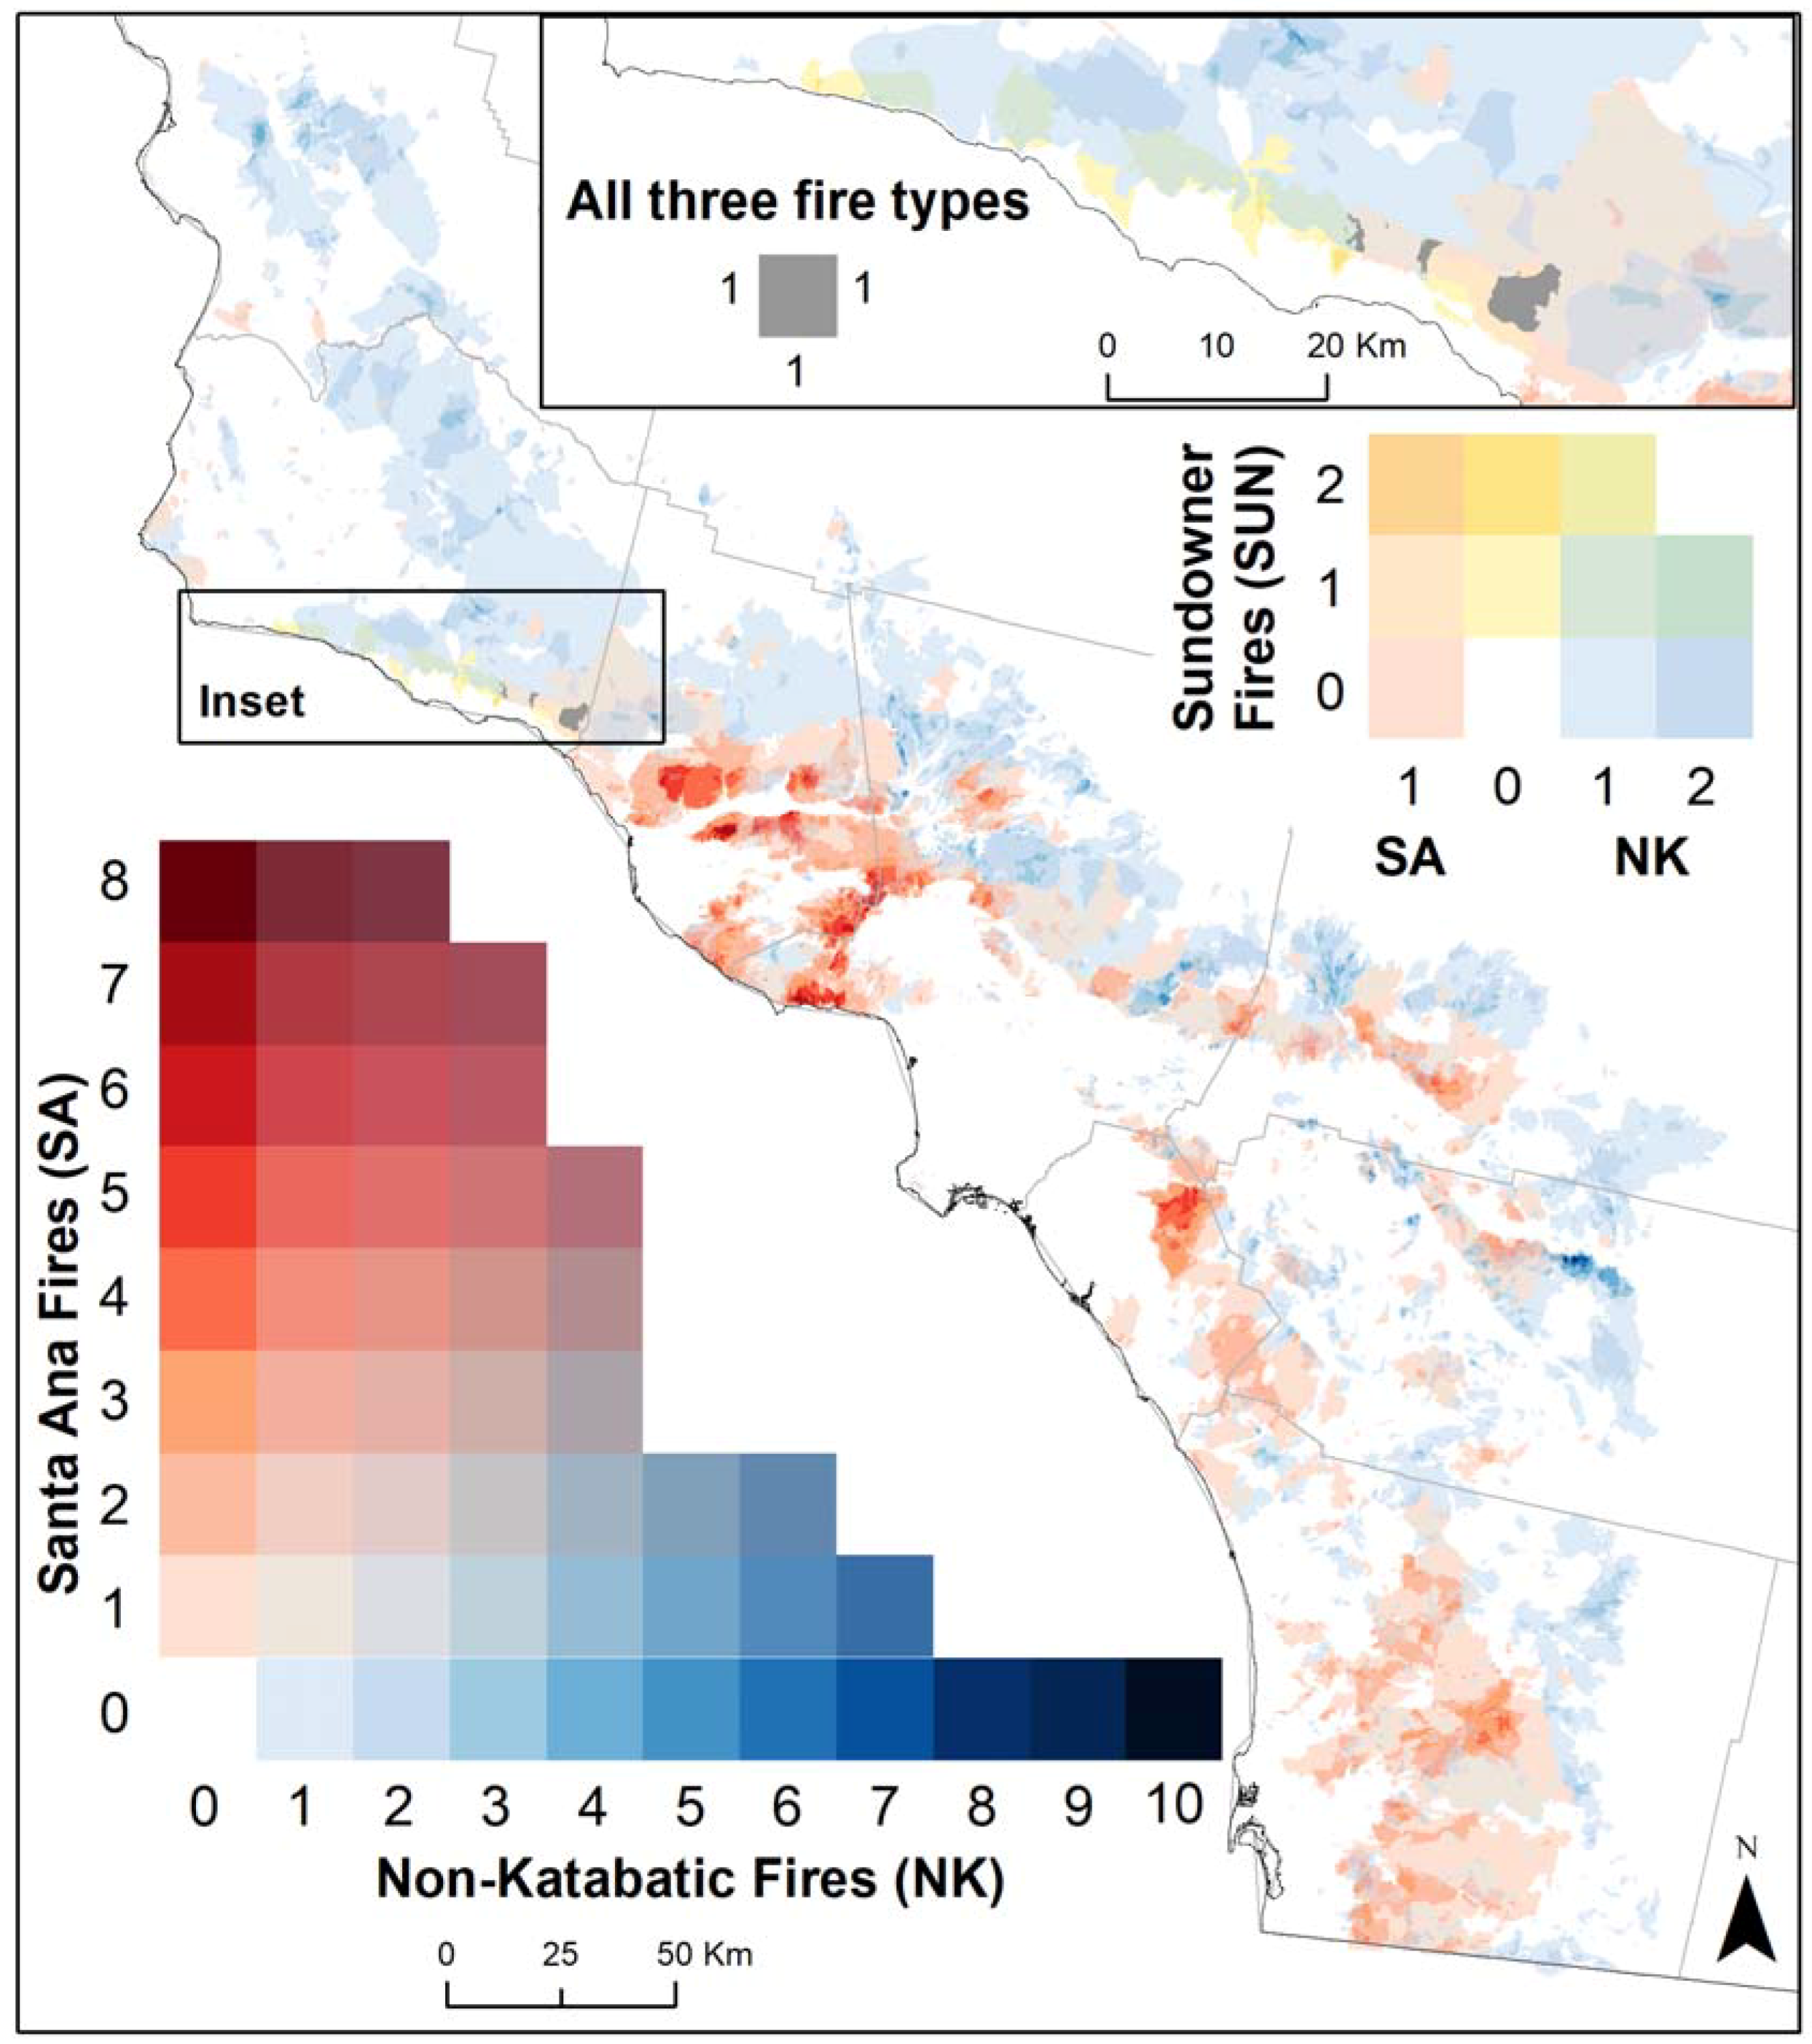
The two primary types of ignition conditions in southern California (during katabatic winds and in the absence of such winds) not only have seasonal patterns [
7] but distinct spatial patterns as well (
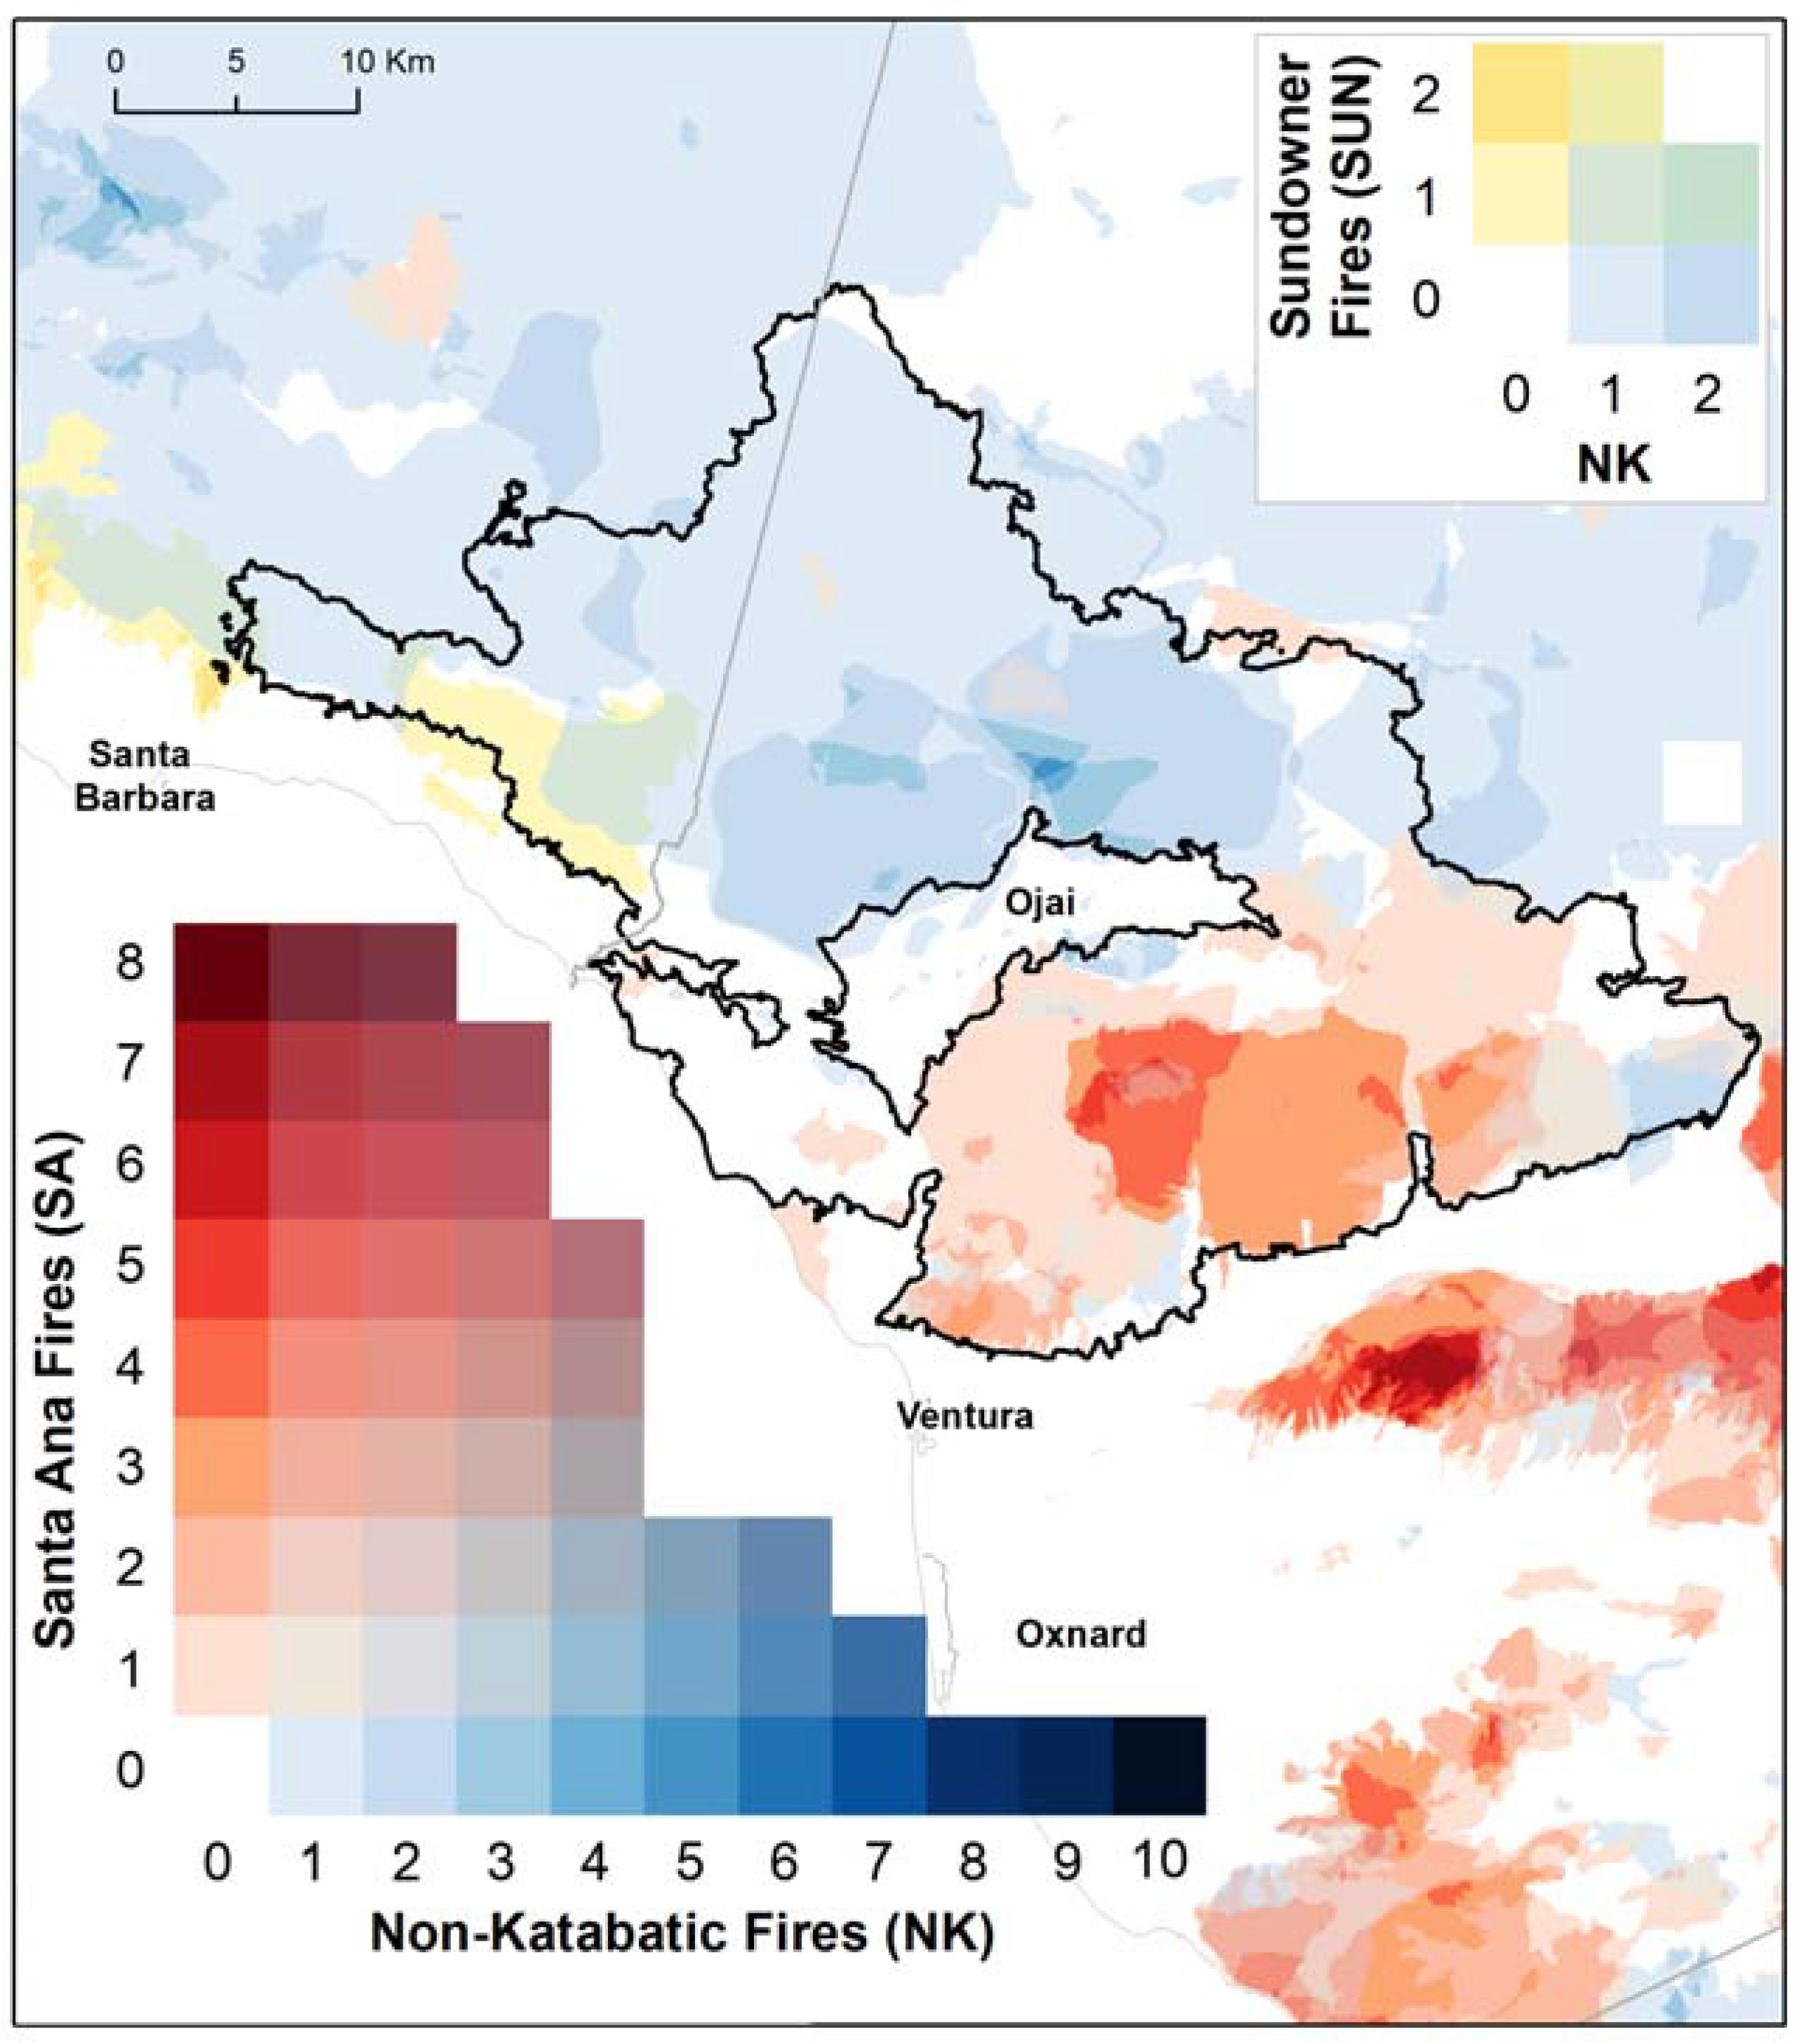
Figure 2), with only 20% of the landscape burned between 1948 and 2017 experiencing both types of fire. In addition to the widely recognized Santa Ana fires that occur under katabatic wind events and are responsible for a disproportionately large area burned in the region, we identified 16 wildfires that occurred under local Sundowner katabatic winds along the south face of the Santa Ynez Range in Santa Barbara County.
While Sundowner fires were few in both number and total area burned, they represent a unique threat to the communities of the Santa Barbara coast, and require individual recognition in order for fire management to effectively mitigate the risks of such fires. The 2009 Jesusita Fire illustrates this need clearly. This fire ignited on 5 May 2009, when two contractors were using power tools to clear vegetation along a local hiking trail. They failed to recognize the fire danger posed by the forecasted Sundowners following a dry winter, stating later that they believed conditions were appropriate for using power tools.
Prior studies have noted the spatial pattern of the most intense Santa Ana winds as a predictor of large fires [
26]; this study delineates observed fire extents for a 70-year period and demonstrates that these areas of highest fire danger under Santa Ana conditions also rarely, if ever, experience large fires when katabatic winds are not present. Further, this study demonstrated that, contrary to the suggestion from [
26] that large fires are primarily spatially associated with these Santa Ana wind hotspots, large fires also occur outside of these hotspots, but under non-katabatic wind conditions.
The Santa Monica Mountains and greater Simi Valley experienced the most repeat fire driven by Santa Ana winds, and had little evidence of non-katabatic large fire growth, consistent with prior assessments of high fire danger during Santa Ana conditions [
26,
27]. As there is a high rate of fire ignitions in the study area due to high human population density [
5], this may suggest that fires occurring under non-katabatic conditions are easily suppressed, due to factors such as relatively high fuel moisture associated with the marine layer [
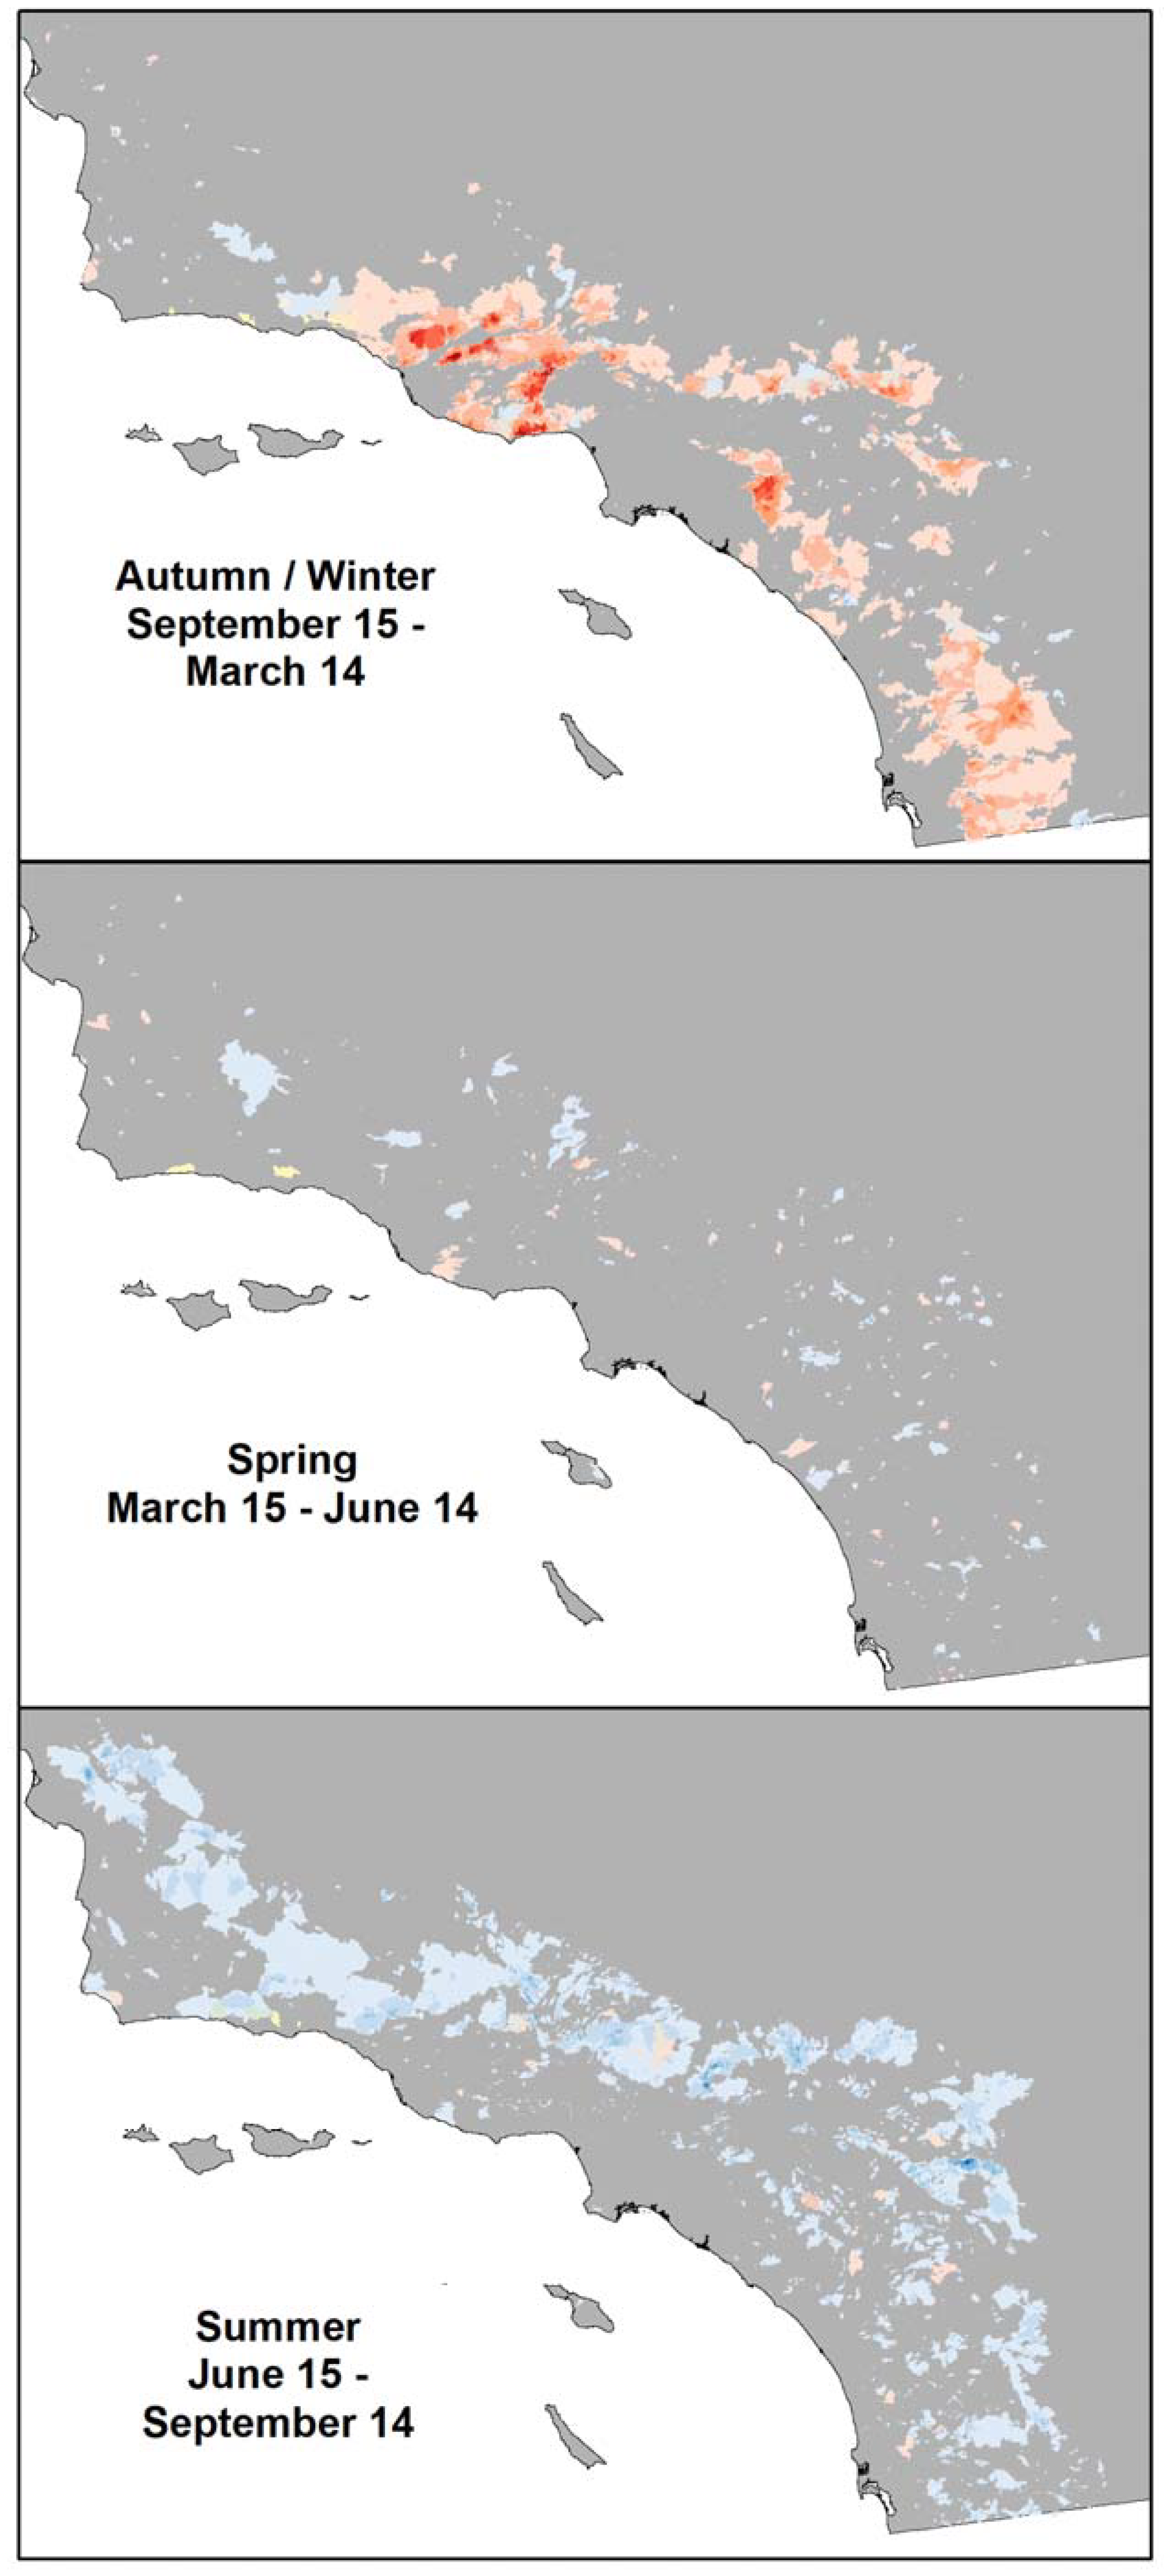
28]. Additionally, the spatial dichotomy of these fire regimes is likely also a byproduct of the seasonality of extreme fire danger, defined by days where the Burning Index calculated using the US National Fire Danger Rating System and a gridded surface meteorological dataset [
29] from 1979–2017 exceeds the 95th percentile. A clear delineation is observed seasonally, with the most extreme fire danger occurring during the cool season; in locations such as the Santa Monica Mountains, it is over 90% of days (
Figure S3). In contrast, this same area is often affected by inland penetration of marine stratus during the peak summer fire season (late spring until late summer [
30]). The seasonal dissipation of the marine stratus regime in early fall and the onset of offshore katabatic winds result in the unusual seasonality of extreme fire danger along coastal southern California.
By contrast, the highest frequency of repeat fire in the absence of katabatic winds occurred adjacent to interstates and other major highways (e.g., Interstates 5, 10, and 15) as they traverse mountain passes (
Figure S1) where extreme fire danger is more confined to the summer months. Given that prior research has found major roads to be one of the best predictors of fire activity in southern California [
31,
32], these results suggested to us that high frequency, repeated burning in these passes is likely due to ignitions associated with the high volume of automobile traffic, including collisions, vehicle overheating, and the improper disposal of cigarettes, and that fires likely are difficult to suppress as they race away from traffic-clogged freeways.
One interesting aspect of Sundowner fires in this study is the historical spatial separation between Sundowner fires and Santa Ana fires. While each type of katabatic wind fire has overlapped with fires occurring under non-katabatic wind conditions, there was no evidence that large Santa Ana fires previously impacted the Santa Ynez Range, and Santa Ana fires did not previously overlap with Sundowner fires prior to 2017. It is also notable that this changed in December 2017; the Thomas Fire not only became the largest southern California wildfire in modern history based on the FRAP data used herein, it also became the first Santa Ana wildfire to overlap an area previously burned by a Sundowner wildfire as it burned across the eastern end of the Santa Ynez Range (
Figure 5). A megafire occurring under late-season Santa Ana conditions burning into an area that previously only ignited during Sundowners or under non-katabatic wind conditions (and primarily in the summer) is both noteworthy and concerning for fire management. Fire managers utilize past experience and observations of past fire behavior to develop appropriate suppression responses to new fires. For example, staffing levels at fire stations are based on historical fire behavior and expected fire potential, and extreme anomalies may overwhelm available resources.
4.2. Ignition Patterns
We found clear differences in ignition patterns between fires occurring with katabatic winds and those that did not. It is not surprising that non-katabatic fires were much more likely to be ignited by lightning, as the spatial and temporal patterns of lightning in the region are antipodal to those of katabatic wind occurrence. Large non-katabatic wind fires predominantly occur more inland at the highest elevations and during mid-summer, which is the peak period for lightning ignition in the region [
19], whereas katabatic wind fires primarily occur in the autumn (associated with Santa Anas) (
Figure 7). In contrast, the fact that the proportion of katabatic fires ignited by electrical power was more than twice the proportion of non-katabatic fires points to the role high winds may play in igniting new fires, whether through electrical arcing, trees or branches falling on power lines, or utility poles falling over. Overall, however, what is perhaps most remarkable about the ignitions patterns is that the ignition source is unknown or unpublished for 59% of all fires representing 43% of all area burned. This includes many of the largest and most destructive fires (including the 2017 Thomas Fire, as of publication), demonstrating that even for high-profile fires where there is considerable pressure to identify a cause, investigators are often unable to do so. This gap in forensic capacity is a potential area for research to improve cause detection, as identifying ignition sources is necessary to develop new laws, policies, outreach, and education campaigns to reduce human ignitions in those categories.
4.3. 2017 Thomas Fire
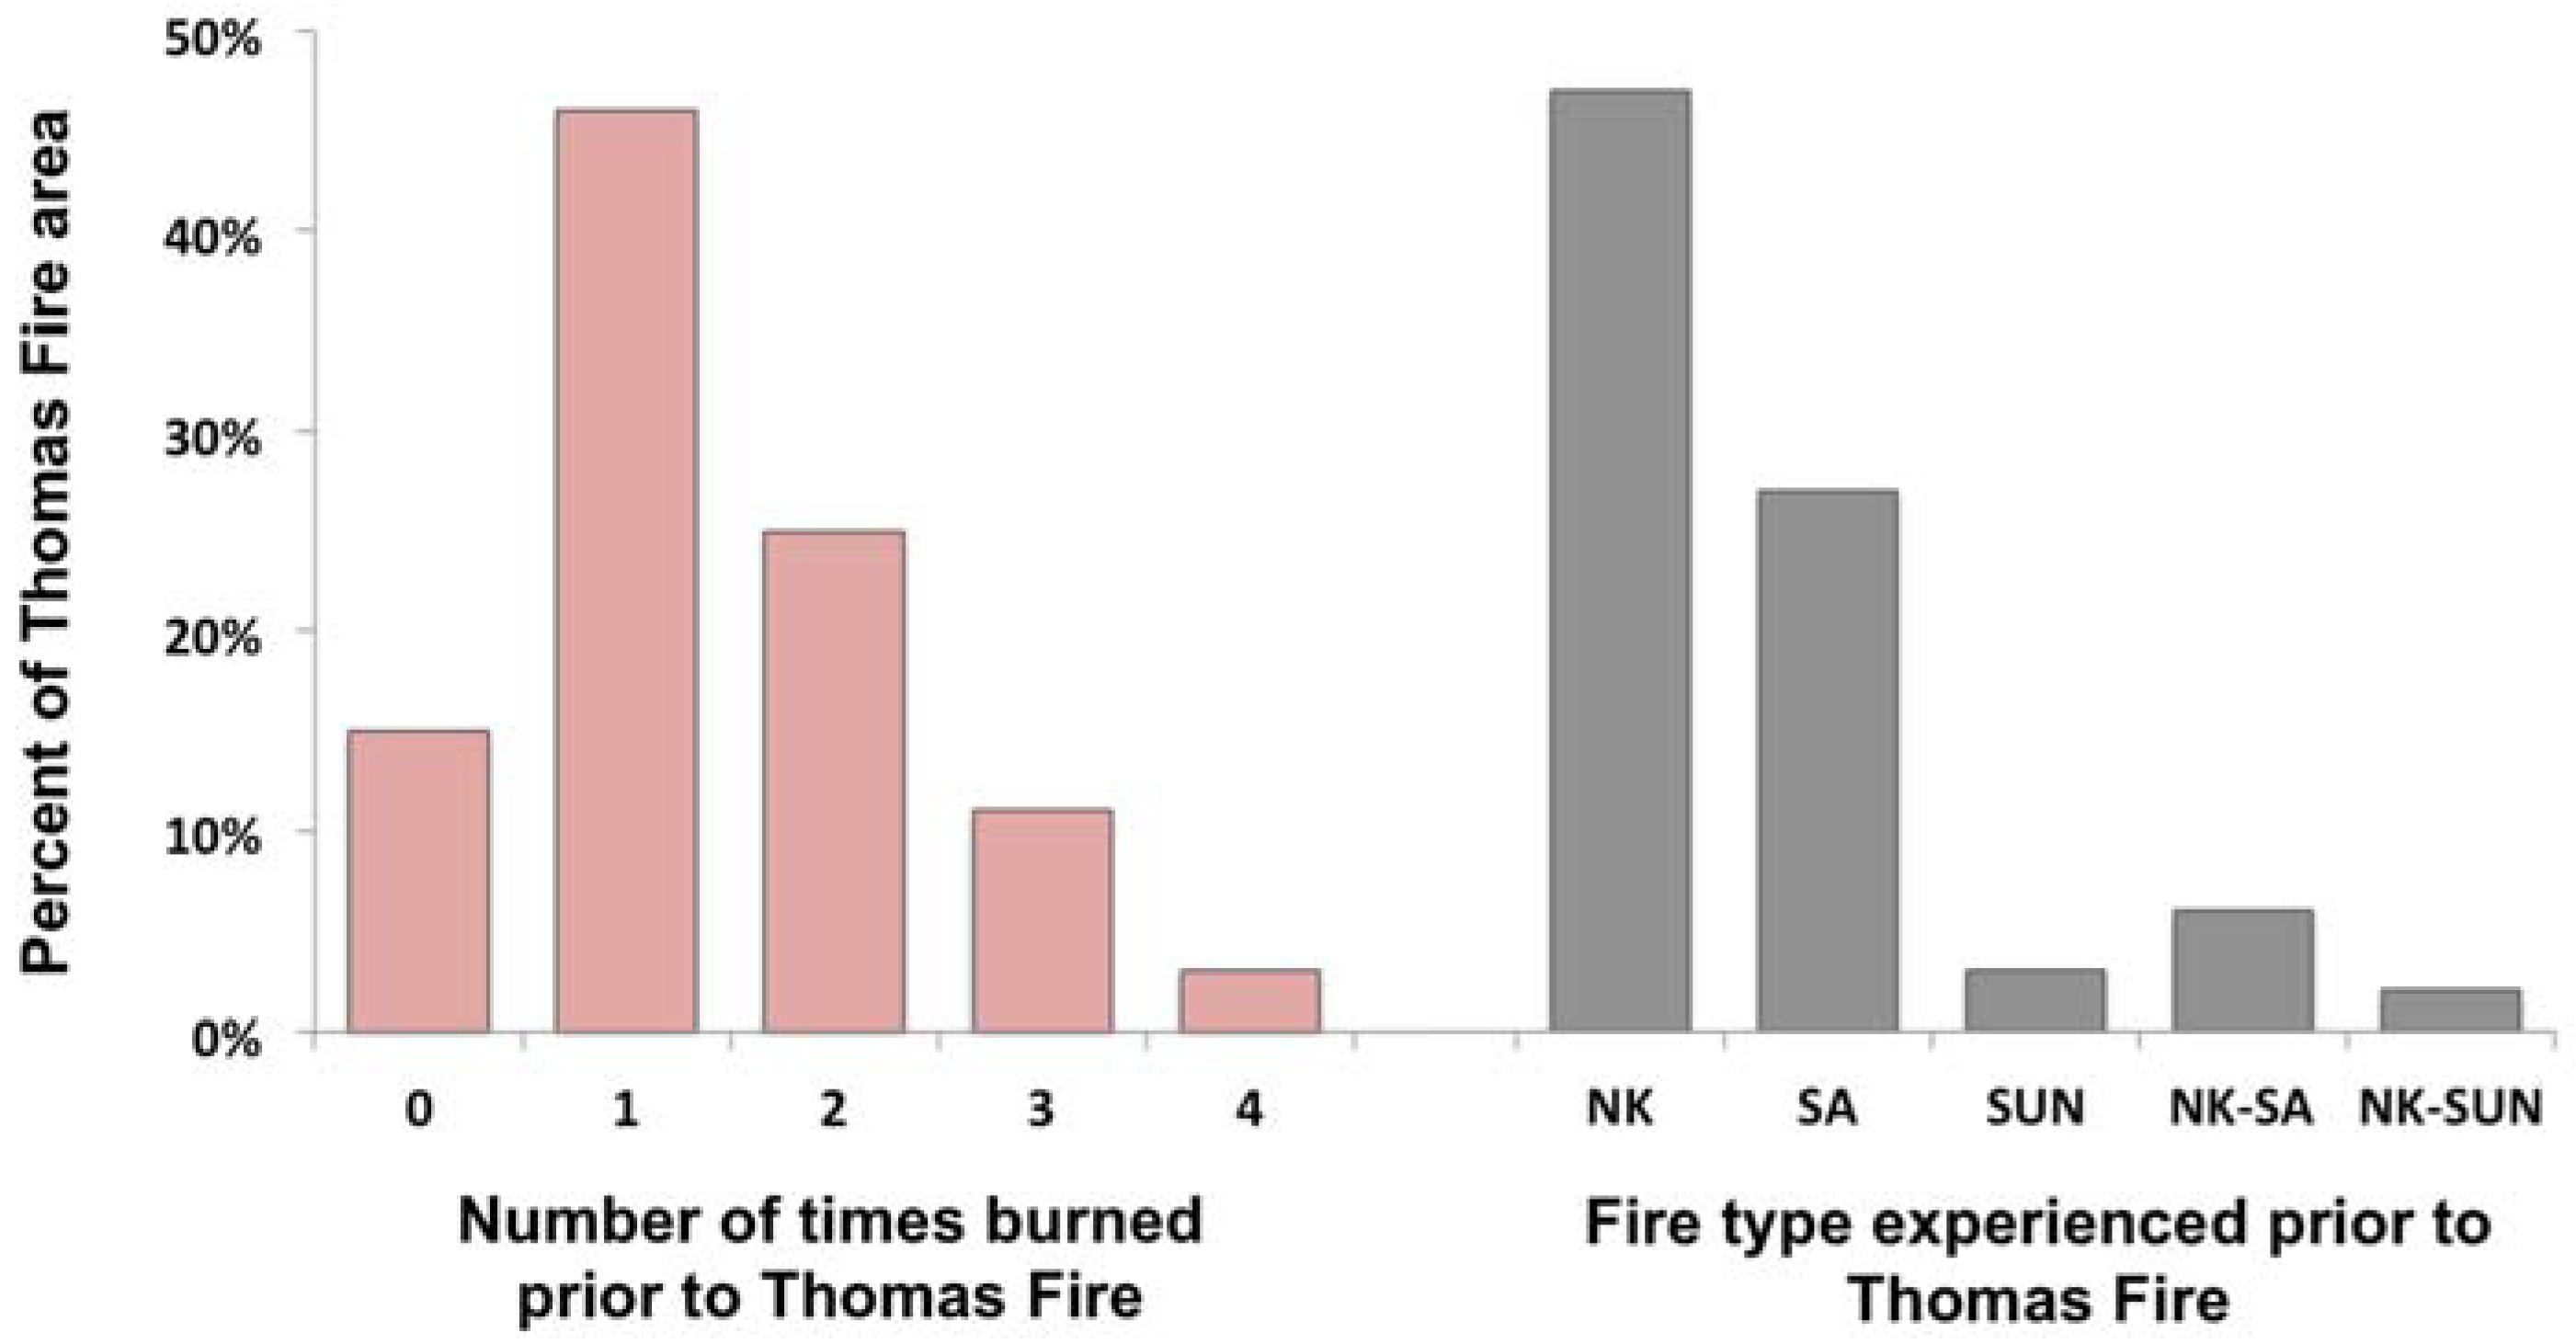
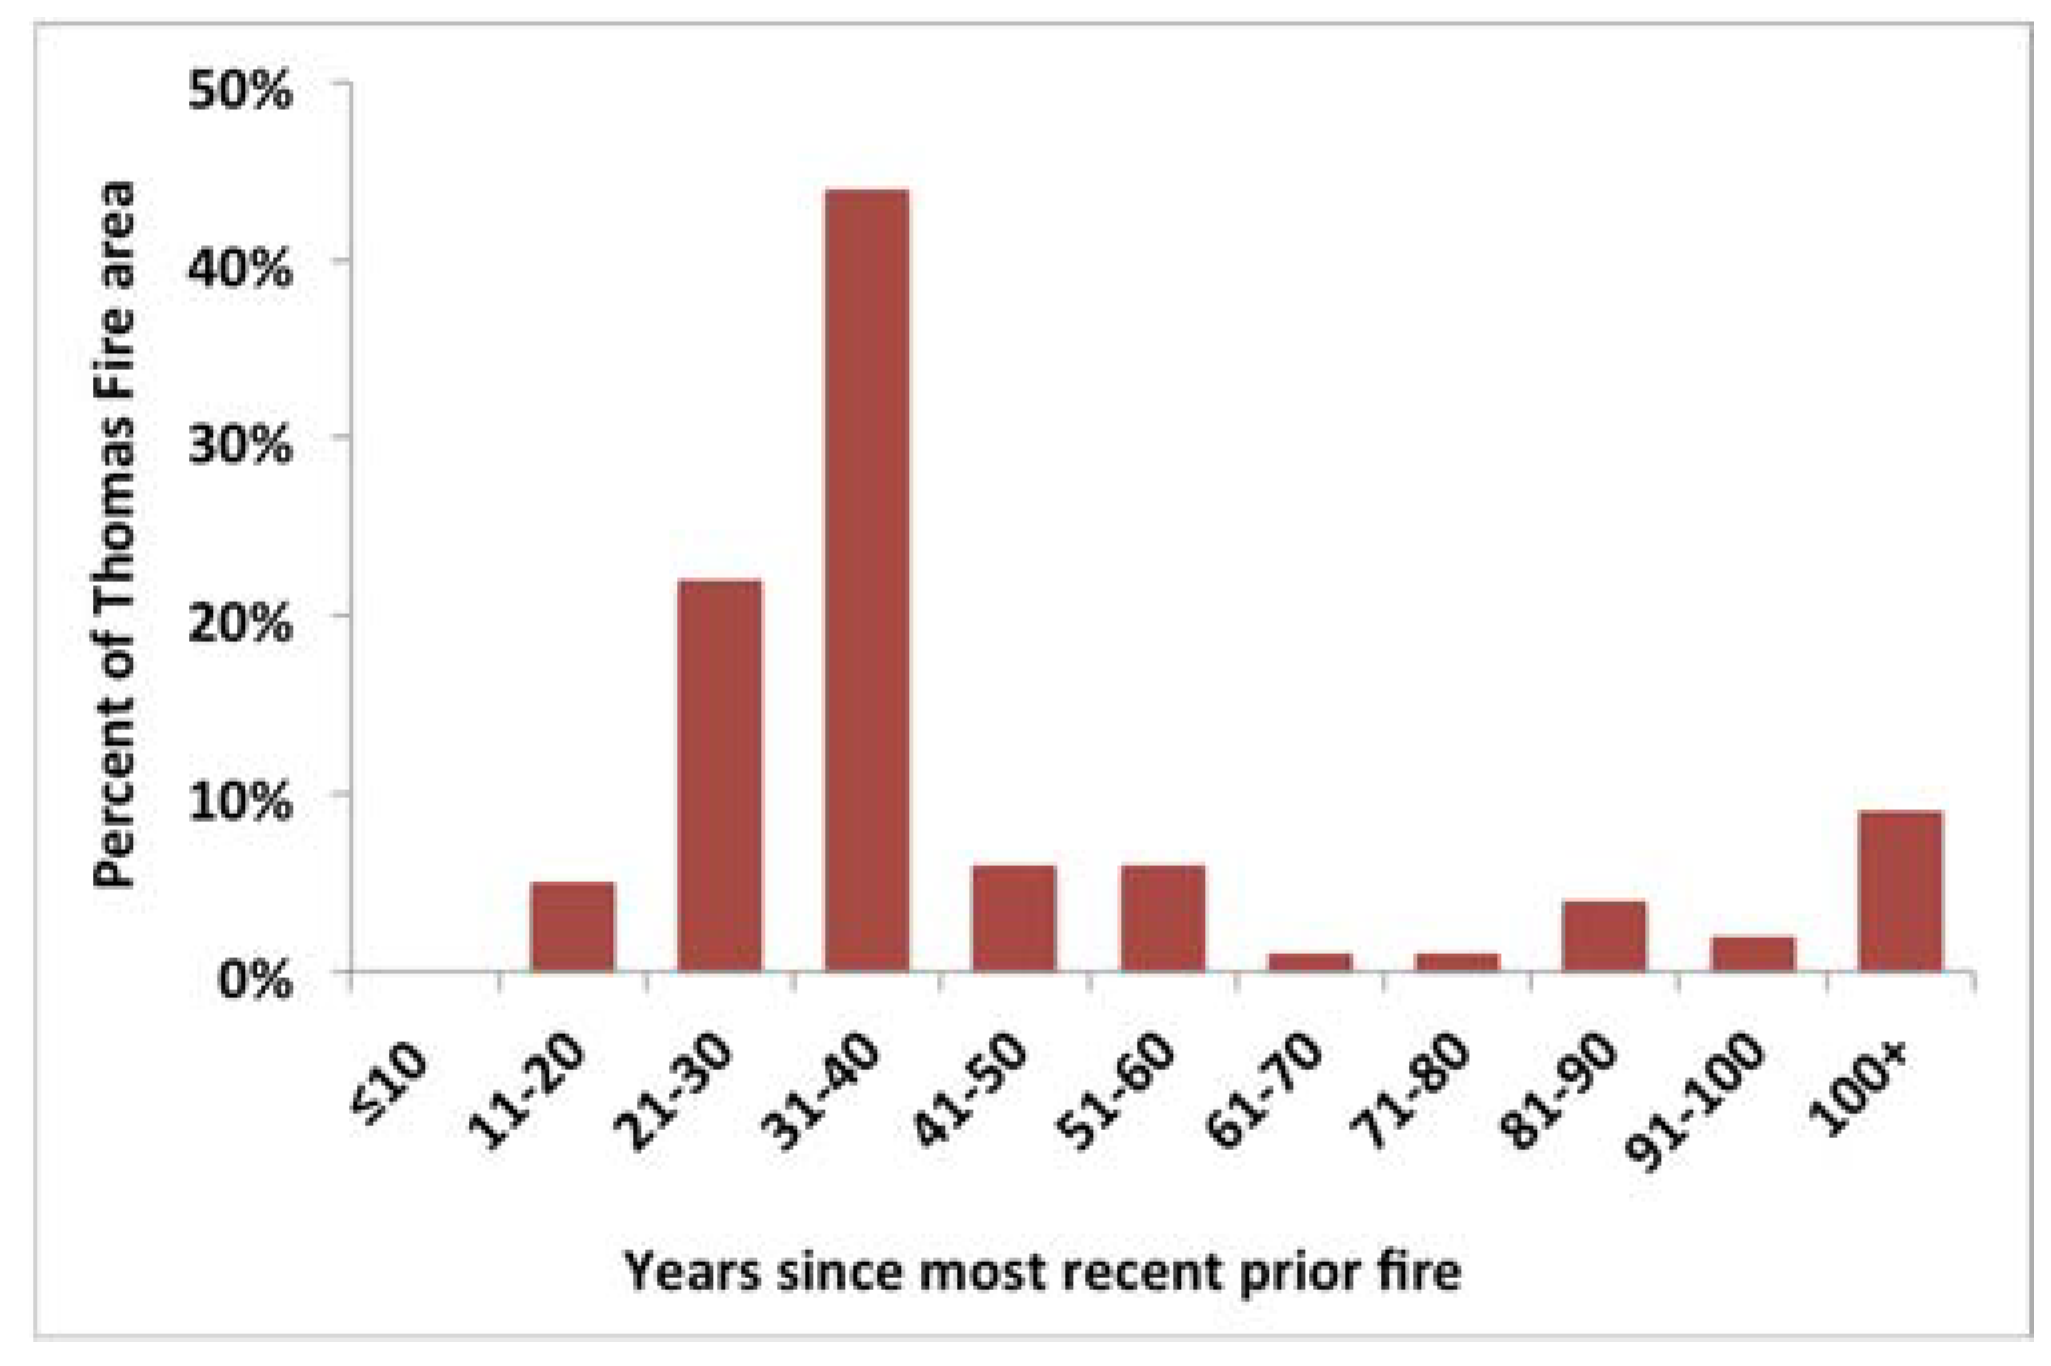
As noted above, the Thomas Fire displayed highly anomalous characteristics in the context of this study, and for several reasons. First, beyond being the largest fire in California history based on the FRAP record, it burned outside of the “normal” spatial extent where Santa Ana fires are primarily concentrated, with 61% of the re-burn area covering terrain that had previously not experienced a Santa Ana fire. This includes 5818 ha along the Santa Ynez front range where Sundowners had previously burned. This overlap with prior Sundowner fires, as noted previously, is of considerable concern for fire managers whose job it is to predict dangerous fire conditions and protect lives and property when fires ignite under those conditions.
Second, the burning pattern of the Thomas Fire provides some insight into the role that previous fires play in determining subsequent fire extent in human-dominated landscapes. While it is well-established that fire becomes self-regulating in wilderness areas of the western US where fires have not been fully suppressed for several decades [
33,
34,
35], an analog study has not yet been undertaken outside of wilderness areas, particularly where high human population density demands that fires be fully suppressed, such as in southern California. Previous research has demonstrated that large fires in this region are not a product of suppression [
36,
37], but they have not asked whether fires become self-limiting. The Thomas Fire burned under conditions that facilitated sustained rapid-fire growth, but when it reached the perimeters of recent (<15 years) fires, fire behavior was dramatically reduced due to considerably diminished fuel availability, limiting additional spread (
Figure S2). This is in contrast to other portions of the fire area, and in contrast to previous findings of recent fire scars not impacting subsequent fire [
38]. The Thomas Fire burned rapidly through vegetation of any age >15 years, with the greatest proportion of area burned in the 31–40 years old age class. The obvious exception to this is the large unburned island where the town of Ojai sits, which resulted from intense fire suppression efforts and the existence of a fuel reduction project around the town known as the Ojai Community Defense Zone. This suggests that even in a region with heavy suppression of wildfires, increased large fire frequency including fires burning with exceptionally dry fuels, as projected to occur more often with climate change, may begin to produce self-limiting fire behavior. It also demonstrates that fuels reduction projects can be effective in protecting communities during katabatic wind fires. However, there are numerous uncertainties with regard to how changing climatic conditions will alter the regeneration rates of vegetation and influence the minimum fuel load required for fire to carry. For example, the Thomas Fire occurred under such extreme dry conditions that it burned through the oil fields northwest of Ventura, which had not burned in the 100+ year CAL FIRE record in part due to the highly discontinuous fuel loads and fragmented landscape (i.e., with a dense road network and large patches of bare earth around drilling pads).
4.4. Implications
Delineating between dominant fire regime drivers spatially across the landscape is critical for fire and land management needs, both for pre-fire vegetation management and risk mitigation efforts, and for during-fire suppression efforts. In the pre-fire planning phase, the types of actions that might be prioritized hinge on the potential success of those actions. For example, prior research has found that fuel treatments in these ecosystems are most effective when maintained and when firefighters are present to reinforce the fuel break and take additional suppression actions; more extreme weather conditions (e.g., Sundowner and Santa Ana winds) also impact fuel break success [
39,
40]. As such, fuel breaks must be accessible and well-maintained in the locations where katabatic winds dominate fire behavior (
Figure 2). Similarly, because rapid evacuation tends to be the priority in the areas where katabatic winds drive fire activity, community fire planning and disaster prevention may be more effective if focused on education for preparing to evacuate rapidly, and for strategic vegetation management, specifically to protect communities and along evacuation routes to facilitate ingress and egress. For example, community planning and fuel reduction projects in Santa Barbara County minimized home loss and maximized life safety when the Thomas Fire moved west along the Santa Ynez Range [
41].
Fire prevention and suppression activities may also be more effective if spatially and temporally tailored to these two distinct fire regimes. For example, electrical ignitions from power lines can be prevented by burying power lines (which is somewhat cost-prohibitive) or turning off part of the grid (which can be dangerous and has additional consequences) during a Santa Ana wind event. Limiting such measures to only the areas most impacted by Santa Ana fires would be both economically and politically more feasible. Similarly, fire suppression resources could be strategically staged, and staffing levels strategically adjusted across the region during projected extreme fire danger periods based on whether it is mid-summer (when non-coastal locations primarily dominated by non-katabatic wind fires are more vulnerable) or autumn (when coastal locations dominated by Santa Ana fires are more vulnerable). Such geographic and temporal strategies may help alleviate the strain of limited resources, particularly during statewide large fire years.
The 2017 Thomas Fire has particular implications for fire management. Local agencies are generally familiar with well-defined fire seasons and expectations of fire behavior based on historic observations. The Thomas Fire represents a departure from the historically well-defined fire regime of Santa Barbara County, where the dominant fire weather included spring and summer Sundowner events along the wildland-urban interface, and mid-summer large fires in the more remote backcountry areas. The Thomas Fire was a late-season, long-duration Santa Ana event that ignited in an area of the Simi Valley where Santa Ana fires dominated historically, but carried north and west into Santa Barbara County. This type of extreme event should be an indicator for fire management that novel fire events and contingencies must be adequately planned for to avoid disasters, particularly in fire-prone Mediterranean ecosystems [
1].
4.5. Limitations
Fire history studies are always limited by historical accuracy of spatial fire data and assumptions about the heterogeneity of fire impacts within those perimeters. Accuracy of historical fire data decreases with age, due to both record-keeping and in that older methods of mapping wildfires often demonstrate considerable inaccuracies when compared to modern methods utilizing geospatial technologies [
31,
42,
43]. Our spatial overlap of fire perimeter data assumes that all area within that perimeter burned; however, it is also widely acknowledged that, on average, up to 25% of the area within perimeters does not burn and remains as unburned islands [
44,
45,
46].
Additionally, reconstructing past fire weather with high spatial accuracy is challenging, and our classification of fires as driven by katabatic winds or not does not recognize fires that may have ignited under non-katabatic conditions and then experienced a Santa Ana or Sundowner event days or weeks after the initial ignition. For example, as described above, the Thomas Fire experienced Santa Ana wind conditions for 12 consecutive days. On 16 December, the Santa Ana pressure gradient abated, and local Sundowner conditions developed on the west edge of the fire in Santa Barbara County, facilitating considerable growth on the 16th. Our delineation also fails to account for a large fire developing its own weather, including localized winds and downdrafts that can drive large fire runs.


