Article

Exposure Complexity and Community Capacity to Manage Wildfire Risk: A Coupled Biophysical and Social Analysis of 60 Communities in the Western United States

1
Department of Environmental Science and Management, Portland State University, Portland, OR 97201, USA
2
United States Department of Agriculture, Forest Service, Rocky Mountain Research Station, Missoula Fire Sciences Laboratory, Missoula, MT 59808, USA
*
Author to whom correspondence should be addressed.
Submission received: 11 November 2019 / Revised: 29 November 2019 / Accepted: 2 December 2019 / Published: 6 December 2019

Abstract

:
Coordinated approaches to wildfire risk mitigation strategies that cross-ownership and management boundaries are found in many policies and programs worldwide. The “all lands” approach of the United States (US) National Cohesive Strategy, for example, attempts to address the mismatches between biophysical risk and the social potential to address risks by improving multijurisdictional coordination and collaboration. Local capacity to coordinate wildfire risk mitigation, therefore, may be an important influence on whether risk reduction planning makes success stories out of at-risk communities, or turns what would appear a manageable problem into a disaster waiting to happen. We analyzed the relationship between predicted housing exposure to wildfire and local self-assessment of community competence to mitigate wildfire risks in 60 communities in the western US. Results generally demonstrate that (1) the number of sources of wildfire risk influences local housing exposure to wildfire, and (2) perceived community-competence is associated with predicted exposure to wildfire. We suggest that investments in ongoing updates to community risk planning and efforts to build multi-jurisdictional risk management networks may help to leverage existing capacity, especially in moderate capacity communities. The analysis improves the social-ecological understanding of wildfire risks and highlights potential causal linkages between community capacity and wildfire exposure.

1. Introduction

In the western United States (US) and elsewhere across the globe, wildfire strains government capacities to protect people and resources from harm [1]. Although federal policy in the US and local planning for wildfire risks have improved during the past two decades [2], over 34,000 homes were destroyed by wildfire between 2003 and 2012 [3], and, more recently, whole communities, or substantial portions thereof, have been destroyed. Continued and growing wildfire losses in the wildland-urban interface (WUI) suggest that existing policies and programs to help govern the management of risk are insufficient [1,4]. The field of disaster risk reduction focuses on identifying strategies to reduce negative effects of localized short term events like wildfires using a mostly bottom-up multiscale coordination approach to mitigate risks from hazardous events [5]. For example, in response to the growing challenges of wildfire risk management, US policy efforts such as the Healthy Forest Restoration Act (HFRA) the National Cohesive Wildland Fire Management Strategy (hereafter, the Cohesive Strategy), Shared Stewardship, and other recent authorities have encouraged collaboration across land ownership and governance boundaries in order to more effectively mitigate the risks of wildfire and develop fire-adapted communities.
Coordinated approaches to planning, prioritizing, and implementing wildfire risk mitigation strategies that cross land ownership and management boundaries are embodied in Community Wildfire Protection Planning (CWPP) [6,7] and within the “all lands” or cross-boundary approaches of the Cohesive Strategy and Shared Stewardship (For more information about the Cohesive Strategy and Shared Stewardship see https://www.forestsandrangelands.gov/strategy/thestrategy.shtml and https://www.fs.fed.us/sites/default/files/toward-shared-stewardship.pdf, respectively). However, the effectiveness of CWPP or other collaborative processes at reducing community wildfire risk may be limited by ambiguity in relationships between important actors [8]. Brummel et al. [9] suggest that the policy mandated collaboration created by the HFRA may best accomplish coordination across wildfire management institutions with similar goals rather than among a more diverse set of stakeholders. Furthermore, Ivery [10] noted that procedures for implementing policies that rely on collaboration in the governance of complex issues often fail to take account of the nature of existing relationships between potential collaborators, which may impact their capacity and commitment to working together and limit the competence of their risk management planning. These findings are discussed in the adaptive governance and disaster risk reduction literature [11,12,13,14], which points to the challenge of finding a fit between the scale of ecosystem processes and governance regimes for managing those processes.
Mismatches between governance regimes and ecosystem processes are a contributing factor in the pathology of wildfire risk management in the US and elsewhere [15]. According to Cumming et al. [16], scale mismatches occur when the scale of environmental variation and the scale of the social organization responsible for management are misaligned, challenging managers to effectively cope with the different spatial, temporal, or functional grain of the environmental system they intend to manage. Abrams et al. [12] make the case that scale mismatches are particularly relevant in US wildfire management. Spatial misalignments are commonly evident at “fence lines” where the patchwork of fuel treatments largely follows boundaries of land ownership or management [17]. Temporal misalignment occurs between the short-term benefits of successful federal fire suppression and the long-term accumulation of forest fuels, which further entrenches reliance on wildfire suppression [18]. Functional mismatch occurs between local governance of land use in the US and federal responsibility for wildfire suppression activities in many jurisdictions, which effectively subsidize residential development in high fire-risk areas [19].
Scale mismatches also happen at finer temporal and spatial scales as communities plan for and implement projects to address wildfire risk. In a study of an affluent suburban community west of Reno, Nevada, Abrams et al. [12] note that although the local homeowner association exhibited strong influence over the risk mitigation actions of homeowners, there was almost no interaction between the homeowner association and the neighboring Forest Service unit managers, which manage the land where much of the wildfire risk to the community originated. In fact, interviewees in the community commonly misidentified the neighboring landowner as the Bureau of Land Management [12]. In another example, Williams et al. [2] describe the case of a California community where cross-scale planning linkages were actively discouraged in order to maintain actionable control over plan outcomes. These examples of insufficient coordination between local communities and surrounding landowners suggest a failure of governance institutions to accurately perceive or act on the risk that wildfire may be transmitted from neighboring land ownerships and expose a community to an otherwise manageable risk [20].
Two factors, exposure complexity and community capacity, may influence the extent to which a community addresses its wildfire risk. First, the pattern of ownership and management in the landscape surrounding a community may directly influence the ability of those involved in community wildfire risk planning to accurately perceive the risk of wildfire transmission from neighboring landowners and address those sources of exposure [20]. As a result, communities surrounded by a greater complexity of land tenures may be susceptible to greater scale mismatches due to the challenge of coordinating with neighboring owners and managers representing a diversity of interests. Second, a community’s capacity to develop and maintain relationships with surrounding landowners and managers may depend on the competence of local leadership with the appropriate skills and abilities to address the problem and overcome any misalignments between stakeholders’ needs to serve their own interests versus those of the collective [21,22,23]. Improving the governance of complex social-ecological problems like wildfire risk may be accomplished through efforts to develop the competence to overcome mismatches [20,24]. For example, Chaffin et al. [11] suggest that individual leadership, multi-level coordination, and the activation of social networks may help to overcome scale mismatches in the governance of complex environmental problems. As collective action is the result of the networks, norms, and trust among individuals working together [25], the competence of a community to reduce exposure to wildfire risk may be dependent on the skills and experience of its individual members.
Two hypotheses emerge related to scale mismatches in community wildfire risk governance, which we refer to the complexity and capacity hypotheses. First, greater complexity in the pattern of ownership and management in the landscape surrounding a community increases the exposure of a community to wildfire risk due to the increased challenge of coordination. Second, communities with local officials that exhibit greater competence in their ability to mitigate wildfire risk will have lower predicted exposure to wildfire risk. Of course, confounding factors like greater amounts of federal land, the presence of unmanageable protected areas, and higher proportions of WUI may also influence community wildfire risk, as might other social factors like local social cohesion, place-based knowledge, or shared responsibility and understanding of risks within a community. Nonetheless, the two hypotheses suggest that mismatches exposing communities to wildfire risk from neighboring lands may be a function of a community’s capacity (or lack thereof) to initiate collective action with surrounding landowners.

1.1. Background and Rationale

Although nearly 99% of wildfires on public land are suppressed before they exceed 300 acres, the 1.1% of larger wildfires account for 97.5% of acres burnt, and large proportions of suppression costs and economic losses [26]. Private property in the WUI is a key factor influencing suppression costs [19,27], driving firefighting efforts in nearly 90% of wildfires [28]. These large wildfires can burn 10s to 100s of thousands of hectares and spread 20-50 km or more from their ignition points [20], causing the majority of area burnt from ignitions on some national forests in the western US to occur outside of those National Forests [29]. In this context, the transmission of fire risk across boundaries of land ownership and management (hereafter, land tenure) takes on an important role only recently recognized in the wildfire risk literature.
Ager and colleagues [4,20,29,30] developed an analytic framework for assessing the transmission of large fire risk by mapping simulated wildfire transmission from their ignition points to nearby values at risk, including communities and their surrounding WUI areas [20]. Drawing on epidemiological characterizations of transmission as the spread of some phenomenon from one node to another [31], we define wildfire transmission as the likelihood of exchange of wildfire between one parcel of land with homogeneous land tenure characteristics to another parcel of land with different tenure characteristics (e.g., from US Forest Service managed wilderness land to private land). The movement of wildfire across tenures creates risk transmission as objects of value (e.g., homes) are exposed to fire and incur losses. This analytic framework can be used to spatially identify planning areas (i.e. the “fireshed”) relevant to particular objects of value.
The fireshed encompasses all lands that are sources of potential exposure to wildfire. Mapping the fireshed can help planners identify sources of wildfire risk, and whether mismatches exist between the scale of community plans (e.g., CWPPs) and the fireshed that transmits risk to the community [32]. Evidence suggests that local wildfire planning often corresponds with existing jurisdictional boundaries [2,9,33] and that planning boundaries influence who participates in planning processes [34]. Yet comparisons of CWPP boundaries with local fireshed extent illustrate the mismatches in the scale of planning relative to the ecological scale of wildfire [20], exemplifying the challenge of anticipating large wildfires that can originate far away and transmit risk through multiple land tenures. We hypothesize that firesheds with more land tenures increase the complexity of planning for wildfire risk transmission due to greater number of stakeholders needed to assess the problem, agree upon planning solutions, and take action. Mismatches are therefore more likely in firesheds where the richness of land tenures is greater, but the effect of those mismatches on community exposure to wildfire risk remains unknown.
Not all communities are equally capable of addressing potential scale mismatches. Communities are complex place-based social systems, where social institutions facilitate interaction among community members over matters of common interest [35]. Adaptive capacity to wildfire is, therefore, a product of the understanding of the geography of wildfire risk and the functioning of a system of community institutions that facilitate interactions between individuals intended to reduce the likelihood of exposure to wildfire. To be adaptive, local community institutions must iteratively learn from the changing landscape around them and adapt management strategies accordingly. Effective adaptation “requires the ability to observe and interpret essential processes and variables in ecosystem dynamics [and] develop the social capacity to respond to environmental feedback and change” [36] (p. 445). Misalignments in the scale between ecosystem dynamics and the local social institutions designed to observe and interpret those dynamics hamper the ability of community institutions to effectively adapt to environmental change [11].
Recent literature has identified several important dimensions of community social context that are important in developing the capacity to adapt and realign institutional and biophysical mismatches. Capacity to address environmental change generally [36] and effectively organize to reduce wildfire risk specifically [37] requires access to technical knowledge and resources and the ability to adapt knowledge and resources to local conditions, which we refer to as competence. Local context may offer opportunities to build competence. For example, competence may be facilitated by individuals with specific skill sets like emergency management, wildland fire fighting, grant writing, fuels mitigation program implementation, and local ecological assessment. In addition, competent local leaders are needed to bring an array of expertise among individuals together into collective action. Paveglio et al. [37,38,39] identify a number of other potentially important community-level factors for understanding wildfire risk mitigation, including the character of interactions and relationships among community members, the level of place-based experience and knowledge community members have, and a shared sense of responsibility for risk mitigation and understanding of the limitations of wildfire suppression. However, we suggest that competence may be most important for cross-boundary planning and coordination, whereas social cohesion, place-based knowledge, and shared responsibility and understanding may better explain local, rather than cross-boundary, efforts for mitigation.
Despite local competence, constraints from a higher-order social organization may be another important source of scale mismatches that mediates community wildfire exposure [12,16,40]. Land tenures such as federally designated Wilderness, where mechanical fuels management is proscribed by law, or management plans on federal lands may limit the ability for communities to set goals that address their sources of exposure, or in some cases disempower or disenfranchise local participation in wildfire risk reduction activities [41]. Further, the amount of WUI in a community’s nearby landscape may further complicate the capacity of a community to address mismatches in planning for wildfire risk.
Previous research has explored wildfire risk transmission at local to regional geographies [4,29], and community context and capacity to adapt to growing wildfire risks through in-depth case analyses as well as across more generalizable contexts [2,7,12,37]. However, few studies have coupled concepts of biophysical transmission of wildfire risk and community capacity to address wildfire risk across a broad range of cases using empirical or simulated data. Coupling the wildfire risk transmission and local capacity to mitigate cross-boundary fire risk can help to identify strategies for managing community exposure. Outcomes from such an analysis may help to identify types of communities that public policy should target for increased hazardous fuels treatments and where policy should focus on improving coordinated planning capacity or increasing local leadership competence.

1.2. Research Questions

In this paper, we present an analysis of 60 communities in the western US using the wildfire transmission analytic framework coupled with survey data from community leaders about their capacity to mitigate risk. To address the complexity and capacity hypotheses, we ask the following questions: (1) what are the sources of community wildfire exposure, (2) how is community wildfire exposure related to community competence to address wildfire risk, and (3) how do higher-order institutional constraints affect community capacity to address wildfire risk. To answer these questions, we couple metrics from an empirical community wildfire risk key informant survey, community landscape data, and wildfire simulation modeling in those community landscapes. The analysis is designed to illustrate how the spatial geography of wildfire risk transmission varies across communities while also exploring relationships between social and biophysical aspects of wildfire risk and management.

2. Methods

2.1. Study Area

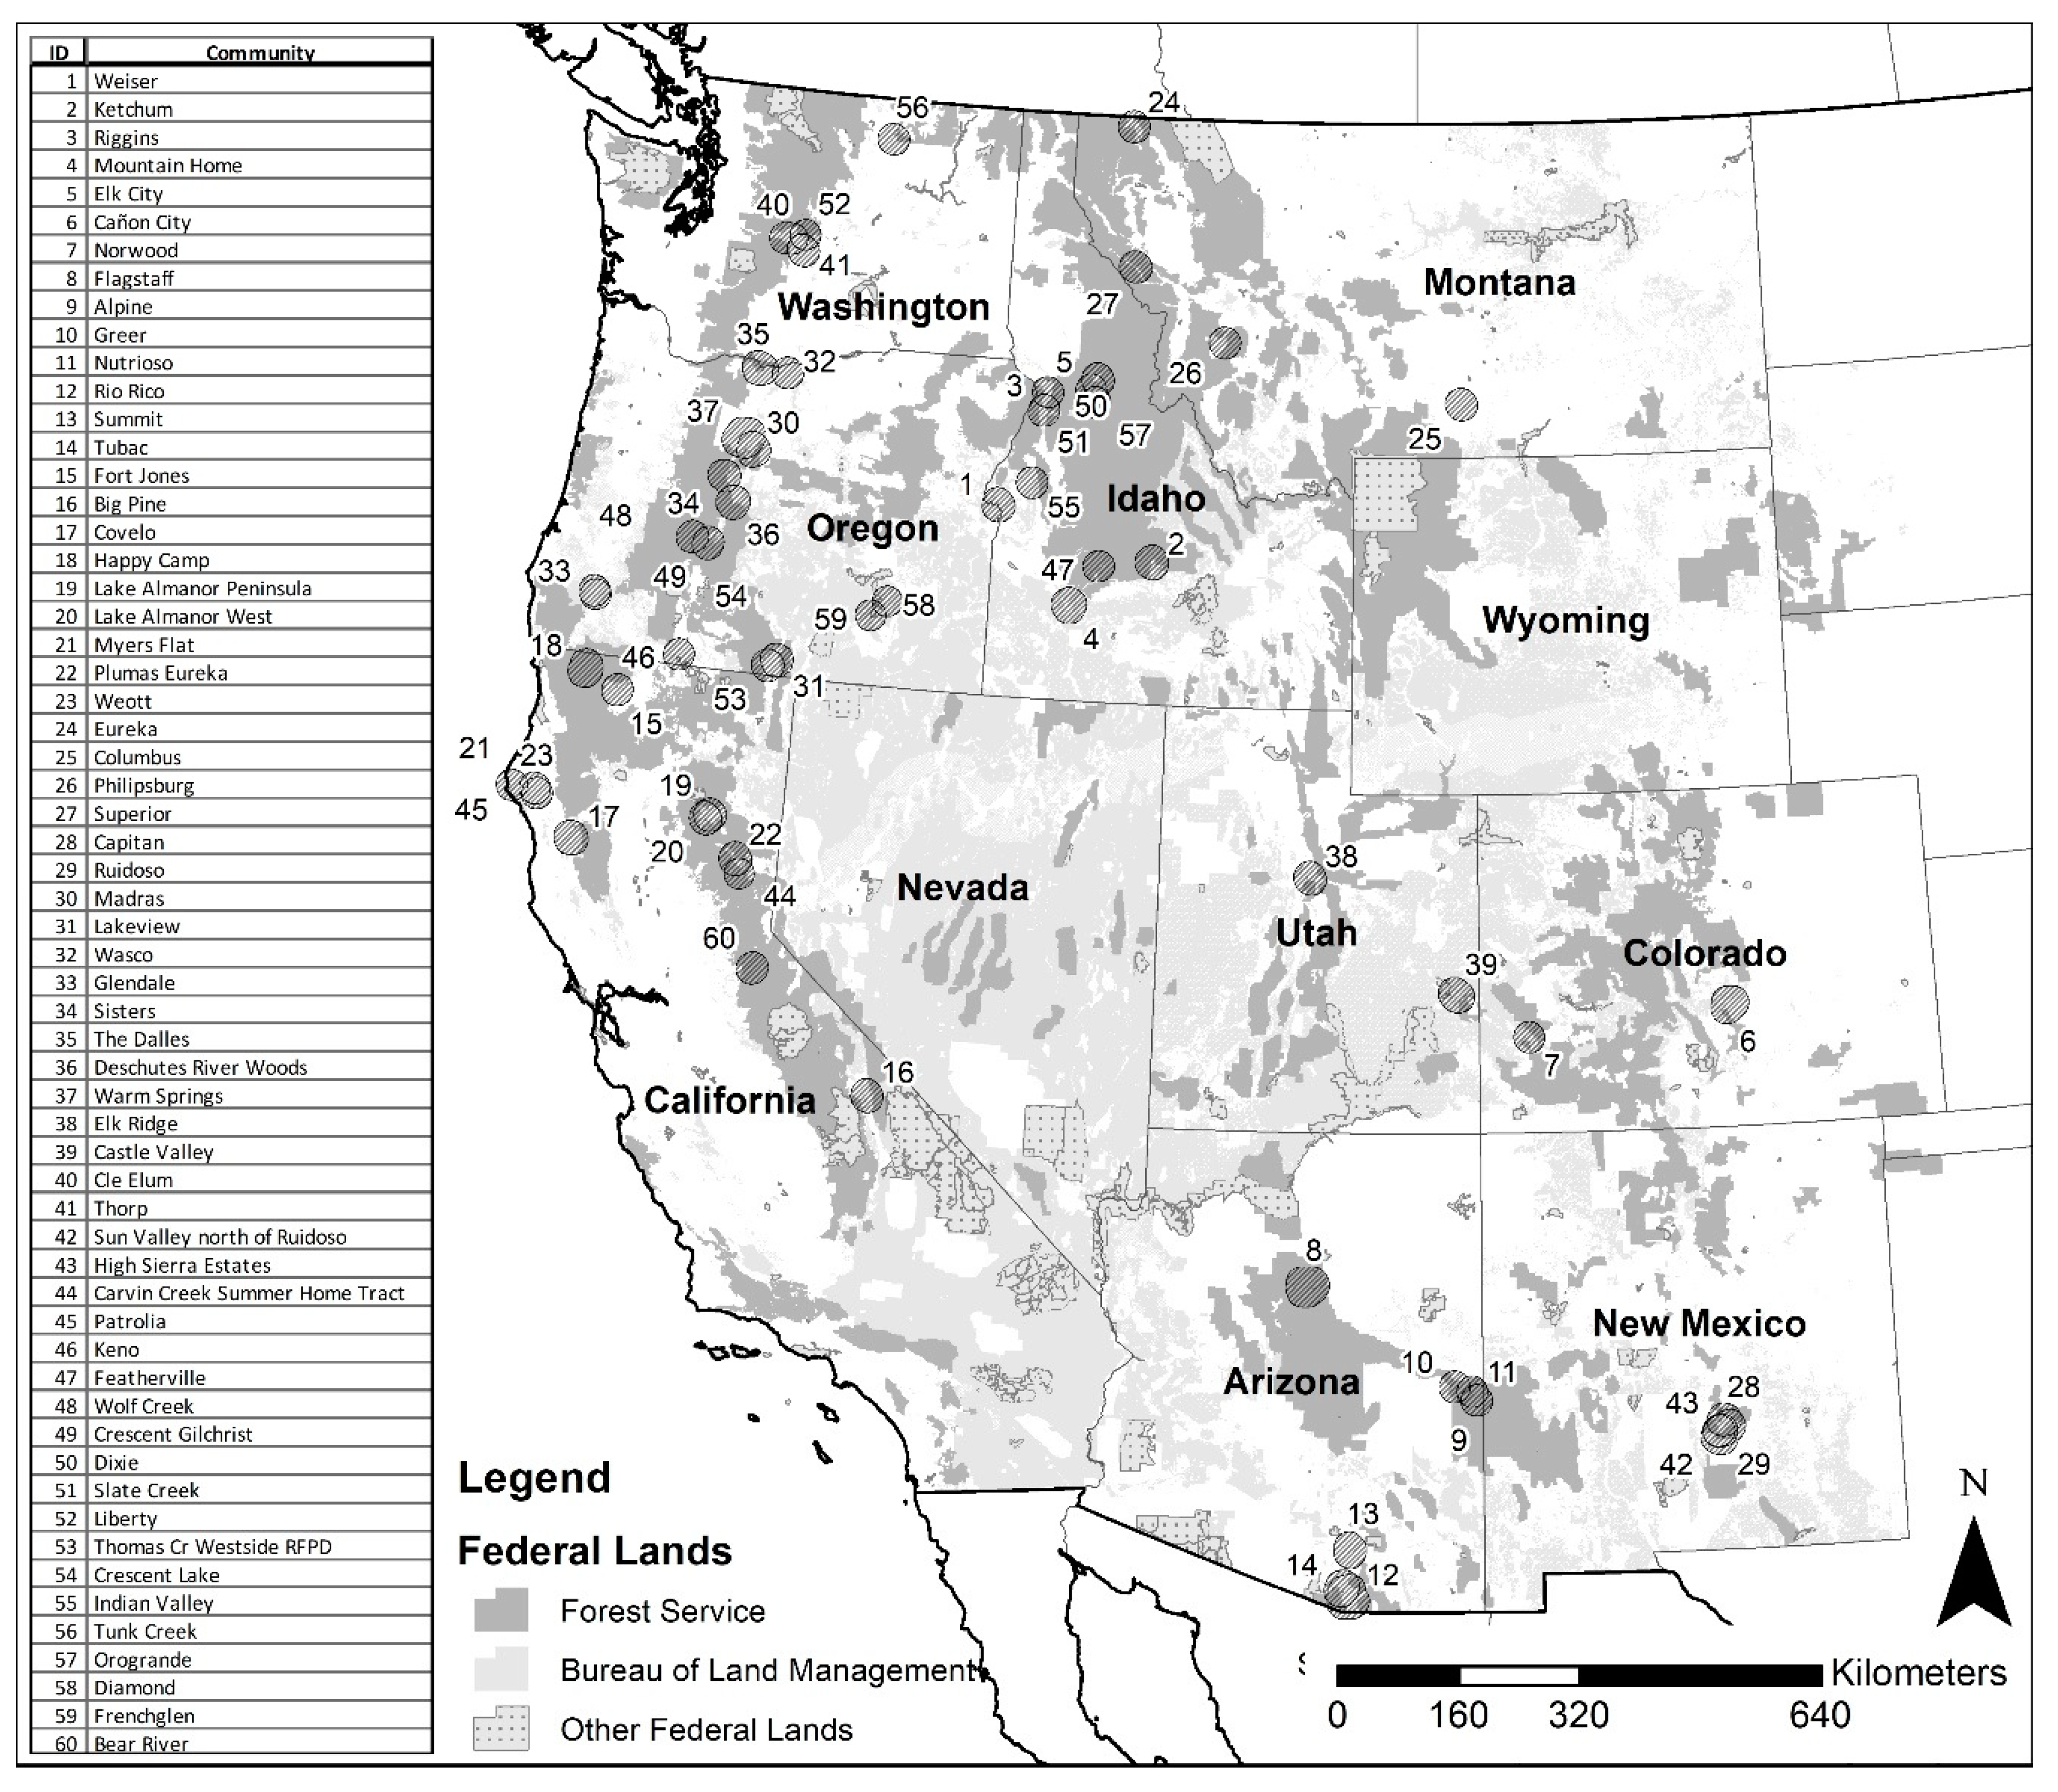
The study draws from wildfire simulation modeling and observations from community key-informants located in 9 of the 11 states of the western contiguous US and their surrounding landscapes (Figure 1), including Arizona, California, Colorado, Idaho, Montana, New Mexico, Oregon, Washington, and Utah. A two-step sampling procedure began by identifying counties in the western US in which recent large wildland fires occurred [12]. A second step used a snowball sampling process with key informants in each county to identify communities impacted by recent wildfires [42]. Chain referral started with the county fire marshal, local fire chief or emergency manager, or a county planner. These individuals were then asked to identify key informants whose professional positions gave them substantial familiarity with the communities most impacted by a recent wildfire. Wildfire exposure was then estimated for the impacted communities, and a key informant survey was conducted to characterize key informant perspectives on the capacity of their community to manage wildfire risk.

2.2. Community Mapping

We mapped the impacted communities with three goals: (1) delineate the central core community and the surrounding WUI for each community, (2) estimate the number of housing units in each community core and surrounding WUI, and (3) map land tenure and other variables in the landscape surrounding each community core, including land ownership, management restrictions that could limit fuels treatments, and characteristics descriptive of the local fire environment (e.g., dominant vegetation and fuel models, fuels treatments, etc.). In order to define communities that would be jurisdictionally relevant to fire managers, we mapped communities geographically, rather than based on interactional definitions [35,38].
First, we mapped the spatial extent of the central community core using incorporated community boundaries and census-designated place polygons. In a few cases, we digitized maps depicting the developed community core. Community cores were then given a 20 km radius buffer in which WUI areas were identified. Spatial data [43] was used to tag all WUI within the 20 km buffer as WUI associated with each community core. Housing unit data derived from the US Census [43], was then used as an estimate for the number of housing units in each community core and surrounding WUI polygon.
Second, all lands in the western US were classified with two attributes to define the land tenure: (1) a land ownership category and (2) a land management designation. Land ownership was disaggregated into several categories, including various federal administrators, state and local owners, private ownership, and others. Federally administered lands were disaggregated by major federal land managers: US Forest Service, Bureau of Land Management, Bureau of Indian Affairs, National Parks Service, and Department of Defense. Most other federal land managers were aggregated and classified as Other Federal. State and local government-managed lands were aggregated together. Land management was classified as either managed or protected, where protected indicated land that was designated to restrict a land manager’s ability to conduct mechanical fuel treatments. Land management designations were assigned using the US Protected Areas Database (PAD) [44] and PAD categories I and II were classified as protected lands, whereas, all other PAD categories were assumed to allow mechanical fuels treatments and classified as managed. Protected lands (PAD categories I and II) were comprised of legislative and administrative designations like Wilderness, National Parks, or private land held by a conservation trust. Polygons depicting each combination of land ownership and management status formed the basis of the land tenure map.
Final community maps were produced and included polygons identified by land tenure type, whether the polygon was in a community core, the WUI, or the surrounding landscape, and the number of housing units within each polygon.

2.3. Estimated Wildfire Exposure and Complexity

Community exposure to wildfire was estimated by selecting simulated wildfire perimeters, as described in Ager et al. [4,45], that intersected our mapped community landscapes from wildfire perimeters simulated for the western US as implemented in the program FSIM [32,46]. Simulations occurred over several thousand wildfire seasons and have been described extensively elsewhere, we refer readers to a number of recent publications for more detail [4,20,45].
For each community, we estimated the average annual number of housing units exposed to wildfire by intersecting simulated wildfire perimeters with the SILVIS housing unit data for both the community core and WUI polygons in the 20 km buffers on our community maps. If the intersection of a wildfire perimeter and a land tenure polygon was partial, we proportionally adjusted the number of housing units exposed to the proportion of the parcel area exposed to wildfire. Although this calculation introduces the assumption that housing units are uniformly distributed across land parcels, we find it to be a reasonable compromise given the scale of our study and suggest that the expected average annual number of housing units exposed is a representation of the magnitude of threat faced by individual communities rather than a precise prediction of the number of housing units at risk of being exposed to wildfire. To measure annual estimated community exposure to wildfire, we summed the total number of WUI and community core housing units exposed to wildfire for each community and divided by the number of simulated wildfire seasons. We used the average annual housing unit exposure for each community as our dependent variable for subsequent analysis.
We then summarized annual average housing unit exposure by ignition source for each community landscape to describe the sources of wildfire that expose communities and their surrounding WUI to the wildfire threat. We illustrate community exposure using network diagrams that show the transmission of wildfire between different land tenure types and the WUI and community core polygons (Figure 2). Network graphs were used to estimate the complexity of each community’s wildfire exposure network, where complexity was defined as the number of land tenure sources that contributed to community and WUI wildfire exposure. We used the complexity variable as an independent variable for subsequent analyses.
Other mapped variables, such as the amount of land in the protected management category, federal ownership, and the WUI within the 20 km buffer surrounding the community core, were used to create additional independent variables that represent higher-order social institutions that may influence local capacity to mitigate sources of wildfire risk.

2.4. Community Wildfire Key Informant Survey

Finally, to develop a set of independent variables focused on the capacity of local communities to address wildfire risk, we contacted local key informants for each community. Key informants were contacted up to six times via telephone and email before being removed from the contact list. Successful contacts were asked to participate in a structured telephone interview about wildfire risk management. Only those key informants who self-identified as “knowledgeable” or “very knowledgeable” about wildfire planning, wildfire mitigation, and the social context of the community were asked to participate in the full interview. Very few referrals resulted in respondents who indicated they were not knowledgeable enough to participate. While multiple key informants were identified for some communities, in others, typically small communities, only one key informant was identified who self-identified as knowledgeable or very knowledgeable about planning, mitigation, and the social context of the community with respect to wildfire. This paper analyzes data from 105 key informants.
Interviews typically lasted about 60 min and interview responses were recorded in an online database during the interviews. Interview questions were designed to measure community characteristics that may influence community wildfire adaptation [38,39], and included 14 items that draw on disaster risk reduction concepts designed to measure respondent perception of community social context, including competence to address wildfire risk, place-based knowledge and experience with fire mitigation, community social cohesion, and shared responsibility and understanding of wildfire threats across different segments of the community. All items were measured on a 5-point Likert-scale that ranged from strongly agree (+2) to strongly disagree (−2), which we replicated based on Paveglio et al. [37] who developed, tested, and structured the items as 4 index variables. Where multiple key-informants were recruited from the same community, we averaged responses by the community. While averaging at the community level eliminates individual-level variation in those communities with more than one key-informant, we found that consistency of responses was substantially greater within communities than across communities or when aggregating at higher levels (e.g., county or state) (We aggregated respondents at different levels of geography (community, county, state) and tested for consistency across respondents at different jurisdictional scales using Chronbach’s alpha. We found the greatest consistency in responses within each index when key informants from same community were pooled. At the community level, alpha values ranged from 0.80 to 0.92 for the four local capacity indices. At the county level, alpha values for the four indices were lower and ranged from less than 0.70 for community social cohesion to between 0.72 and 0.78 for the remaining three local capacity variables. At the state level, alpha values for each variable demonstrated much less consistency, indicating a wide diversity of responses from key informants across communities).

2.5. Coupled Social–Ecological Analysis

After deriving local exposure to wildfire and social and ecological independent variables, we explored the relationship among exposure, the complexity of the wildfire exposure network, community capacity to address wildfire risk indices derived from key informant surveys, and constraints to community capacity as represented by different features in the landscape surrounding communities. In recognition that the measurement of total exposure was not without error, we binned communities into high and low-exposure groups using the median proportion of housing exposed to wildfire within the community as the breakpoint between high and low-exposure communities.
We ran a logistic regression predicting high exposure as a function of wildfire exposure complexity, the four local capacity indices, and three landscape constraints. Then, based on the hypothesis that community capacity may mediate the relationship between community exposure to wildfire and the complexity of the exposure network, we used regression-based recursive partitioning [47]. Recursive partitioning is an algorithm that partitions a given regression model based on covariates that, if used to partition the regression model into two segments, reduce instability in the model and improves the regression model fit for each segment. Each segment can then be tested for subsequent partitions and repeated until no further improvements can be made. The algorithm allowed us to test whether the relationships in the data were stationary across all communities or whether these relationships vary in different groups of communities. Finally, we conducted a brief post-hoc analysis of the groups of communities created by recursive partitioning to see whether the groups were associated with explanatory variables, including ignition, WUI, dominant fire regimes, and past fuels treatment characteristics in the community landscapes. All analyses were run in R.

3. Results

Land tenure, housing development, simulated wildfires, and exposure transmission to homes were mapped for all 60 communities (e.g., Figure 3A–D). For each community, simulated wildfires were used to highlight the areas of the landscape most likely to transmit wildfire to housing in the community and nearby WUI. In nearly all cases, firesheds (areas that transmit exposure to communities) extended beyond the 20 km radius buffer around the community core, highlighting the importance of differentiating large fire risk from in situ fire hazard. In some cases, fire risk was transmitted over 65 km. Community landscapes varied in context (Table 1). The majority of community landscapes were dominated by forested land cover (39 of 60 community landscapes), while relatively few community landscapes were dominated by shrub (6) or grass (3) cover. Fire regimes varied across communities, with 23 communities being dominated by a frequent low severity fire regime, and an equal number having a mix of fire regime types within the community landscape. Exposure also varied. Several community landscapes averaged between 1% and 2% of the housing stock expected to be exposed annually to wildfire, while on average across all 60 communities about a third of percent of the housing stock experienced simulated exposure to wildfire annually.

3.1. Community Exposure and Transmission Sources

High and low-exposure communities were located in different states, different sized communities, and landscapes with different vegetation and fuel types (Table 1). Over half of our high-exposure communities were found in Idaho, Montana, and Washington even though those states only represented 30% of our sample of 60 communities. The proportion of housing exposed to fire was relatively greatest in high-exposure communities in California and Idaho, in small communities (with populations less than 1000 people), in communities with either forest or grass-dominated landscapes, and in communities with landscapes dominated by fuels in the fire regime 4 and fire regime 5 groups. High and low-exposure communities also differed somewhat in the relative proportions of their buffer landscapes that were managed federally (60.4% vs. 50.9%), protected (6.6% vs. 9.2%), and WUI (12.5% vs. 18.4%), respectively.
Exposure ranged by the community from a low approaching 0 housing units exposed annually to wildfire to a high of 381, with a mean of 20.9 (S.D. = 52.2, Figure 4A). All but one community had an average less than 100 predicted housing units exposed to wildfire annually. Although the community core and WUI areas covered between <0.1% to 31% of community firesheds, (Mean = 5%, S.D. = 6%), housing unit exposure ranged from <0.1% to 1.7% of total housing units annually exposed (Mean = 0.35%, S.D. = 0.38%). Federal ownership ranged from 1% to 99% of the fireshed area (Mean = 54%, S.D. = 27%) with the two largest federal landowners being the US Forest Service and the BLM. Housing unit exposure from federal sources (Figure 4B) ranged in similar proportions from 0% to 96% with a mean of 39% (S.D. = 25%), and 30% of the 60 communities in the analysis had over half of their simulated exposure originate on federal lands. Protected areas ranged from 0% to 42% of the firesheds (Mean = 8%, S.D. = 9%), and protected areas contributed between 0% and 33% (Mean = 5%, S.D. = 7%) of exposure to housing units. For all 60 communities, the largest exposure transmitting land tenure class was private lands not restricted from fuel treatments. On average, across the 60 communities, 52% of exposure originated on private lands (S.D. = 25%, with a range from 0% to 92%). However, private lands occupied less than 40% of our average community fireshed, indicating a greater than expected contribution of private lands to community and WUI housing exposure.
Wildfire exposure networks for each of the 60 communities summarize total exposure and exposure complexity (Figure 5). Exposure complexity ranged from 8 to 36 different land tenures as sources of potential exposure to homes in community landscapes (Mean = 19.6, S.D. 6.9). Total exposure to wildfire was correlated with the number of land tenure classes that exposed housing in communities and the surrounding WUI to wildfire (ρ = 0.42, p < 0.001). This relationship between exposure complexity and total exposure is expressed in Figure 5 along the diagonal between the x- and y-axes, which shows progressively higher complexity exposure associated with higher total exposure.

3.2. Key Informant Wildfire Capacity Indices

Key informants rated their communities on a variety of items related to the local capacity of their communities to address their perceived wildfire risks (Table 2). The distribution of responses to most ratings was negatively skewed indicating that, on average, key informants tended to agree rather than disagree with the statements about their communities. However, the extremity of agreement was variable. Very few key informants (only 2%) strongly agreed that residents in their communities had detailed understanding of area fire regimes, whereas key informants in nearly half (47%) of communities strongly agreed that the community had people with emergency management or wildland fire experience. Very few communities had key informants that strongly disagreed with any of the items. The item where strong disagreement was most common asked whether people in at-risk areas understood that there may not be enough fire-fighting resources to save every home. The four indices summarizing the key informant responses to individual items demonstrated adequate internal consistency in representing the constructs of place-based knowledge, shared responsibility and understanding, social cohesion, and competency to access and adapt information and resources to the local conditions. Chronbach’s alpha for each index ranged between 0.74 and 0.89.
Results also demonstrated that most key informants were either neutral or disagreed that residents in their communities had place-based knowledge and experience with wildfire (Mean = 0.25, S.D. = 0.64), or that residents in high-risk areas equally shared responsibility for wildfire mitigation projects and understood the limitations of suppression (Mean = 0.28, S.D. = 0.72). In contrast, most key informants agreed, at least moderately, that the community had competence in leadership and the skills needed to access resources and technical information about wildfire and capacity to adapt those resources and information to their local context (Mean = 1.13, S.D. = 0.59). Similarly, most key informants moderately agreed with statements about community cohesion (Mean = 1.15, S.D. = 0.67), indicating that community residents shared common values, a sense of community, and were vested in each other’s futures and well-being.
Comparing community capacity indices among high and low-exposure communities exhibited significant differences in three indices (α < 0.10). Community competency exhibited substantially different patterns in score distribution between high and low-exposure communities (t-statistic = 3.96, p-value < 0.001). Informants in high-exposure communities were more likely to be neutral or disagree with community competence statements, whereas key informants from low-exposure communities were more likely to strongly agree with those same statements (Figure 6). Key informants from high and low-exposure communities also exhibited significant differences in their ratings of place-based knowledge and experience statements (t-statistic = −2.10, p-value = 0.04) and shared responsibility and understanding statements (t-statistic = −1.88, p-value = 0.07). However, although the magnitude varied between respondents from high and low exposure communities, the pattern was similar with plurality scoring in the neutral to disagree range. The social cohesion index exhibited no significant differences between key informants from low and high-exposure communities (t-statistic = −1.13, p-value = 0.27).

3.3. Community Exposure, Complexity, and Capacity

Logistic regression results show a reasonably strong ability to predict high and low-exposure communities given exposure complexity, the community capacity indices, and landscape constraint measures (Nagelkerke R2 = 0.51, Table 3). Of the four local community capacity predictors, the only competency to access and adapt information and resources to the local conditions was significant, indicating that communities with higher competency are more likely to be part of the low-exposure group of communities. Communities with more complex community wildfire exposure networks and a greater area of surrounding federal land were both significantly associated with high exposure, while greater areas of WUI and protected areas were associated with low exposure communities.
Of the capacity indices in the logistic regression model, only the competence index was successful in improving the prediction of high exposure communities based on exposure complexity (Table 4, Panel A). Using community competence to partition the regression into groups of communities with similar competencies resulted in three competency groups (high, medium, and low) according to their competency scores (Figure 7). First, low-competence communities were partitioned, identifying them as having a significantly different set of relationships between transmission complexity and overall community exposure to wildfire (p = 0.004). Low-competence communities were likely to have high exposure independent of transmission complexity and constraints like protected areas and federal management. Eighty-six percent of low-competence communities were a part of the high-exposure group of communities. Second, medium and high-competence communities were partitioned, although the partition between medium and high-competence communities was somewhat weaker (p = 0.07) than the first partition. Of the high-competence communities, 80% were in the low-exposure group, while medium competence communities were classified as 50% low- and 50% high-exposure. Further, we found no significant relationships between overall exposure and exposure complexity in high and low-competence communities (Table 4, Panel B). Medium competence communities, however, exhibited a significant positive linear relationship between overall exposure and exposure network complexity. Similar results held for the area of federal and protected lands in the landscape surrounding communities, suggesting that communities with only moderate perceived competence to address wildfire risk are the communities where the complexity of coordinating wildfire risk mitigation and external constraints from higher-order social institutions may matter most.
Finally, we conducted a simple post-hoc analysis by cross-tabulating exposure, ignition, WUI, and fuel treatment characteristics within community landscapes in the high- and low-exposure groups with communities in the high, medium, and low competence groups (Table 5). As expected, we found that communities with low-competence key informants had a relatively higher proportion of housing units exposed to simulated wildfire. A few other meaningful differences between the groups of communities are evident when looking at ignition sources, WUI characteristics, and past fuel treatments. First, contrary to the overall pattern, within high exposure community landscapes, the majority of ignitions in low-competence communities occurred outside the 20 km community buffer, increasing the likelihood of a mismatch for those communities between the scale risk mitigation planning and the transmission of risk. Second, among high-exposure communities, interface WUI follows a gradient from the greatest proportion of interface WUI in high-competence communities to the least in low-competence communities. Third, low-exposure communities exhibited nearly twice the acreage of mechanical fuel treatments in their community landscapes than high exposure communities (4.0% vs. 2.1%).

4. Discussion

Recent National Forest management directives and authorities, including the Cohesive Strategy and Shared Stewardship, call for an “all lands”, cross-boundary approach to restoring landscape resilience and promoting fire-adapted communities. Achieving these aims requires coordinating the governance of wildfire risk, as wildfires can, and often do, move long distances, crossing a variety of ecological and social boundaries. To be effective, management of natural hazards must acknowledge the influence of both biophysical and social factors influencing risk production and mitigation [48,49]. This paper presents a coupled social-ecological analysis of wildfire risk to communities in the western US, including the relationships among transmission complexity, community exposure, and community capacity, which have not been included in prior empirical studies of community exposure [50]. Our results also suggest future research around the causal directions of the relationships among these concepts.
In the context of community wildfire risk reduction, we hypothesized that the more complex the coordination required to address community wildfire risk among different landowners, agencies, and others who contribute risk to communities, the more likely mismatches would increase potential exposure and limit a community’s ability to effectively plan, prioritize, and implement the actions needed to reduce risk. A secondary hypothesis followed. Communities with greater capacity to manage cross-boundary wildfire risk may more successfully navigate the coordination resulting in reduced exposure of life, property, and other values to the threat of wildland fire. We tested the complexity and capacity hypotheses by assessing the relationships between simulated wildfire exposure to local homes, the complexity of community wildfire exposure networks, and a number of metrics measuring local community capacity while controlling for potential higher-order institutional constraints on risk reduction like the presence of Federal Wilderness in community landscapes.
Our findings revealed how community capacity to mitigate wildfire risk may mediate the relationship between exposure to wildfire and the landscape context that transmits wildfire across various land ownerships and management units. In the following discussion we (1) highlight a coupled approach to understanding wildfire transmission and community capacity to manage shared wildfire risk, (2) reflect on two plausible causal explanations for our results and their respective meanings for future research and management, and (3) focus on the potential importance for policy to support mid-capacity communities.
Our first hypothesis focused on the complexity of land ownership and management in a community’s surrounding landscape. We represented the complexity of land ownership and management using exposure network diagrams that show the number of sources that are likely to transmit risk across their boundaries to communities and their surrounding WUI. The more complex the exposure network diagram, the greater the number of landowners and managers with which a community needs to coordinate to address potential wildfire risk, which introduces a greater potential for mismatches caused by a poor perception of cross-boundary risk, lack of relationships, poor relationships, or mission misalignments among different jurisdictions [10,20,23]. Our research confirms that communities with a greater number of cross-boundary risk transmission edges (i.e., those with more complex exposure networks) tend to have greater exposure to wildfire than communities with less risk transmission complexity in their surrounding landscape, leaving a question about cause and effect.
Although policy from local to federal levels has encouraged coordination to address these cross-boundary transmission risks, cross-boundary risks remains a sticking point in effectively managing community wildfire risk. Evidence from a number of empirical studies bears this out, highlighting how jurisdictional boundaries often frame the planning for wildfire risk reduction rather than consideration of cross-boundary risk [2,7,9,12]. Highlighting the challenge of cross-boundary collaboration, Fleming et al. [23] found that the precursors for conflict in wildfire suppression efforts were greatest when federal agencies like the US Forest Service had to coordinate with state or local actors due to mismatches in the fundamental objectives of the agency and the non-federal actors with which it must coordinate. This mismatch can carry over to management of cross-boundary wildfire risk beyond incident response and be compounded when cross-boundary collaboration is needed for fuel treatments or other risk mitigation efforts. Our findings focus on the importance of building effective community wildfire leadership and skills necessary to navigate multiple demands of complex collaborative planning.
Community exposure, however, is not entirely dependent on the complexity of the wildfire exposure network. Rather, our findings supported our second hypothesis that community capacity, a key disaster risk reduction concept, may moderate the effect of complexity on a community’s exposure to wildfire risk. Our measure of community competency was comprised of Likert-type responses to several statements presented to key informants about the types of leadership, knowledge, skills, and experience individuals in their community possess [33]. The match between governance and effective management of complex social-ecological problems like wildfire risk requires individual leadership as well as multi-level coordination that builds networks among stakeholders, norms around common goals, and trust in one another [11,13,24]. Although having more competence predicted relatively lower community exposure, its moderating effect was most visible by partitioning the data into different groups of communities with high, moderate, and low perceived competence (Figure 7). Having knowledgeable, skilled, and experienced leaders and stakeholders likely improve a community’s capacity to manage complex cross-boundary wildfire risk, conduct multi-level coordination, develop social networks that help contextualize risks, and navigate misalignments between values important to the community and those of nearby landowners [12,51]. In communities where key competencies to manage cross-boundary wildfire risk are nascent, investing in processes that build capacity by networking individuals with key knowledge, skills, or experiences may help to increase the competence needed to navigate complex challenges of coordinating wildfire risk reduction over time [20]. Several efforts in the US are focused on developing learning networks to share experiences, knowledge, and skills across communities, including The Nature Conservancy sponsored Fire Learning Networks and the Fire Adapted Communities Learning Network as well as the Fire Science Exchange Networks (For more information see: (1) Fire Learning Networks (https://www.conservationgateway.org/ConservationPractices/FireLandscapes/FireLearningNetwork/Pages/fire-learning-network.aspx), (2) Fire Adapted Communities Learning Network (https://fireadaptednetwork.org/), and (3) Fire Science Exchange Networks (http://www.firescience.gov/jfsp_exchanges.cfm)). Supporting networks like these may be an important strategy for policymakers to increase local capacity.
Disaster risk reduction efforts aimed at reducing vulnerability and increasing resilience of local communities require ongoing processes incorporating local and scientific knowledge [14,52]. Community wildfire protection planning may represent a second important strategy for reducing community wildfire risk. Although CWPPs set the groundwork for developing competent cross-scale practitioner and stakeholder networks, Abrams et al. [6] noted that some communities may have prioritized plan completion (for financial incentives) over process and inclusion, sidelining opportunities for social learning and community capacity building. The Healthy Forest Restoration Act could be amended to require regular CWPP updates that hone not only the content of the plan and their use of risk and exposure analyses, but also demonstrate how communities continue to engage their leaders and stakeholders in wildfire risk reduction to build stronger social networks and capacity that better align cross-boundary risk governance with the biophysical wildfire exposure network. This type of hortatory recommendation has been made in other disaster mitigation contexts in recognition that without required updates, mitigation plans may be ignored or turned to shelf art as other pressing concerns vie for scarce resources [53].
Moderate capacity communities may stand to benefit the most from required regular updates to their wildfire risk mitigation planning and networking with other communities. The majority of communities in our study fell into the moderate capacity group, and the likelihood that these communities had high exposure to wildfire risk was influenced by the complexity of their exposure network and other landscape constraints, suggesting that the challenge of collaboration and coordination across a diversity of landowners, agencies, and stakeholders is a limitation for these communities. Building capacity in these communities may allow community leaders to leverage existing networks of key individuals for gains in their ability to conduct multi-level coordination of cross-boundary risk management. Low-capacity communities would also stand to benefit from regular updating of the processes that bring together stakeholders in the community to address wildfire risk. Gains in these communities, however, might be expected to take longer. A majority of ignitions in low-capacity, high-exposure communities originated more than 20 km away, suggesting that mismatches between local planning and the community fireshed may be broader in those communities than in moderate and high capacity communities where the community fireshed and the scale of planning may be more aligned and less prone to mismatches.
Our study is not without limitations. First, our definition of community was largely restricted to places that could be discretely mapped. Although many areas of rural residential development escape this definition, the choice to focus on mapped communities was pragmatically necessary to assign the exposure values needed to test our two hypotheses. Further, it is not clear that all of our communities meet the Wilkinsonian definition of interactional communities [35], which may be a reason that perceived competence was low in some communities. Rich investigations of communities may help explain variability in perceived competence (e.g., a lack of social institutions around which people regularly interact). Second, the study relies on key informant perceptions, which could be biased or otherwise miscalculated. Either way, the results beg an interesting causal question, why do higher capacity communities tend to have low exposure? The answer to this question is beyond the scope of this paper, but is an opportunity for further research in the field. One explanation could be that high-capacity communities are more likely to have low exposure because they have effected change (by addressing hazardous fuels or other sources of risk) in their community fireshed over time, thereby reducing exposure. To validate this conclusion, wildfire simulations would need to show lower exposure to communities following fuel treatments. Our post-hoc analysis suggests that low-exposure communities completed more fuel treatments than high-exposure communities. An alternative proposition is that low-exposure drives greater perceived competence, even in cases where the exposure network is more complex, precisely because low exposure is easier to manage. A time-series analysis of exposure, management actions, and community capacity would help identify which explanation holds more truth. Either way, we have identified a relationship between community capacity and community exposure to wildfire risk that needs further investigation.

5. Conclusions

In the western US and other parts of the world, from Australia to the Mediterranean, communities are increasingly affected by wildfire. We argue that better management of community wildfire risk requires a clear understanding of (1) the sources and pathways through which wildfire may be transmitted to values of concern for local communities (e.g., homes or other resources that the community is dependent upon for local livelihoods), and (2) community capacity to manage its sources of exposure to wildfire across jurisdictional boundaries, which together suggest the complexity and capacity hypotheses. First, greater complexity in the wildfire exposure network increases the likelihood that mismatches in the coordination of risk governance will occur resulting in increased wildfire exposure and decreased disaster risk reduction. Second, community capacity to address sources of community wildfire risk can moderate the likelihood of mismatches and decrease community wildfire risk. We found support for both hypotheses, and suggest that investments in ongoing updates to community risk planning and efforts to network the necessary skills, knowledge, and leadership across communities should prioritize communities with highly complex networks, and may help to leverage existing capacity into a self-reinforcing cycle increasing competence to manage cross-boundary wildfire risk [54]. Investing in planning updates and networking may be most important for moderate capacity communities where the complexity of the planning and coordination process exerts a stronger influence on the management of mismatches and community exposure to wildfire. Leveraging existing relationships and building new linkages between key leaders and stakeholders to support cross-boundary work in these communities should be supported by national authorities and directives.

Author Contributions

Conceptualization, M.N.-P. and A.A.; Data curation, M.N.-P. and C.E.; Formal analysis, M.N.-P.; Funding acquisition, M.N.-P. and A.A.; Investigation, M.N.-P., C.E. and A.A.; Methodology, M.N.-P., C.E. and A.A.; Project administration, M.N.-P. and A.A.; Resources, M.N.-P. and A.A.; Software, M.N.-P. and C.E.; Supervision, M.N.-P. and A.A.; Validation, M.N.-P.; Visualization, M.N.-P and C.E.; Writing—original draft, M.N.-P.; Writing—review & editing, M.N.-P., C.E. and A.A.

Funding

U.S. Forest Service: 16-CS-11221637-119; National Science Foundation: DGE-0966376.

Acknowledgments

Ken Bunzel and Chris Ringo assisted with community mapping and geoprocessing wildfire perimeters. Funding to support the community mapping and wildfire simulation geoprocessing was awarded through the United States Department of Agriculture, Forest Service award number 16-CS-11221637-119. We acknowledge Cassandra Moseley, Travis Paveglio, and Jesse Abrams for their contribution to the design and collection of key informant data collection. We are also grateful to the National Science Foundation Integrative Graduate Education and Research Traineeship grant number DGE-0966376 for graduate research assistantship support and Portland State University for tuition. Finally, we thank the two anonymous reviewers and the academic editor whose suggestions helped improve the manuscript.

Conflicts of Interest

The authors declare no conflict of interest.

References

  1. North, M.P.; Stephens, S.L.; Collins, B.M.; Agee, J.K.; Aplet, G.; Franklin, J.F.; Fulé, P.Z. Reform forest fire management. Science 2015, 349, 1280–1281. [Google Scholar] [CrossRef] [PubMed]
  2. Williams, D.R.; Jakes, P.J.; Burns, S.; Cheng, A.S.; Nelson, K.C.; Sturtevant, V.; Brummel, R.F.; Staychock, E.; Souter, S.G. Community wildfire protection planning: The importance of framing, scale, and building sustainable capacity. J. For. 2012, 110, 415–420. [Google Scholar] [CrossRef]
  3. Bailey, D. National dialogue needed about WUI fires. Wildfire 2013, September/October, 6–7. [Google Scholar]
  4. Ager, A.A.; Day, M.; Finney, M.A.; Vance-Borland, K.; Vaillant, N.M. Analyzing the transmission of wildfire exposure on a fire-prone landscape in Oregon, USA. For. Ecol. Manag. 2014, 334, 377–390. [Google Scholar] [CrossRef]
  5. Lei, Y.; Wang, J. A preliminary discussion on the opportunities and challenges of linking climate change adaptation with disaster risk reduction. Nat. Hazards 2014, 71, 1587–1597. [Google Scholar] [CrossRef]
  6. Abrams, J.; Nielsen-Pincus, M.; Paveglio, T.; Moseley, C. Community wildfire protection planning in the American West: Homogeneity within diversity? J. Environ. Plan. Manag. 2016, 59, 557–572. [Google Scholar] [CrossRef]
  7. Jakes, P.J.; Nelson, K.C.; Enzler, S.A.; Burns, S.; Cheng, A.S.; Sturtevant, V.; Williams, D.R.; Bujak, A.; Brummel, R.F.; Grayzeck-Souter, S.; et al. Community wildfire protection planning: Is the Healthy Forests Restoration Act’s vagueness genius? Int. J. Wildland. Fire 2011, 20, 350–363. [Google Scholar] [CrossRef]
  8. Monroe, A.S.; Butler, W.H. Responding to a policy mandate to collaborate: Structuring collaboration in the collaborative forest landscape restoration program. J. Environ. Plan. Manag. 2016, 59, 1054–1072. [Google Scholar] [CrossRef]
  9. Brummel, R.F.; Nelson, K.C.; Souter, S.G.; Jakes, P.J.; Williams, D.R. Social learning in a policy-mandated collaboration: Community wildfire protection planning in the eastern United States. J. Environ. Plan. Manag. 2010, 53, 681–699. [Google Scholar] [CrossRef]
  10. Ivery, J. Policy mandated collaboration. J. Soc. Soc. Welf. 2008, 35, 53–70. [Google Scholar]
  11. Chaffin, B.C.; Gosnell, H.; Cosens, B.A. A decade of adaptive governance scholarship: Synthesis and future directions. Ecol. Soc. 2014, 19, 56. [Google Scholar] [CrossRef]
  12. Abrams, J.B.; Knapp, M.; Paveglio, T.B.; Ellison, A.; Moseley, C.; Nielsen-Pincus, M.; Carroll, M.C. Re-envisioning community-wildfire relations in the U.S. West as adaptive governance. Ecol. Soc. 2015, 20, 34. [Google Scholar] [CrossRef] [Green Version]
  13. Alexander, D.E. Resilience and disaster risk reduction: An etymological journey. Nat. Hazards Earth Syst. Sci. 2013, 13, 2707–2716. [Google Scholar] [CrossRef] [Green Version]
  14. Birkmann, J.; von Teichman, K. Integrating disaster risk reduction and climate change adaptation: Key challenges—Scales, knowledge, and norms. Sustain. Sci. 2010, 5, 171–184. [Google Scholar] [CrossRef]
  15. Fischer, A.P.; Spies, T.A.; Steelman, T.A.; Moseley, C.; Johnson, B.R.; Bailey, J.D.; Ager, A.A.; Bourgeron, P.; Charnley, S.; Collins, B.M.; et al. Wildfire risk as a socioecological pathology. Front. Ecol. Environ. 2016, 14, 276–284. [Google Scholar] [CrossRef] [Green Version]
  16. Cumming, G.S.; Cumming, D.H.; Redman, C.L. Scale mismatches in social-ecological systems: Causes, consequences, and solutions. Ecol. Soc. 2006, 11, 14. [Google Scholar] [CrossRef] [Green Version]
  17. Fischer, A.P.; Charnley, S. Risk and cooperation: Managing hazardous fuel in mixed ownership landscapes. Environ. Manag. 2012, 49, 1192–1207. [Google Scholar] [CrossRef] [Green Version]
  18. Donovan, G.H.; Brown, T.C. Be careful what you wish for: The legacy of Smokey Bear. Front. Ecol. Environ. 2007, 5, 73–79. [Google Scholar] [CrossRef] [Green Version]
  19. Gude, P.; Rasker, R.; van den Noort, J. Potential for future development on fire-prone lands. J. For. 2008, 106, 198–205. [Google Scholar]
  20. Ager, A.A.; Kline, J.D.; Fischer, A.P. Coupling the biophysical and social dimensions of wildfire risk to improve wildfire mitigation planning. Risk Anal. Int. J. 2015, 35, 1393–1406. [Google Scholar] [CrossRef]
  21. Eng, E.; Parker, E. Measuring community competence in the Mississippi Delta: The interface between program evaluation and empowerment. Health. Educ. Behav. 1994, 21, 199–220. [Google Scholar] [CrossRef] [PubMed]
  22. Sherrieb, K.; Louis, C.A.; Pfefferbaum, R.L.; Betty Pfefferbaum, J.D.; Diab, E.; Norris, F.H. Assessing community resilience on the US coast using school principals as key informants. Int. J. Disaster Risk Reduct. 2012, 2, 6–15. [Google Scholar] [CrossRef]
  23. Fleming, C.J.; McCartha, E.B.; Steelman, T.A. Conflict and collaboration in wildfire management: The role of mission alignment. Public Adm. Rev. 2015, 75, 445–454. [Google Scholar] [CrossRef]
  24. Olsson, P.; Folke, C.; Galaz, V.; Hahn, T.; Schultz, L. Enhancing the fit through adaptive co-management: Creating and maintaining bridging functions for matching scales in the Kristianstads Vattenrike biosphere reserve, Sweden. Ecol. Soc. 2007, 12, 1–17. [Google Scholar] [CrossRef] [Green Version]
  25. Putnam, R. Making Democracy Work: Civil Traditions in Modern Italy; Princeton University Press: Princeton, NJ, USA, 1993. [Google Scholar]
  26. Calkin, D.E.; Gebert, K.M.; Jones, J.G.; Neilson, R.P. Forest service large fire area burned and suppression expenditure trends, 1970–2002. J. For. 2005, 103, 179–183. [Google Scholar] [CrossRef]
  27. Liang, J.; Calkin, D.E.; Gebert, K.M.; Venn, T.J.; Silverstein, R.P. Factors influencing large wildland fire suppression expenditures. Int. J. Wildland Fire 2008, 17, 650–659. [Google Scholar] [CrossRef]
  28. Office of the Inspector General (OIG). Forest Service Large Fire Suppression Costs; USDA Report No. 08601-44-SF; OIG: Washington, DC, USA, 2006; p. 58.
  29. Ager, A.A.; Day, M.A.; McHugh, C.W.; Short, K.; Gilbertson-Day, J.; Finney, M.A.; Calkin, D.E. Wildfire exposure and fuel management on western US national forests. J. Environ. Manag. 2014, 145, 54–70. [Google Scholar] [CrossRef]
  30. Ager, A.A.; Day, M.A.; Short, K.C.; Evers, C.R. Assessing the impacts of federal forest planning on wildfire risk mitigation in the Pacific Northwest, USA. Landsc. Urban Plan. 2016, 147, 1–17. [Google Scholar] [CrossRef] [Green Version]
  31. Heffernan, J.M.; Smith, R.J.; Wahl, L.M. Perspectives on the basic reproductive ratio. J. R. Soc. Interface 2005, 2, 281–293. [Google Scholar] [CrossRef]
  32. Ager, A.; Pailaiologou, P.; Evers, C.R.; Day, M.A.; Ringo, C. Wildfire Exposure to the Wildland Urban Interface in the Western US. Appl. Geogr. 2019, 111, 102059. [Google Scholar] [CrossRef]
  33. Jakes, P.; Kruger, L.; Monroe, M.; Nelson, K.; Sturtevant, V. Improving wildfire preparedness: Lessons from communities across the US. Hum. Eco. Rev. 2007, 14, 188–197. [Google Scholar]
  34. Cheng, A.S.; Kruger, L.E.; Daniels, S.E. “Place” as an integrating concept in natural resource politics: Propositions for a social science research agenda. Soc. Nat. Resour. 2003, 16, 87–104. [Google Scholar] [CrossRef] [Green Version]
  35. Wilkinson, K.P. The Community in Rural America; Greenwood Publishing Group: New York, NY, USA, 1991. [Google Scholar]
  36. Folke, C.; Hahn, T.; Olsson, P.; Norberg, J. Adaptive governance of social-ecological. Annu. Rev. Environ. Resour. 2005, 30, 441–473. [Google Scholar] [CrossRef] [Green Version]
  37. Paveglio, T.; Nielsen-Pincus, M.; Moseley, C.; Abrams, J. Advancing characterization of social diversity in the wildland-urban interface: An indicator approach for wildfire management. Landsc. Urban Plan 2017, 160, 115–126. [Google Scholar] [CrossRef] [Green Version]
  38. Paveglio, T.B.; Moseley, C.; Carroll, M.S.; Williams, D.R.; Davis, E.J.; Fischer, A.P. Categorizing the social context of the wildland urban interface: Adaptive capacity for wildfire and community “archetypes”. For. Sci. 2015, 61, 298–310. [Google Scholar] [CrossRef] [Green Version]
  39. Paveglio, T.B.; Carroll, M.S.; Jakes, P.J.; Prato, T. Exploring the social characteristics of adaptive capacity for wildfire: Insights from flathead county, Montana. Hum. Ecol. Rev. 2012, 19, 110–124. [Google Scholar]
  40. Wilson, G.A. Community resilience, policy corridors and the policy challenge. Land Use Policy 2013, 31, 298–310. [Google Scholar] [CrossRef]
  41. Ojerio, R.; Moseley, C.; Lynn, K.; Bania, N. Limited involvement of socially vulnerable populations in federal programs to mitigate wildfire risk in Arizona. Nat. Hazards Rev. 2010, 12, 28–36. [Google Scholar] [CrossRef]
  42. Patton, M.Q. Qualitative Evaluation and Research Methods; Sage: Thousand Oaks, CA, USA, 2002. [Google Scholar]
  43. Radeloff, V.C.; Hammer, R.B.; Stewart, S.I.; Fried, J.S.; Holcomb, S.S.; McKeefry, J.F. The wildland-urban interface in the United States. Ecol. Appl. 2005, 15, 799–805. [Google Scholar] [CrossRef] [Green Version]
  44. PAD-US—National Inventory of Protected Areas. Available online: https://pubs.usgs.gov/fs/2013/3086/ (accessed on 12 November 2013).
  45. Ager, A.A.; Vaillant, N.M.; Finney, M.A.; Preisler, H.K. Analyzing wildfire exposure and source–sink relationships on a fire prone forest landscape. For. Ecol. Manag. 2012, 267, 271–283. [Google Scholar] [CrossRef]
  46. Finney, M.A.; McHugh, C.W.; Grenfell, I.C.; Riley, K.L.; Short, K.C. A simulation of probabilistic wildfire risk components for the continental United States. Stochastic Environ. Res. Risk Assess. 2011, 25, 973–1000. [Google Scholar] [CrossRef] [Green Version]
  47. Zeileis, A.; Hothorn, T.; Hornik, K. Model-Based Recursive Partitioning. J. Comput. Graph. Stat. 2008, 17, 492–514. [Google Scholar] [CrossRef] [Green Version]
  48. Corotis, R.B.; Hammel, E.M. Multi-attribute aspects for risk assessment of natural hazards. Int. J. Risk Assess. Manag. 2010, 14, 437–458. [Google Scholar] [CrossRef]
  49. Fuchs, S.; Kuhlicke, C.; Meyer, V. Editorial for the special issue: Vulnerability to natural hazards-the challenge of integration. Nat. Hazards 2011, 58, 609–619. [Google Scholar] [CrossRef] [Green Version]
  50. Alexandre, P.M.; Stewart, S.I.; Keuler, N.S.; Clayton, M.K.; Mockrin, M.H.; Bar-Massada, A.; Syphard, A.D.; Radeloff, V.C. Factors related to building loss due to wildfires in the conterminous United States. Ecolo. Appl. 2016, 26, 2323–2338. [Google Scholar] [CrossRef]
  51. Steelman, T.A. Addressing the Mitigation Paradox at the Community Level. In Wildfire Risk: Humman Perception and Management. Implications; Martin, W.E., Raish, C., Kent, B., Eds.; Resources for the Future: Washington, DC, USA, 2008; pp. 64–80. [Google Scholar]
  52. Gaillard, J.C.; Mercer, J. From knowledge to action: Bridging gaps in disaster risk reduction. Prog. Hum. Geogr. 2013, 37, 93–114. [Google Scholar] [CrossRef]
  53. Donoghue, E.M.; Sutton, N.L. Socioeconomic change in planning provinces of the Northwest Forest Plan Region. Northwest Sci. 2006, 80, 73–85. [Google Scholar]
  54. Emery, M.; Flora, C. Spiraling-up: Mapping community transformation with community capitals framework. Community Dev. 2006, 37, 19–35. [Google Scholar] [CrossRef]
Figure 1. Study area map showing federal lands, interstate highways, and 60 communities located in 9 western US states. All communities in the sample had experienced a large fire within the last decade.
Fire 02 00059 g001
Figure 2. Simplified fire exposure network for Sisters, Oregon and its surrounding wildland urban interface (WUI). Exposure complexity is quantified as the number of arrows in the network. Red nodes highlight the location of houses exposed to wildfire and are divided between the community core and WUI within a 40km buffer of the Sisters incorporated city boundary. Black nodes indicate sources of exposure from the surrounding landscape. Total exposure is 17.9 housing units per year or 0.3% of total housing within a 40 km buffer around Sisters. Arrows and nodes are sized to represent their proportion of total exposure. Green arrows represent sources of exposure in which mechanical fuel treatments are restricted (e.g., wilderness areas). For example, restricted US Forest Service lands transmit more exposure to the WUI around Sisters than to Sisters itself. In contrast, BLM lands that can be managed transmit more exposure to Sisters than to its surrounding WUI.
Fire 02 00059 g002
Figure 3. Fireshed data for the community of Sisters, Oregon and surrounding landscape showing (A) land tenure including US Forest Service (dark grey), Bureau of Land Management (light grey), tribal lands (stippled), private land (white), and management areas that restrict mechanical fuels treatments (hashed), (B) WUI and developed areas (grey), (C) simulated large fire ignitions that grow to less than 100,000 ha (small dots) and greater than 100,000 ha (circles), and minimum convex polygon of fireshed area (dashed line), and (D) 10 km grid of exposure transmission where darker cells transmit fires that create more exposure to Sisters and nearby WUI than lighter grid cell.
Fire 02 00059 g003
Figure 4. Community exposure to wildfire measured by (A) the average annual number of housing units predicted to be exposed to simulated wildfires (bars) and the corresponding percentage of the total housing units exposed (dots: white are below the median exposure, grey are above), and (B) the percent of exposed housing units for which simulated ignitions originated on federally managed (grey bar) and protected lands (black bar). Numbers below the x-axis represent the community number in Figure 1.
Fire 02 00059 g004
Figure 5. Community wildfire exposure networks arranged in terms of exposure complexity (x-axis) and overall exposure (y-axis) demonstrates a general relationship of increasing exposure with increasing exposure complexity. The top row represents the nine highest exposure communities arranged from left to right from least to most exposure complexity. Each exposure source is arrayed in a circle around the community core and surrounding WUI (black dots in each exposure network) as depicted in the legend on the lower right. Edges between the community core, WUI, and surrounding nodes represent exposure transmission pathways from various land tenure sources, with NF = National Forests, NP = National Park, ST = State, PRV = Private lands, TRB = tribal, DOD = Department of Defense, BLM = Bureau of Land Management, FED = Other federal lands, and OTH = Other non-federal public lands. Green nodes are exposure sources that are protected and restricted from mechanical treatments, and red nodes are manageable. Arrangement of exposure sources on legend diagram is the same as arrangement for all exposure networks. The numbers below each exposure network represent the community number in Figure 1.
Fire 02 00059 g005
Figure 6. Distribution of community characteristics as reported by key informants, disaggregated by high and low exposure communities. Y-axis indicates the number of communities in which key informants were neutral or disagreed (mean item score <0.5 on 5-point Likert-type scale, where −2 equals strongly disagree and +2 equals strongly agree), or exhibited moderate agreement (mean item score between 0.5 and 1.5) or strong agreement (mean item score greater than 1.5).
Fire 02 00059 g006
Figure 7. Logistic regression tree for the community wildfire exposure data. Tree branches divide communities into low, moderate, and high community competency to address wildfire risk, as assessed by community key informants. The relationship between transmission complexity and exposure classification is shown with bivariate scatter plots (dots) and regression line. Bars plots (bottom) show the percent of communities classified as high and low exposure communities within each branch.
Fire 02 00059 g007
Table 1. Summary of study communities’ characteristics by low and high exposure communities.
Low Exposure CommunitiesHigh Exposure Communities
Total CommunitiesNumber of Housing UnitsNumber of CommunitiesPercent Housing ExposedNumber of Housing Units ExposedNumber of CommunitiesPercent Housing ExposedNumber of Housing Units Exposed
6010,669300.11%20.630.00.59%21.1
States
AZ748,51020.11%202.050.37%31.7
CA12248690.10%2.130.86%14.0
CO2801720.05%3.30
ID10296110.11%8.290.92%17.1
MT31766030.43%7.2
NM412,84940.18%21.40
OR157024100.11%8.450.34%11.6
UT218,91310.06%2.710.26%86.4
WA5504210.13%8.640.48%26.0
Total Housing Units
<10001637160.11%0.5100.93%3.7
1000–9999313751160.11%4.8150.43%16.6
10,000–99,9991220,87970.10%22.550.41%66.0
>=100,0001267,37210.14%381.00
Dominant Land Cover
Forest396092220.11%9.7170.69%8.0
Mixed12838940.09%4.780.48%36.0
Shrub648,55530.10%128.130.26%43.8
Grass3350810.10%0.520.73%50.5
Fire Regime Groups
FRG1236549160.12%9.170.58%10.3
FRG2/FRG39335430.08%5.860.50%3.1
FRG4/FRG5559,36930.12%129.920.86%85.2
Mixed FRGs23706480.09%8.1150.60%23.7
Table 2. Community capacity indices and associated items response distributions.
IndexMean (S.D.)Skew% Strongly Agree% Strongly Disagree
Social Cohesion (Chronbach’s α = 0.89)1.15 (0.67)−1.0730%0%
Residents…have a strong sense of community1.29 (0.69)−1.3337%0%
…share a sense of values and culture1.13 (0.73)−0.8530%0%
…are vested in the future and well-being of each other1.02 (0.74)−0.8622%0%
Community Competency (Chronbach’s α = 0.74)1.13 (0.59)−1.2433%0%
There are…… individuals in the community with knowledge about the local ecology1.35 (0.61)−0.5840%0%
… individuals in the community with emergency management or wildland firefighting experience1.32 (0.87)−1.8847%2%
… local leaders that spearhead efforts to plan for and implement projects wildfire mitigation1.11 (0.85)−1.0333%0%
… residents in the community with grant writing experience needed to secure financial assistance for mitigation0.65 (0.90)−0.818%2%
Shared Responsibility & Understanding (Chronbach’s α = 0.89)0.28 (0.72)−0.043%0%
In at-risk areas…… new residents are equally as interested in mitigating wildfire risk as long-time residents0.37 (0.79)0.037%0%
… people understand that there may not be enough firefighting resources to save every home at risk from wildfire0.35 (1.00)−0.3710%3%
… second homeowners and seasonal residents are equally as interested in mitigating wildfire risk as other residents0.11 (0.86)0.317%2%
Place-based Knowledge and Experience (Chronbach’s α = 0.89)0.25 (0.64)0.015%0%
People in at-risk areas…… understand the steps they can take to reduce wildfire risk 0.77 (0.67)−0.867%0%
… understand wildfire risk in the area 0.74 (0.84)−0.9012%0%
… have detailed understanding of area fire regimes−0.16 (0.83) 0.462%0%
… tend to consider wildfire risk reduction to be someone else’s problem (reverse coded for index)−0.39 (1.06)−0.3813%3%
Table 3. Summary of community averages and logistic regression predicting high community exposure to wildfire.
Average CommunityLogistic Regression
Low Exposure CommunitiesHigh Exposure CommunitiesCoefficientsOdds Ratio (95% Confidence Interval)
Intercept0.69
Exposure complexity index19.119.40.15 **1.16(1.03–1.31)
Federal land area (%)50.960.43.27 **26.37(1.13–617.78)
Protected land area (%)9.26.6−14.87 *<0.01(<0.01–1.89)
WUI area (%)18.412.5−6.12 *<0.01(<0.01–1.57)
Competence1.40.9−2.72 ***0.07(0.01–0.44)
Social Cohesion1.11.20.141.15(0.38–3.46)
Place-based Knowledge and Experience0.10.41.223.37(0.62–18.49)
Shared Responsibility and Understanding0.10.5−0.170.84(0.19–3.75)
n303060
Likelihood ratio28.42 ***
Nagelkerke R20.51
* p < 0.1; ** p < 0.05; *** p < 0.01
Table 4. Recursively partitioned logistic regression model. Panel A shows partition tests for fluctuations in regression model of high exposure as a function of exposure complexity. Panel B partitioned regression models show that exposure complexity is a significant predictor of high exposure only in moderate competence communities.
Panel A.Partition Tests
1st Partition2nd Partition
Federal land area (%)No-
Protected land area (%)No-
WUI area (%)No-
Competence<0.75 ***≥1.5 *
Social CohesionNo-
Place-based Knowledge and ExperienceNo-
Shared Responsibility and UnderstandingNo-
Panel B.Partitioned Regression Models Dependent Variable: High Exposure Communities
Low Competence CommunitiesModerate Competence CommunitiesHigh Competence Communities
Intercept−1.82−1.52 **−2.13
Exposure complexity index0.150.06 *0.04
n142620
Null deviance11.4836.0422.49
Residual deviance9.7133.2722.10
* p < 0.1; ** p < 0.05; *** p < 0.01
No indicates that the regression could not be improved by partitioning based on a given variable; Numbers indicate the variable values at which partitions significantly improved the regression model.
Table 5. Cross-tabulations of community and landscape characteristics with exposure and competency categories.
Low ExposureHigh Exposure
Low CompetencyModerate CompetencyHigh CompetencyLow CompetencyModerate CompetencyHigh Competency
Number of Communities113168184
Exposure Characteristics
Average Annual Percent of Housing Units Exposed0.2%0.1%<0.1%0.9%0.5%0.3%
Total of Housing Units2285.05303.126,786.32825.04125.410,867.0
Exposure Complexity Index14.016.521.421.118.022.5
Annualized Ignition Characteristics
Total Ignitions3.64.434.915.120.331.8
Percent Ignitions in Community Core0.0%1.3%1.6%0.3%4.3%1.8%
Percent Ignitions in Community Buffer66.7%68.3%62.8%42.5%62.4%71.6%
Percent Ignitions outside of Community Buffer33.3%30.4%35.6%57.2%33.3%26.7%
WUI Characteristics in Community Buffer Landscape
Interface WUI5.0%3.3%5.5%1.9%3.3%5.1%
Intermix WUI0.7%1.3%1.4%0.9%0.6%3.1%
Fuels Treatments in Community Buffer Landscape
Hazardous Fuels Treatments9.0%3.6%4.1%2.1%1.9%3.1%
Rx Burn Treatments0.5%1.0%1.6%1.8%2.4%1.9%

