
Experimental Study of the Effect of Slope on the Spread and Burning Characteristics of a Continuous Oil Spill Fire

1
Department of Engineering Physics, Institute of Public Safety Research, Tsinghua University, Beijing 100084, China
2
School of Emergency Management and Safety Engineering, China University of Mining and Technology, Beijing 100084, China
*
Author to whom correspondence should be addressed.
Fire 2022, 5(4), 112; https://doi.org/10.3390/fire5040112
Submission received: 15 June 2022
/
Revised: 22 July 2022
/
Accepted: 28 July 2022
/
Published: 3 August 2022
(This article belongs to the Special Issue Turbulent Combustion Modelling, Experiment and Simulation)
Abstract
:Elucidating the characteristics of continuous oil spill fires for different slope conditions can provide important theoretical support for the prevention of, and rescue strategies during, oil spill fire accidents. For this research, we conducted experiments to observe the spread and burning process of continuous oil spill fires under different slope conditions. The changes in physical attributes, such as flame spread rate, burning rate, heat convection at the bottom surface, and flame feedback radiation, were analyzed for the different slope conditions. The results showed that the shrinking phase becomes difficult to see, and the steady phase disappears when the slope increases in the spread and burning process. When the slope increases, the spread speed and spread area increase, and burning rate decreases. Compared with a non-burning process, the resistance to spread decreases in the burning process. We show that the slope directly affects the spreading process, and indirectly affects the burning process.
1. Introduction
A liquid fuel leak frequently causes a spill fire disaster, the characteristics of which are a large burning area and being difficult to extinguish. This is a great threat to the safety of storage and transportation of liquid fuels. Since liquid fuels are the main fuel for vehicles, traffic accidents are also an important cause of spill fires. The spread and burning process of a spill fire is very sensitive to the slope where the spill occurs. Even a small slope will have a great impact on how the spill fire disaster develops. Studying the characteristics of continuous oil spill fires under different slope conditions can provide important theoretical support for the prevention of, and rescue strategies during, oil spill fire accidents.
There are abundant experimental studies looking at oil pool fires and thin oil-layer burning in the experimental research of oil spill fires. For example, Chen et al. [1] conducted a spread experiment of oil pool fires in a pressure vessel, Liu et al. [2] conducted an oil pool fire burning experiment looking at how edge height influences the fire, and Lin and Kuang et al. [3,4] performed an oil pool fire experiment examining the influence of environmental wind. However, there are relatively few experimental studies on spill fires. Li and Zhao [5,6,7,8,9,10,11] proposed a spread and burning model for a continuous oil spill fire on a water surface and on a horizontal glass surface, through experimental research on the spread and burning process of different liquid fuels on water surfaces and fireproof glass surfaces. Li et al. [12,13] studied the laws governing the spread and burning of continuous oil spill fires in a tunnel environment. Most of the previous literature is focused on spill fires on flat surfaces. Up to date, there are a few works focused on the slope effect of spill fires. Li et al. [5] studied the spill fire on a sloping stainless steel trench with slopes of 0~4°. They compared the experimental phenomena between sloping ground, horizontal ground, and a water surface and found that the maximum spread area was sensitive to the slope and the steady burning area nearly kept a constant with the increased slope. Zhao et al. [11] studied the JP-4 spill fires under a glass surface with slopes of 0~3°, and analyzed the burning process and found that the larger the slope, the lower the burning rate for the steady burning stage. Liu et al. [14,15,16] studied the n-heptane spill fire phenomenon under variable slope conditions, by carrying out an n-heptane oil tank spill fire spread experiment on a glass surface at slopes of 0.5°, 1°, and 3°. In the experiments, they measured the spread rate and burning rate during the spill fire spread, and provided a simple empirical model of the burning rate. Li et al. [17] studied the unsteady burning behavior of n-butanol steady-flow fire under variable slope conditions, and studied how spread rate and flame height of an n-butanol flow fire behaved for a slope varying from 1~4°. They found that the spreading rate of n-butanol increased by 40.8% when the slope increased from 1° to 4°, and the spread front repeated a “jump-crawl-retract” phenomenon through the spread process. In these above works, we can find that the slope has a great effect on the fuel spread and burning behaviors. However, the detail slope effects on spreading and burning behaviors, especially for the spreading rate, spreading area, and burning rate, are still unknown.
Models of oil spill fires focus mainly on two aspects: flow and burning. The study of flow mainly focuses on spread rate, spread area, and spread thickness of the spill fire. Fay et al. [18,19] studied spill fire phenomena on water surfaces, and divided the flow into a gravity inertia mechanism, gravity viscous force mechanism, and viscous force molecular surface tension mechanism according to the liquid flow state, and proposed a formula to calculate each of these. Briscoe, Weber, and Witlox [20,21,22] put forward their own semi-empirical formulas, while Webber et al. [23] simulated the process of oil layer spread using shallow water equations, and provided relevant empirical formulas. However, these formulas and models do not apply to the ignition process, nor the spread process affected by slope. Our research of the burning process intends to extend current research findings for oil pool fires and thin-oil-layer burning, to the study of spill fire burning. Burgess and Babrauskas et al. [24,25] proposed an empirical formula of oil pool fire burning based on experimental data. On this basis, Mealy, Benfer, and Gottuk et al. [26,27,28,29] analyzed the effects of spread area, bottom surface spread, spread thickness, and other factors on the data from experiments examining the burning rate of a continuous-spill oil spill fire, and proposed a formula for spill fire burning rate through the correction of oil pool fire burning rate. Zhao, Li et al. [5,6,7,8,9,10,11] put forward a theoretical model for a spill fire on the surface of horizontal glass, based on theoretical research. To sum up, the flow fire burning model is based on a modified oil pool fire and a thin-oil-layer burning model, but in the case of the slope, the existing models have not been experimentally verified. The spread model of a spill fire is still difficult to combine with the burning model, and existing models cannot describe the spread of a spill fire on a slope. The spread and burning process of an oil spill fire on a slope needs further investigation.
2. Experimental Setup
An experiment was designed to study the spread and burning characteristics of a continuous oil spill fire for different slopes. The experimental setup is shown in Figure 1.The glass platform used in the experiment was 3 m long and 0.6 m wide. A 4 by 4 thermocouple-array was placed above the glass platform. Adjacent thermocouples in the array were spaced 25 cm apart, the lowest thermocouple being 1 cm above the glass platform, and the group on the edge directly above the oil outlet. The diameter of the thermocouples was 1 mm and the measuring range was 0–1300 K. The type of thermocouples was K. We placed 4 patch-thermocouples underneath the glass platform, at a distance of 60 cm, 120 cm, 180 cm, and 240 cm from the oil outlet, respectively. Four heat-flow meters were placed in a row with the same spacing from the oil outlet. The measuring range of heat-flow meters was 0–50 kW/m2. All thermocouples and heat-flow meters were placed on the central axis of the glass platform. The tilt angle of the glass platform was controlled by the adjustable supporting frame, and the slope was measured using a level, with an error of less than 0.05 degrees. Each experiment was repeated three times, and the results showed a good repeatability.
We used n-heptane and alcohol as the fuel in our experiments, and a peristaltic pump to deliver fuel at discharge rates of 30 r/min, 60 r/min, 90 r/min, and 120 r/min in succession. Some properties of the fuels used in the experiment are shown in Table 1. The relationship between the peristaltic pump speed and flow is given in Table 2, which is measured in the experiment. Five slopes (0, 0.5, 1, 1.5, and 2 degrees) were selected for the experiment. The specifications for all 40 of the test configurations are shown in Table 3. Each test in the table was performed under a condition of non-ignition and a condition of ignition, so there were 80 tests in total.
In the experiments, a camera placed 5 m from the glass platform was used to record the flame images at varied times. The value of frames per second for the camera was 25. During the processing, a developed digital image processing program based on Matlab was used to distinguish the flame contour. Then, the flame front and the flame spread length could be determined Figure 2 shows the schematic diagram of the flame processing method. For the fuel with a low flash point, the flame front position nearly equaled to the liquid fuel spread front. In the end, the spread area could be calculated (flame spread length × glass platform width).
3. Results and Discussion
3.1. Experimental Phenomena
After turning on the peristaltic pump, the fuel is injected into the oil spill tank at a constant rate. Ignition occurs as soon as the fuel begins to spill from the oil spill tank, and the fuel spreads forward and burns on the platform. We recorded this process with the camera as shown in Figure 3, and then analyzed how the burning distance of the spill fire varied with time.
In the non-ignited condition, the fuel gradually spreads forward on the glass platform, and the spread front is arc-shaped. When the slope is 0°, the spreading rate is fast at the start of the spill, but then gradually slows down. When there is a slope, the spread rate is significantly increased compared to when the gradient is 0°, and there is no obvious decrease in the spread rate as the spread progresses. When the slope increases, the spreading rate is significantly faster and the shape of the spread front gradually becomes prominent and forms a triangular shape. The spread area can be divided into two parts: the main area and side area, as shown in Figure 4. In the main area, the fuel will cover the entire width of the glass platform, and in the side area, the fuel covers only part of the surface of the glass platform. When the slope increases, the side area is larger. This phenomenon also exists in the ignited condition.
The spread process is more complicated for the ignited condition. When the slope is 0°, the spread process can be divided into three phases: spread phase; shrink phase; and steady phase. A number of studies describe this phenomenon [5,8]. The spread phase is the initial phase of a spill fire, which is mainly affected by gravity. In the spread phase, the spread area increases rapidly with time, and the burning rate also increases rapidly. In the shrinking phase, the flame front quickly retracts and the burning area becomes smaller in a short amount of time. This is because the liquid fuel burning rate for the whole surface (w*S) is larger than the discharge fuel rate (Q) and the fresh fuel cannot reach the fuel front. In the stable phase, the burning rate and the spill rate are equal, and the physical characteristics such as the burning rate, burning area, and thickness of the oil layer remain unchanged. When the slope is not 0°, an obvious phenomenon is that the shrinking phase becomes difficult to observe, and the steady phase will disappear when the slope increases. A typical example of an n-heptane spill fire is shown in Figure 5. The figure shows that when the slope is 0°, there is significant fuel spread, shrinkage, and staying steady. However, when the slope is 1°, the shrinking phase is not observed. When the slope is 2°, the steady phase is also not observed.
Table 4 presents a summary of all the experimental phenomena, with respect to the variation of the spread pattern with the slope during the burning process.
When the slope is 0°, the surface tension of the fuel is the main cause of shrinkage of the burning area. With a slope, the shrinking phase becomes insignificant, and as the slope increases, the shrinking and steady phases are no longer observable. According to the previous studies [5,8], during the liquid fuel spread, the spread behaviors are mainly controlled by the surface tension and gravity. For the liquid fuel spread on the flat surface, the fuel can spread evenly on the full surface. However, as the slope increases, the component force of gravity’s effect in the spread direction will become very obvious, which accelerates the spread rate and further results from the thinner liquid fuel layer. In addition, it is difficult to form the steady flow because of the surface tension effect. The detailed process is shown in Figure 4. Because the burning rate of alcohol is lower than that of n-heptane, and its viscosity is also lower than that of n-heptane, the surface tension has a lower resistance to flow during an alcohol spill, and it is more difficult to observe the shrinking and steady phases during alcohol spread.
In addition, the experimental results show that, with an increase in slope, the burning area of the stable stage increases significantly, which means that the corresponding burning rate decreases significantly. This phenomenon will be discussed in greater depth later.
In the case of ignition, as the flame spreads forward, the thermocouple arrays located above the glass platform is mainly to measure the gas-phase or flame temperature, while the thermocouple and heat flow meter located below the glass platform is mainly to measure the bottom surface temperature of the glass platform and feedback radiation transmission heat flux density. The measured data from one group of experiments are shown in Figure 6 as an example.
Figure 6a shows the axis flame temperature for the different heights. Thermocouple T-5 is placed close to the glass surface, and each thermocouple’s distance is 0.25 m. For each thermocouple, the temperature increases firstly and then decreases again. This can be attributed to the three spread phases. Moreover, it can be found that the measured temperature in steady stage decreases with the height increase. This is because the flame will be more intermittent and eventually disappear as the height increases. Figure 6b shows the flame temperature at different distances from the discharge source. With the spill fire spreading, the temperature increases slowly only by flame thermal radiation before contact with the flame. As the front of the burning layer reaches the position below the thermocouples, the temperature increases rapidly because of the flame contact, as shown in Figure 6b. These temperature variations can be further used to determine the flame front position. Figure 6c shows the bottom temperature of the glass platform. The heat transfer process between the glass and the fuel layer can be calculated by the variation of the bottom temperature. In Figure 6c, it can be found that the bottom glass surface temperature increases quickly after the fuel contact, which illustrates that the glass will absorb a lot of heat during the fuel spread. This explains that the heat transfer process may be a main reason for the lower burning rate. Figure 6d shows the transmission part of flame feedback radiation measured by the heat-flow meters under the bottom of the glass platform. The maximum radiative transmission flux can achieve around 18 kW/m2. It means that the radiative heat will significantly affect the burning rate of spill fire, combing the total flame heat feedback. The whole variation trend also increases firstly and then decreases, and is closely related to the fuel spread process. Based on Figure 6, it can be found that the flame radiative transmission and the heat convection between the fuel and the glass play an important role in the burning behaviors.
3.2. Burning Process
It is generally believed that in the burning process of liquid fuel, the heat absorbed by the oil layer determines the burning rate of the fuel [2]. In a spill fire burning process, the convective heat transfer between the oil and bottom surface, and the feedback radiation transmission of the flame, are important factors affecting the burning rate of the spill fire [8]. In our experiment, the convective heat transfer process of glass was measured by measuring the change in the bottom glass temperature. Without considering the radiation absorption of the glass bottom, the convective heat transfer of the oil layer to the glass can be calculated by [9]:
where, A is the burning area (m), cp is the specific heat capacity of the glass (kJ/(kg K)), ρ is the glass density (kg/m3), and is the glass thickness (m). To simplify, we assumed that the upper and bottom surface temperature of the glass is the boiling point temperature of the oil layer and , and because the glass is relatively thin, we assumed that the internal temperature distribution in the glass was linear. Equation (1) can therefore be expressed as:
where A is taken as the unit area, the thickness of fireproof glass is 5 mm, the density is 2500 kg/m3, and the specific heat capacity is 0.84 kJ/(kg K). Thus, the convective heat transfer between the oil layer and the glass bottom can be calculated, as shown in the Figure 7.
To measure the flame feedback radiation in the burning process, we configured 4 water-cooled heat flow meters at the bottom of the glass. Since the thickness of an oil layer is very thin during a spill fire burning, it can be assumed that most of the feedback radiation passes through the oil layer and the glass bottom, with only a small part being absorbed by the oil layer and glass bottom. The heat flow meter measures the radiant heat loss through the oil layer and the glass bottom. These measurements are shown in Figure 8.
Zhao et al. [8] proposed that the feedback radiation transmission of an n-heptane thin oil pool fire can be expressed by the following equation, based on the experimental study on the burning process of a thin oil pool fire:
where is the radiant heat flux feedback by the flame to the oil surface (kW/m2), h is the oil layer thickness (mm), and a is the absorption coefficient (mm−1), which was determined through an oil pool fire comparative experiment to be in an n-heptane oil pool fire burning process. This equation shows that feedback radiation transmission heat flow increases with a decrease in oil layer thickness. This is the opposite of the observation that the thickness of the oil layer decreases with an increase in the slope, but that the burning rate decreases. So, according to the experimental results, the effect of the decrease in total feedback radiation is more significant than the effect of the decrease in oil layer thickness.
Compared with the study of spill fires, the study of oil pool fires is relatively comprehensive, and shows there are some similarities with spill fires. Therefore, a comparative study of oil pool fires is a common method used for the analysis of spill fires. Burgess et al. [24] proposed an empirical formula, based on experiments, to calculate the burning rate of an oil pool fire:
where is the burning rate of oil under ideal conditions (mm/s), k is the extinction coefficient, and β is the average optical path (mm−1). The changes in the n-heptane burning rate for the different slopes in our experiment, compared with oil pool fires, are shown in Figure 9.
Considering the convective heat transfer loss and feedback radiation transmission loss between the oil layer and bottom, the burning rate of the spill fire can be expressed as:
where is the burning rate ratio, which can be expressed as (according to the model in [8]):
where is the total feedback radiation. Figure 10 is a comparison between the actual results and results calculated according to Equation (6). When the slope is 0°, the calculated value is significantly higher than the experimental value, and then the calculated value is not much different from the experimental value when the slope is more than 0°. One possible reason is that when the slope is 0°, there is a large deviation in the estimation of the thickness of the oil layer, because when the slope is 0°, the thickness of the oil layer is not distributed uniformly enough.
3.3. Spread Process
When the slope , the minimum oil layer thickness can be calculated according to Hissong [30]:
where σ is the surface tension (N/m) and ρ is the oil layer density (kg/m3). The minimum oil layer thickness in this formula refers to the oil layer thickness when the oil layer naturally stops spreading when the angle is 0°. This equation is widely used in the study of the spread process of spill fires, and is used to calculate the oil layer thickness of a spill fire when the slope is 0°. This method cannot be used to analyze the spread process when there is a slope.
In the experiment, when the n-heptane is ignited immediately, it flows out of the oil spill outlet, and the spill fire will begin to flow in the downhill direction. In the non-ignition case, the variation of spread area with a slope is shown in Figure 11. We assume that the oil layer thickness remains uniform during the spread. The oil layer thickness during the spreading stage can be calculated through volume conservation, which is shown in Figure 12. When the slope is 0°, the law governing the variation of the oil layer thickness is significantly different from that when there is a slope. In the case of a slope, the spread rate remains basically unchanged, and the thickness of the oil layer remains basically unchanged with the progress of spreading. As the slope increases, the spread rate also increases, and the thickness of the oil layer decreases. However, when the slope is 0°, the spread rate gradually decreases as the spread distance increases. Correspondingly, the thickness of the oil layer increases gradually over time, but this increasing trend gradually slows. Due to limitations of our experimental conditions, it was not possible to determine whether the thickness of the oil layer would eventually approach a stable value according to the experimental phenomenon. Combined with the conclusions of [21], we believe that when the slope is 0°, and the spread area is large enough, the thickness of the oil layer will approach the minimum oil layer thickness . To facilitate the processing of experimental data, the final thickness of the oil layer reached in the experiment is used as the value of the stable oil layer thickness corresponding to the experimental results in the case of a slope.
Assuming the oil flow is stable and uniform when the thickness of the oil layer is close to , the Manning formula can be used to describe the relationship between slope and . The Manning formula is:
where V is flow rate (m/s), is hydraulic radius (m), S is slope, and n is resistance coefficient. In this experiment, , and so V is:
where Q is the oil supply rate (g/s), L is the width of the platform (m), and is the density of oil (g/cm3). The relationship between slope and is:
Since the actual spread process encounters frictional resistance, the relationship between slope and is
This equation describes the relationship between the slope and in the non-burning case, in which n is the resistance coefficient and is the equivalent resistance slope. However, this formula cannot describe the situation where the slope is 0°. In fact, through the experimental phenomena, we know that the experimental appearance when the slope is 0° is obviously different from the experimental appearance when there is a slope. In addition, since the Manning equation itself is not suitable for describing the steady flow process when the slope is 0°, the spread process when the slope is 0° needs to be analyzed by other methods.
In the burning case, and assuming that the flame feedback radiation is proportional to the burning rate, the thickness of the oil layer in the stable stage can be estimated from the measurements of an oil pool fire. Zhao [8] provides an expression for flame feedback radiation and oil layer thickness.
In the oil pool fire experiment, we calculated that a = 0.88, so the minimum oil layer thickness can be calculated:
The relationship between oil layer thickness and slope is shown in Figure 13.
This figure shows that the thickness of the oil layer in the burning situation is lower than that in the non-burning situation, and the change with a slope is relatively small.
Using regression curve fitting based on formula (11), we can compare the resistance coefficient n and the equivalent resistance slope for the burning and non-burning situations. Table 5 provides the curve fitting result.
The result shows that when compared with the non-ignition process, the resistance coefficient n decreases in the burning process; that is, the obstruction to flow decreases. The difference of the temperature between ignition and non-ignition is considered the main reason resulting in this phenomenon.
3.4. Effect of Slope
Based on the experimental results described in Section 3.2 and Section 3.3, it can be seen that slope is the main influence on the spread process in the spill fires of this experiment. The influence of slope on the spread process is mainly reflected in the thickness of the oil layer and the spread speed. The spread speed will be faster when the slope is steeper, and the convective heat transfer between the oil and bottom will be greater. The thickness of the oil layer will be thicker when the slope changes, and will affect the flame feedback radiation transmission. These two effects combine to cause the decrease in burning rate when the slope is steeper. In addition, the burning process also affects the spread process, and the burning rate decreases when the slope increases. This means that the burning area will be larger during the stable burning stage when the slope increases. There is positive feedback of the spreading process for the burning process when the slope changes. This is why the spreading and burning processes of a spill fire are sensitive to a change of slope. The effect of the slope is depicted in Figure 14.
4. Conclusions
We conducted area source spill fire experiments to study the spread and burning characteristics of continuous oil spill fires for different slope conditions. The changes in physical characteristics of the spill fires, such as flame spread rate, burning rate, heat convection at the bottom surface, and flame feedback radiation for different slopes, are analyzed. The result shows that the shrinking phase becomes difficult to see, and the steady phase disappears when the slope increases in the spread and burning process. When the slope increases, the spread speed and spread area increase, and the burning rate decreases. Compared with a non-ignition process, the resistance to spread decreases in the burning process. A preliminary theoretical model to explain the spread and burning characteristics of a continuous oil spill fire under different slope conditions is proposed. In this model, the slope directly affects the spreading process, and indirectly affects the burning process. Once again, when the slope increases, the spreading speed and affected area increase, and burning rate decreases. This effect is mainly manifested in two ways: the oil layer thickness affects the feedback radiation transmission; and the spread speed affects the convective heat transfer. A decrease in the burning rate also increases the spread area, which is positive feedback. This explains why the spreading and burning processes of spill fires are sensitive to a change of slope.
Author Contributions
Conceptualization, X.S. and J.Z.; methodology, X.S.; validation, X.S. and G.S.; formal analysis, X.S.; investigation, X.S. and G.S.; resources, J.Z. and H.H.; writing—original draft preparation, X.S.; writing—review and editing, X.S., H.H. and J.Z.; visualization, X.S.; supervision, H.H.; project administration, H.H.; funding acquisition, H.H. All authors have read and agreed to the published version of the manuscript.
Funding
This research was funded by National Natural Science Foundation of China, grant number 72091512.
Institutional Review Board Statement
Not applicable.
Informed Consent Statement
Not applicable.
Data Availability Statement
The authors declare that the data supporting the findings of this study are available within the article.
Conflicts of Interest
The authors declare no conflict of interest.
References
- Chen, J.; Zhao, Y.; Bi, Y.; Li, C.; Kong, D.; Lu, S. Effect of initial pressure on the burning behavior of ethanol pool fire in the closed pressure vessel. Process Saf. Environ. Prot. 2021, 153, 159–166. [Google Scholar] [CrossRef]
- Liu, C.X. Effects of Ullage Height on Burning Behaviors of Pool Fires. Ph.D. Thesis, University of Science and Technology of China, Hefei, China, 2021. [Google Scholar]
- Lin, Y.J. Investigation of Flame Geometry and Downstream Heat Flux Evolution of Pool Fires under Cross FLOW and inclined Surface. Ph.D. Thesis, University of Science and Technology of China, Hefei, China, 2021. [Google Scholar]
- Kuang, C. Investigation into Burning Rate, Heat Feedback Mechanisms and Radiation Properties of Pool Fire in Cross Flow. Ph.D. Thesis, University of Science and Technology of China, Hefei, China, 2021. [Google Scholar]
- Li, Y.T.; Huang, H. Experimental and Model Study on the Spread and Burning Behavior of Liquid Fuel Spill Fires. Ph.D. Thesis, Tsinghua University, Beijing, China, 2015. [Google Scholar]
- Li, Y.T.; Xu, D.; Huang, H.; Zhao, J.; Shuai, J. An experimental study on the burning rate of a continuously released n-heptane spill fire on an open water surface. J. Loss Prev. Process Ind. 2020, 63, 104033. [Google Scholar] [CrossRef]
- Li, Y.T.; Huang, H.; Shuai, J.; Zhao, J.; Su, B. Experimental study of continuously released liquid fuel spill fires on land and water in a channel. J. Loss Prev. Process Ind. 2018, 52, 21–28. [Google Scholar] [CrossRef]
- Zhao, J.L.; Huang, H. Experimental and Model Study on the Spread and Burning Behavior of Continuous Liquid Spill Fires. Ph.D. Thesis, Tsinghua University, Beijing, China, 2018. [Google Scholar]
- Zhao, J.L.; Huang, H.; Jomaas, G.; Zhong, M.; Ji, Y. Spread and burning behavior of continuous spill fires. Fire Saf. J. 2017, 91, 347–354. [Google Scholar] [CrossRef] [Green Version]
- Zhao, J.L.; Zhu, H.; Huang, H.; Zhong, M.; Yang, R. Experimental study on the liquid layer spread and burning behaviors of continuous heptane spill fires. Process Saf. Environ. Prot. 2019, 122, 320–327. [Google Scholar] [CrossRef]
- Zhao, J.L.; Zhu, X.; Zhang, J.; Huang, H.; Yang, R. Experimental study on the spread and burning behaviors of continuously discharge spill fires under different slopes. J. Hazard. Mater. 2020, 392, 122352. [Google Scholar] [CrossRef] [PubMed]
- Li, H.H.; Liu, X.; Liu, J.; Ge, J.; Tang, F. Spread and burning characteristics of continuous spill fires in a tunnel. Tunn. Undergr. Space Technol. 2021, 109, 103754. [Google Scholar] [CrossRef]
- Li, H.H.; Liu, J.; Ge, J. Phenomenological characteristics of continuous spill fires in a tunnel with longitudinal ventilation. Process Saf. Environ. Prot. 2020, 138, 108–116. [Google Scholar] [CrossRef]
- Liu, Q.Y. Review on liquid fuel spill fire. Sci. Technol. Eng. 2017, 17, 138–144. [Google Scholar]
- Liu, Q.Y.; Lu, Z.H.; Zhi, M.U. Study on thermal radiation model of large-scale continuously released jet fuel spill fire. J. China Univ. Pet. Ed. Nat. Sci. 2020, 44, 149–155. [Google Scholar]
- Liu, Q.Y.; Zhao, J.L.; Lv, Z.; Zhu, H.; Yang, R. Experimental study on the effect of substrate slope on continuously released heptane spill fires. J. Therm. Anal. Calorim. 2020, 140, 2497–2503. [Google Scholar] [CrossRef]
- Li, M.H.; Luo, Q.Y.; Wang, C.J.; Pan, Y. Study on unsteady combustion behavior of stationary spilling fire of n-butanol under condition of variable slope. J. Saf. Sci. Technol. 2020, 16, 5–10. [Google Scholar]
- Fay, J.A. Unusual Fire Hazard of LNG Tanker Spills. Combust. Sci. Technol. 1973, 7, 47–49. [Google Scholar] [CrossRef]
- Fay, J.A. Physical Processes in the Spread of Oil on a Water Surface. In Proceedings of the Joint Conference on Prevention and Control of Oil Spills, International Oil Pill Conference, Washington, DC, USA, 15–17 June 1971; American Petroleum Institute: Washington, DC, USA, 1971; pp. 463–467. [Google Scholar]
- Briscoe, F.; Shaw, P. Spread and evaporation of liquid. Prog. Energy Combust. Sci. 1980, 6, 127–140. [Google Scholar] [CrossRef]
- Webber, D.M. A Model for Pool Spreading and Vaporization and its Implementation in the Computer Code G*A*S*P; AEA Technology, SRD/HSE/R507; Safety and Reliability Directorate: Washington, DC, USA, 1990. [Google Scholar]
- Witlox, H.W.M. Model for Pool Spreading, Evaporation and Solution on Land and Water (PVAP)—Theory Manual, Consequence Modeling Documentation; PHAST Technical Reference; PHAST: Homberg, Germany, 2000. [Google Scholar]
- Webber, D.M. On models of spreading pools. J. Loss Prev. Process Ind. 2012, 25, 923–926. [Google Scholar] [CrossRef]
- Burgess, D.S.; Strasser, A.; Grumer, J. Diffusive burning of liquids in open trays. Fire Res. Abstr. Rev. 1961, 3, 177–192. [Google Scholar]
- Babrauskas, V. Estimating large pool fire burning rates. Fire Technol. 1983, 19, 251–261. [Google Scholar] [CrossRef]
- Benfer, M. Spill and Burning Behavior of Flammable Liquids. Master’s Thesis, University of Maryland, College Park, MD, USA, 2010. [Google Scholar]
- Mealy, C.; Benfer, M.; Gottuk, D. Fire Dynamics and Forensic Analysis of Liquid Fuel Fires; Bureau of Justice Statistics: Washington, DC, USA, 2011.
- Mealy, C.; Benfer, M.; Gottuk, D. Liquid Fuel Spill Fire Dynamics. Fire Technol. 2014, 50, 419–436. [Google Scholar] [CrossRef]
- Gottuk, D.T.; Scheffey, J.L.; Williams, F.W.; Gott, J.E.; Tabet, R.J. Optical Fire Detection (OFD) for Military Aircraft Hangars: Final Report on OFD Performance to Fuel Spill Fires and Optical Stresses; NRL/MR/6180-00-8457; Naval Research Laboratory: Washington, DC, USA, 2000. [Google Scholar]
- Hissong, D.W. Keys to modeling LNG spills on water. J. Hazard. Mater. 2007, 140, 465–477. [Google Scholar] [CrossRef] [PubMed]
Figure 1.
Experimental setup.
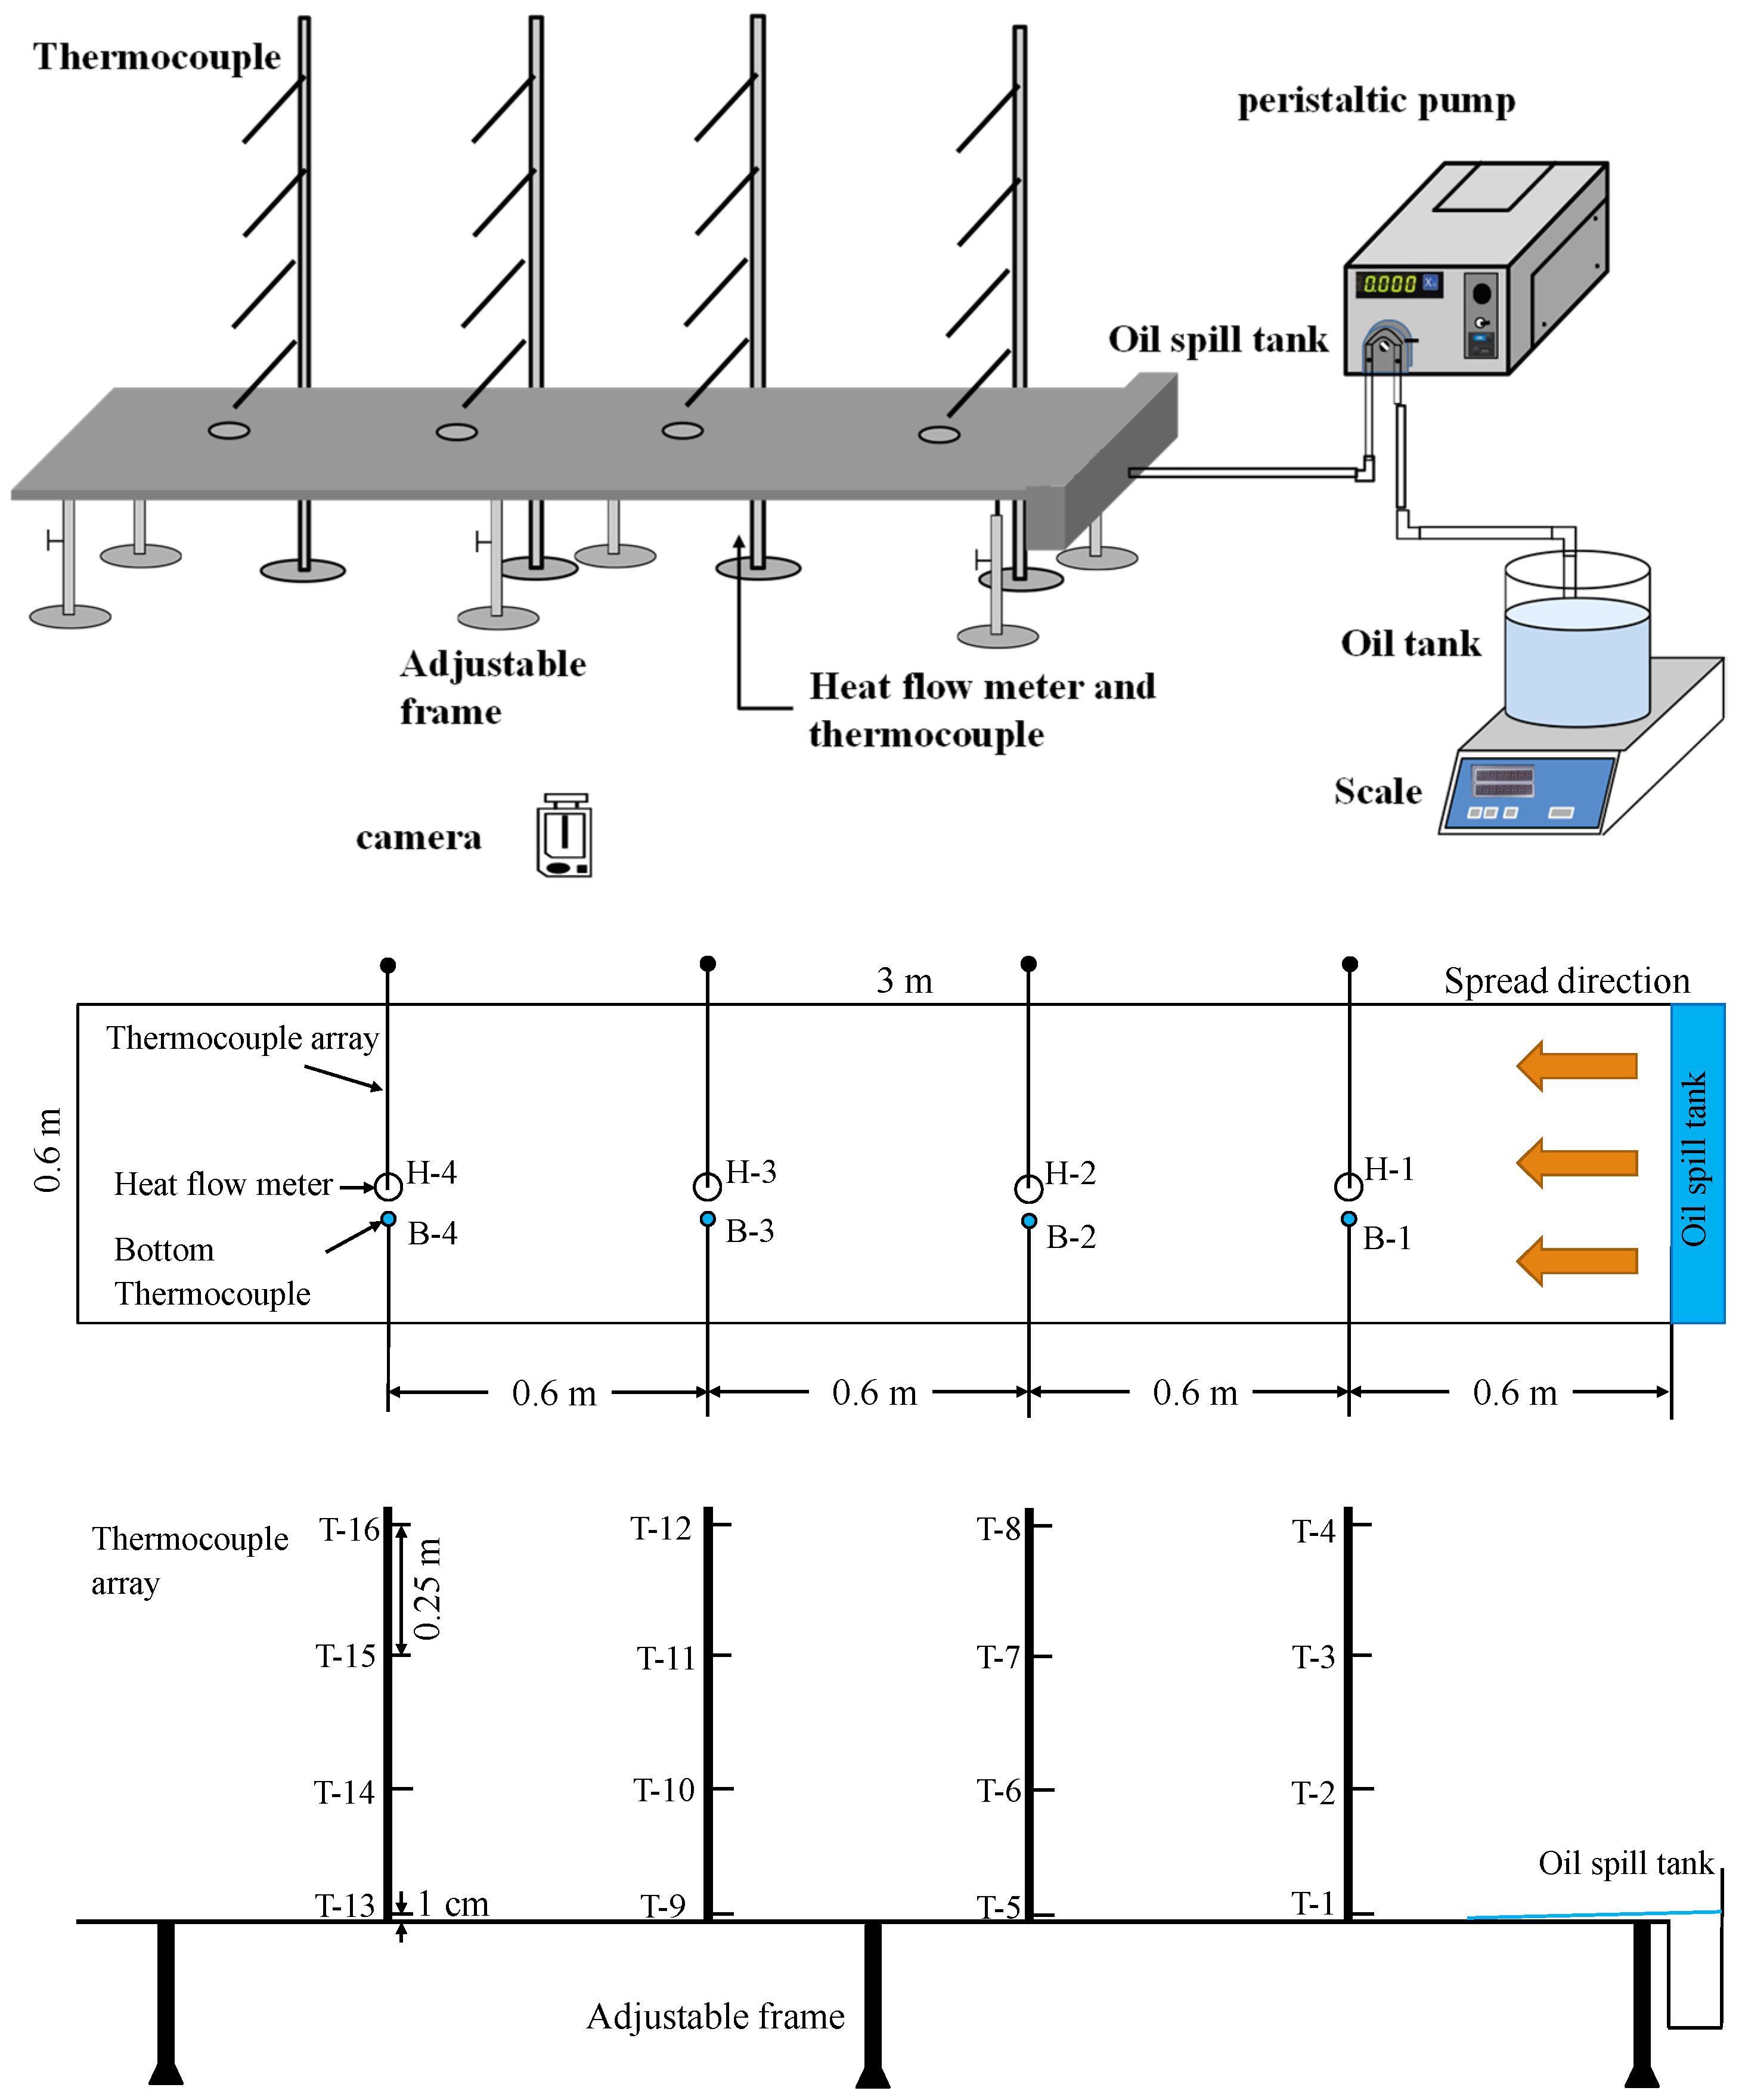
Figure 2.
A schematic diagram of the flame processing method: (a) original image, (b) binary image.
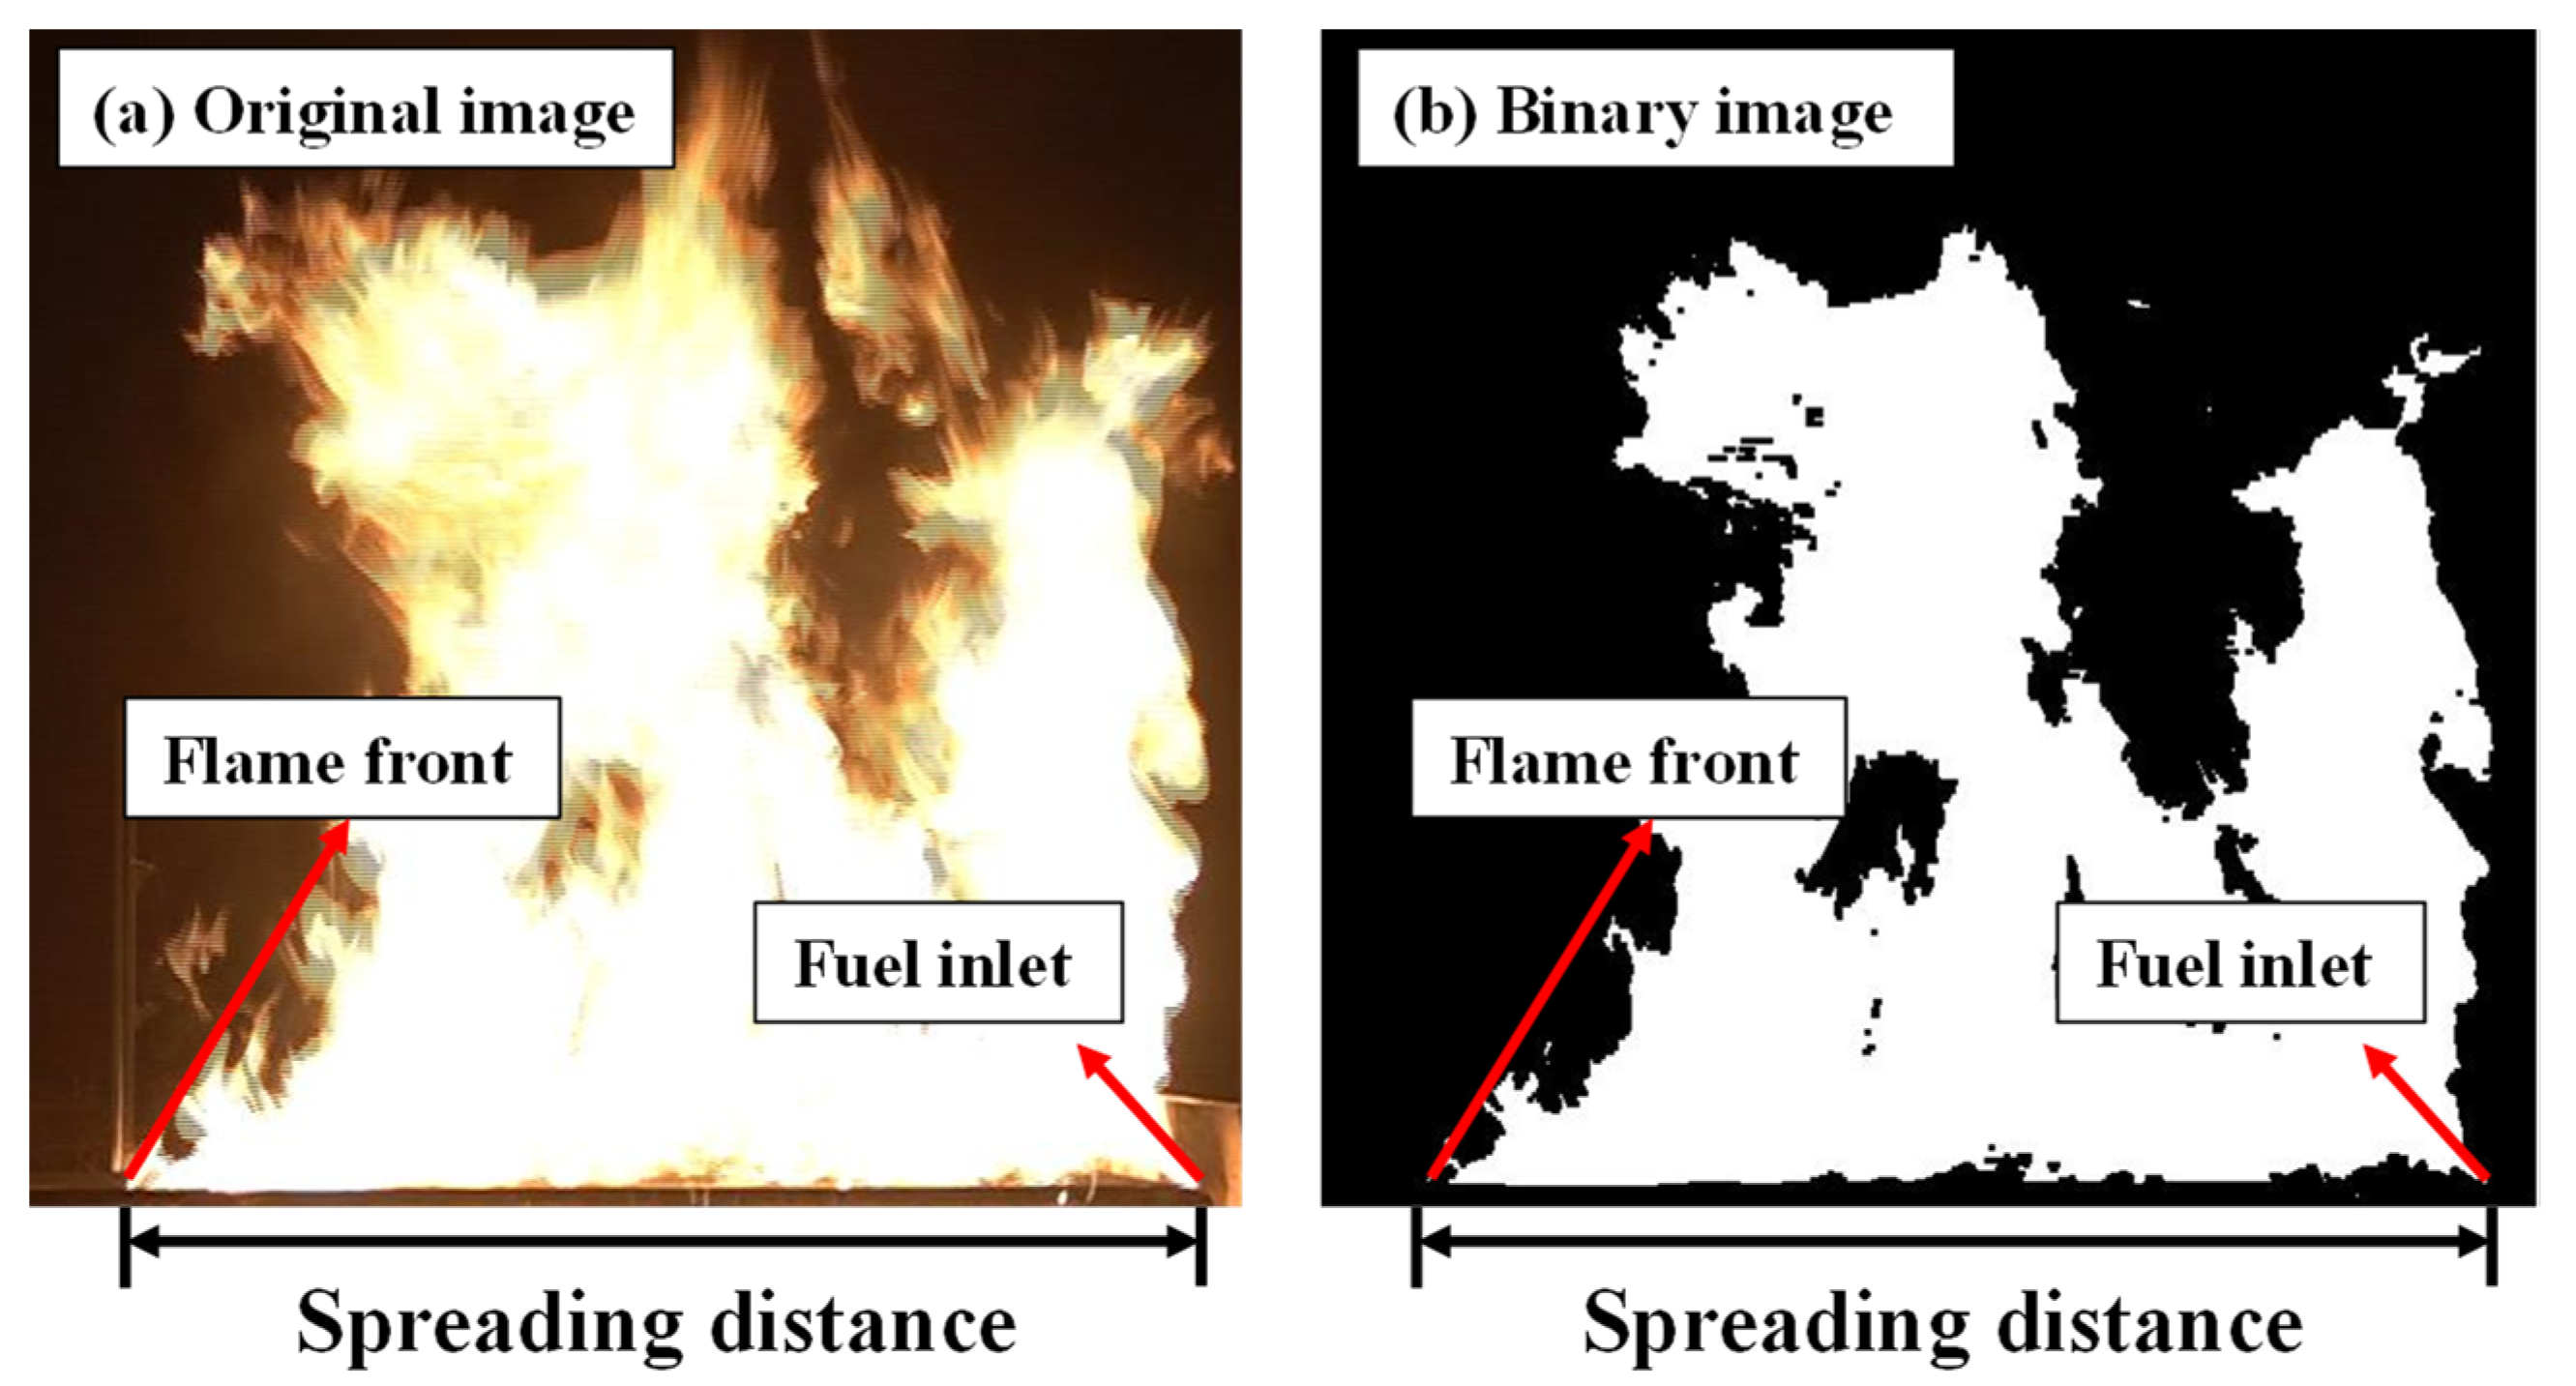
Figure 3.
Images of the spill fire at various moments.
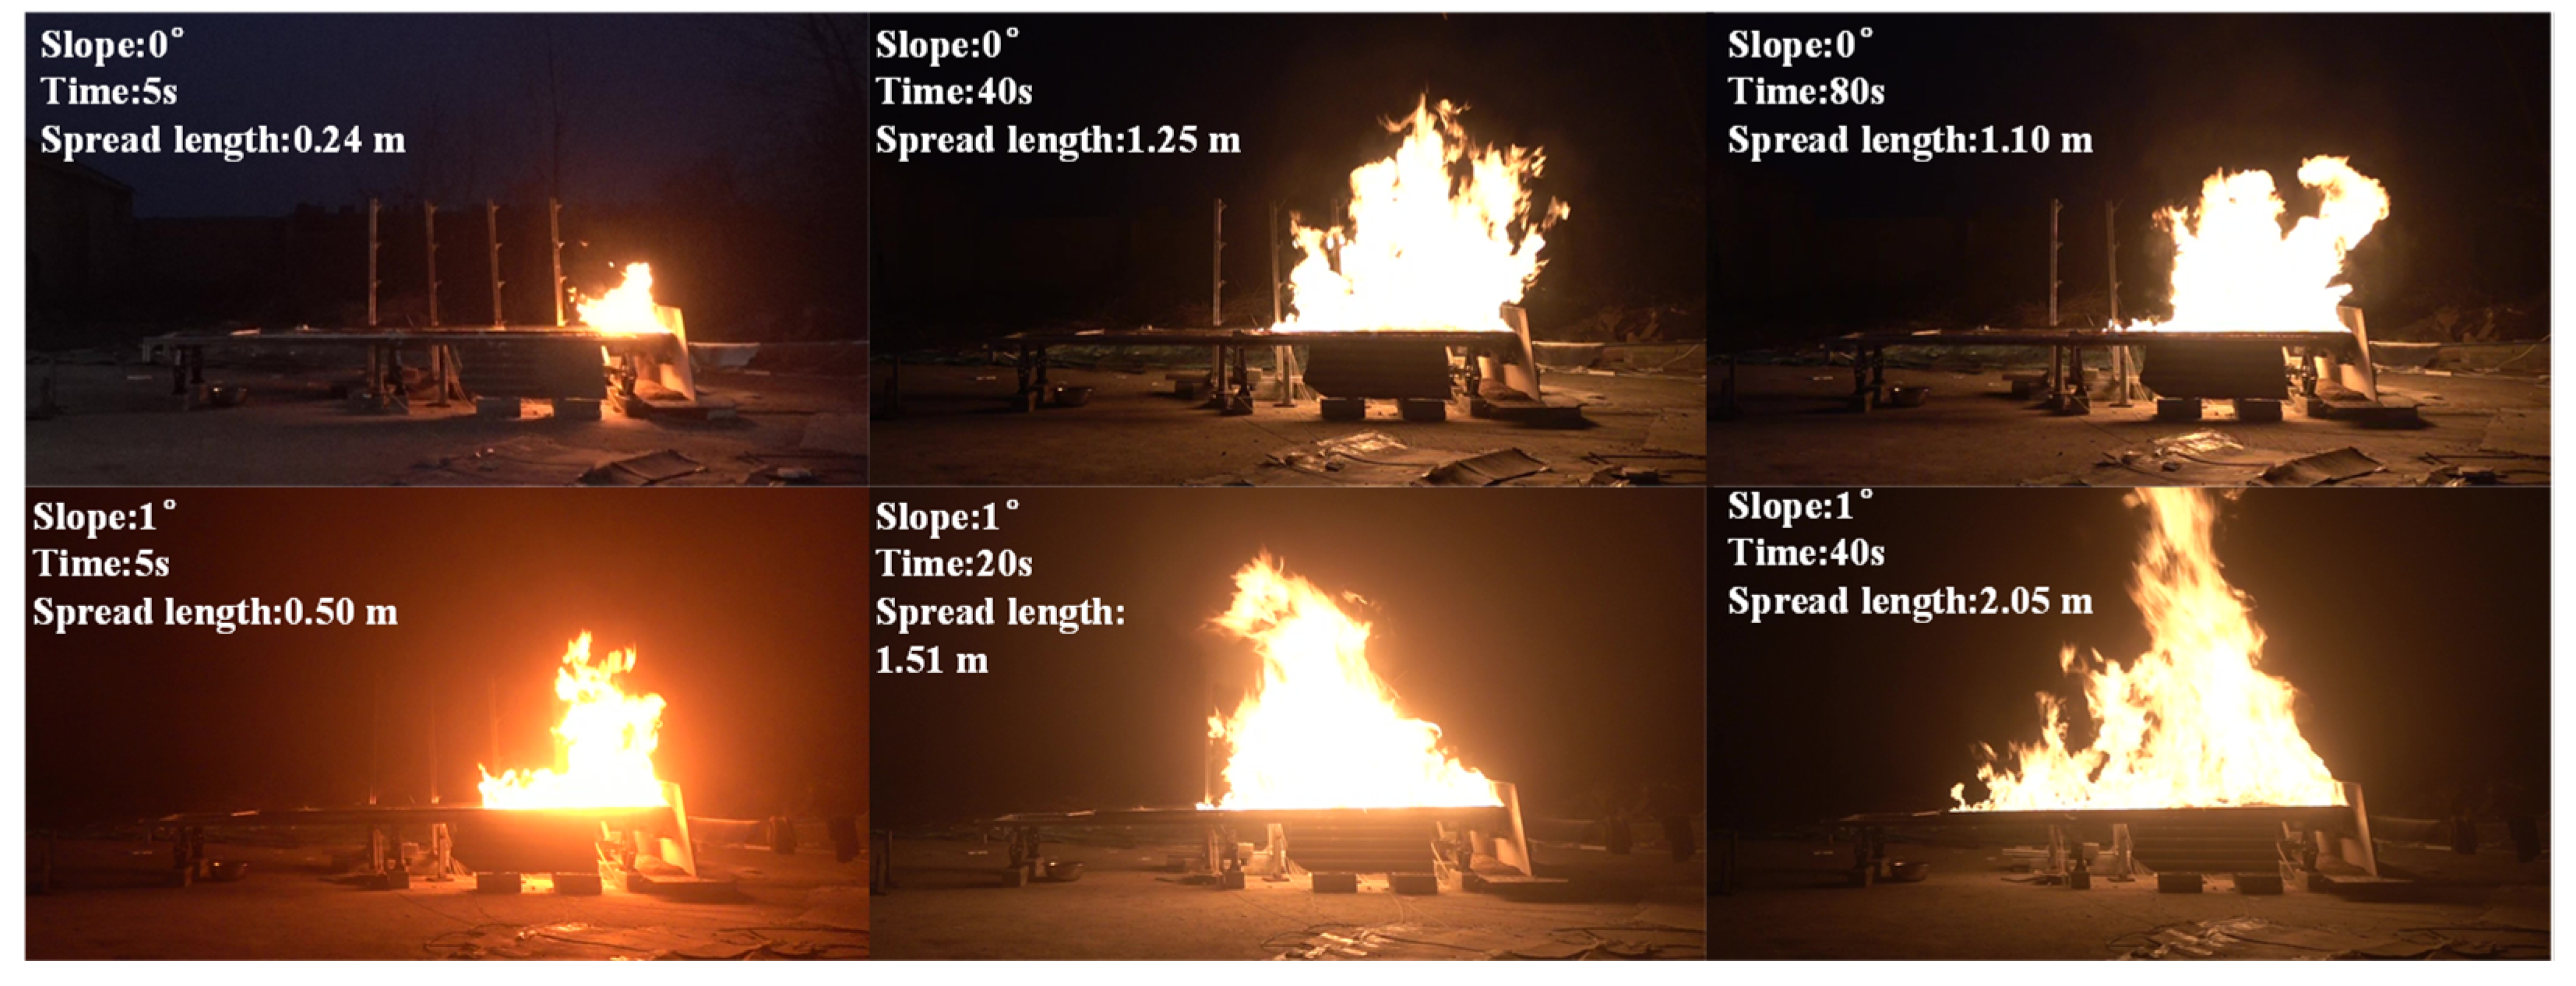
Figure 4.
Shape of the spread surface for different slopes.
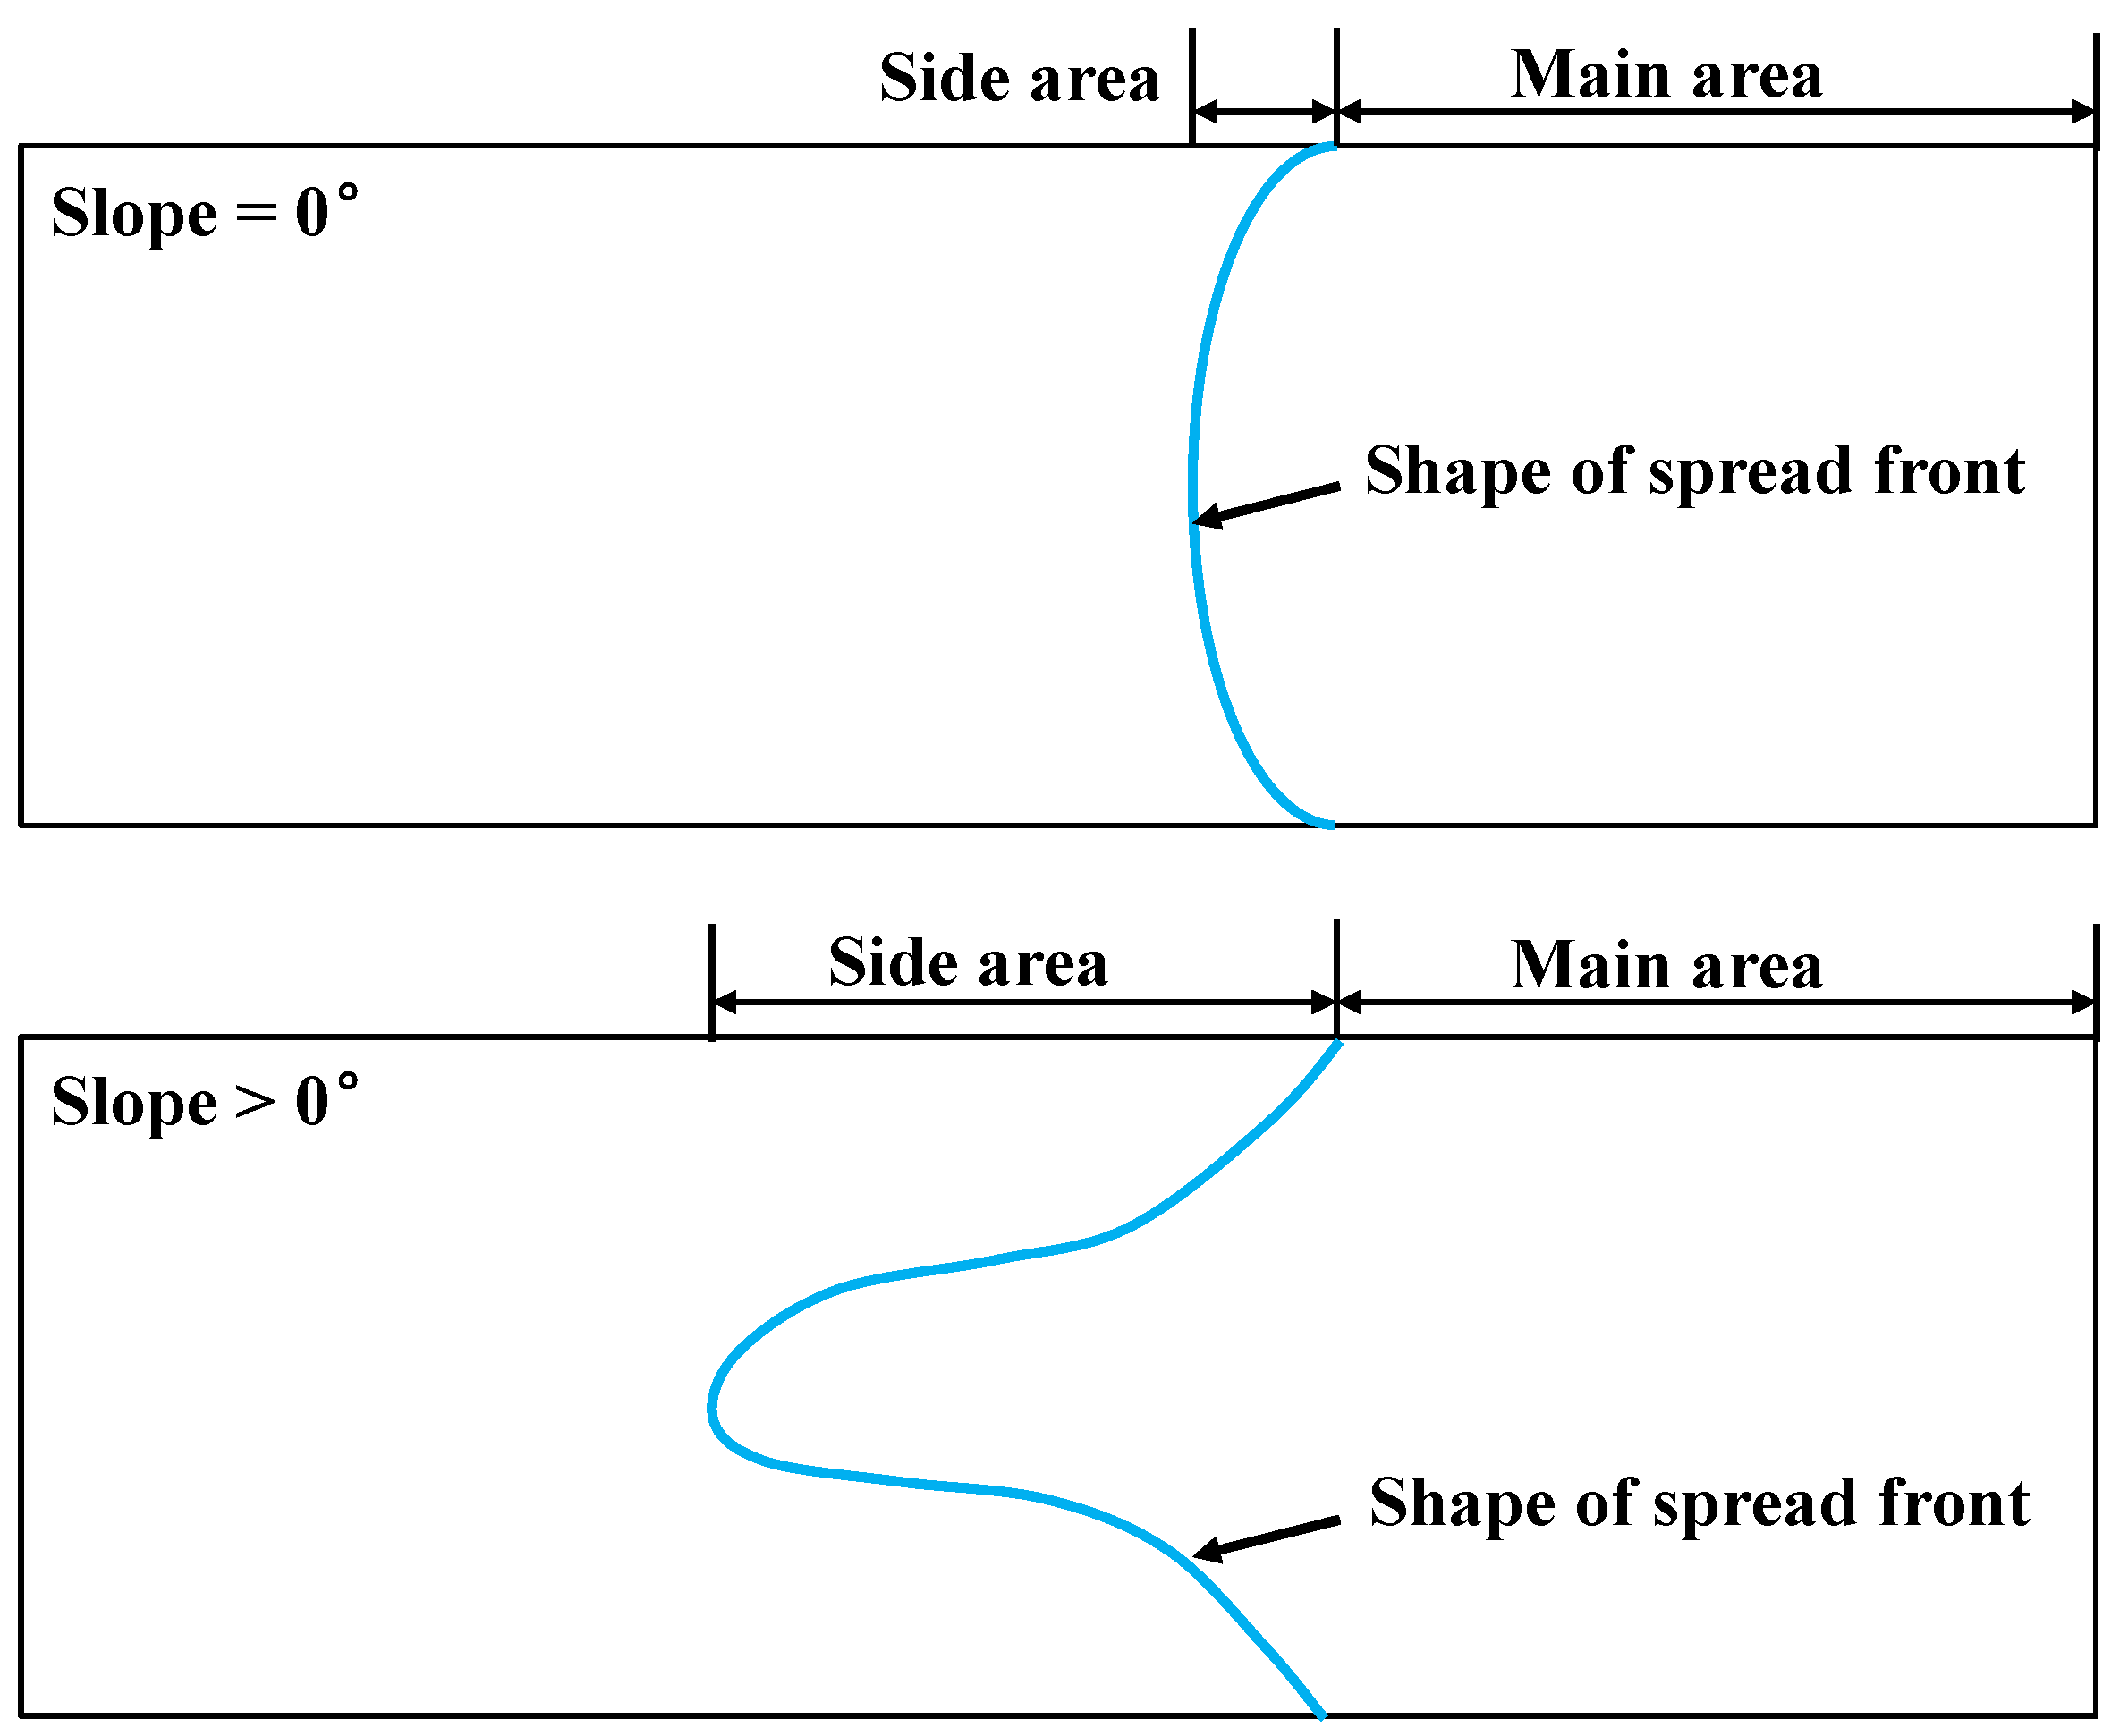
Figure 5.
Spread area over time for the same discharge rate in an n-heptane spill fire.

Figure 6.
Various physical characteristics measured by thermocouples and heat flow meters in the burning process. (a) Flame temperatures at different heights; (b) flame temperatures at different distances; (c) bottom temperature at different distances; (d) feedback radiation transmission at different distances.
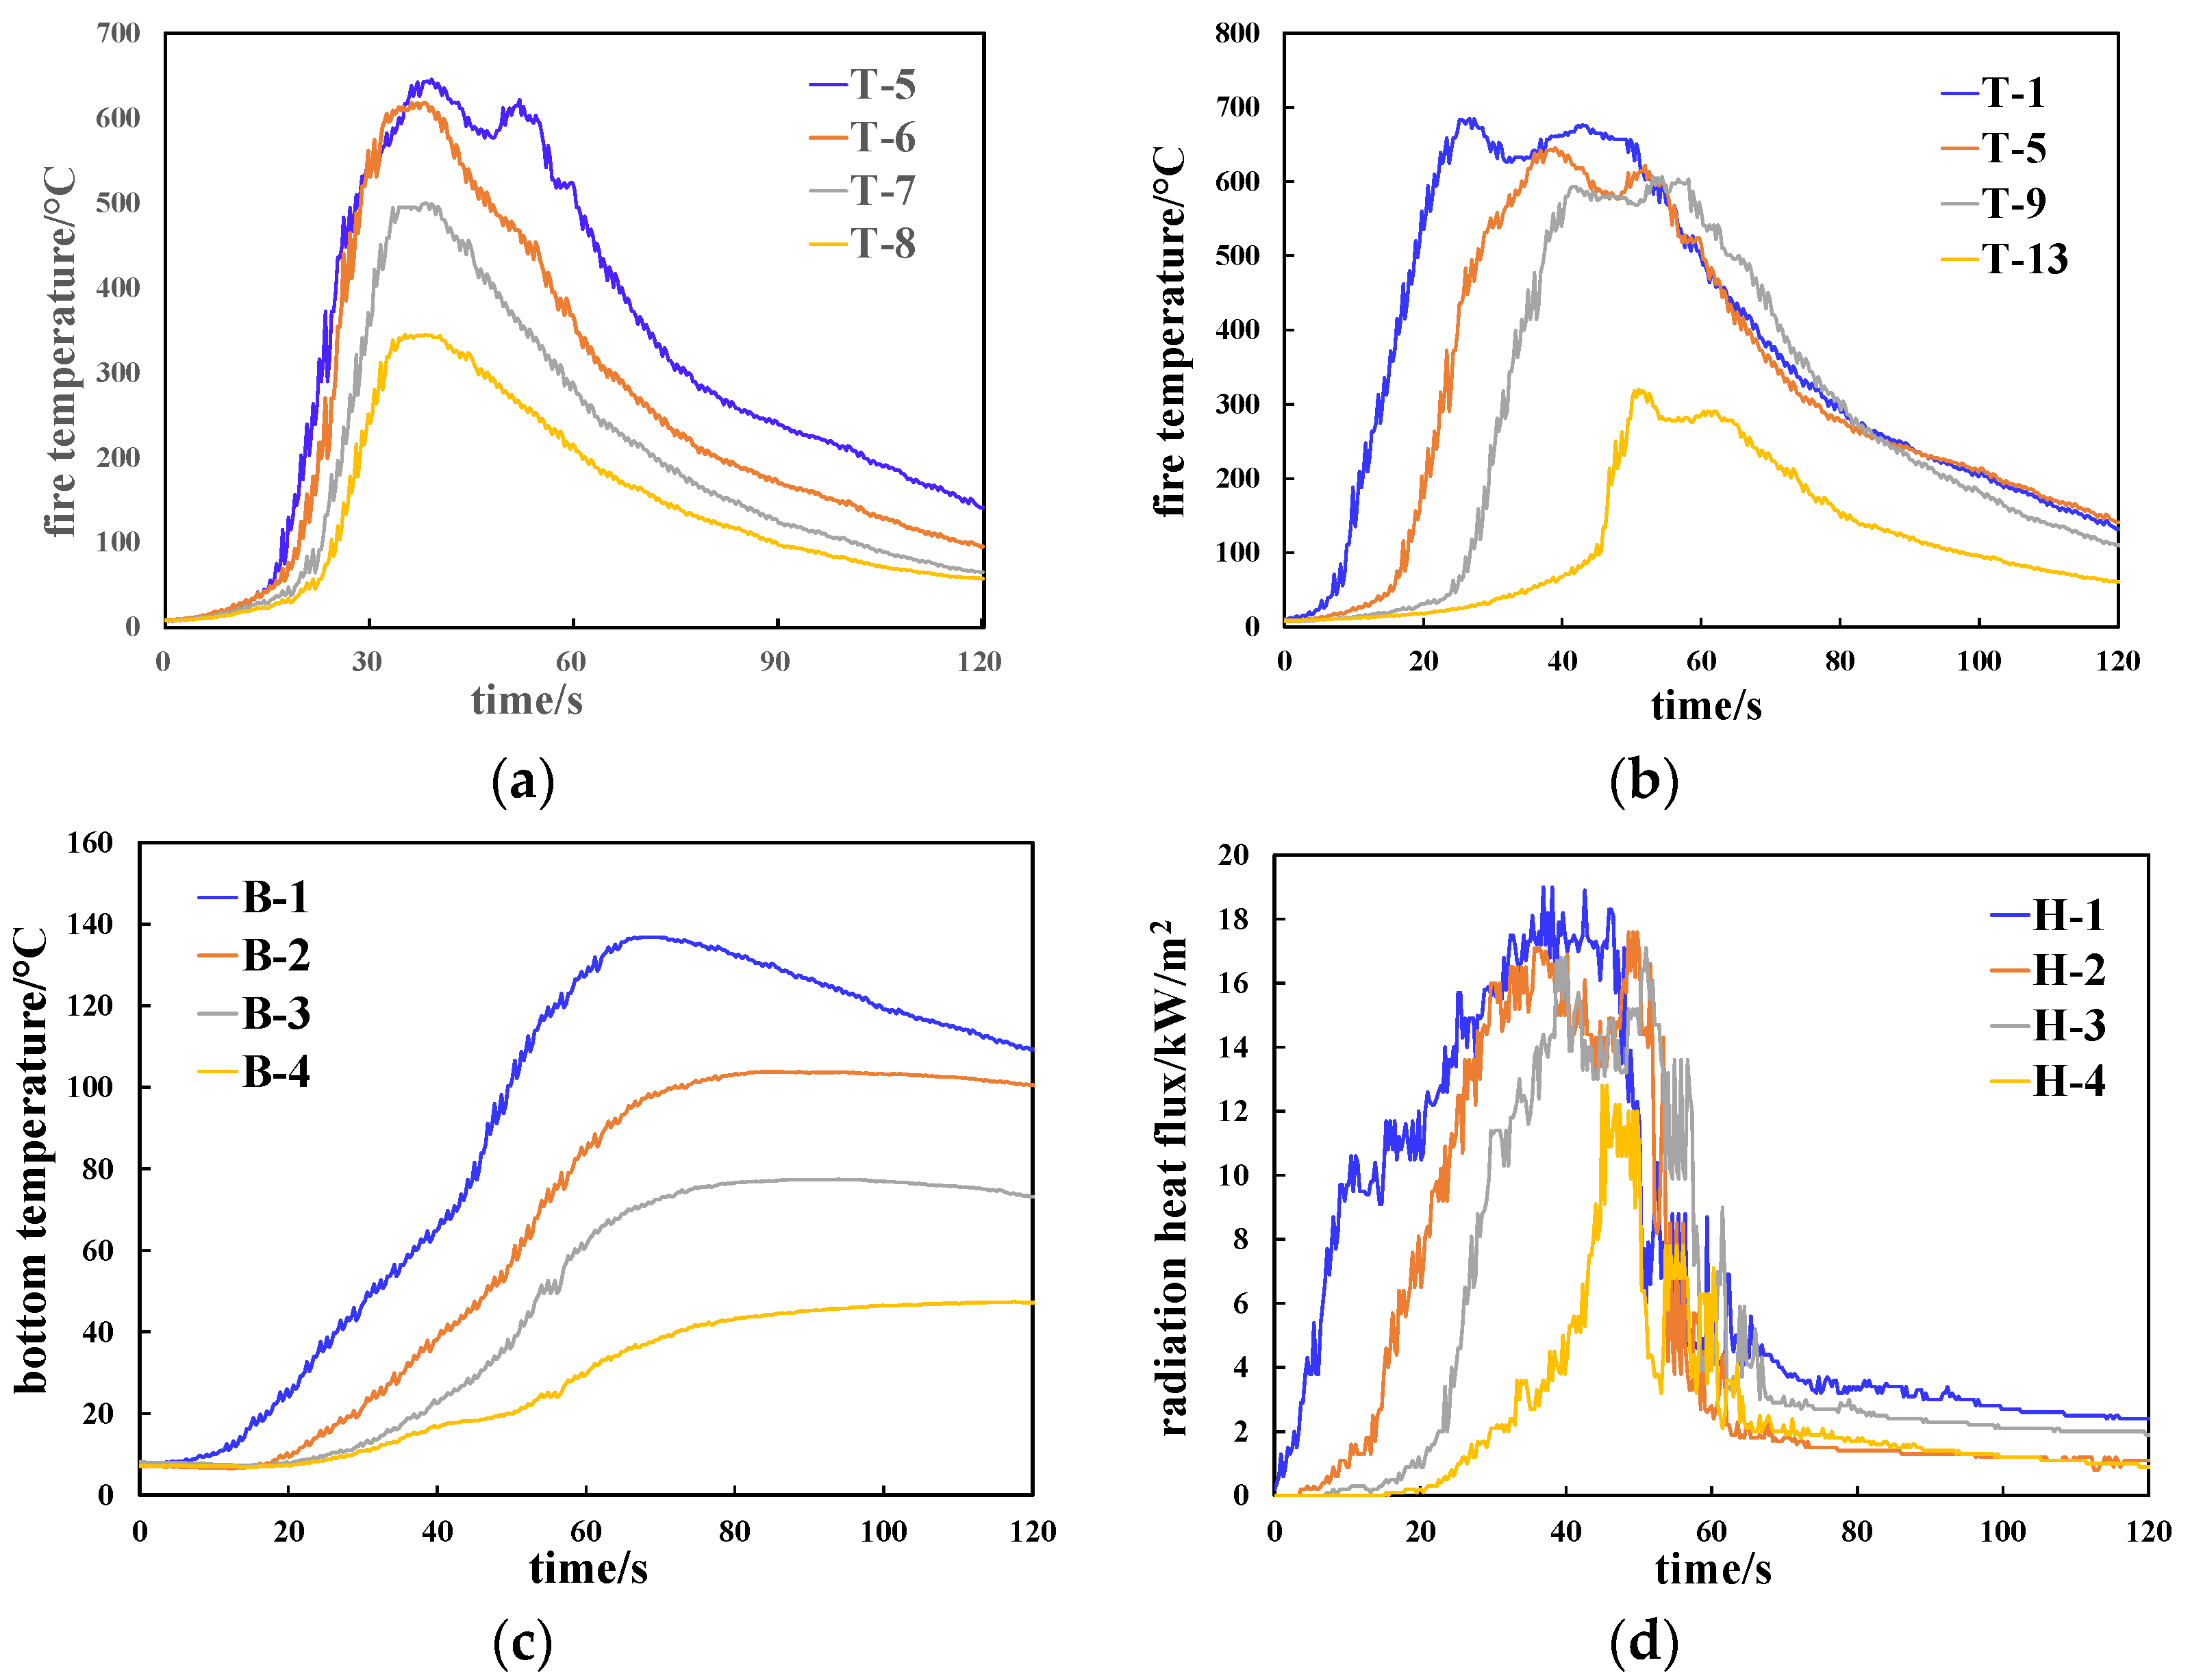
Figure 7.
Variation of flow heat transfer of an n-heptane spill fire at the bottom surface with a slope.
Figure 7.
Variation of flow heat transfer of an n-heptane spill fire at the bottom surface with a slope.
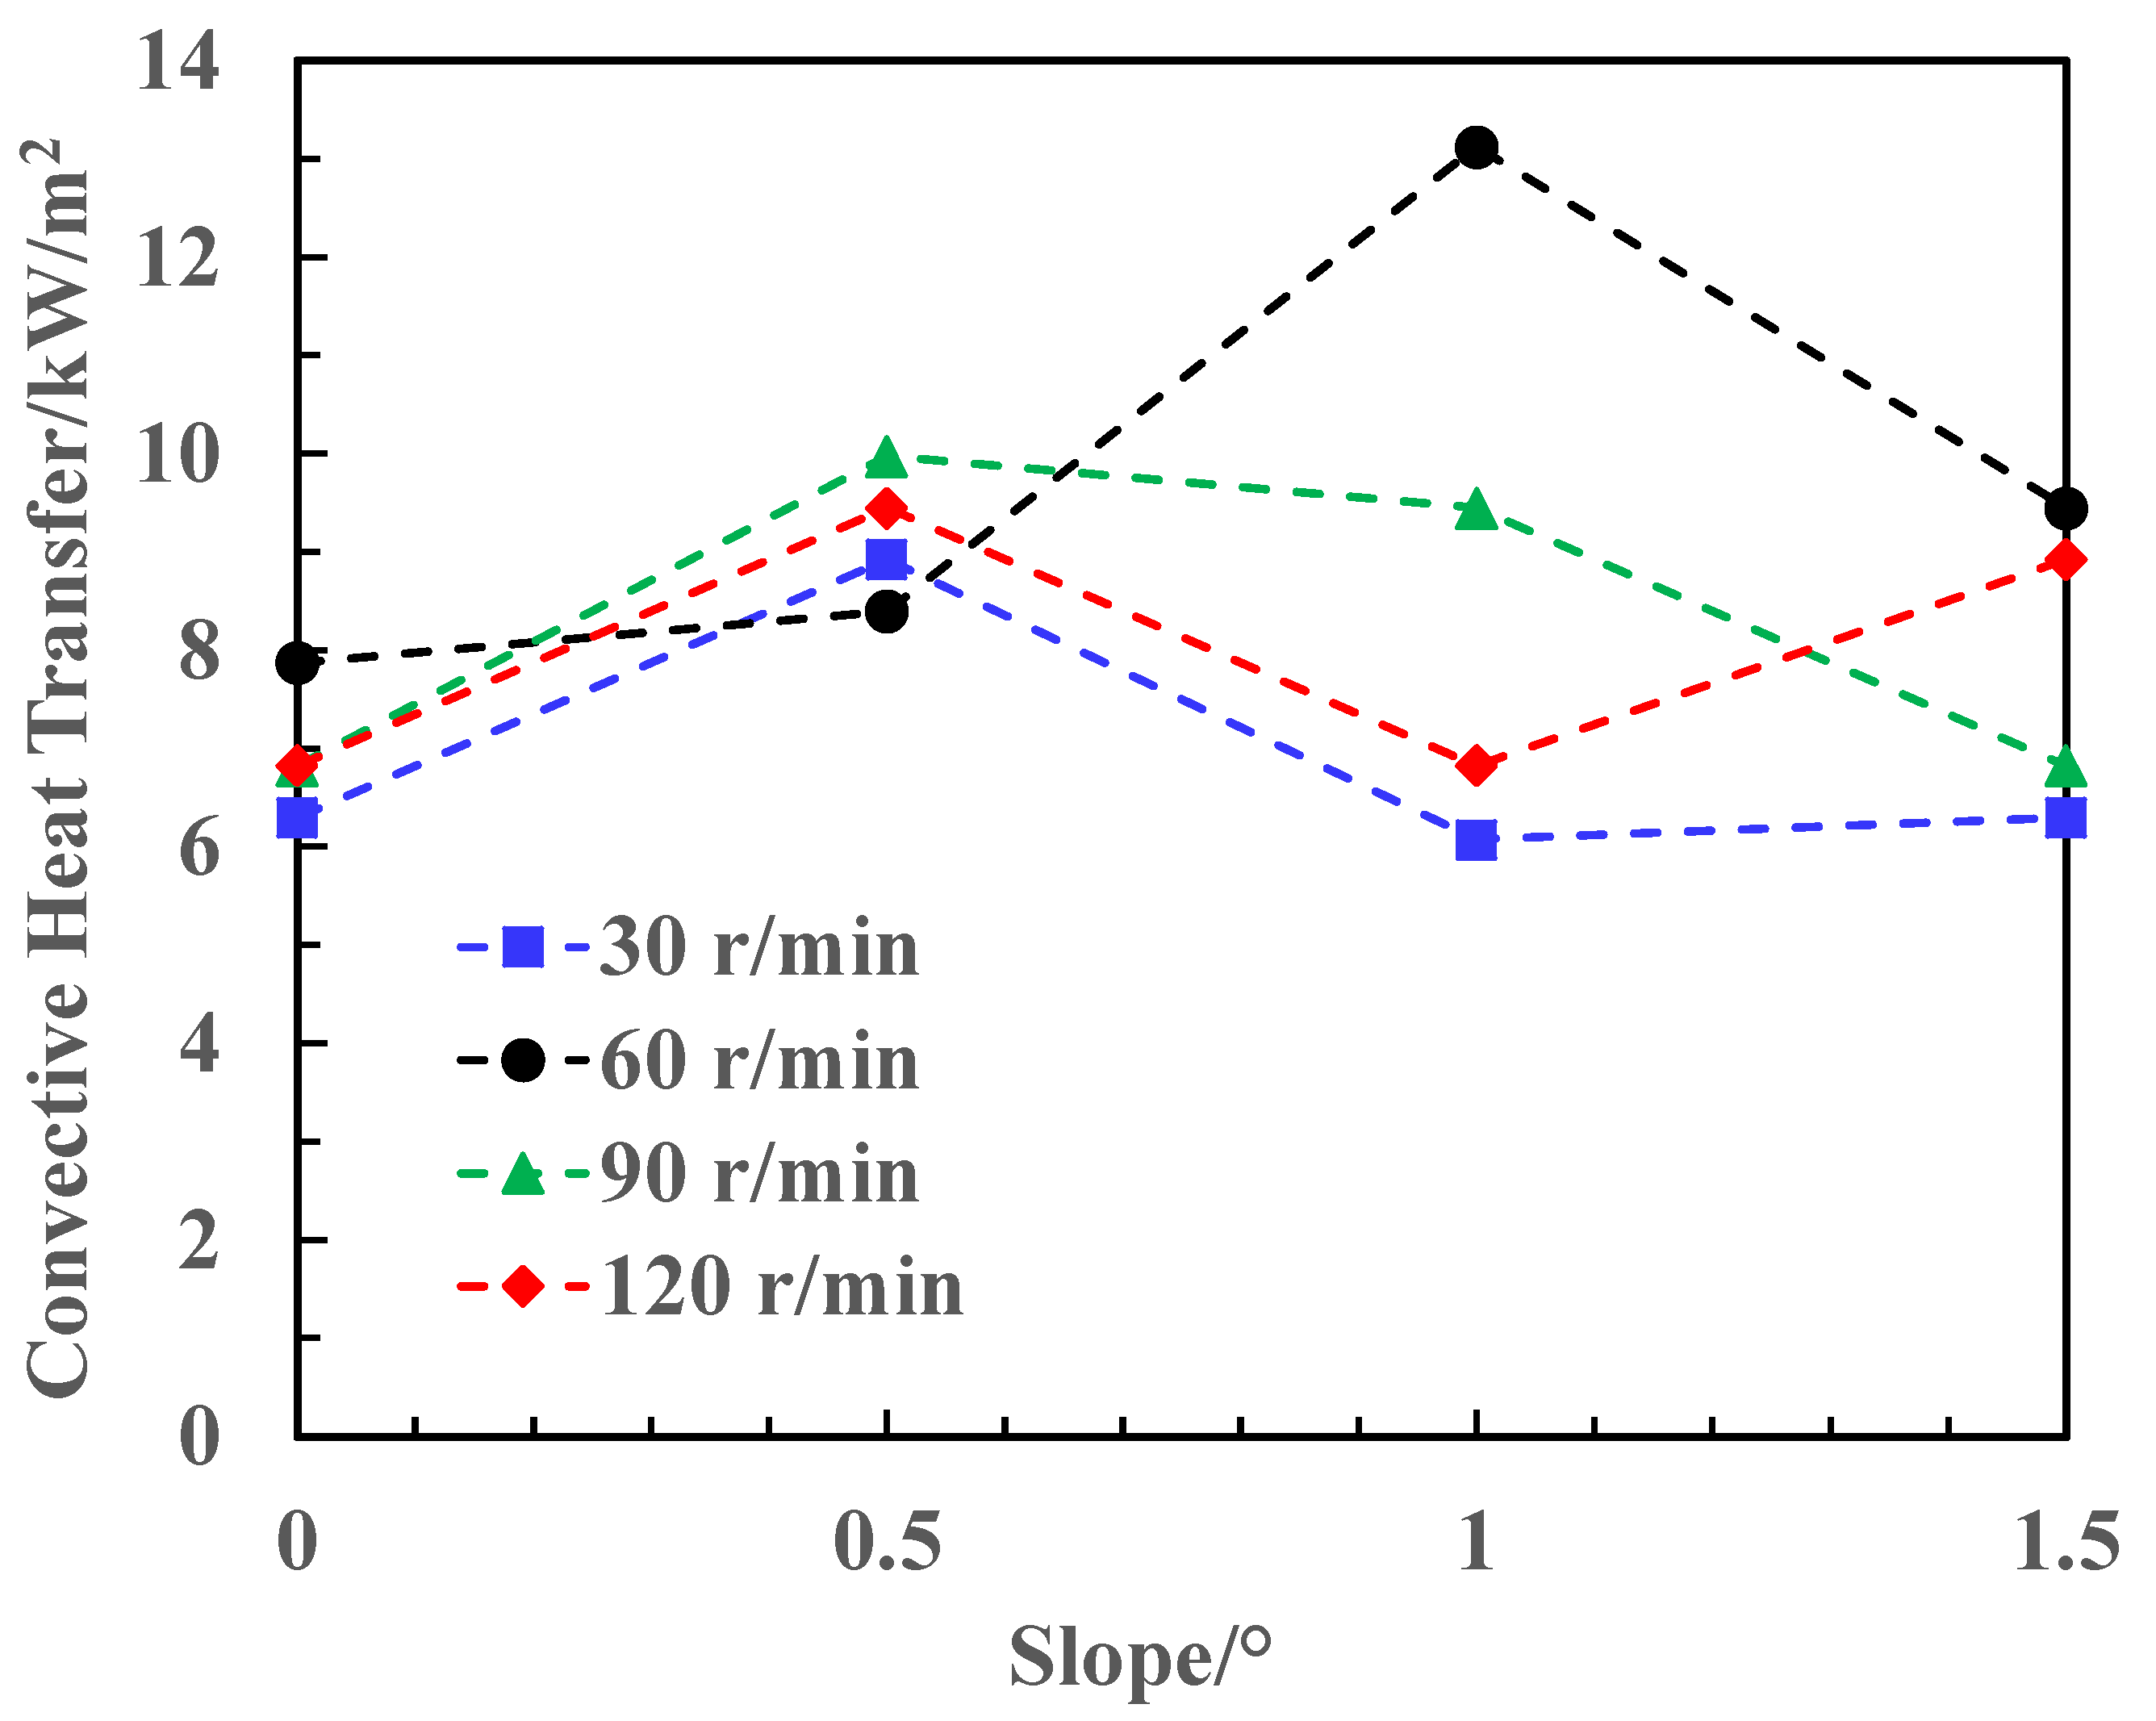
Figure 8.
Variation of n-heptane flame feedback radiation transmission with slope.
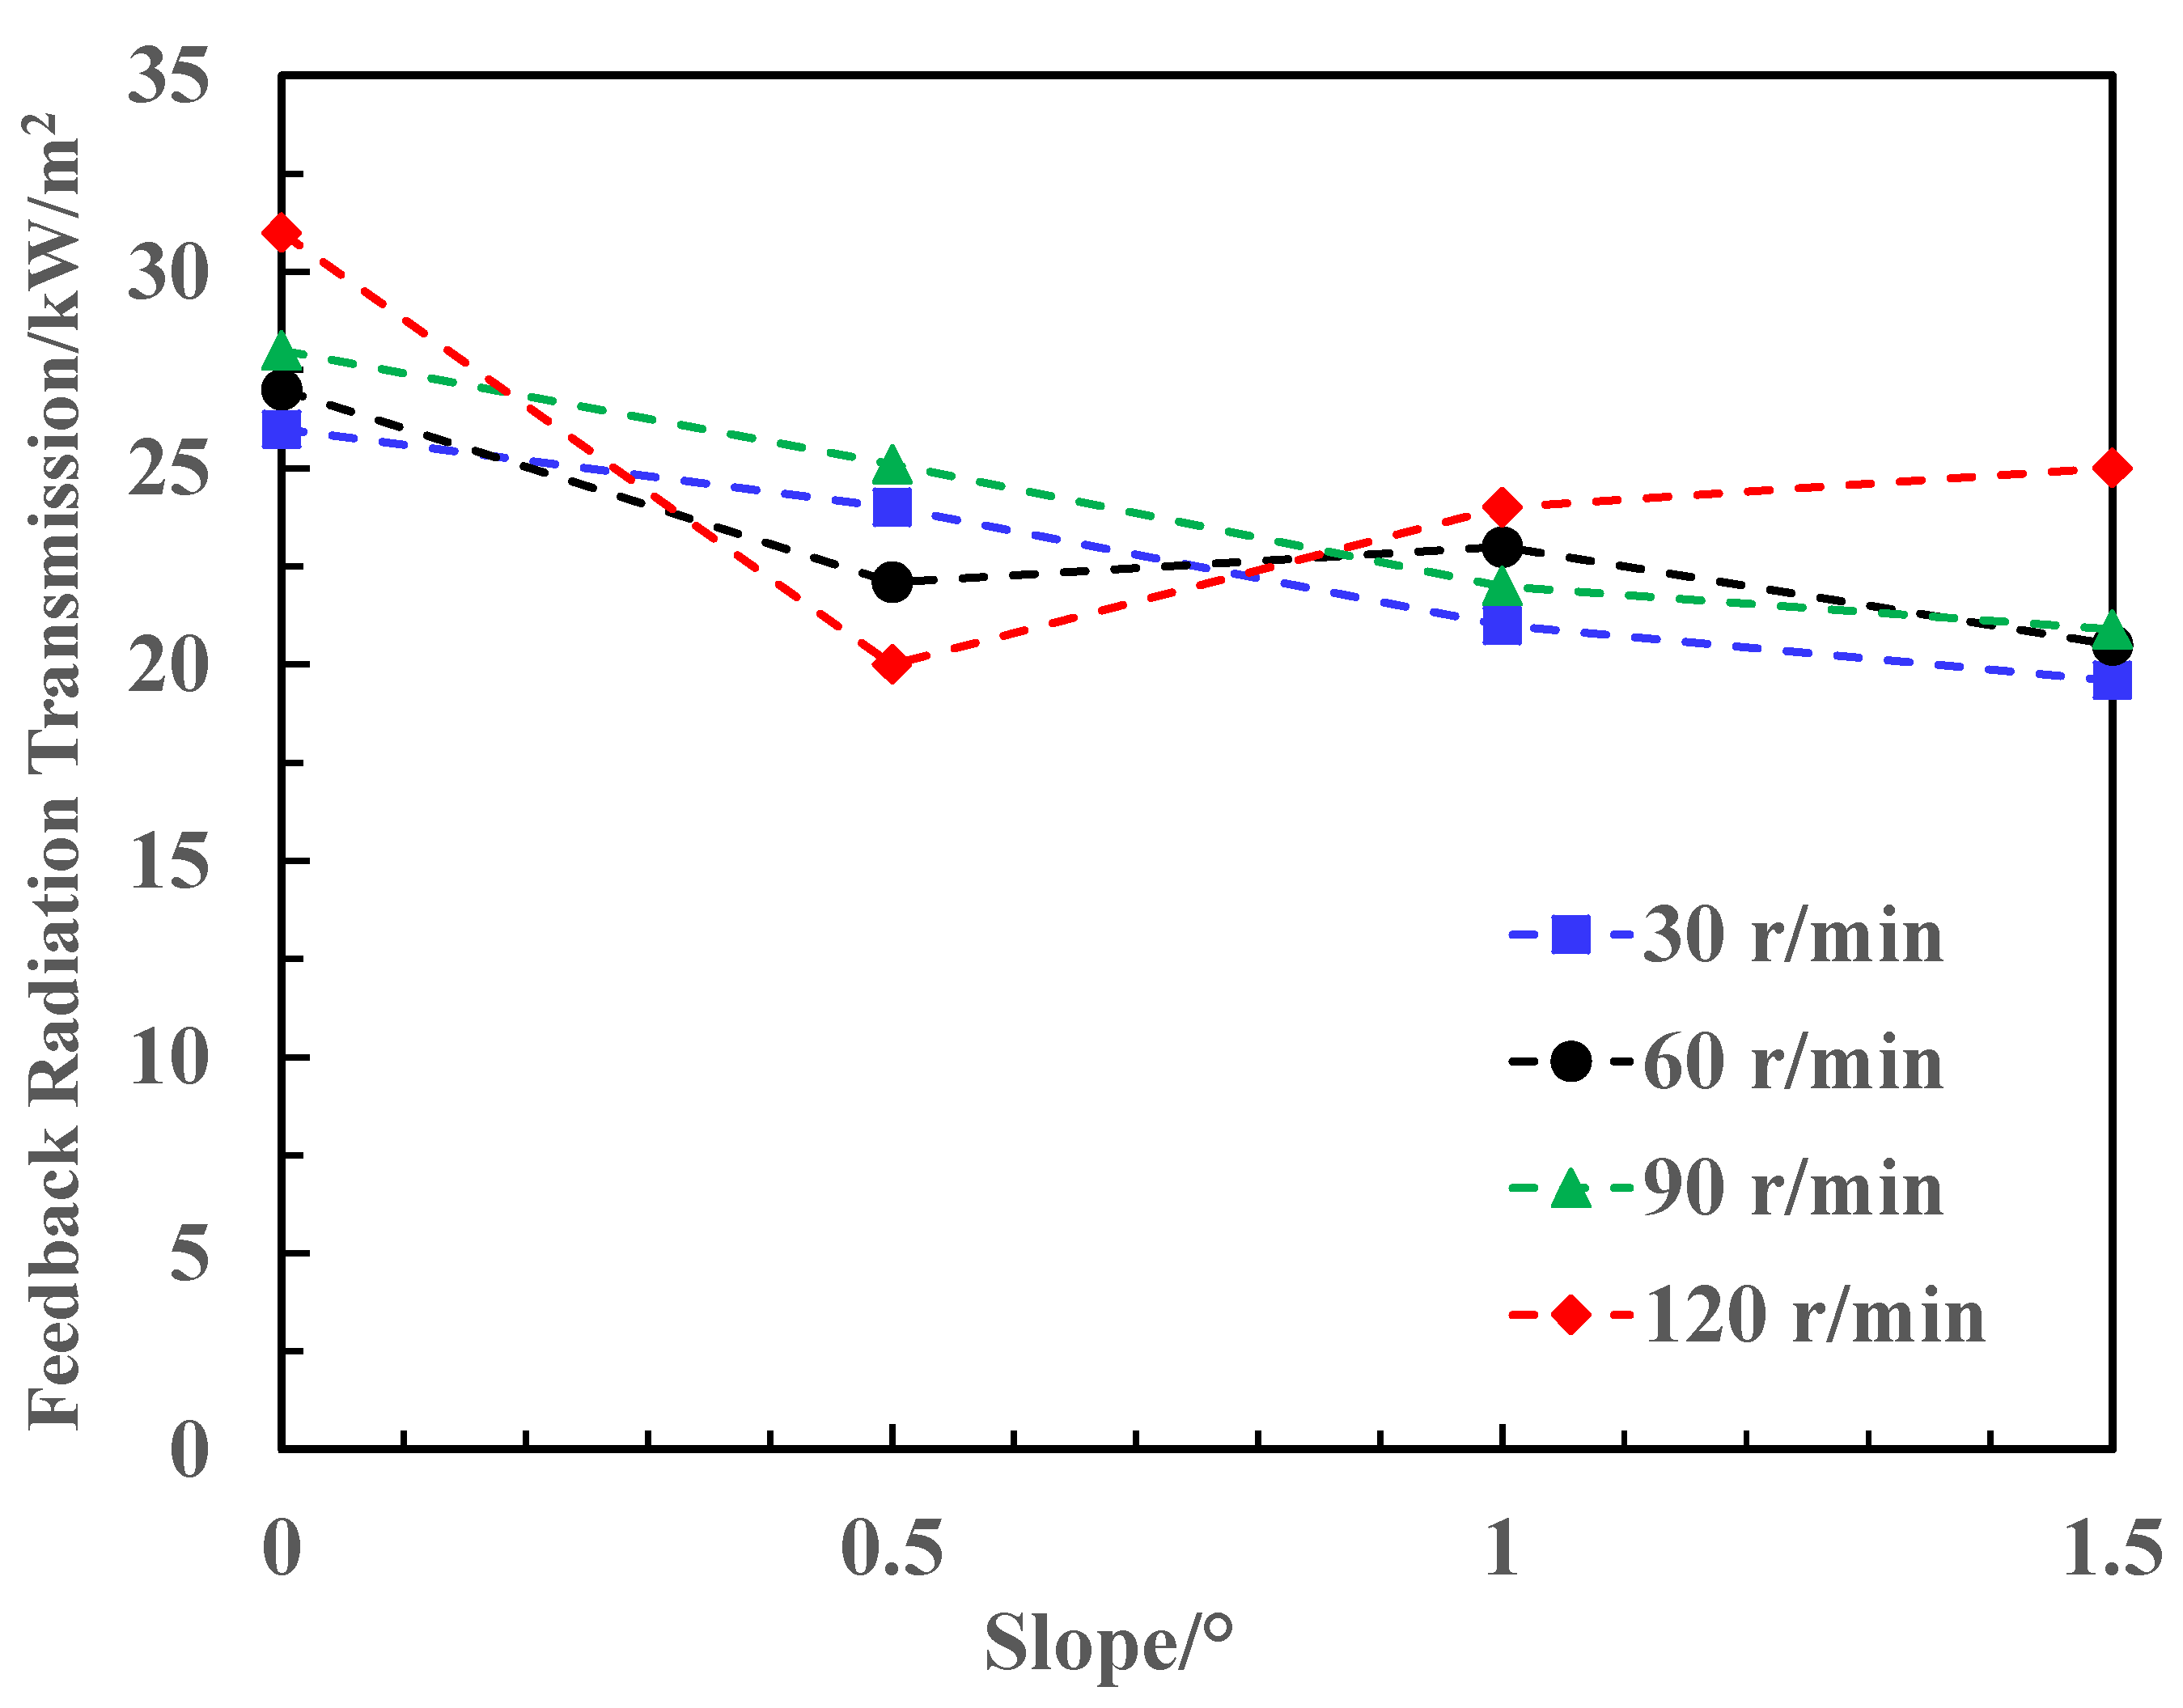
Figure 9.
Comparison of burning rate between spill fires and oil pool fires.
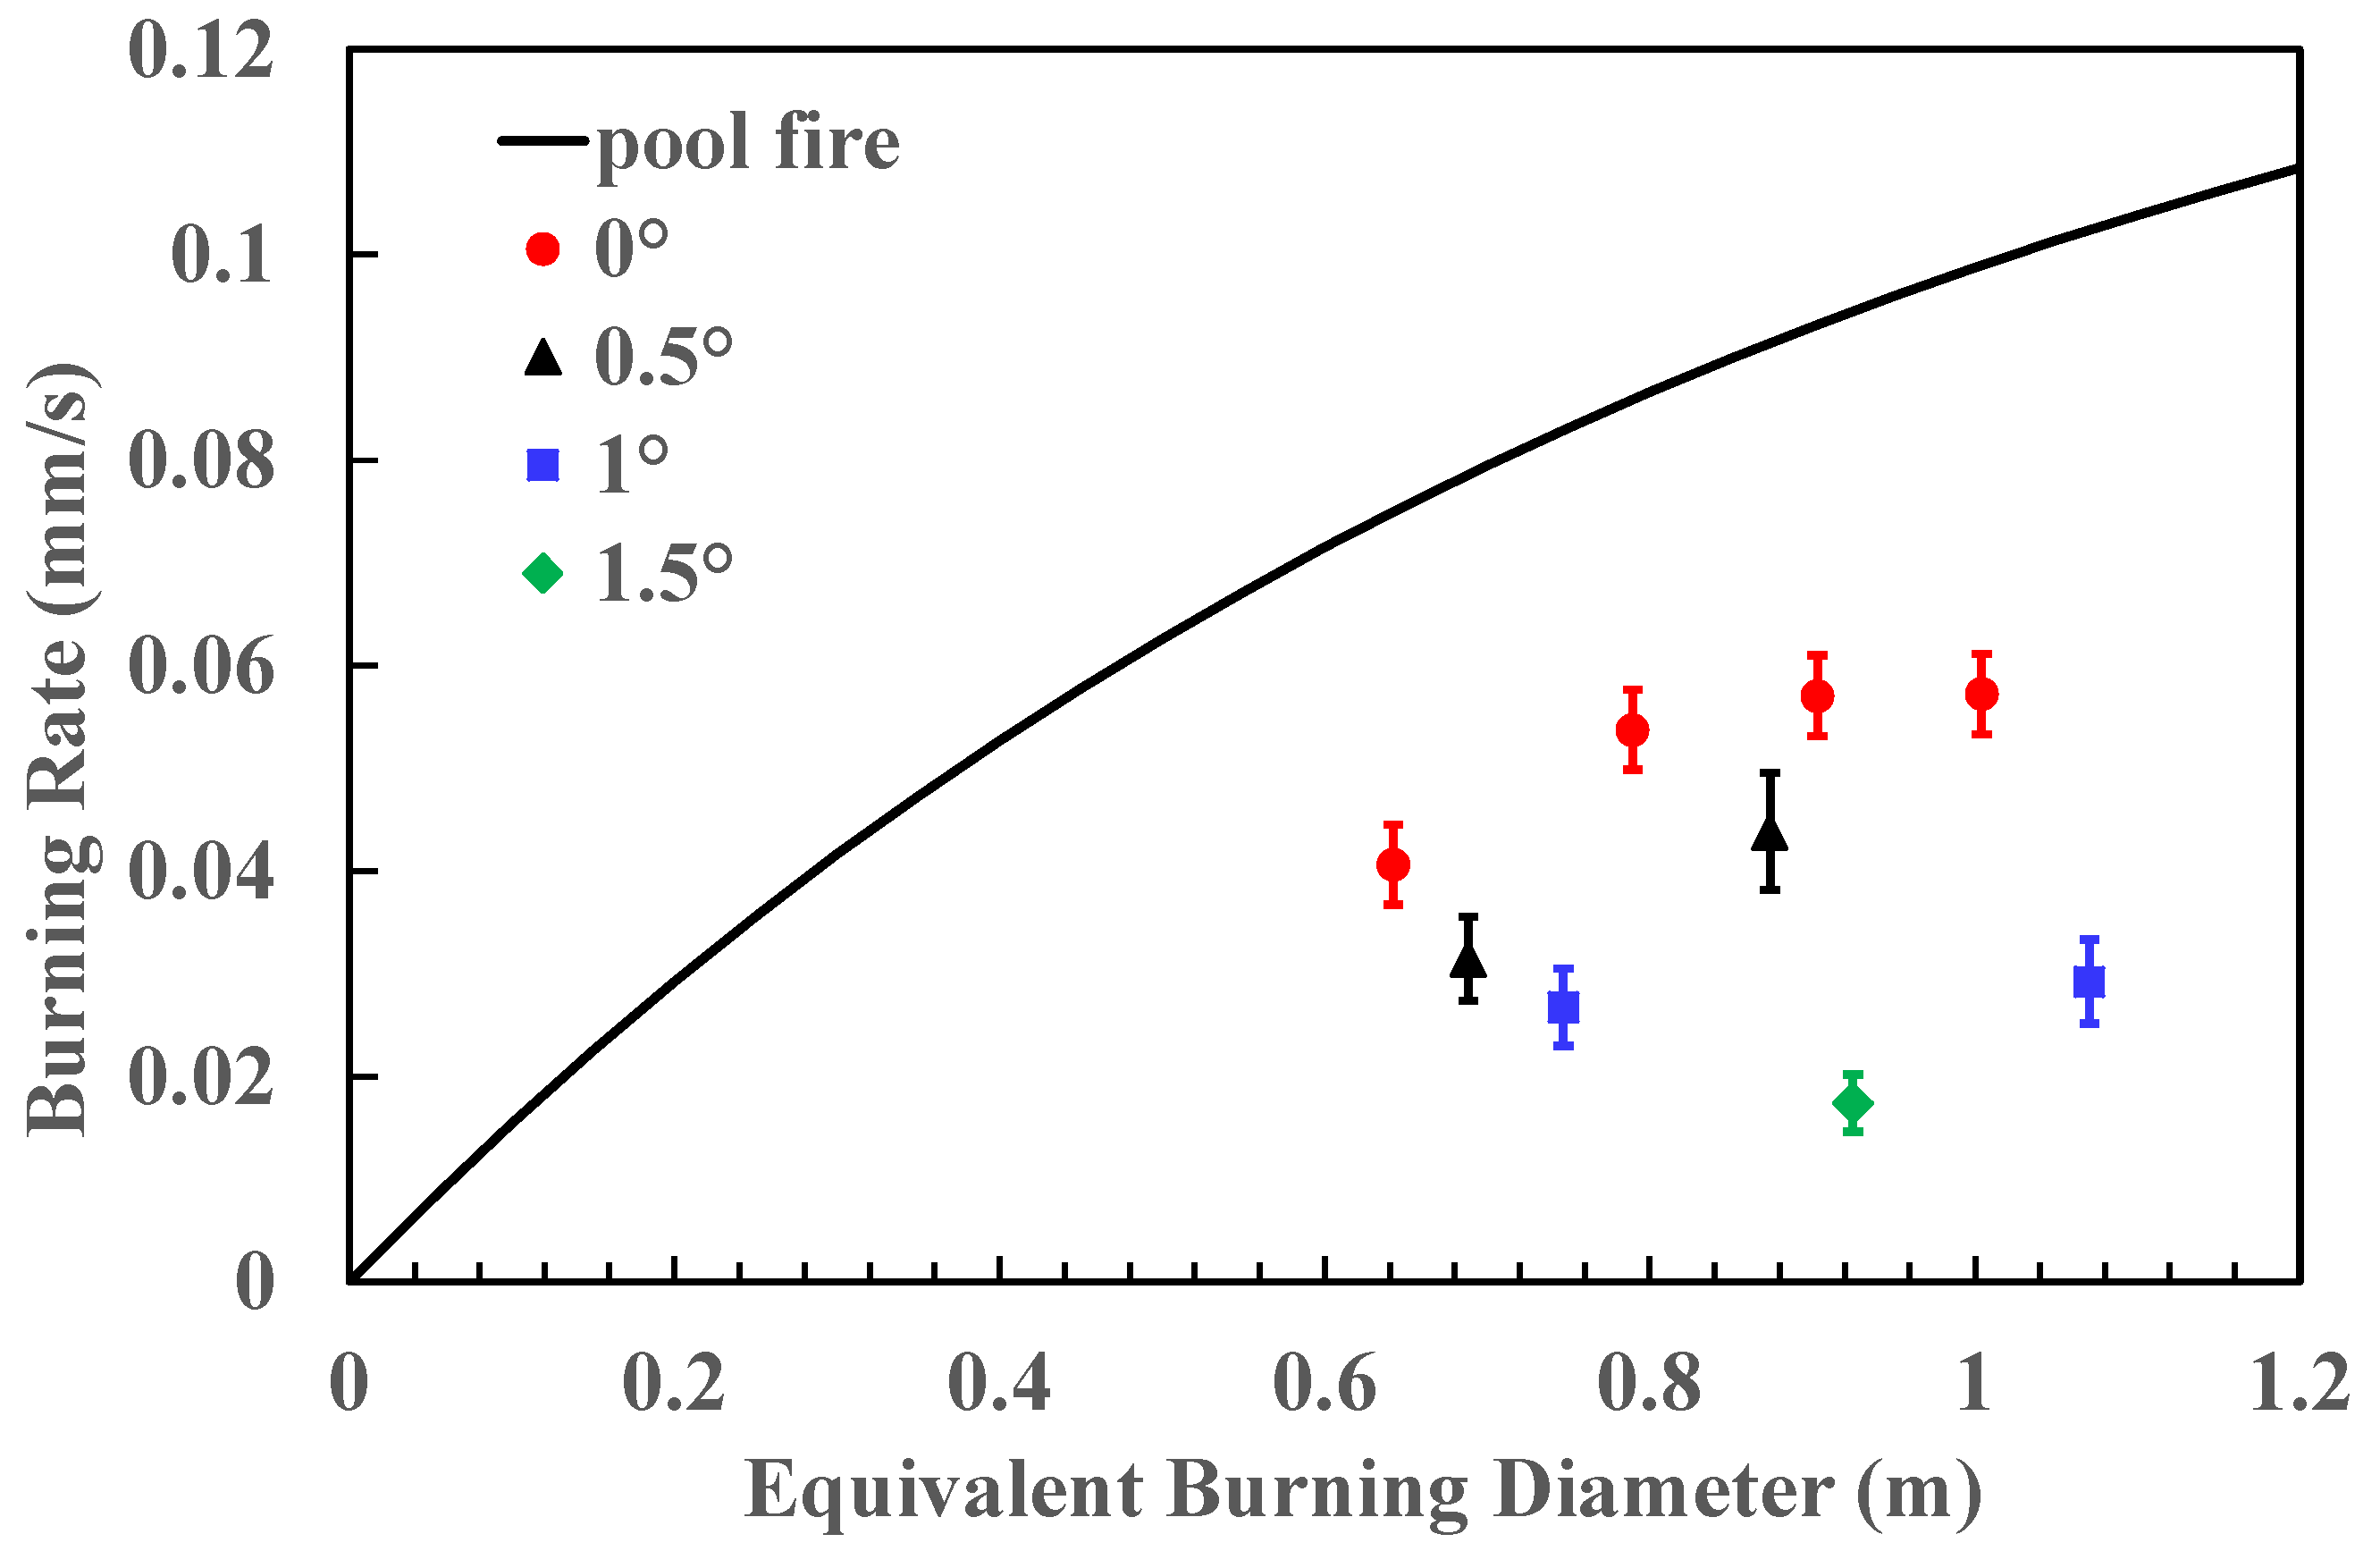
Figure 10.
Variation of the burning rate ratio of spill fires with the slope.

Figure 11.
Variation of n-heptane spread rate with a slope on a non-ignition condition.
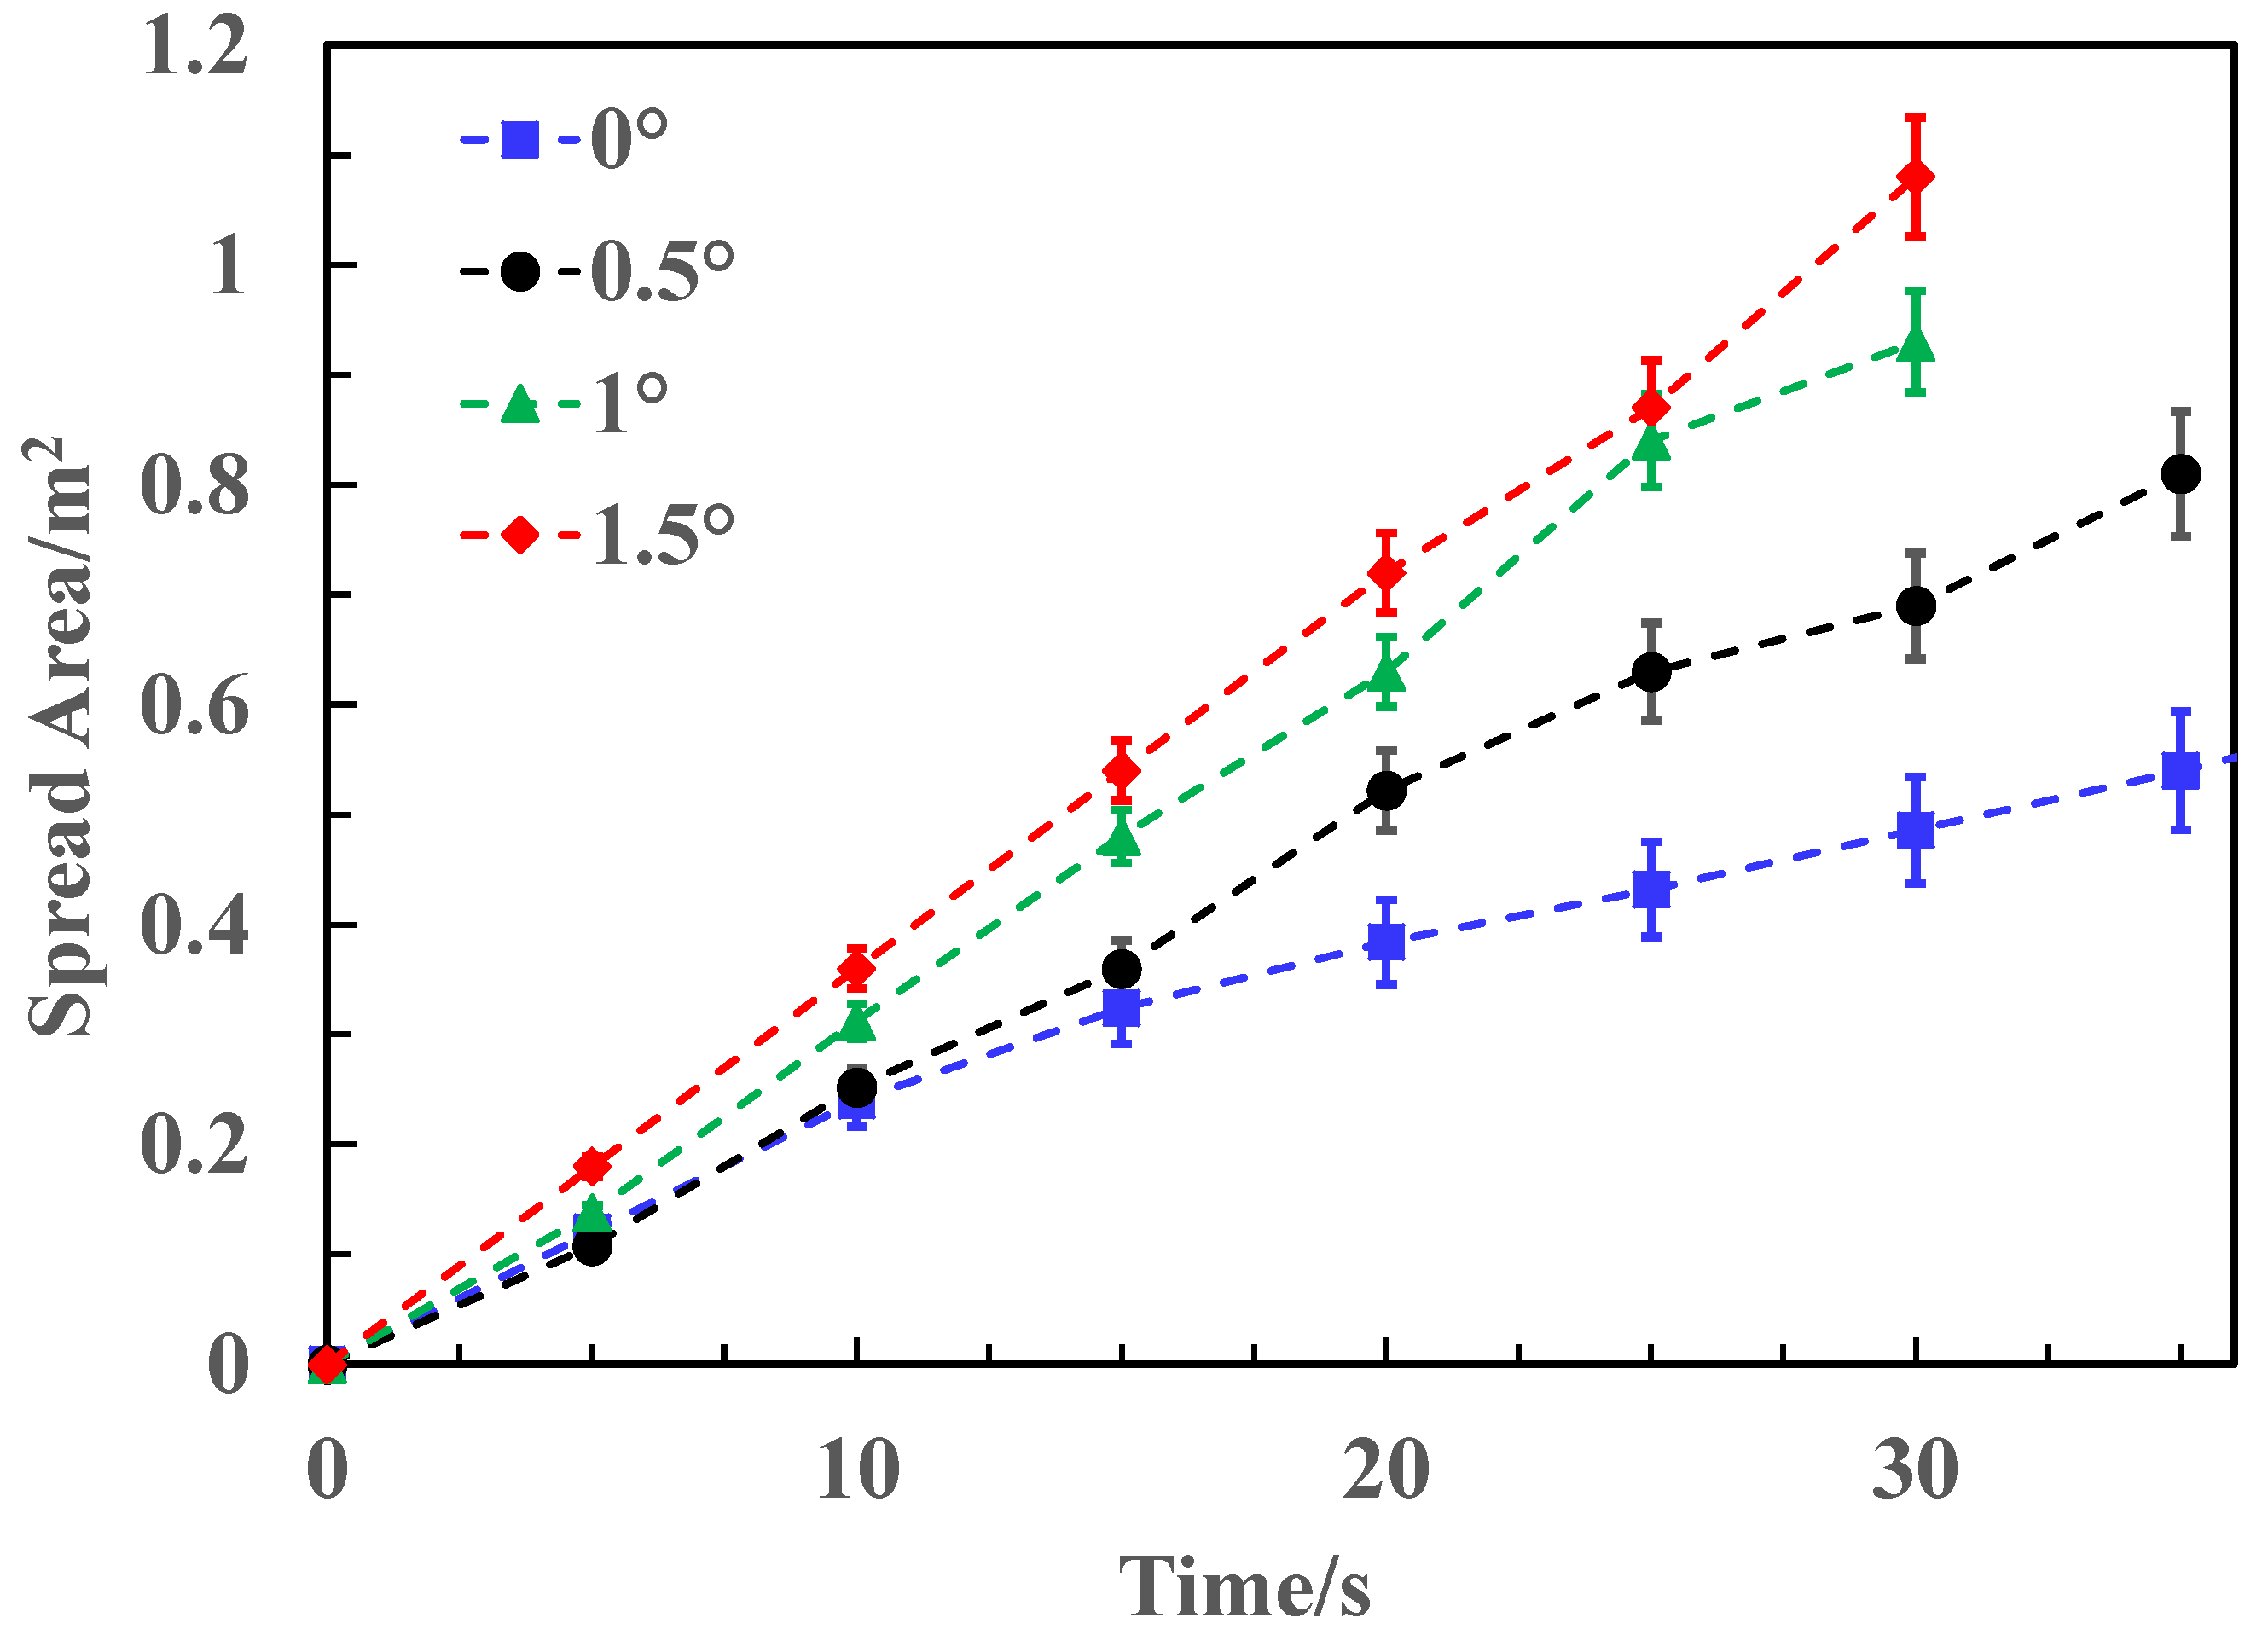
Figure 12.
Variation of n-heptane oil layer thickness with a slope and on a non-ignition condition.

Figure 13.
Variation of the oil layer thickness and fitted value with slope.
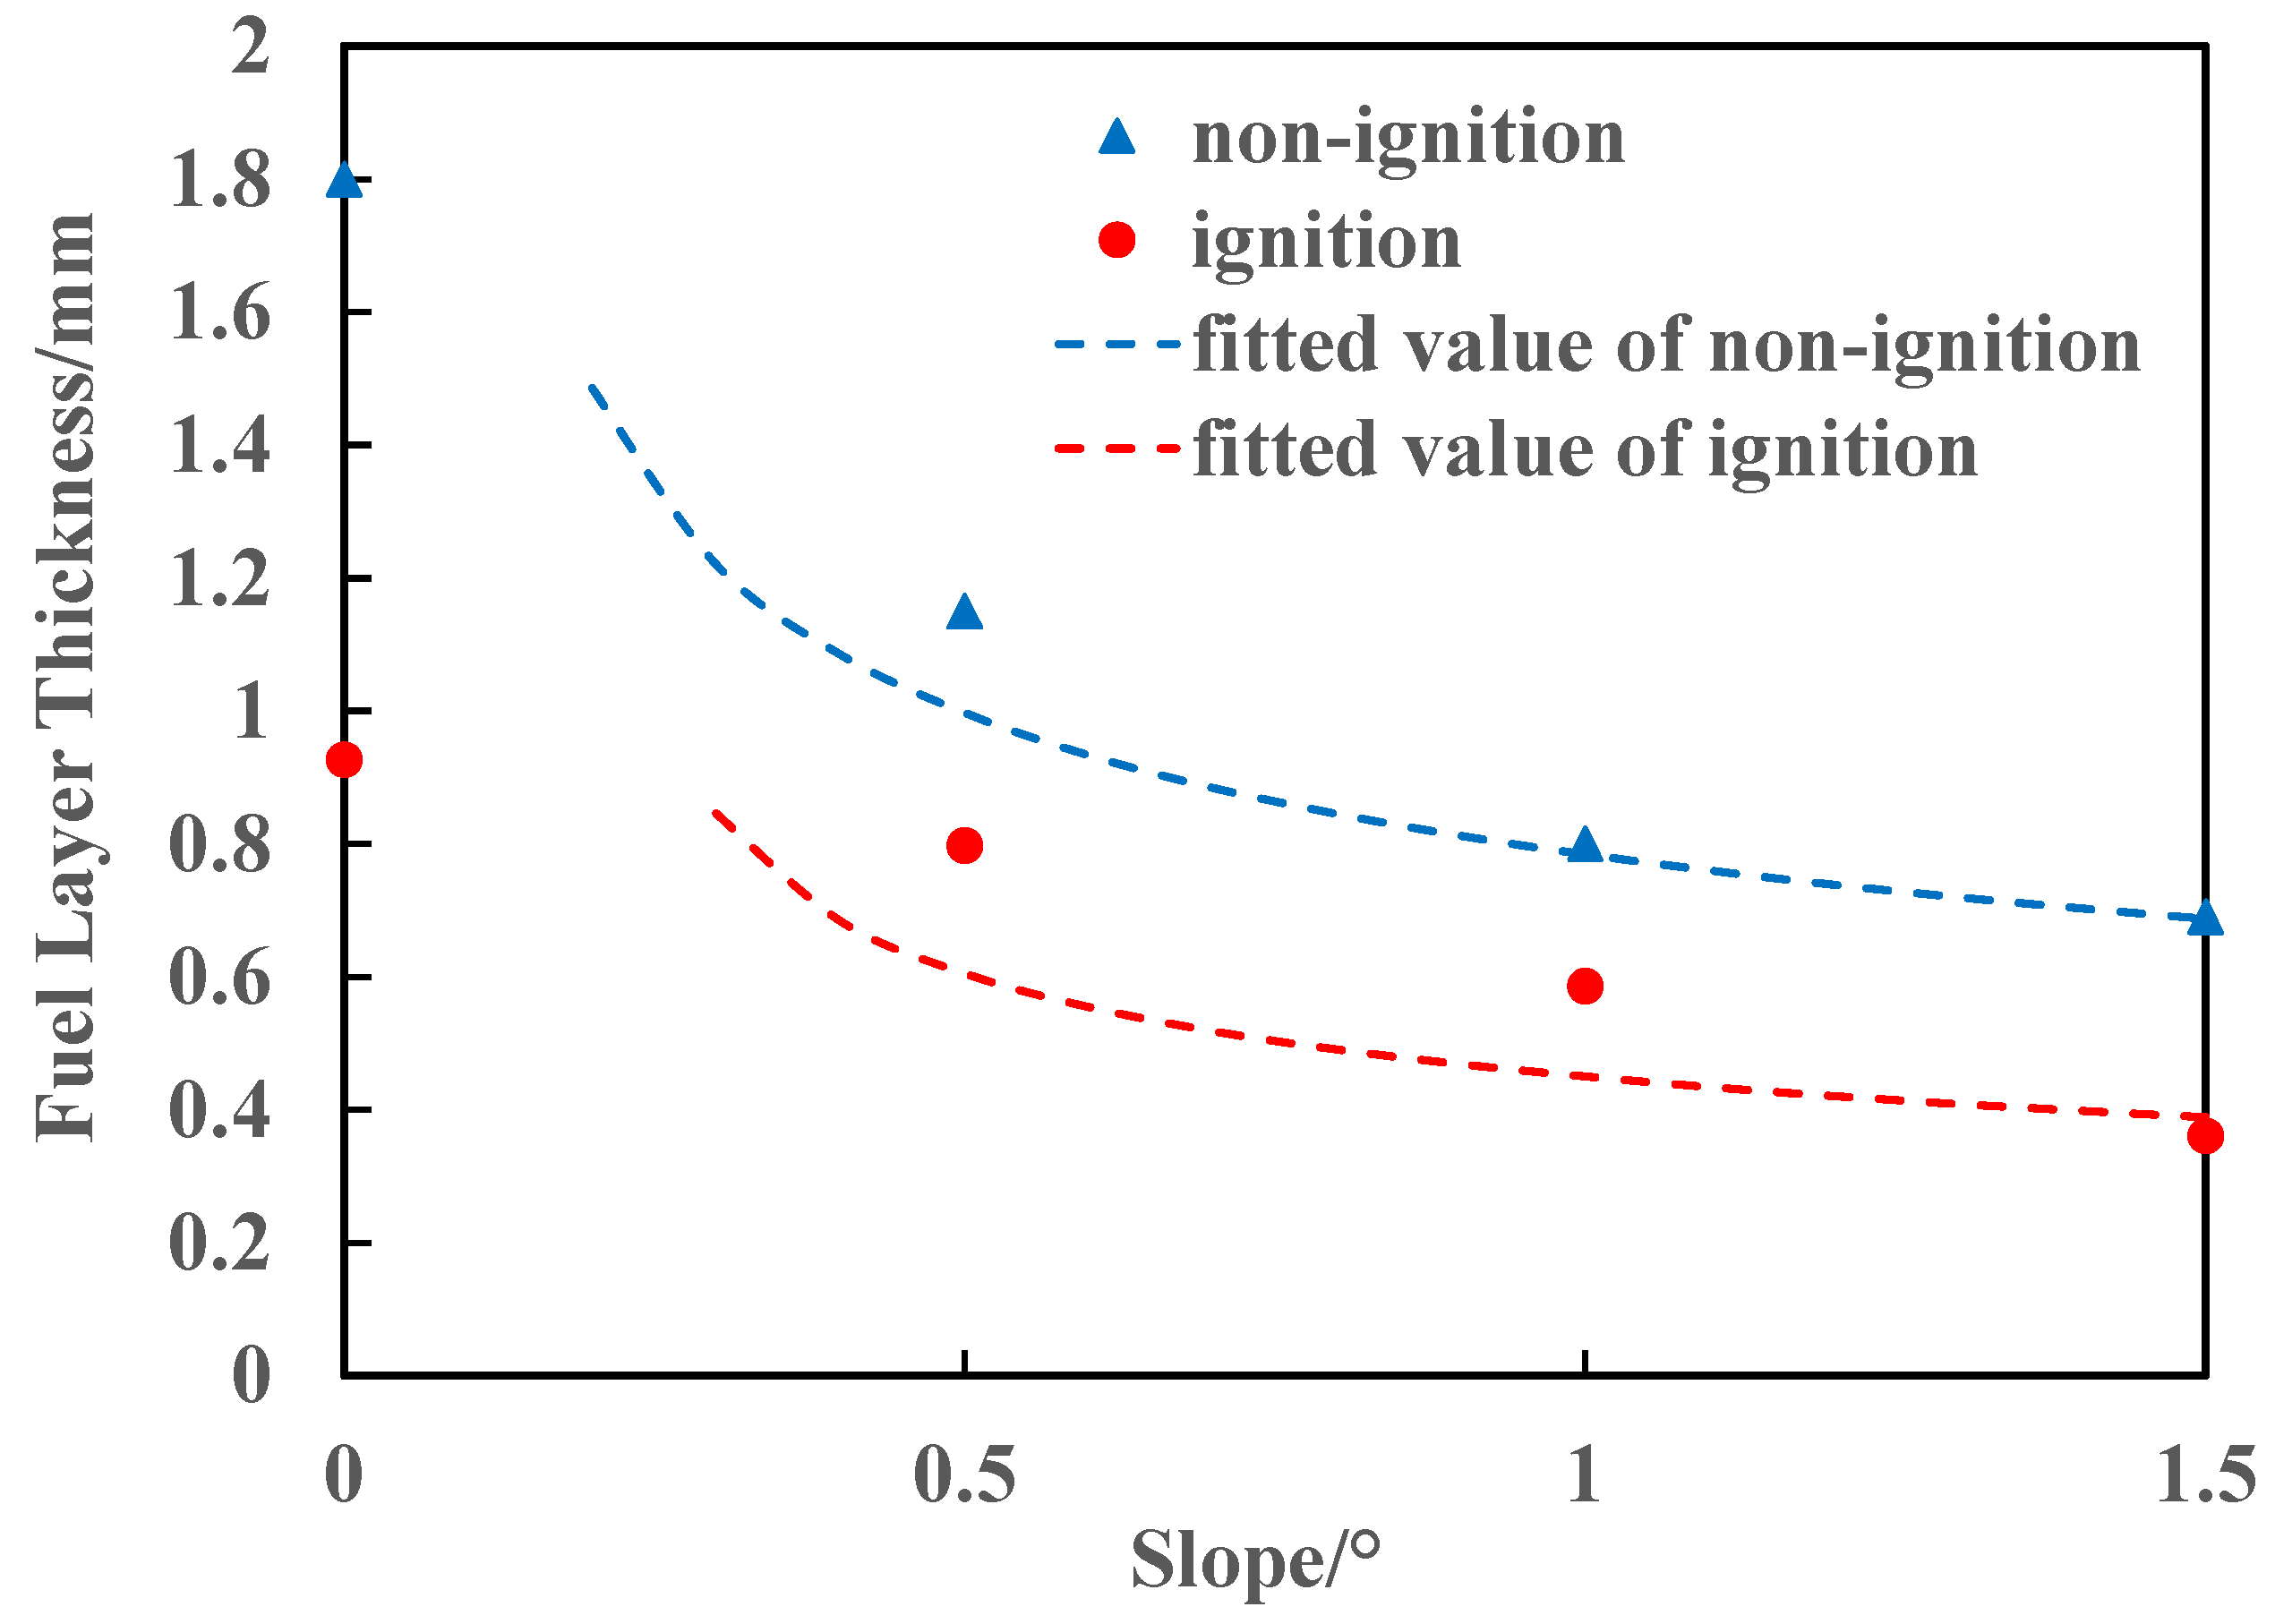
Figure 14.
Model showing how a slope affects the spreading and burning processes.


Table 1.
Some properties of the fuels in the experiment.
| N-Heptane | Alcohol | |
|---|---|---|
| Density (g/cm3) | 0.678 | 0.789 |
| Boiling point (°C) | 98.4 | 78.3 |
| Heat of combustion (kJ/mol) | 4806.6 | 1365.5 |
Table 2.
Relationship between the pump speed and flow.
| Rotation Speed r/min | Quality g/s | Volume L/min |
|---|---|---|
| 30 | 9 | 0.79 |
| 60 | 18 | 1.58 |
| 90 | 25 | 2.19 |
| 120 | 30 | 2.63 |
Table 3.
Specifications of test configurations.
| No. | Type of Fuel | Revolutions (r/min) | Slope (°) |
|---|---|---|---|
| 1 | n-heptane | 30 | 0 |
| 2 | n-heptane | 60 | 0 |
| 3 | n-heptane | 90 | 0 |
| 4 | n-heptane | 120 | 0 |
| 5 | n-heptane | 30 | 0.5 |
| 6 | n-heptane | 60 | 0.5 |
| 7 | n-heptane | 90 | 0.5 |
| 8 | n-heptane | 120 | 0.5 |
| 9 | n-heptane | 30 | 1 |
| 10 | n-heptane | 60 | 1 |
| 11 | n-heptane | 90 | 1 |
| 12 | n-heptane | 120 | 1 |
| 13 | n-heptane | 30 | 1.5 |
| 14 | n-heptane | 60 | 1.5 |
| 15 | n-heptane | 90 | 1.5 |
| 16 | n-heptane | 120 | 1.5 |
| 17 | n-heptane | 30 | 2 |
| 18 | n-heptane | 60 | 2 |
| 19 | n-heptane | 90 | 2 |
| 20 | n-heptane | 120 | 2 |
| 21 | alcohol | 30 | 0 |
| 22 | alcohol | 60 | 0 |
| 23 | alcohol | 90 | 0 |
| 24 | alcohol | 120 | 0 |
| 25 | alcohol | 30 | 0.5 |
| 26 | alcohol | 60 | 0.5 |
| 27 | alcohol | 90 | 0.5 |
| 28 | alcohol | 120 | 0.5 |
| 29 | alcohol | 30 | 1 |
| 30 | alcohol | 60 | 1 |
| 31 | alcohol | 90 | 1 |
| 32 | alcohol | 120 | 1 |
| 33 | alcohol | 30 | 1.5 |
| 34 | alcohol | 60 | 1.5 |
| 35 | alcohol | 90 | 1.5 |
| 36 | alcohol | 120 | 1.5 |
| 37 | alcohol | 30 | 2 |
| 38 | alcohol | 60 | 2 |
| 39 | alcohol | 90 | 2 |
| 40 | alcohol | 120 | 2 |
Table 4.
Experimental phenomena.
| Slope (°) | N-Heptane | Alcohol |
|---|---|---|
| 0 | Shrinking and steady burning phases were observed | Shrinking and steady burning phases were observed |
| 0.5 | Steady burning phase was observed when fuel discharge rate was low | Steady burning phase was observed when fuel discharge rate was low |
| 1 | Steady burning phase was observed when fuel discharge rate was low | Steady burning phase was not observed |
| 1.5 | Steady burning phase was observed when fuel discharge rate was low | Steady burning phase was not observed |
| 2 | Steady burning phase was not observed | Steady burning phase was not observed |
Table 5.
Comparison of fitted values for burning and non-burning situations.
| Non-Burning Situation | Burning Situation | |
|---|---|---|
| n | ||
| /(°) |
Publisher’s Note: MDPI stays neutral with regard to jurisdictional claims in published maps and institutional affiliations. |
© 2022 by the authors. Licensee MDPI, Basel, Switzerland. This article is an open access article distributed under the terms and conditions of the Creative Commons Attribution (CC BY) license (https://creativecommons.org/licenses/by/4.0/).
Share and Cite
MDPI and ACS Style
Sun, X.; Huang, H.; Zhao, J.; Song, G. Experimental Study of the Effect of Slope on the Spread and Burning Characteristics of a Continuous Oil Spill Fire. Fire 2022, 5, 112. https://doi.org/10.3390/fire5040112
AMA Style
Sun X, Huang H, Zhao J, Song G. Experimental Study of the Effect of Slope on the Spread and Burning Characteristics of a Continuous Oil Spill Fire. Fire. 2022; 5(4):112. https://doi.org/10.3390/fire5040112
Chicago/Turabian StyleSun, Xiaoxiao, Hong Huang, Jinlong Zhao, and Guangheng Song. 2022. "Experimental Study of the Effect of Slope on the Spread and Burning Characteristics of a Continuous Oil Spill Fire" Fire 5, no. 4: 112. https://doi.org/10.3390/fire5040112