Article

Study on the Effect of Bridge Deck Spacing on Characteristics of Smoke Temperature Field in a Bridge Fire

1
Jiangsu Key Laboratory of Fire Safety in Urban Underground Space, China University of Mining and Technology, Xuzhou 221116, China
2
Key Laboratory of Gas and Fire Control for Coal Mines, China University of Mining and Technology, Ministry of Education, Xuzhou 221116, China
3
State Key Laboratory of Coal Resources and Safe Mining, China University of Mining and Technology, No. 1 University Road, Xuzhou 221116, China
4
Guang Dong Bay Area Traffic Construction Investment Co., Ltd., Guangzhou 510699, China
*
Author to whom correspondence should be addressed.
Fire 2022, 5(4), 114; https://doi.org/10.3390/fire5040114
Submission received: 26 July 2022 / Revised: 6 August 2022 / Accepted: 8 August 2022 / Published: 12 August 2022
(This article belongs to the Special Issue Fire-Induced Smoke Movement and Control)

Abstract

:
The numerical simulation method is used to simulate the distribution characteristics of the smoke temperature field of a double-deck bridge smoke temperature field during tanker fire under natural ventilation. The influence of the distance between double decks on the truss and ceiling temperature field change in the double-deck bridge is investigated. The results show that the range of high-temperature area gradually decreases with the increase in bridge deck spacing. The maximum excess temperature function of the tunnel ceiling is also applicable to the bridge, but the coefficient is smaller than that of the tunnel experimental formula. An equation is proposed to predict the maximum excess temperature of the truss under different bridge deck spacings. As the bridge deck spacing increases, the maximum excess temperature decreases. The excess temperature of the truss increases along the truss, and the maximum excess temperature appears at the top of the truss. Based on the energy equation, an equation for the excess temperature of the truss is established. As the vertical height increases, the excess temperature of the truss above the fire source exponentially increases. The research results will contribute to the fire hazard evaluation and safety design of bridges.

1. Introduction

Bridges are an important part of modern city construction. Once a fire hazard occurs, it will cause great losses. On 31 August 2004, a car burst into flames on a double-deck road bridge in Imphal in northeast India, causing an explosion that paralyzed the surrounding road system and caused extensive damage. In a fire event, the mechanical properties of the bridge decrease rapidly as the temperature increases. Therefore, it is vital to study the temperature variation characteristic of bridges under fire hazard.
The influence of fire hazards on bridges has been previously discussed by scholars. Garlock et al. [1] presented a detailed review of actual fire incidents, case studies related to fire hazards, and post-fire assessment and repair strategies for bridges. Their study pointed out that the number of damaged bridges caused by fire is nearly 3 times more than that caused by earthquakes. Peris-Sayol [2] analyzed information related to 154 cases of bridge fire, proposed classifying the damage levels suffered by a bridge during fire, and established the main factors involved in bridge fire damage. Mendes [3] and Fernando [4] et al. conducted a numerical simulation of a ship fire after the cable pylon of the Vasco da Gama bridge was hit by ships and obtained the temperature field and fire resistance time of the main beam section of the cable-stayed bridge under such a fire scenario. Bennetts et al. [5] conducted a simulation analysis on three fire scenarios for cable-stayed bridges without fire prevention design of the main tower, providing the actual time when the main tower was subjected to different ratios of ultimate load with or without fire prevention. Smith et al. [6] conducted a risk and vulnerability assessment (RVA) during the design and construction of four cable-stayed bridges in the United States by considering main tower protection, bridge deck stability, cable loss, fire prevention, and other factors, and put forward different mitigation decisions. Although the current design guidelines lack specific suggestions on how to deal with different security-related risks, designers need to ensure that the risk assessment level is enough. Ataei et al. [7] adopted the nonlinear finite element modeling and analysis method to study the influence of hypothetical fire and temperature gradient propagation along a cable and studied the influence of fire intensity and fire duration on cable strength loss by using the finite element method.
Accordingly, although many scholars have studied bridge fire, most research focuses on the influence of high-temperature fire on mechanical properties. For steel bridges, however, the critical buckling stress of the bridge is reduced greatly due to the rapid increase in temperature. This study focuses on a steel bridge in Guangzhou, China, i.e., the Shiziyang bridge, which is in the design stage. Fire Dynamics Simulator (FDS) is used to simulate the smoke temperature field of this double-deck bridge during fire to study the temperature variation of the ceiling and truss. On the one hand, the variation rule of the smoke temperature field with the change of bridge deck spacing is obtained in this paper. It is helpful for designers to choose the best bridge deck spacing for the Shiziyang bridge to achieve a balance between fire safety and economy. The temperature field of different components and different positions of the bridge is also obtained, which provides guidance for the Shiziyang bridge to adopt a zoning fire resistance scheme, i.e., different fire resistance strategies for different zones. On the other hand, there is no relevant code concerning bridge fire protection in China. There is also no basis for fire detection, fire resistance design, and safe evacuation, which are closely related to the smoke temperature field. Therefore, this study can provide basic theories and data for the establishment of bridge fire codes.

2. Methods and Models of Numerical Simulation

2.1. Methods and Models

2.1.1. Methods and Models of FDS

FDS is a powerful fire simulator software developed by the National Institute of Standards and Technology of America. This software is very flexible and widely used in the field of fire, and it can predict a variety of substances such as smoke and carbon monoxide. The accuracy of FDS has been verified by a large number of experiments [8].
FDS is used for governing equations, which are solved via the numerical method [9,10]:
Mass conservation equation:
ρ t = ( ρ u )
where ρ is the density, t is the time, u is the velocity vector, and ∇ is the Hamiltonian operator.
Momentum conservation equation:
ρ u t + u u + p = ρ g + f + τ
where g is the acceleration of gravity, f is the volume force vector, τ is the viscous tension per unit area, and p is the pressure.
Energy conservation equation:
t ρ h + ρ h u = p t + u p q r + k T + i h i ρ D i Y i
where h is the specific enthalpy, qr is the thermal radiation flux, T is the temperature, k is the heat conductivity coefficient, Di is the diffusion coefficient of the ith ingredient, and Yi is the mass fraction of the ith ingredient.
Ingredient conservation equation:
t ρ Y i + ρ Y i u = ρ D i Y i + m i m
where mim is the mass production rate of the ith ingredient.
Ideal gas state equation:
p 0 = ρ T R i Y i / M i = ρ T R / M
where p0 is the background pressure, R is the molar gas constant, M is the molecular weight of mixed gas, and i is the ith ingredient.

2.1.2. Model Establishment of Double-Deck Bridge

FDS is used to establish a double-deck bridge section. The shape and dimensions of the bridge refer to the Shiziyang bridge in Guangzhou, China. In order to simplify the model, the bridge model in this paper does not consider the influence of the girder on the temperature field. A 3D view of the model of the bridge is shown in Figure 1. In the bridge model, the longitudinal direction of the bridge is in the x-direction with a 48 m length, the transverse direction is in the y-direction with a 42 m length, and the vertical direction is in the z-direction with varying length.
The main material of the bridge is steel. The thermal parameters of the steel include thermal conductivity and specific heat. These parameters have been studied by many scholars and can be expressed as follows [11,12]:
λ ( θ ) = 0.022 θ + 48 ,   0 θ 900   ° C 28.2 ,   θ > 900   ° C
C θ = 38.1 × 10 8 θ 2 + 20.1 × 10 5 θ + 0.473
where λ is the thermal conductivity function of the steel, C is the specific heat function of the steel, θ is the temperature.
In this study, the thermal physical properties of steel at 20 °C are taken without considering the change of the material’s thermal physical properties with temperature. The relevant parameters of the bridge and its properties are shown in Table 1.

2.2. Parameter Setting

2.2.1. Model Parameters

The fire source is located at the outermost side of the bridge mid-span (as shown in Figure 1), and its size is 12 m × 3 m × 3 m. Since the study of bridge fire mainly focuses on an extreme fire source scale [13,14], the fire power is set as the heat release rate of the tanker during fire. Inagason [15] suggested the heat release rate for a tank fire be set at 200 MW. According to the results of the French regulations [16], the growth stage of a 200 MW fire source is 600 s, and the stable stage is 4200 s, so the simulation time is 4800 s in this work. The type of simulated fire source is a t2-growth fire. The growth factor is calculated at the time specified by French regulations. It is appropriate to set the mesh size as 1/4–1/16 of the flame characteristic diameter (D*) [17]. Employing the formula D * = ( Q / ρ 0 C p T 0 g 1 / 2 ) 2 / 5 [18], the flame characteristic diameter in this paper is calculated as 7.77 m, and thus, the appropriate mesh size is 0.49 m–1.94 m. Considering both simulation time and accuracy, 1 m is selected as the mesh size. The relevant parameters are shown in Table 2.
The arrangement of thermocouples inside the utility tunnel is shown in Figure 2. The ceiling thermocouple is arranged 2 m apart, tiling the whole top deck of the bridge.
In order to ensure that the maximum excess temperature of the hot smoke layer below the ceiling can be measured, the thermocouples are arranged 0.05 m below the ceiling [19]. There are six thermocouples evenly arranged at the same intervals above the fire source on the inner surface of the truss (yellow points in Figure 2), and the thermocouples are arranged 0.05 m away from the surface of the truss. In addition, the 2D slice (blue graph in Figure 2) of the temperature is set at the bottom of the ceiling to observe the overall change of ceiling temperature. The height of the 2D slice is equal to the bridge deck spacing.

2.2.2. Operating Parameters

In the paper, the definition of bridge deck spacing is the vertical distance from the ceiling to the bottom deck of the double-deck bridge, as shown in Figure 2. Effective bridge deck spacing is the distance from the ceiling of the bridge to the surface of the fire resource. In this study, six different bridge deck spacings, i.e., 9.8 m, 10.6 m, 11.4 m, 12.2 m, 13.0 m, and 13.8 m, are selected and investigated, while other parameters remain unchanged. In addition, a ventilation velocity (2 m/s) is set according to the perennial wind speed in Guangzhou. As shown in Figure 1, the ventilation direction is along the y-direction.

3. Results and Discussion

3.1. Influence Range of High-Temperature Smoke on the Ceiling

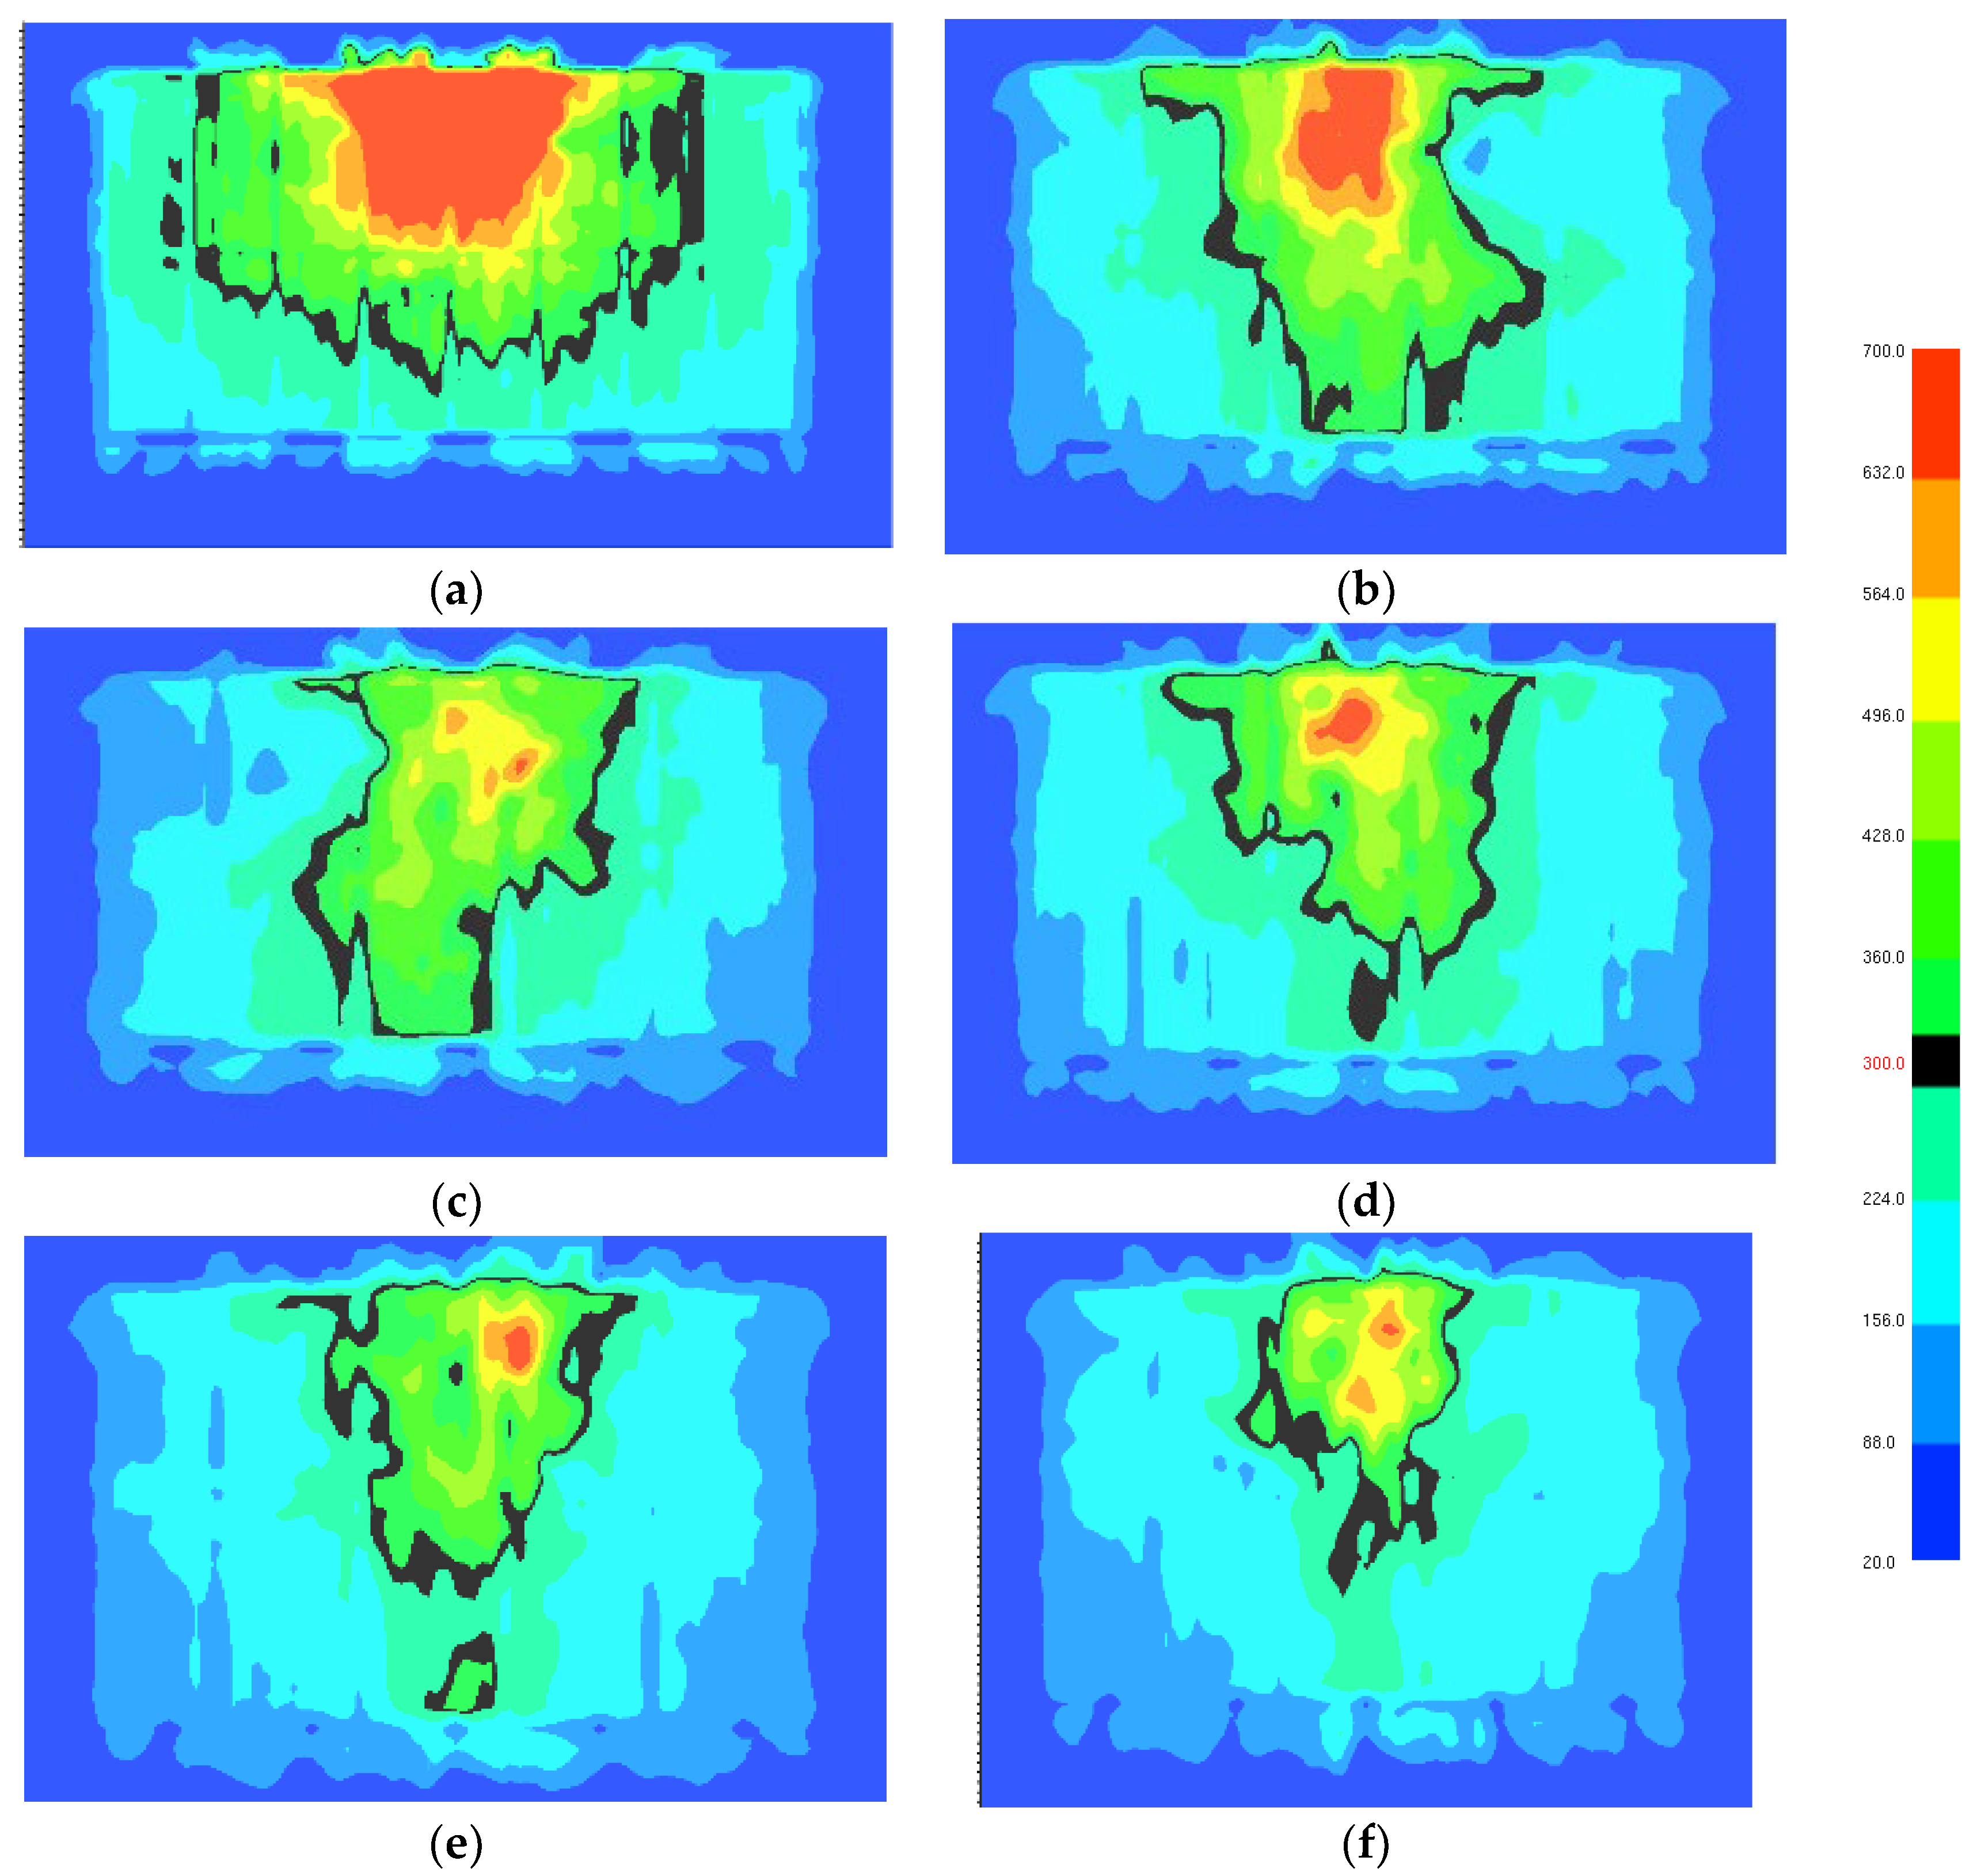
Figure 3 shows the influence range of high-temperature smoke on the ceiling at different bridge deck spacings. As can be seen from the figure, the range of the high-temperature area gradually decreases. With the increase in bridge deck spacing, the area where the flame plume hits the ceiling decreases. When the temperature exceeds 300 °C, the properties of steel begin to decrease, so the 300 °C isotherm is selected as the influence range of the fire temperature field. The spread distance of fire influence decreases gradually along the x-direction. This is because the spread distance of flame plume along the ceiling becomes smaller as the bridge deck spacing increases. However, the spread distance of fire influence first remains unchanged and then decreases along the y-direction. This is because the flame plume tilts along the y-direction due to ventilation velocity.

3.2. Maximum Excess Temperature Beneath the Ceiling

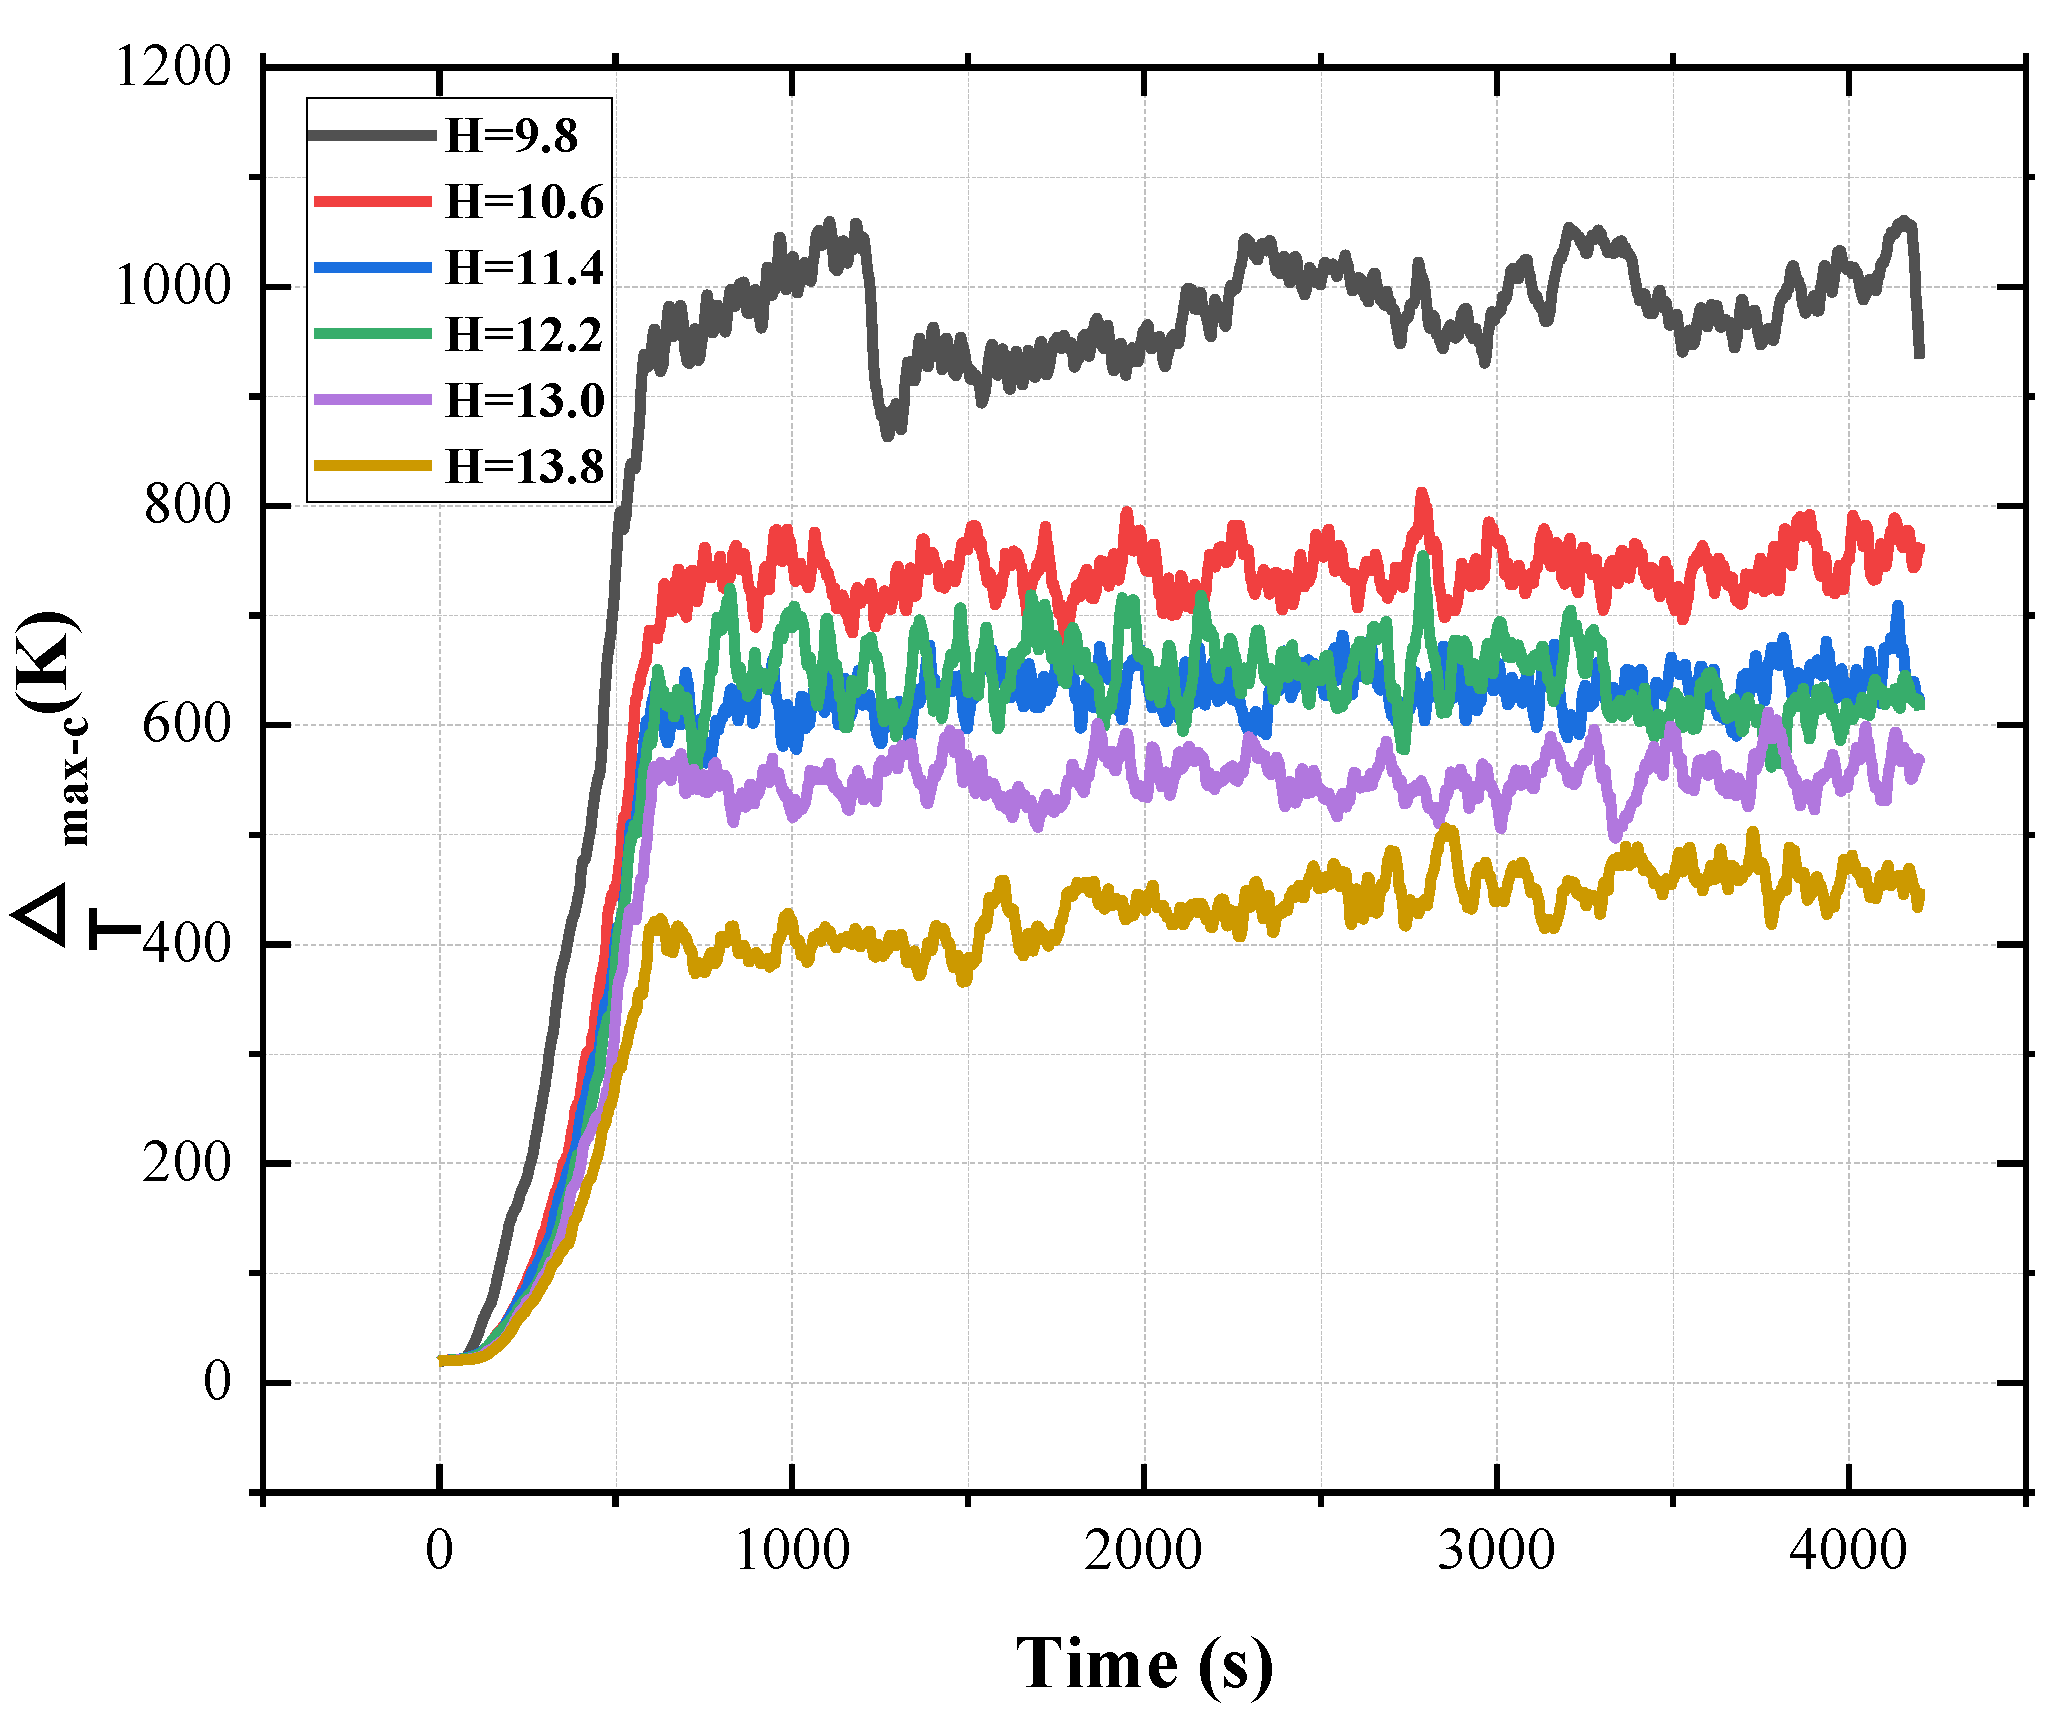
In this paper, the maximum excess temperature beneath the ceiling is defined as the difference between the maximum temperature beneath the ceiling and the ambient temperature. The maximum excess temperature at different bridge deck spacings varies with time, as shown in Figure 4. It can be clearly seen that the maximum excess temperature changes with time and can be divided into three stages: slow growth stage, rapid growth stage, and relatively stable stage. In the slow growth stage, the maximum excess temperature increases slowly with time, which occurs between approximately 0 and 300 s. In the rapid growth stage, the maximum excess temperature increases rapidly with time, which occurs between approximately 300 and 600 s. In the relatively stable stage, the maximum excess temperature increases rapidly with time, which occurs between approximately 600 and 4200 s. The maximum excess temperature does not change significantly with time and fluctuates around a certain value. With the increase in bridge deck spacing, the overall excess temperature of the bridge ceiling decreases gradually. The reason Is that as the bridge deck spacing increases, the entrainment route of the air beneath the ceiling decreases, which increases heat flux loss.
A lot of research has been performed on the formula of maximum excess tunnel ceiling temperature. Li proposed the formula of the maximum excess ceiling temperature under longitudinal ventilation velocity. The formula has been proved to be applicable to most cases by many scholars, which can be expressed as [20]:
Δ T max c = 2.68 C T ( 1 χ r ) g 1 / 3 ( ρ 0 C p T o ) 1 / 3 Q u D 1 / 3 h e f 5 / 3 , u > 0.19
where ΔTmax-c is the maximum excess ceiling temperature, Q is the total heat release rate, To is the ambient temperature, Cp is the thermal capacity of air, CT is coefficient, χr is the fraction of radiative heat release rate, g is the gravitational acceleration, D is the radius of the fire source, u is the ventilation velocity, and u′ is the dimensionless ventilation velocity.
u′ can be expressed as [21]:
u = u w *
w * = ( Q c g D ρ 0 C p T o ) 1 / 3
where w* is the characteristic plume velocity, and Qc is the convective heat release rate.
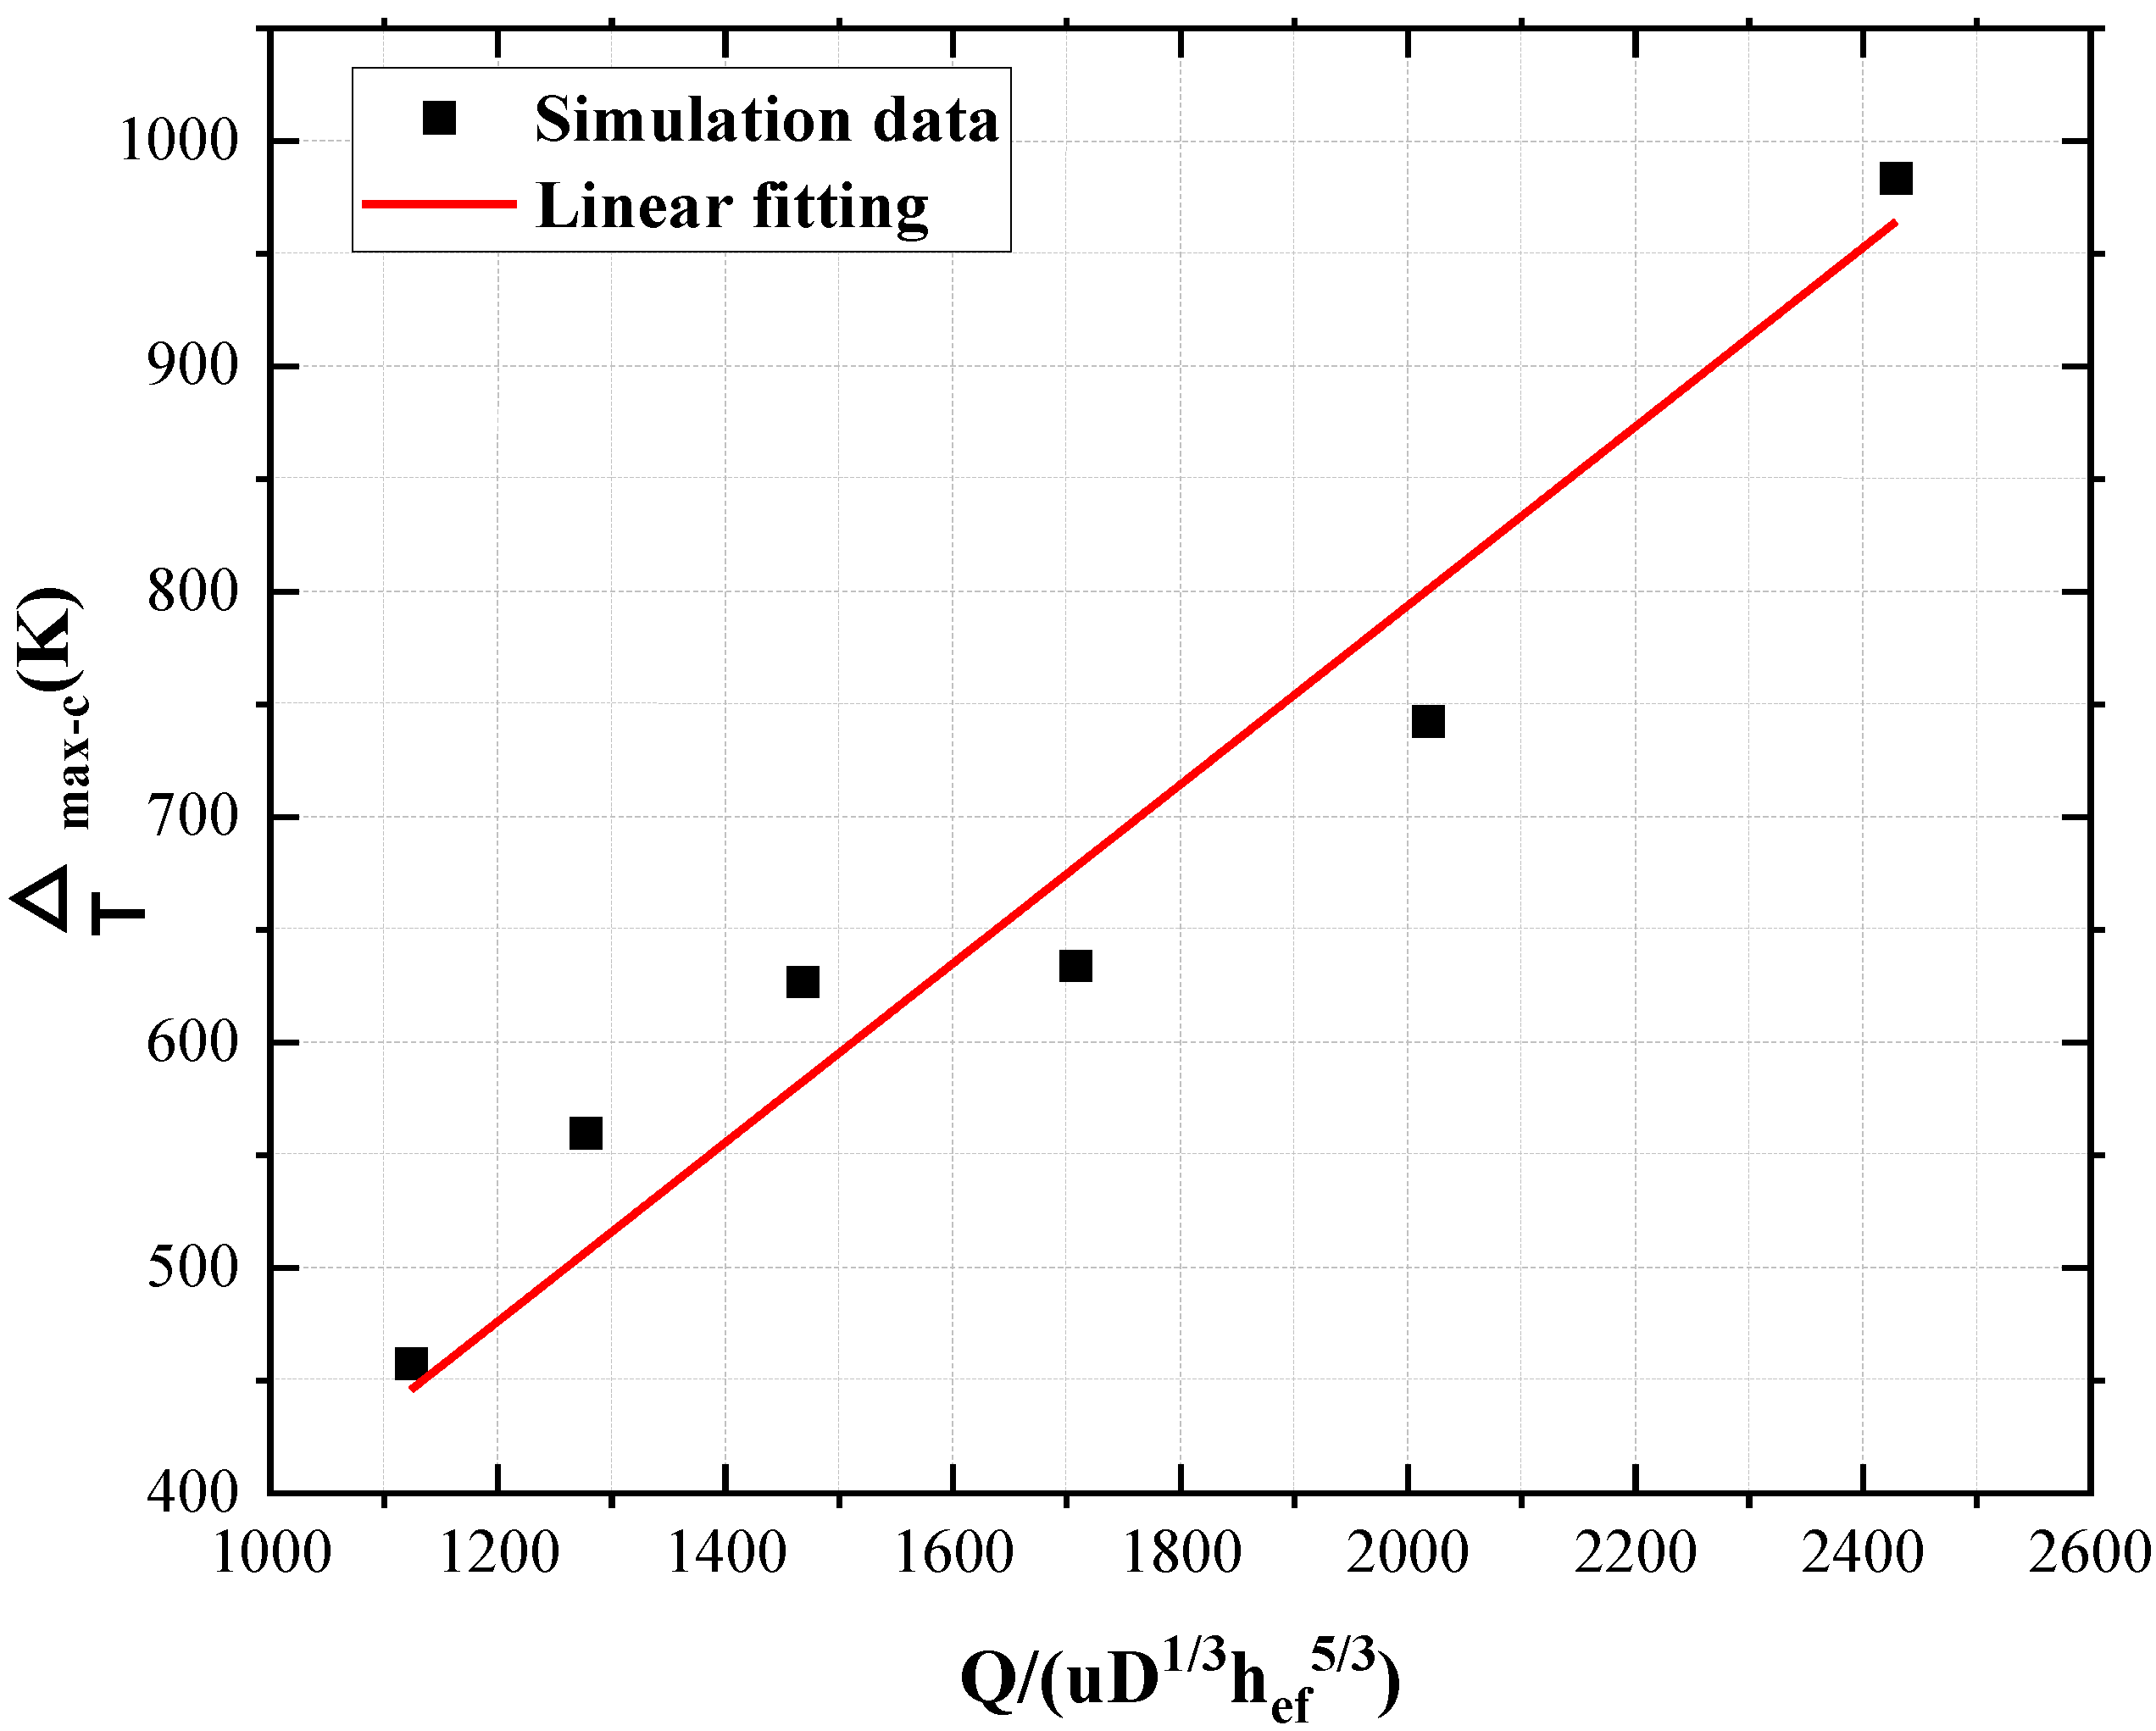
To verify whether the formula of the maximum excess temperature of the tunnel ceiling is suitable for a bridge under natural ventilation, Li’s formula is used to fit the numerical simulation data. To reduce the error of numerical simulation results, the average value of the stable stage is selected as the maximum excess temperature beneath the ceiling. Figure 5 shows the fitting of the formula and simulation data. It is obvious that the formula of the maximum excess tunnel ceiling temperature also applies to the bridge. The simulation data of maximum excess temperature beneath the top floor can be correlated well with Equation (11):
Δ T max c = 0.397 Q u D 1 / 3 h e f 5 / 3
where ΔTmax-c is the maximum excess temperature beneath the ceiling.
Compared with Li’s empirical formula, the coefficient is relatively small. The reason is as follows: firstly, the maximum excess temperature here is the average of the stable stage. Secondly, compared with tunnels, the double-deck bridge does not have sidewalls to limit heat dissipation.

3.3. Temperature Distribution of Truss

In this paper, the maximum excess temperature of the truss is defined as the difference between the maximum temperature of the truss and the ambient temperature. The maximum excess temperature of the truss at different bridge deck spacings varies with time and is shown in Figure 6. The maximum excess temperature varies with time and can also be divided into three stages: slow growth stage, rapid growth stage, and relatively stable stage. With the increase in the bridge deck spacing, the overall excess temperature gradually decreases. This is because as the bridge deck spacing increases, air entrainment increases and more cold air flows through the truss surface, which leads to the temperature decreasing. However, the excess temperature of the 12.2 m bridge deck spacing is bigger than that of the 11.4 m bridge deck spacing. This may be caused by the oxygen supply from outside of the 12.2 m bridge deck spacing becoming better than that of 11.4 m, which leads to the flame combustion reaction increasing.
A great number of correlations for maximum excess temperature have been presented in the literature, even though there is some inconsistency with the different forms of them. An analysis of the maximum excess temperature in ventilation velocity has established the dependence of the dimensionless excess temperature (ΔTTmax-c) on the dimensionless HRR denoted as Q* ( Q * = Q / ρ 0 C p T 0 g 1 / 2 h e f 2 / 5 [22]) and the Froude number denoted as Fr ( F r = u 2 / g h e f [22]). In addition, some scholars find that the HRR is closely related to the equivalent diameter of the fire source [9]. To quantify the maximum excess truss temperature, a dimensional analysis method is used. Based on the analysis above, the main factors affecting the maximum excess truss temperature are effective bridge deck spacing (hef), equivalent diameter of the fire source (D), flame heat release rate (Q), ambient air density (ρ0), ambient temperature (T0), specific heat capacity at constant pressure (Cp), gravitational acceleration (g), and ventilation velocity (u). The maximum excess temperature of the truss can be expressed by the following formula:
f ( h e f , D , Q , ρ 0 , C p , g , u , T 0 , Δ T max t ) = 0
where ΔTmax-t is the maximum excess temperature of the truss.
Based on the principle of dimensional consistency, the formula can be simplified as:
Δ T max t T 0 = φ ( Q ρ 0 D 7 2 g 3 2 , u D 1 2 g 1 2 , C p T 0 D g , h e f D )
The right four terms of the formula can be combined:
Δ T max t T 0 = φ ( Q ρ 0 D C p T 0 u h e f ) = φ ( Q )
where Q′ is the modified dimensionless heat release rate.
To reduce the error of the numerical simulation results, the average value of the stable stage is selected as the maximum excess temperature of the truss. Figure 7 shows that the simulation data of maximum excess temperature can be plotted as a function of Q / ρ 0 D C p T 0 u h e f in this region. The simulation data of maximum excess temperature of the truss can be correlated well with Equation (15):
Δ T max t T 0 = 0.183 ( Q ρ 0 D C p T 0 u h e f ) 1.257
From one-dimensional analysis, Yang [23] estimated the heat loss intensity and established the energy equation of the gas beneath the ceiling. However, the excess temperature of the truss is mainly affected by the flame plume. Therefore, the energy diffusion of the micro length dh of the truss to the surrounding can be approximately expressed as:
q C d h = c p m ˙ d ( Δ T )
where C is the perimeter of the contact surface between the element length and the surrounding environment, q″ is the heat flux to truss, and m ˙ is the mass flow rate of the truss.
q can be expressed by the following formula:
q = h c Δ T
where hc is the lumped heat transfer coefficient.
m ˙ can be approximated as the mass rate of the micro side enters the flame plume:
m ˙ = ρ 0 w e h C
where we is horizontal entrainment velocity, which can be expressed as:
w e = 1.94 α ( g π C p T 0 ρ 0 ) 1 / 3 Q 1 / 3 h 1 / 3
Incorporating Equations (17)–(19) into Equations (16) and (19) can be obtained as follows:
d ( Δ T ) Δ T = h c 1.94 α ρ 0 ( g π C p T 0 ρ 0 ) 1 / 3 Q 1 / 3 d h h 2 / 3
The boundary conditions are given by the following equation:
h = h 0 Δ T = Δ T max t
where h0 is the location of maximum excess temperature of the truss.
Incorporating Equations (20) and (21) can obtain the attenuation formula of excess temperature of the truss:
f ( h ) = Δ T Δ T max t = e A h 1 / 3 h 0 1 / 3 , h > h 0
where A = 3 h c 1.94 α ρ 0 ( g π C p T 0 ρ 0 ) 1 / 3 Q 1 / 3 .
Assuming that the excess temperature at the same distance from the maximum excess temperature position is almost same, the formula of the increasing excess temperature of the truss can be obtained as follows:
f ( h ) = f ( 2 h 0 h )
By substituting Equation (23) into Equation (22), Equation (24) can be expressed as:
f ( h ) = Δ T Δ T max t = e A ( 2 h 0 h ) 1 / 3 h 0 1 / 3 , h h 0
To obtain the dimensionless temperature as a function of the dimensionless distance, hef is used as the characteristic scale to the dimensionless distance. Incorporating Equations (22) and (24), the dimensionless excess temperature above and below the position of the maximum temperature can be expressed as:
Δ T Δ T max t = e k ( h h e f ) 1 / 3 ( h 0 h e f ) 1 / 3 , h > h 0 e k ( 2 h 0 h h e f ) 1 / 3 ( h 0 h e f ) 1 / 3 , h h 0
where k and k′ are coefficients.
In this work, the maximum excess temperature of the truss is located at the top of the truss, namely h0 = hef. So, the excess temperature of the truss can be expressed as:
Δ T Δ T max t = e k ( 2 h h e f ) 1 / 3 1 , h h e f
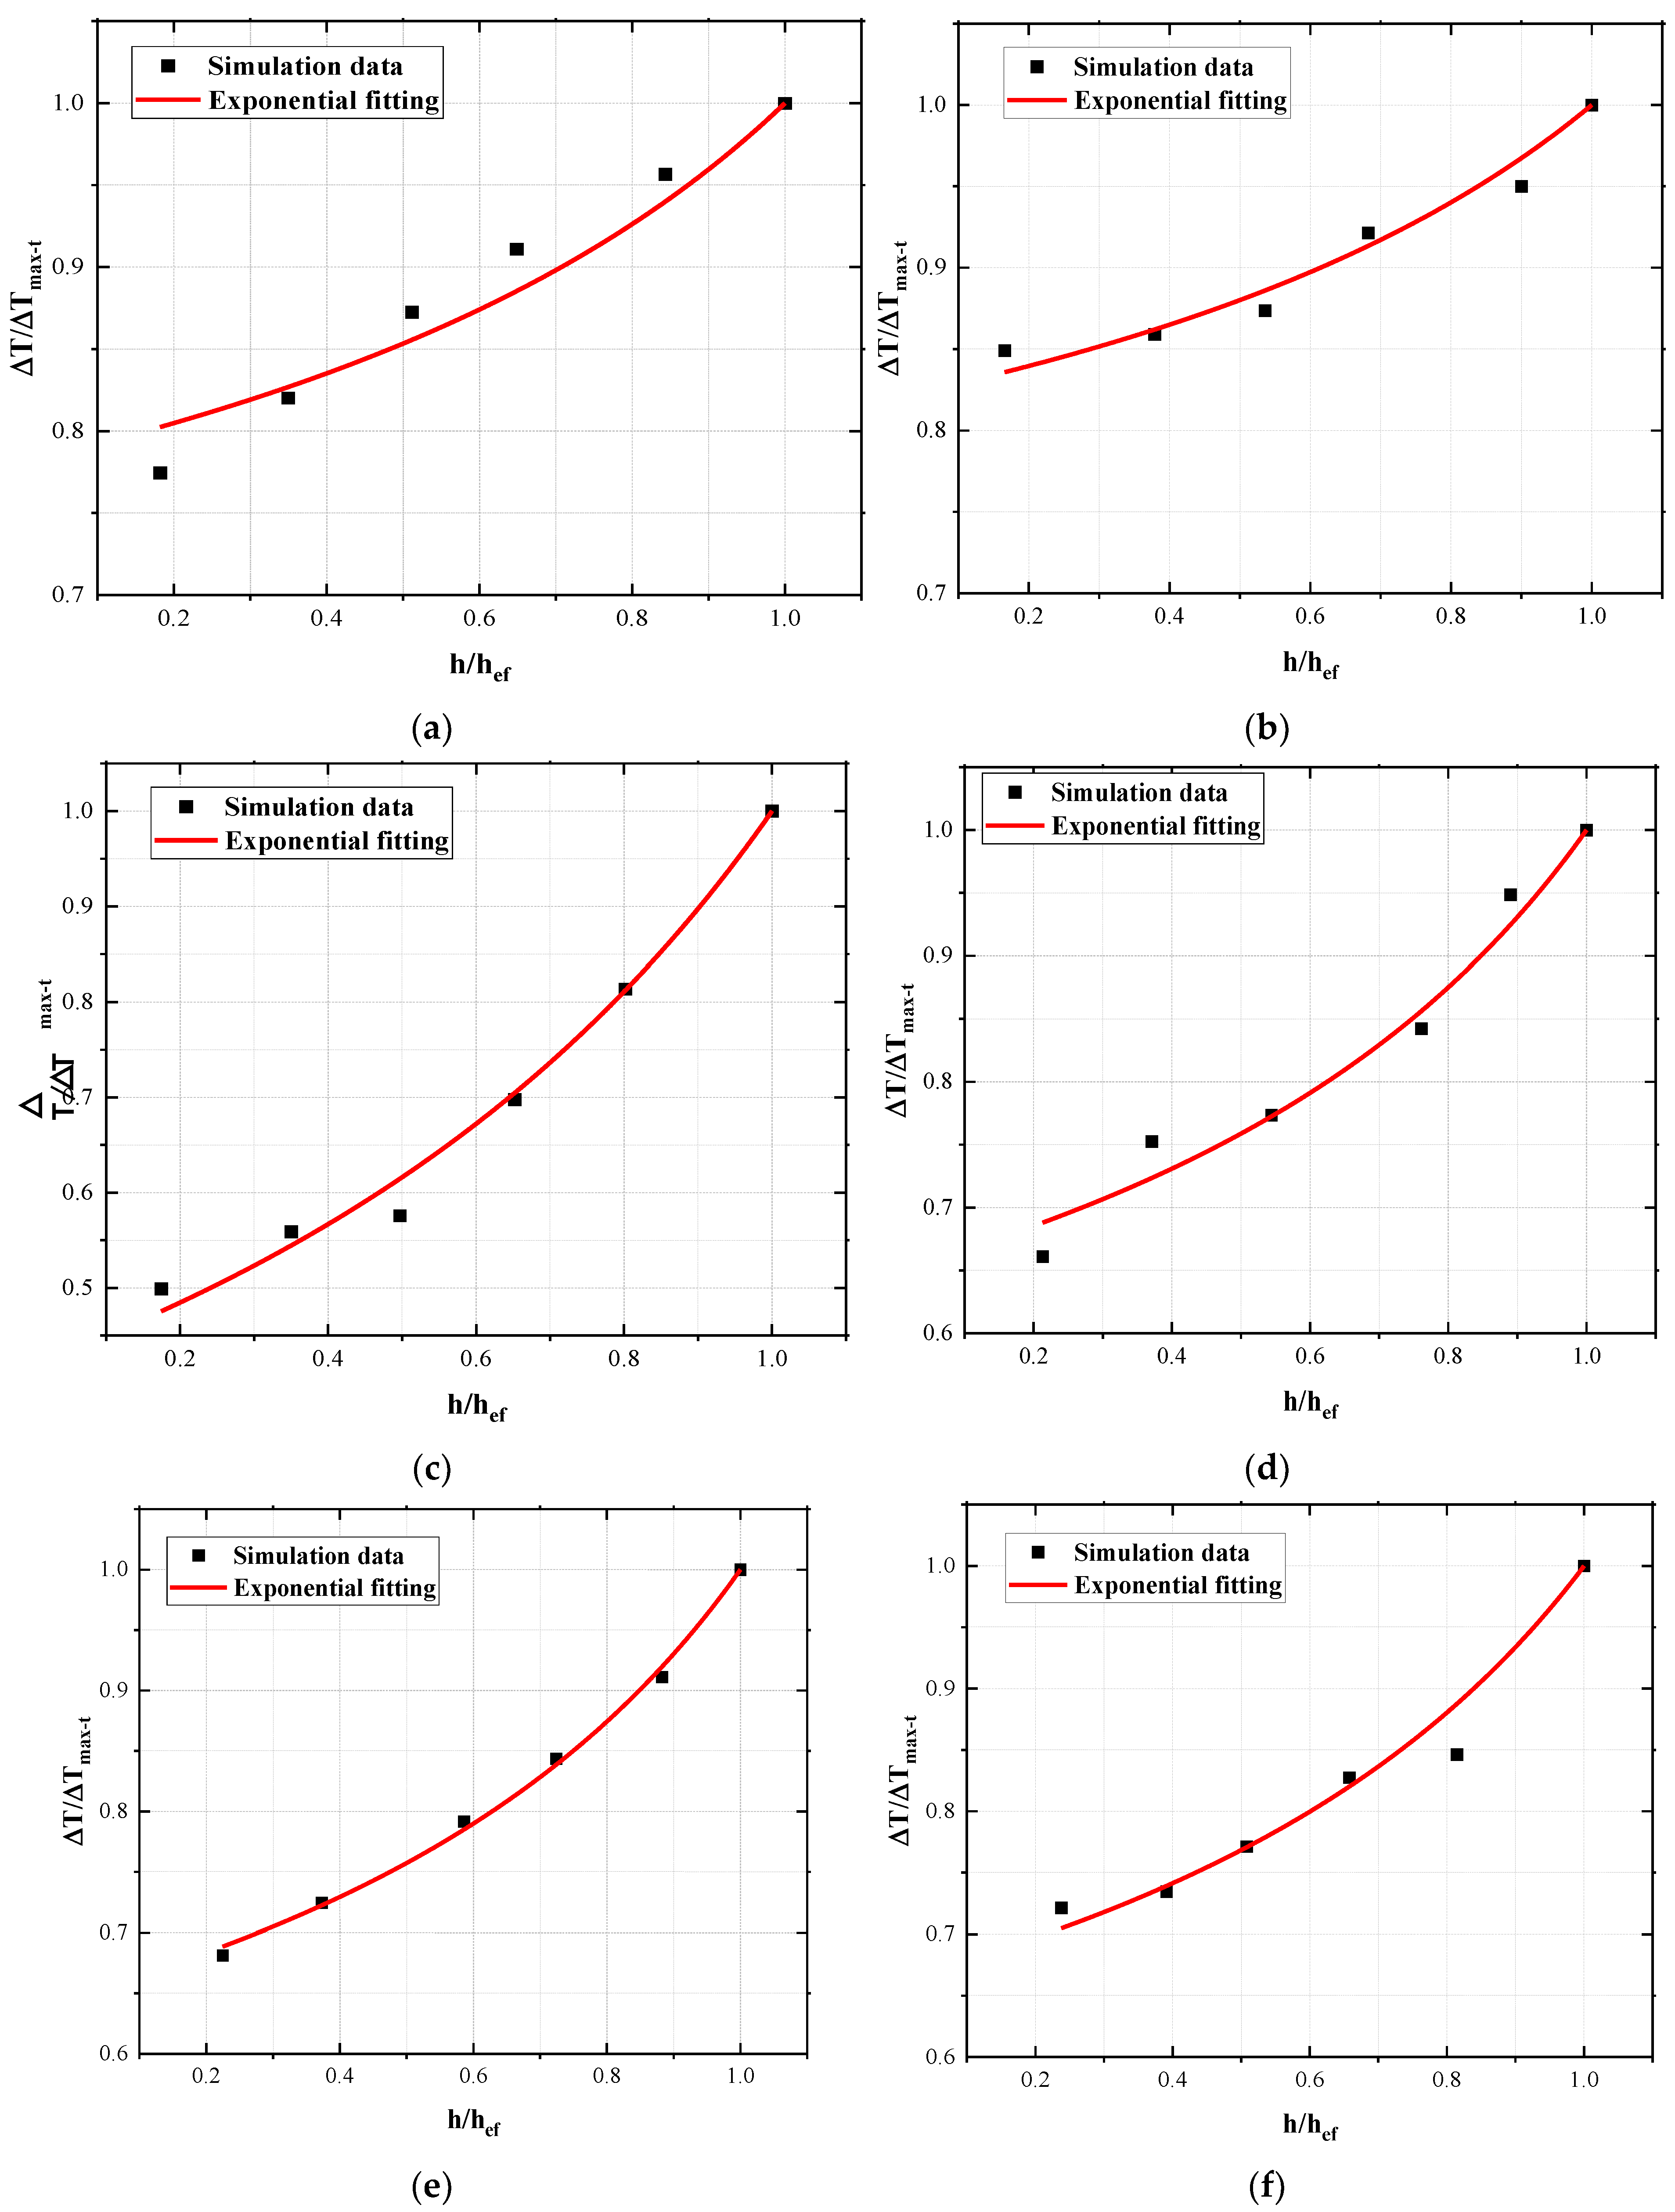
Figure 8 shows that the simulation data fit well with the formula. The values of k′ under different working conditions are shown in Table 3. When H ≤ 10.6, the value of k′ is close to 1. However, when H > 11.4, the value of k′ is larger than 1. This means that when the bridge deck spacing is less than 11.2, the excess temperature varies slightly along the truss. When the bridge deck spacing continues to increase, the change of excess temperature is great.

4. Conclusions

In this paper, the numerical simulation method is used to simulate the distribution characteristics of the smoke temperature field of a double-deck bridge during tanker fire under natural ventilation. The influence of bridge deck spacing on the smoke temperature field change is investigated. The following conclusions can be obtained:
1.
For the different bridge deck spacings, the influence range of high-temperature smoke gradually decreases with the increase in bridge deck spacing. As the bridge deck spacing increases, the spread distance of the fire influence decreases gradually along the x-direction, where it first remains unchanged, then decreases along the y-direction.
2.
The maximum excess temperature beneath the ceiling decreases with the increase in the bridge deck spacing. The maximum excess temperature function of the tunnel ceiling is also applicable to the bridge, but the coefficient is smaller than that of the tunnel experimental formula.
3.
The excess temperature of the truss varies with time and can be divided into three stages: slow growth stage, rapid growth stage, and relatively stable stage. With the increase in the bridge deck spacing, the excess temperature gradually decreases. Through dimensionless analysis and simulation data fitting, an empirical formula is established, which indicates the dimensionless maximum excess temperature of the truss shows a power function growth trend with the increase in the modified dimensionless heat release rate.
4.
The vertical excess temperature distribution of the truss above the fire source is investigated. The excess temperature increases along the truss, and the maximum excess temperature appears at the top of the truss. A model is established, which indicates the excess temperature along the truss conforms to exponential growth with the vertical distance under different bridge deck spacings (H). When H ≤ 10.6 m, the excess temperature varies slightly along the truss. When H ≥ 11.4 m, the change of excess temperature is great.

Author Contributions

Conceptualization, W.A.; Formal analysis, W.A.; Investigation, L.S., H.W. and T.Z.; Methodology, L.S. and T.Z.; Writing—original draft preparation, W.A. and L.S.; Writing—review and editing, W.A., H.W. and T.Z. All authors have read and agreed to the published version of the manuscript.

Funding

This research was funded by the Fundamental Research Funds for the Central Universities (Grant Number: 2021ZDPYYQ004).

Institutional Review Board Statement

Not applicable.

Informed Consent Statement

Not applicable.

Data Availability Statement

Not applicable.

Conflicts of Interest

The authors declare no conflict of interest.

References

  1. Garlock, M.; Paya-Zaforteza, I.; Kodur, V.; Gu, L. Fire hazard in bridges: Review, assessment and repair strategies. Eng. Struct. 2012, 35, 89–98. [Google Scholar] [CrossRef]
  2. Peris-Sayol, G.; Paya-Zaforteza, I.; Balasch-Parisi, S.; Alós-Moya, J. Detailed Analysis of the Causes of Bridge Fires and Their Associated Damage Levels. J. Perform. Constr. Facil. 2017, 31, 9. [Google Scholar] [CrossRef]
  3. Mendes, P.A.; Valente, J.C.; Branco, F.A. Simulation of ship fire under Vasco da Gama Bridge. ACI Struct. J. 2000, 97, 285–290. [Google Scholar]
  4. Branco, F.; Mendes, P.; Guerreiro, L. Special Studies for Vasco da Gama Bridge. J. Bridge Eng. 2000, 5, 3. [Google Scholar] [CrossRef]
  5. Bennetts, I.; Moinuddin, K. Evaluation of the Impact of Potential Fire Scenarios on Structural Elements of a Cable-Stayed Bridge. J. Fire Prot. Eng. 2009, 19, 85–106. [Google Scholar] [CrossRef]
  6. Smith, R.; Gogus, A.; Cormie, D.; Tehrani, P. Threat Mitigation Options in the Design of Cable-Stayed Bridges. In Proceedings of the Structures Congress 2014, Boston, MA, USA, 3–5 April 2014. [Google Scholar]
  7. Ataei, H.; Mamaghani, M.; Aboutaha, R.S. Finite Element Analysis of Cable-Stayed Strands’ Failure Due to Fire. In Proceedings of the 7th Congress on Forensic Engineering, Miami, FL, USA, 15–18 November 2015; American Society of Civil Engineers: New York, NY, USA, 2015. [Google Scholar]
  8. Floyd, J.E.; Mcgrattan, K.B.; Hostikka, S.; Baum, H.R. CFD fire simulation using mixture fraction combustion and finite volume radiative heat transfer. J. Fire Prot. Eng. 2003, 13, 11–36. [Google Scholar] [CrossRef]
  9. Karlsson, B.; Quintiere, J.G. Enclosure Fire Dynamics; CRC press: Boca Raton, FL, USA, 1999. [Google Scholar]
  10. Mcgrattan, K.B.; Forney, G.P.; Floyd, J.; Hostikka, S.; Prasad, K. Fire Dynamics Simulator (Version 5): User’s Guide; National Institute of Standards and Technology NIST. NIST Special Publication. 2007. Available online: https://nvlpubs.nist.gov/nistpubs/Legacy/SP/nistspecialpublication1019-5.pdf (accessed on 9 August 2022).
  11. Lie, T.T. Fire Resistance of Circular Steel Columns Filled with Bar-Reinforced Concrete. J. Struct. Eng. 1994, 120, 1489–1509. [Google Scholar] [CrossRef]
  12. Lie, T.T.; Celikkol, B. Method to calculate the fire resistance of circular reinforced concrete columns. ACI Mater. J. 1991, 88, 84–91. [Google Scholar]
  13. Wang, Y.; Liu, M. Buckling Instability Behavior of Steel Bridge under Fire Hazard. Math. Probl. Eng. 2016, 2016, 11. [Google Scholar] [CrossRef]
  14. Cui, C.; Chen, A.; Ma, R. Stability assessment of a suspension bridge considering the tanker fire nearby steel-pylon. J. Constr. Steel Res. 2020, 172, 106186. [Google Scholar] [CrossRef]
  15. Ingason, H. Design fire curves for tunnels. Fire Saf. J. 2009, 44, 259–265. [Google Scholar] [CrossRef]
  16. Gillard, J. Developments for the 21st Century. In Proceedings of the 9th International Symposium on Aerodynamics and Ventilation of Vehicle Tunnels, Aosta Valley, Italy, 6–8 October 1997. [Google Scholar]
  17. Mcgrattan, K.B. Fire Dynamics Simulator (Version 4): User’s Guide; National Institute of Standards and Technology: Gaithersburg, MD, USA, 2004. [Google Scholar]
  18. Mcgrattan, K.B.; Baum, H.R.; Rehm, R.G. Large eddy simulations of smoke movement. Fire Saf. J. 1998, 30, 161–178. [Google Scholar] [CrossRef]
  19. Tang, F.; He, Q.; Chen, L.; Li, P. Experimental study on maximum smoke temperature beneath the ceiling induced by carriage fire in a tunnel with ceiling smoke extraction. Sustain. Cities Soc. 2019, 44, 40–45. [Google Scholar] [CrossRef]
  20. Li, Y.Z.; Lei, B.; Ingason, H. The maximum temperature of buoyancy-driven smoke flow beneath the ceiling in tunnel fires. Fire Saf. J. 2011, 46, 204–210. [Google Scholar] [CrossRef]
  21. Quintiere, J.G.; Rinkinen, W.J.; Jones, W.W. The Effect of Room Openings on Fire Plume Entrainment. Combust. Sci. Technol. 1981, 26, 193–201. [Google Scholar] [CrossRef]
  22. Kurioka, H.; Oka, Y.; Satoh, H.; Sugawa, O. Fire properties in near field of square fire source with longitudinal ventilation in tunnels. Fire Saf. J. 2003, 38, 319–340. [Google Scholar] [CrossRef]
  23. Yang, D.; Huo, R.; Zhang, X.L.; Zhu, S.; Zhao, X.Y. Comparative study on carbon monoxide stratification and thermal stratification in a horizontal channel fire. Build. Environ. 2012, 49, 1–8. [Google Scholar] [CrossRef]
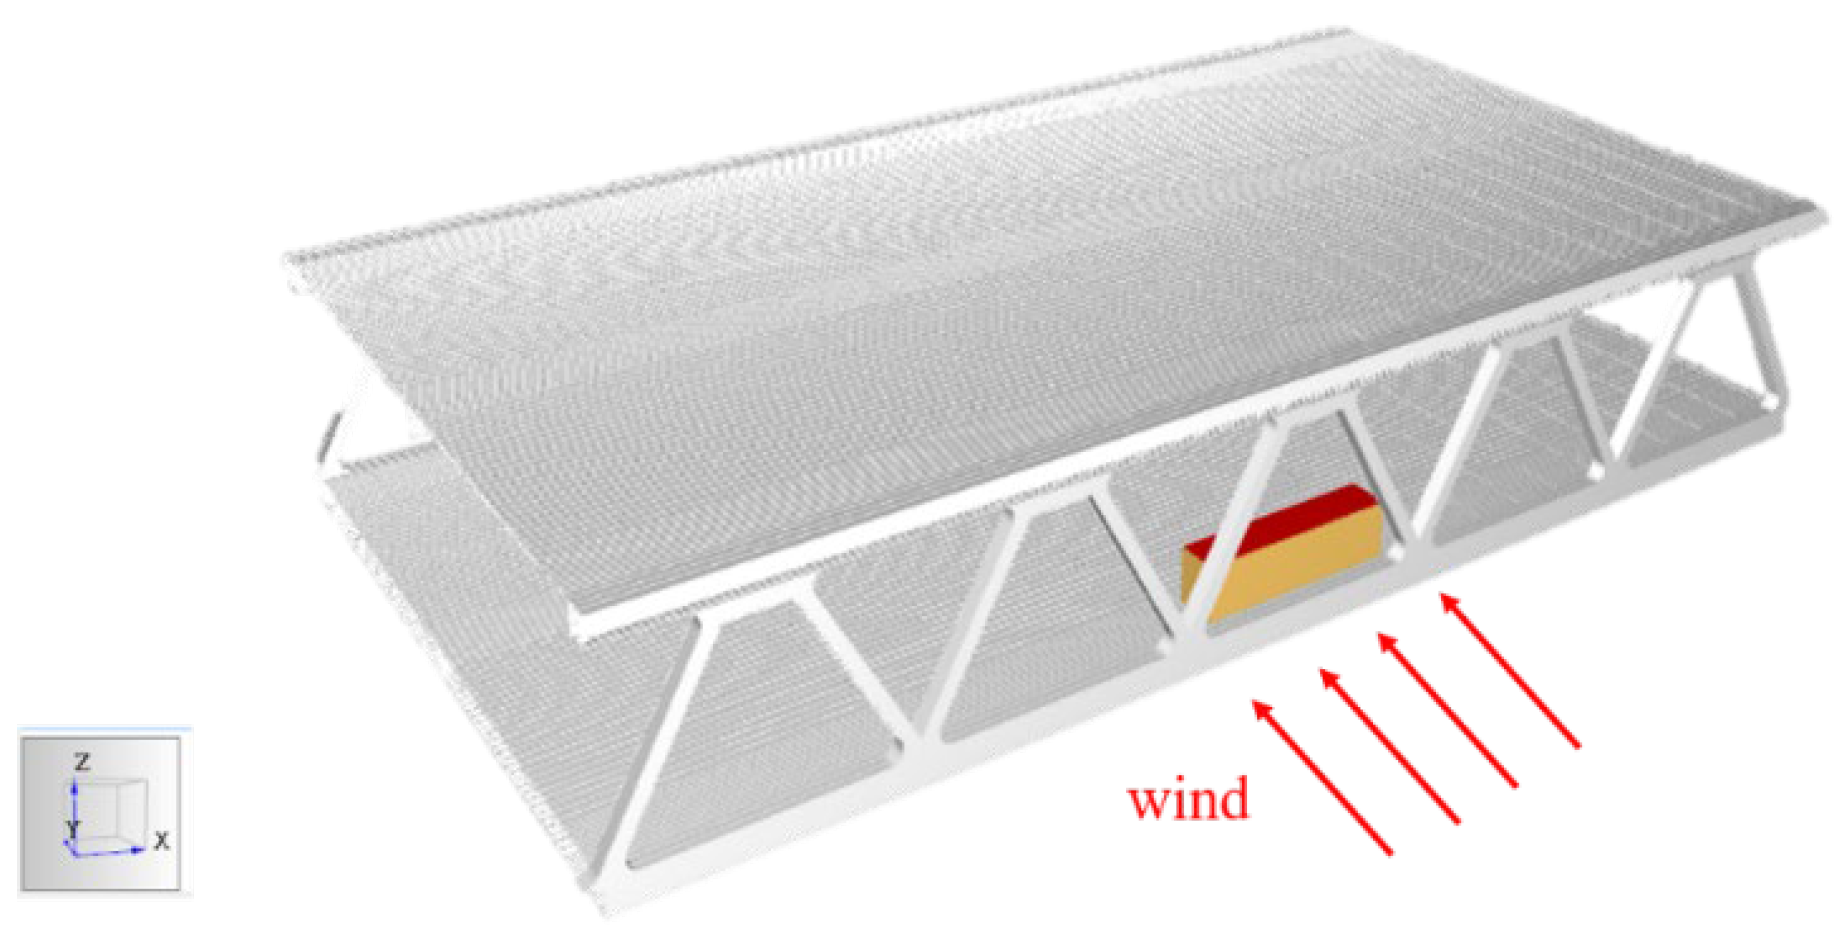
Figure 1. Three-dimensional (3D) view of the bridge.
Fire 05 00114 g001
Figure 2. Thermocouple distribution in the truss and ceiling of double-deck bridge model: (a) bottom of ceiling; (b) inner surface of truss.
Fire 05 00114 g002
Figure 3. Influence range on the ceiling at different bridge deck spacings: (a) H = 9.8; (b) H = 10.6; (c) H = 11.4; (d) H = 12.2; (e) H = 13.0; (f) H = 13.8.
Fire 05 00114 g003
Figure 4. The maximum excess temperature versus time beneath the ceiling.
Fire 05 00114 g004
Figure 5. Fitting of Li’s formula and simulation data.
Fire 05 00114 g005
Figure 6. Maximum excess temperature of the truss versus time.
Fire 05 00114 g006
Figure 7. Dimensionless maximum excess temperature of the truss versus modified dimensionless heat release rate.
Fire 05 00114 g007
Figure 8. Excess temperature along the truss versus normalized effective height: (a) H = 9.8; (b) H = 10.6; (c) H = 11.4; (d) H = 12.2; (e) H = 13.0; (f) H = 13.8.
Fire 05 00114 g008
Table 1. Parameters of materials used in the bridge model.
PropertyMaterialThermal Conductivity
(W/m2 K)
Density (kg/m3)Specific Heat
(kJ/kg K)
BridgeSteel47.5678500.48
Table 2. Parameter settings of simulation.
SettingsParameters
Ambient temperature20 °C
Ambient pressure101,300 Pa
Humidity40%
Ventilation velocity2 m/s
Bridge materialsteel
Simulation time4200 s
Fire typet2 unsteady state
Mesh size1 m × 1 m × 1 m
Table 3. Values of k′ under different bridge deck spacings.
H = 9.8H = 10.6H = 11.4H = 12.2H = 13.0H = 13.8
k1.060.844.654.431.8721.77
Publisher’s Note: MDPI stays neutral with regard to jurisdictional claims in published maps and institutional affiliations.