

Numerical Investigations on Water Mist Fire Extinguishing Performance: Physical and Sensitivity Analysis

1
INSA Centre-Val de Loire, Université d’Orléans, PRISME EA 4229, 18000 Bourges, Cher, France
2
EXEC SAS, 95190 Goussainville, Val d’Oise, France
3
INSA Centre-Val de Loire, Université d’Orléans, LaMé, EA 7494, 18000 Bourges, Cher, France
4
DGA Techniques Terrestres, 18000 Bourges, Cher, France
*
Author to whom correspondence should be addressed.
Fire 2022, 5(6), 176; https://doi.org/10.3390/fire5060176
Submission received: 5 September 2022
/
Revised: 5 October 2022
/
Accepted: 12 October 2022
/
Published: 26 October 2022
Abstract
:Fire safety is a changing science for which the dominant parameters that affect fire suppression are still not well defined. The aim of this work is to show that sensitivity analysis techniques can speed up and improve the design process of fire suppression experiments by water mists. The important parameters that play a role in the performance of water mists were confirmed using the CFD code FDS. Various sensitivity analysis methods based on the factorial design and variance decomposition are used with four input parameters (flow rate, spray cone angle, discharge duration and droplet diameter). In our case, results highlight the importance of the discharge duration for the performance of water mists in a confined environment and a strong non-linear effect of the spray cone angle on temperature when variance decomposition methods are used. Further works will be conducted in order to confirm that sensitivity analysis can be used for application in fire suppression by water mist.
1. Introduction
Fire remains an actual and important threat to humans and their infrastructure. It is estimated that 5000 fires ignite each day in the European Union, generating a yearly loss of €126 billion [1]. They are a growing threat to building infrastructures as more and more of them are built to sustain the world population and economic growth. Many protection devices against indoor fires exist, most of them relying on a nozzle delivering a fluid onto the fire, be it water, gas or foam. Halon-based extinguishing agents such as Halon 1301 have been used extensively in the past due to their efficiency to suppress fires, but their role in the destruction of the ozone layer has led to their ban by the Montreal Protocol in 1989 [2]. Since then, research on fire safety has focused on finding efficient and environment friendly alternatives.
Water is a prime candidate as a clean extinguishing agent as it is an abundant, inexpensive, and non-dangerous product, and sprinklers are already a mature and common way to protect indoor infrastructures. Today 96% of fires in sprinkler-protected buildings are controlled or extinguished by the system on the premises [3]. However, this technology is ineffective against oil and electrical fires and is not suitable to protect water sensitive infrastructure because the droplets’ diameter is too large and would cause further damage to the equipment. Water mists can provide a solution in this regard. They are defined by the NFPA 750 standard as a spray whose 99% of the flow-weighted cumulative volumetric distribution of water droplets have a diameter less than 1000 [4]. Many experiments go well below this limit and produce ultra-fine water mists whose droplets diameter is less than 10 . As the median droplet diameter decreases, the suppression mechanisms change. Traditional sprinklers suppress the fire by cooling the burning material because their droplets are large enough to go through the flame without evaporating. Water mists also have a cooling effect but the heat extraction source comes from the evaporation of the small droplets. This extracted heat turns the water droplets to steam, which expands and smothers the fire through oxygen displacement. Finally, the numerous and fine droplets form an opaque mist and block the radiative effect of the fire. Cui and Liu detailed the research progress on suppression rules of water mists on different types of fires [5]. Detailed reviews of fire suppression by sprinklers and water mists also exist [6,7].
Numerical studies have been conducted by fire safety engineers and researchers as both a cost-effective alternative to experiments and a way to explore new configurations on the fly. In their review, Shen et al. [8] detail many applications of CFD (Computational Fluid Dynamics) codes ranging from enclosure, jet and pool fires, gas dispersion and different types of explosions. While numerous codes related to fire and smoke development exist, the same cannot be said about fire suppression codes. CFD codes related to fire suppression can be divided into two categories: CFD and zone codes. Zone codes divide the combustion compartment into two layers, a “hot” upper one made up of the smoke and a “cold” lower one. They are often used to determine the transport of the smoke layer and related phenomena such as ceiling-jet or the possibility of a backdraft. Such codes are CFAST (National Institute of Standards and Technology), MAGIC (Électricité de France) and OEIL (Direction Générale de l’Armement). Apart from CFAST, which is free and open source, the others are either commercial or closed. CFD codes describe localized behaviors and Lagrangian particles more accurately than zone codes. They are more complete and versatile tools, but the associated computation time is usually higher than a zone code. Example codes are FDS (National Institute of Standards and Technology), OpenFOAM (OpenCFD Ltd.), SMARTFIRE (Fire Safety Engineering Group) and KFX (DNV). FDS and OpenFOAM are free and open source whereas KFX and SMARTFIRE are commercial. CFD codes can then be used to highlight water mist suppression mechanisms through the study of the influence of droplet size because they can be modeled using the Lagrangian paradigm [9,10,11]. Between the four presented CFD codes, the code FDS (Fire Dynamics Simulator) in its version 6.7.6 is used for the present work [12]. It is a well-tested and recognized large eddy simulation (LES) code in the fire safety domain when it comes to fire suppression.
Regarding the type of indoor environments typically studied in the available literature, they come in plenty of sizes and conditions. In the last decade, a lot of research has been done to explore different configurations. The effects of a confined space on water mists performance [13,14] as well as room geometry [15], ventilation conditions [16], the presence of objects shielding the fire [17], the type of burning material [18], the presence of added chemicals to the water [19] or the fire offset relative to the nozzle [20] were studied. They conducted parametric studies capable of describing water mist mechanisms, but more could be learned from CFD using sensitivity analysis.
Sensitivity analysis provides information as to which parameter has the most influence on the variation of one output quantity related to a model. It can be local, where the sensitivity of the parameters are relative to a fixed set of parameters, or global, where the entire space formed from the ranges taken by the parameters is explored. It is already used extensively in other fields of research. In fire science, it was used to determine a wildfire propagation model sensitivity using the factorial design [21] and a compartment fire scenario using global sensitivity analysis [22]. Nonetheless, fire suppression by water aspersion has never been investigated using such techniques.
CFD is used to save time in the design process of experiments and monitor a virtually unlimited amount of quantities in space over time. In turn, experiments improve the understanding of the fire suppression science and the results are used to improve numerical models. In this regard, the authors think that the use of sensitivity analysis in conjunction with CFD can hasten the understanding of the process of fire suppression. It speeds up the process of designing experiments by providing quantitative information between parameters and quantities of interest. This quantitative information allows the fine tuning of future experiments because they provide a precise range of values to explore and numerical models through the use of constants. For CFD itself, sensitivity analysis can be used to validate numerical models and compare the results to experimental data. Irregularities between numerical models and experimental conditions, especially the limiting cases of the model, can be explored using sensitivity analysis and are a source of ideas for future experiments.
In this article, CFD capabilities to model a simple water mist geometry are studied by reproducing as well as possible the experimental conditions of a small compartment fire and water suppression obtained by Yinshui et al. [23]. A series of sensitivity analyses will be conducted to demonstrate the feasibility and potential of this technique in the field of water mists fire safety and identify the most important parameters on water mists performances. Different sensitivity analysis techniques will be used and compared to determine which one provides the best results.
2. FDS Numerical Modeling
2.1. Governing Equations
The CFD code FDS solves a form of the Navier–Stokes equations of conservation of species, mass, momentum and energy appropriate for low-speed, thermally-driven flow with an emphasis on smoke and heat transport from fires. Turbulence is treated by means of LES. FDS uses the concept of “lumped species”, where a mixture of gas species for the air transport react together [24], pages 7–10. For example, air is a lumped species that consists of nitrogen, oxygen, and trace amounts of water vapor and carbon dioxide. The lumped species mass fractions Z are linearly related to the primitive species mass fractions Y using a matrix multiplication. From there all conservation equations can be derived. From there, all conservation equations can be derived. Here is the transport equation for a lumped species:
The summation of Equation (1) over all species gives the mass conservation equation:
Because of the low Mach number approximation, the internal energy and enthalpy may be related. The energy conservation equation can then be written in terms of the sensible enthalpy:
Finally, the momentum conservation equation can be written as:
Liquid droplets associated with water mist systems are modeled within the Lagrangian formalism [24] pages 100–101. Drag and drag reduction phenomenon are accounted as well. The liquid droplets diameter is represented by a combination of log-normal and Rosin–Rammler distributions using the cumulative volume diameter:
The longitude angle of the initial droplet position between 0 and is randomly chosen from a uniform distribution. The latitude between 0 and is randomly selected from the following distribution:
with controlling the peak of the distribution while is the spread parameter. If , the distribution is uniform. Each particle is assigned an initial velocity and direction normal to the position on the sphere. In its linearized form, the velocity of a particle is then dependent on the gas phase velocity, the gravitational acceleration and the drag force:
2.2. Computational Domain and Conditions
Before the different sensitivity analysis methods can be carry out, a FDS simulation must first be built. FDS 6.7.6 was used. Initial and boundary conditions were left at the default. Figure 1 shows the domain considered in the present work, based on Yinshui et al.’s [23] work. It consists of a 1 m × 1 m × 2 m compartment with acrylic walls. Ambient temperature is 20 °C. An exhaust vent (cyan) 20 cm in diameter is located at 1.80 m with an flow rate of 59 /. Because the aforementioned authors did not notice a pressure drop, air leaks coming from the 0.8 m × 0.8 m door (blue) were added.
On the floor lies a 314 diesel pool fire with a heat release rate of 516 . For the diesel pool fire, no indication of heat release rate (HRR) or mass loss was given by Yinshui et al. [23]. The standard t-squared model for the fire growth was therefore used. Dodecane was used as a surrogate as it has a close molecular formulation and is already well implemented in FDS. Fire growth rate for the dodecane is 0.047 [25]. The rise to a full-grown fire is achieved after 19 s.
In this preliminary work, the heat release rate approach was chosen and a ramp was prescribed for the growth and decrease of this quantity. First, an increasing ramp with a t-squared growth was applied until the maximum HRR was achieved. The points of this increasing ramp were specified each second. The ramp was then held constant until the water mist activation to model the full-grown phase of the fire. Next, a decreasing ramp with a linear profile was applied to model the fire suppression until the HRR reached zero. The time between maximum and zero HRR was aligned on what was specified in the experimental work as fire extinguishing time, a time after which the water discharge was halted. Because the fire was extinguished, the HRR was assumed to be close to zero. Furthermore, because the extinguishing time of 3 s is fast, a simple linear profile was chosen for the decreasing HRR ramp.
Although the authors are aware of the shortcomings of this approach in terms of fire suppression accuracy, we believe it is still sufficiently accurate as a first approach to provide general information on the dynamics of fires and their extinction by water, the objective of this work being to test sensitivity analysis methods on water mist systems. The HRR model could be improved using empirical data or numerical techniques such as described by Jenft et al. [9]. In their work, they relate the pyrolysis rate and the temperature of each fuel cell on the free burning phase. When water impinges a fuel cell, the computed temperature is used to force the corresponding pyrolysis rate. Another solution to further improve the numerical predictions would be to use a model based on the diesel characteristics and volume available rather than on the heat release rate, but it requires dedicated ignition.
A high-pressure water mist nozzle with an orifice of 1.0 mm, a solid spray angle of 60° and a flow rate of 2 is positioned 1.80 m above the fire. A thermocouple is located 0.45 m above the fire. Gas probes monitoring the O, CO and CO concentrations are situated at 1.30 m near the wall. An exhaust vent is located at 1.80 m from the ground. Free burning is allowed for 60 s before the water mist nozzle is activated for 3 s.
2.3. Mesh Sensitivity Analysis
In any CFD case, it is important to choose the correct mesh resolution. It is usually the best compromise between precision, computation time and computation power available. The FDS User Guide recommends an optimal mesh size by the non-dimensional number with the mesh size and the characteristic fire diameter related to the fire heat release rate.
In the NUREG-1824 [26], the United States Nuclear Regulatory Commission documents that is a reasonable condition and gives the range of mesh sizes (1.15 cm; 4.61 cm) to explore for the present study. In the present work, the best test case from Yinshui et al. in terms of suppression time was selected as the reference case. Five meshes were chosen for the mesh sensitivity analysis. Starting from the mesh size 4.0 cm producing a total of 31,250 total cells into the domain, we multiplied by 1.5, 2, 6 and 8 for the respective mesh sizes 3.3 cm, 3.1 cm, 2.2 cm and 2.0 cm. Finer meshes were not considered as the computational time of multiple days becomes prohibitive in the scope of the current study with dozens of simulation runs to perform for the sensitivity analysis. The resulting comparisons of temperature profile between the experimental result and the different meshes are presented in Figure 2. The results of the sensitivity mesh analysis are presented in Table 1.
The absolute error computed between the experimental and the numerical average temperature decreases as the mesh size decreases, ranging from 40.3% to 2.0%. The calculation time ranges from 2.1 h to 26.3 h. There is a substantial gap between mesh sizes 2.2 cm and 2.0 cm in terms of absolute error, which is divided by 13, from 26.9% to 2.0%, whereas the computation time is only multiplied by 1.5, from 17.6 h to 26.3 h. Therefore, the mesh size of 2cm was selected as reference for the validation case. The time step based on the CFL criterion was automatically adjusted by FDS through the mesh sensitivity analysis.
2.4. Validation Case
FDS capabilities to reproduce the water mist fire suppression mechanisms are discussed here. Efforts are focused on reproducing the results of the first test of Yinshui et al. [23] that has one of the best extinguishing times and for which both temperature and O, CO, and CO gas concentrations are given. Figure 3 presents the evolution of the temperature inside the compartment for times 10 s (fire development), 45 s (fully developed fire), 62 s (on-going suppression) and 70 s (extinguished fire) using a vertical median plane. It can be seen that the exhaust ventilation has an effect on the water mist droplets spatial distribution inside the volume. Instead of being centered on the fire, the spray cone highlighted in red is tilted from its nominal axis, probably under the influence of the exhaust air flow.
Figure 4a presents the evolution of the O volume fraction inside the compartment for the same time steps as Figure 3. The oxygen displacement is visible if the comparison between 45 s and 62 s is made for region of the flame, because the located green and cyan colors are replaced with a diffuse and turbulent yellow tint. The phenomenon affects the whole lower half of the compartment as even regions with an orange tint around the flame turned to yellow. The same conclusion can be made about the concentrations of carbon dioxide (Figure 4b) and monoxide (Figure 4c). Overall, the high-pressure nozzle homogenizes an otherwise localized accumulation or lack of gaseous species.
Temperature and species quantities have also been monitored over time from the sensor positions described above and are compiled in Figure 5. The temperature profile is presented on Figure 5a and is accurately reproduced from 0 to 60 s. The peak of the temperature is higher in the simulation (563 °C) than in the experiment (530 °C). The decrease in temperature following the water mist activation is sharper in the simulation than the observed experimental results, which is due to the imposed decrease of HRR. This is the largest variation of all four studied quantities in the fire suppression time period and is an indication of the limits of our FDS model. The gas concentrations presented in Figure 5b–d are well reproduced by the FDS simulations.
The oxygen concentration decreases linearly as the fire burns. It reaches a constant value of 18.5% after the fire suppression. This behavior highlights the oxygen displacement because no more oxygen is consumed by the fire after suppression. The carbon dioxide concentration rise becomes noticeable after 40 s of free burn and continues to rise after the fire suppression up until 100 s. After this time, it also reaches a constant value of 1.0%. The rise of carbon monoxide concentration is also slow with a slightly sharper rise in the simulation. As for the carbon dioxide, the concentration rises after the fire suppression that happens after 60 s. The final value of concentration is around 215 ppm.
3. Sensitivity Analysis Theory
3.1. Sensitivity Analysis Introduction
The performance of a water mist system depends on many parameters such as the water flow rate, the spray cone angle, the nominal pressure, the droplets size distribution, the presence of ventilation or obstacles, etc. However, it is difficult to conduct experimental studies by varying these parameters at the same time, not considering that some of them can be hard to measure for large ranges of values. It is therefore important to know in advance which parameters are of importance and must be taken into account in an experimental study and which ones can be fixed to a nominal value because they have little impact on the experiences’ outputs.
In the present work, three different sensitivity analyses are investigated and compared: complete factorial design, variance decomposition of simple models and variance decomposition based on chaos polynomials to compute Sobol indices. For the variance decomposition, a quasi-random sampling was used. The input parameters are the water mist flow rate (Q), spray cone angle (), discharge duration () and the median droplet diameter (), while the output quantities are () the mean temperature, () the mean O volume fraction, () the mean CO volume fraction and () the mean CO mass fraction in ppm. The discharge duration can seem an odd parameter to include as most water mists deliver water continuously until human intervention, but it can be a critical parameter when the amount of available water is limited. Table 2 sums up the different configurations of sensitivity analysis studied in the present work. Input parameters are taken at their sensors positioned as detailed above. This position has an influence on the sensitivity analysis results because a sensor closer to the fire is more sensitive to the fire dynamics than a sensor in the far field. In the scope of the sensitivity analysis, the studied m output quantities are expressed as functions of the n input parameters that can be decomposed into sub-functions of independent variables and their interactions.
Techniques such as Monte Carlo allow the use thousands of simulations to discover the functions , but FDS calculations are time-expensive. It follows that a model approximation must be chosen first. With the small number of simulations performed, the coefficients of the approximation are computed using the least-squares method.
3.2. Complete Factorial Design
The factorial design is a sensitivity analysis technique that explores the behavior of a model on the edges of a region delimited by an upper and a lower bound. Each of the n input parameters of the model described above is evaluated at two normalized levels (). It follows that simulations must be performed.
Using the complete factorial design method, a simple linear model is chosen. The m output quantity studied are then expressed as:
with being the output quantity, the coefficients of the polynomials and the input parameter. It can be rewritten in a more condensed way:
Each can then be rewritten from (11) with the matrix form that can then be used to extract the vector of coefficients from (direct inversion of the matrix). From the coefficients, the importance of each input parameter can be determined.
3.3. Variance Decomposition
In the variance decomposition method, input parameters are considered as random variables taking values inside a range using a given distribution. In our case, two models are used to fit the results of the simulations series. The first is the “linear” model used for the complete factorial design as described in Equation (11). The second one, a “non-linear” model, has extra quadratic terms added as described in Equation (11). This allows us to discover potential nonlinear relations between the input parameters and bridge the gap between the linear model and the one used by the chaos polynomials to allow for an easier comparison.
In the variance decomposition method, (11) is decomposed into a sum of partial variances:
The Sobol indices can then be computed by dividing by the total variance of the model with the following property:
These Sobol indices can be computed using a specialized library like SALib or a home-grown code.
3.4. Polynomial Chaos Expansion
The polynomial chaos expansion is valued to conduct global sensitivity analyses and is already used extensively for finite elements analysis. It allows easier computation of the Sobol indices directly from the stochastic coefficients of the model because of the orthogonal property of the generated polynomials, but the model is then set as a constraint. Because the input parameters are sampled using a uniform distribution, the model is decomposed using the Legendre polynomials. In the present work, the model decomposition follows the mathematical framework described by Wang et al. [22].
is a finite set of vectors defined by with the classical criterion to save on computational time as well as the number of stochastic coefficients and p the maximum order allowed for each monovariate Legendre polynomial that the multivariate polynomial is composed of.
In general, with n input parameters and the maximum order p allowed for each monovariate polynomial, the number of coefficients to compute is given by . In this work, the truncature is set using .
The process of variance decomposition is the same as before. The stochastic coefficients are determined using the least squares method as there are more sampling points (simulations) than coefficients. Because of the orthogonality properties of the Legendre polynomials, the Sobol indices are trivially derived from the stochastic coefficients. The total variance and Sobol indices of the first and second order are expressed as:
4. Results and Discussions
The sensitivity analysis techniques and models described above were then applied to the numerical predictions from the CFD model that was studied in the validation case. The third and fourth order interactions were supposed to be negligible. Table 3 presents the upper and lower values used for all sensitivity analysis methods. In order to obtain a visual representation of the significance of each parameter and their interactions, all the results are presented below in the form of Pareto charts, where parameters are presented in decreasing order. To allow for better comparison with the variance decomposition method, factorial design results are taken with absolute values.
4.1. Complete Factorial Design
Figure 6 depicts the effect of the input parameters on the different output quantities using a complete factorial design with respect to the model described in Equation (11). A coefficient close to zero means that the concerned parameter has no influence whereas a coefficient close to one suggests that the parameter has the most influence. Figure 6a presents such effects for the temperature. It can be observed that the discharge duration is the most significant parameter with a coefficient of 0.50, followed by the droplet diameter at 0.11. For the O volume fraction in Figure 6b, the most important parameter is at 0.45, followed by the cone spray angle at 0.21. For the CO volume in Figure 6c and the CO mass fraction in Figure 6d, the most important parameters are at 0.59, the total volume of water sprayed and the cone spray angle at 0.11 and 0.10.
From all four sub-figures, the importance of the discharge duration for the variation of the output quantities is apparent. This trend can be explained, as a fire is a chemical phenomenon with a lot of inertia that remains thermally active long after actions have been taken to suppress it and can even reignite if the suppression is not long enough to reach extinction. It is therefore understandable that the discharge duration is an important parameter for the temperature decrease. This parameter as well as the flow rate relate directly to the total amount of water sprayed, but the flow rate is not as prominent. This is due to the model employed within FDS, highlighted by the sudden decrease in temperature as seen on Figure 5a. The more important the discharge duration is, the more the average temperature will be affected. In the factorial design, only the minimum and maximum values are explored and so the influence of the discharge duration may be overestimated. The intermediate values of all parameters must then be explored through the variance decomposition model to confirm or disprove this trend.
4.2. Variance Decomposition with a Linear Model
Figure 7 presents the Sobol indices of the first and second order with respect to the model described in Equation (11). Figure 7a shows the effects relative to the temperature. The most significant parameter is the interaction at 0.47. It is then followed by the at 0.21 and at 0.14. For the O volume fraction in Figure 7b the most important parameters are , , and Q with respective effects 0.30, 0.22, 0.18 and 0.14. For the CO volume in Figure 7c and the CO mass fraction in Figure 7d, the most significant parameter is the discharge duration at 0.31, followed by at 0.23 and at 0.22.
Through this analysis, it seems that the discharge duration is not as influential on the temperature as the factorial design made it appear to be. Figure 7 shows the importance of the cone spray angle most notably on the temperature through its interactions and , whereas this trend was not observed when only the edges of the ranges of values for the input parameters were considered in the complete factorial design. To better understand if the spray cone angle has importance in itself as implied by the previous results, non-linear relationships between the output quantities and the input parameters must be explored.
4.3. Variance Decomposition with a Non Linear Model
Figure 8 presents the Sobol indices of the first and second order with respect to the model described in Equation (13). Figure 8a shows the effects relative to the temperature. The most significant coefficient is the spray cone angle at 0.37 and at 0.29. The same distribution is observed for the O volume fraction in Figure 8b with effects at 0.38 and 0.17. For the CO volume in Figure 8c and the CO mass fraction in Figure 8d, stays the most influential parameter at 0.55.
With the extra quadratic terms added in the model, the influence of the spray cone angle for the temperature and concentration of O is now apparent. The interactions containing are following. For the CO volume fraction and CO mass fraction, the discharge duration is still the most impactful parameter.
4.4. Variance Decomposition with Chaos Polynomials
Figure 9 presents the Sobol indices of the first and second order with respect to the model described in Equation (18). The dominant parameters are the same as for the “non linear” model. This makes sense because the model resulting from the chaos polynomials can be closely related to the previous one. Figure 9a shows the effects relative to the temperature. The most significant coefficient is the spray cone angle at 0.37 and at 0.28. The same distribution is observed for the O volume fraction in Figure 9b with effects at 0.27 and 0.23. For the CO volume in Figure 9c and the CO mass fraction in Figure 9d, stays the most influential parameter at 0.45.
The previous results from Figure 9 are confirmed using the chaos polynomials. The spray cone angle remains dominant. The droplet size appears to be influential through an interaction with the dominant parameter for every output quantities.
From Figure 6 to Figure 9, the importance of the discharge duration and the spray cone angle were highlighted. These trends confirm the experimental results by Yinshui et al. [23], as outputted in Figure 10. When the spray cone angle decreases on Figure 10a from 120° to 60°, the temperature falls from 240 °C to 113 °C 40 s after the water mist is activated, at 100 s. It represents a difference of 53%. The same trend is observed when the discharge duration increases on Figure 10c from 2.7 s to 40, the temperature difference at 100 s is 80%. However, when looking at the results for a given spray angle of 60 °C between Figure 10a,b), the increase in flow rate from 2 to 5 translates only in a 13% decrease for the temperature at 100 s. The same conclusions can be made for the other angles.
4.5. Sensitivity Analyses Methods Comparison
Comparisons between the previous methods are carried out based on the experimental data of Yinshui et al. [23] to determine which is of interest in the field of fire safety. The different models and their coefficients computed in the previous part were tested against the validation case. The absolute error between the predicted and experimental value are compiled in Table 4.
It can be seen that the factorial design globally performs better on all output quantities for the validation case than the different variance decomposition methods. It should be the preferred way to study the sensitivity of a system to its input parameters. It requires few simulation runs, and fractional designs even allow it to keep the number of simulations to a minimum even though the number of parameters to study rises. Factorial designs are easily implemented numerically and can be carried out concurrently to experimental factorial designs. If a statistical method should be preferred to extensively test a given model throughout the whole hyperspace of input parameters, the chaos polynomials method should be selected as the analytic and direct calculation of the Sobol indices are easier and the model can easily be extended in terms of ranges for the input parameters or the maximum order allowed for the model.
5. Conclusions
Sensitivity analysis methods were applied with success to fire suppression by water mist systems using numerical tools. New quantitative insights into the relations between several key parameters of the fire suppression system were obtained. The results show that spray angle is a quantity of interest for the design of experiments and temperature decrease and that the importance of quantities such as the droplet size can sometimes be overestimated for some configuration. A concrete application of the current result is that the spray cone angle should be more influential in the fire protection design of a small room and might have more impact than the flow rate or the droplet size. This novel approach was made in two times.
The suppression of a diesel compartment fire by a water mist system based on experimental results produced by Yinshui et al. [23] was first numerically investigated using the CFD code FDS and a heat release rate approach. After conducting a mesh sensitivity analysis, a validation case was performed. The gas concentrations of O, CO and CO were correctly reproduced from start to finish. The predicted temperature decrease was overestimated.
Sensitivity analyses were then conducted using the factorial design and a statistical global method using the variance decomposition of a chosen model. Linear model, non-linear model and chaos expansion were investigated. The water flow rate Q, spray cone angle , discharge duration and the droplet size served as input parameters.
The obtained results for the temperature indicate that the discharge duration is the most influential parameter with the linear model and that the spray cone angle is dominant when quadratic terms are added in the model. This is supported by the quadratic relationship that exists between the spray cone angle and the surface area covered on the ground by the water mist. The expected results can be obtained using sensitivity analysis, and thus confirm that such techniques are suitable for fire suppression studies.
Since the feasibility has been assessed, future works will focus on improving and refining the techniques presented in this article. The combustion models of numerical simulations will be improved and compared to our own experimental results, in order to rely on more accurate data. Concurrently, efforts will be made to refine the aforementioned sensitivity analysis techniques and develop new ones, for examples based on fractional design or chaos polynomials with extended numbers of parameters and different distributions.
Author Contributions
Conceptualization, A.R., K.C. and A.O.; methodology, A.R. and É.F.; software, A.R.; validation, A.R., K.C. and A.C.; formal analysis, A.R. and É.F.; data curation, A.R.; writing—original draft preparation, A.R.; writing—review and editing, A.C.; visualization, A.R.; supervision, K.C.; project administration, K.C. All authors have read and agreed to the published version of the manuscript.
Funding
APR-IR EPIC project from the Centre-Val de Loire Region, LabCom GreenSprink project from the French National Research Agency (ANR) and RAPID VIPERE project from the French Agency for Defense Innovation (AID).
Institutional Review Board Statement
Not applicable.
Informed Consent Statement
Not applicable.
Data Availability Statement
All data, models, or code that support the findings of this study are available from the corresponding author upon reasonable request.
Acknowledgments
The authors gratefully acknowledge the support and funding from the Centre-Val de Loire Region in the scope of the APR-IR project EPIC, as well as the French National Agency for Research (ANR) and the Agency for Defense Innovation (AID) in the scope of the LabCom GreenSprink and RAPID VIPERE projects, respectively. The Agency for Defense Innovation and the Centre-Val de Loire Region are gratefully acknowledged for the PhD sponsorship of the first author.
Conflicts of Interest
The authors declare no conflict of interest.
References
- Fire Safe Europe. European Fire Safety Strategy; Fire Safe Europe: Etterbeek, Belgium, 2018. [Google Scholar]
- Office of Environmental Quality. Abstract of The Montreal Protocol on Substances That Deplete the Ozone Layer; Office of Environmental Quality: Richmond, VA, USA, 2021.
- Modern Building Alliance. The European Union Fire Safety Guide; Modern Building Alliance: Bruxelles, Belgium, 2019. [Google Scholar]
- National Fire Protection Association. NFPA 750 Standard on Water Mist Fire Protection Systems; National Fire Protection Association: Quincy, MA, USA, 2019. [Google Scholar]
- Cui, Y.; Liu, J. Research progress of water mist fire extinguishing technology and its application in battery fires. Process Saf. Environ. 2021, 149, 559–574. [Google Scholar] [CrossRef]
- Liu, Z.; Kim, A. A Review of Water Mist Fire Suppression Systems—Fundamental Studies. J. Fire Prot. Eng. 1999, 10, 32–50. [Google Scholar]
- Adbulrahman, S.; Chetehouna, K.; Cablé, A.; Skreiberg, O.; Kadoche, M. A review on fire suppression by fire sprinklers. J. Fire Sci. 2021, 39, 512–551. [Google Scholar] [CrossRef]
- Shen, R.; Jiao, Z.; Parker, T.; Sun, Y.; Wang, Q. Recent application of Computational Fluid Dynamics (CFD) in process safety and loss prevention: A review. J. Loss Prevent. Proc. 2020, 67, 104252. [Google Scholar] [CrossRef]
- Jenft, A.; Collin, A.; Boulet, P.; Pianet, G.; Breton, A.; Muller, A. Experimental and numerical study of pool fire suppression using water mist. Fire Safety J. 2014, 67, 1–14. [Google Scholar] [CrossRef]
- Wang, Z.; Wang, W.; Wang, Q. Optimization of water mist droplet size by using CFD modeling for fire suppressions. J. Loss Prevent. Proc. 2016, 44, 626–632. [Google Scholar] [CrossRef]
- Liu, H.; Wang, C.; Cordeiro, I.M.C.; Yuen, A.C.Y.; Chen, Q.; Chan, Q.N.; Kook, S.; Yeoh, G.H. Critical assessment on operating water droplet sizes for fire sprinkler and water mist systems. J. Build. Eng. 2020, 28, 100999. [Google Scholar] [CrossRef]
- National Institute of Standards and Technology. FDS 6.7.6 and Smokeview 6.7.16 GitHub Page; National Institute of Standards and Technology: Gaithersburg, MD, USA, 2021.
- Lee, J. Numerical analysis on the rapid fire suppression using a water mist nozzle with a door opening. Nucl. Eng. Technol. 2019, 51, 410–423. [Google Scholar] [CrossRef]
- Liang, T.S.; Liu, Z.L.; Xiao, X.K.; Luo, S.M.; Liao, G.X.; Zhong, W. Experimental and Numerical Study of Fire Suppression Performance of Ultra-Fine Water Mist in a Confined Space. Procedia Eng. 2013, 52, 208–213. [Google Scholar] [CrossRef] [Green Version]
- Zhang, P.; Tang, X.; Tian, X.; Liu, C.; Zhong, M. Experimental study on the interaction between fire and water mist in a long and narrow space. Appl. Therm. Eng. 2016, 94, 706–714. [Google Scholar] [CrossRef]
- Lee, J. Numerical analysis of how ventilation conditions impact compartment fire suppression by water mist. Ann. Nucl. Energy 2020, 136, 107021. [Google Scholar] [CrossRef]
- Liu, Y.; Wang, X.; Liu, T.; Ma, J.; Li, G.; Zhao, Z. Preliminary study on extinguishing shielded fire with water mist. Process Saf. Environ. 2020, 141, 344–354. [Google Scholar] [CrossRef]
- Pancawardani, F.; Arini, D.; Yunindar, R.P.; Ramadhan, M.L.; Imran, F.A.; Nugroho, Y.S. Analysis of Water Mist Fire Suppression System Applied on Cellulose Fire. Procedia Eng. 2017, 170, 344–351. [Google Scholar] [CrossRef]
- Koshiba, Y.; Sugimoto, M. Fire-suppression capability of surfactant-free aqueous dispersions of submicron-sized ferrocene particles. Case Stud. Therm. Eng. 2021, 28, 101459. [Google Scholar] [CrossRef]
- Lee, J.; Moon, J. Numerical analysis of the effect of horizontal distance between a water mist nozzle and ignition source on reduction in heat release rate. Ann. Nucl. Energy 2020, 144, 107560. [Google Scholar] [CrossRef]
- Abed, S.A.; Settar, A.; Chetehouna, K.; Kadiri, M.; Tabach, E.E.; Gascoin, N. Numerical study on a porous material subject to SiC particles deposition, using OpenFOAM and sensitivity analysis technique: Effect of clogging evolution on the thermal performances. Chem. Eng. Sci. 2020, 212, 115321. [Google Scholar] [CrossRef]
- Wang, A.; Manescau, B.; Serra, Q.; Chetehouna, K.; Florentin, E.; Izarra, C.D. Numerical simulations of outdoor wind effects on smoke spreading along a corridor: Physical and sensitivity analysis. Int. J. Therm. Sci. 2019, 142, 332–347. [Google Scholar] [CrossRef]
- Yinshui, L.; Zhuo, J.; Dan, W.; Xiaohui, L. Experimental research on the water mist fire suppression performance in an enclosed space by changing the characteristics of nozzles. Exp. Therm. Fluid Sci. 2014, 52, 174–181. [Google Scholar] [CrossRef]
- National Institute of Standards and Technology. Fire Dynamics Simulator Technical Reference Guide Volume I; Mathematical Model, Nist Special Publication 1018-1 Sixth Edition; National Institute of Standards and Technology: Gaithersburg, MD, USA, 2021.
- Karlsson, B.; Quintere, J.G. Enclosure Fire Dynamics; CRC Press: Boca Raton, FL, USA, 2000; p. 54. [Google Scholar]
- United States Nuclear Regulatory Comission. Verification and Validation of Selected Fire Models for Nuclear Power Plant Applications; NRC Staff: Washington, DC, USA, 2007. [Google Scholar]
Figure 1.
Domain studied in the present work with the grid displayed.
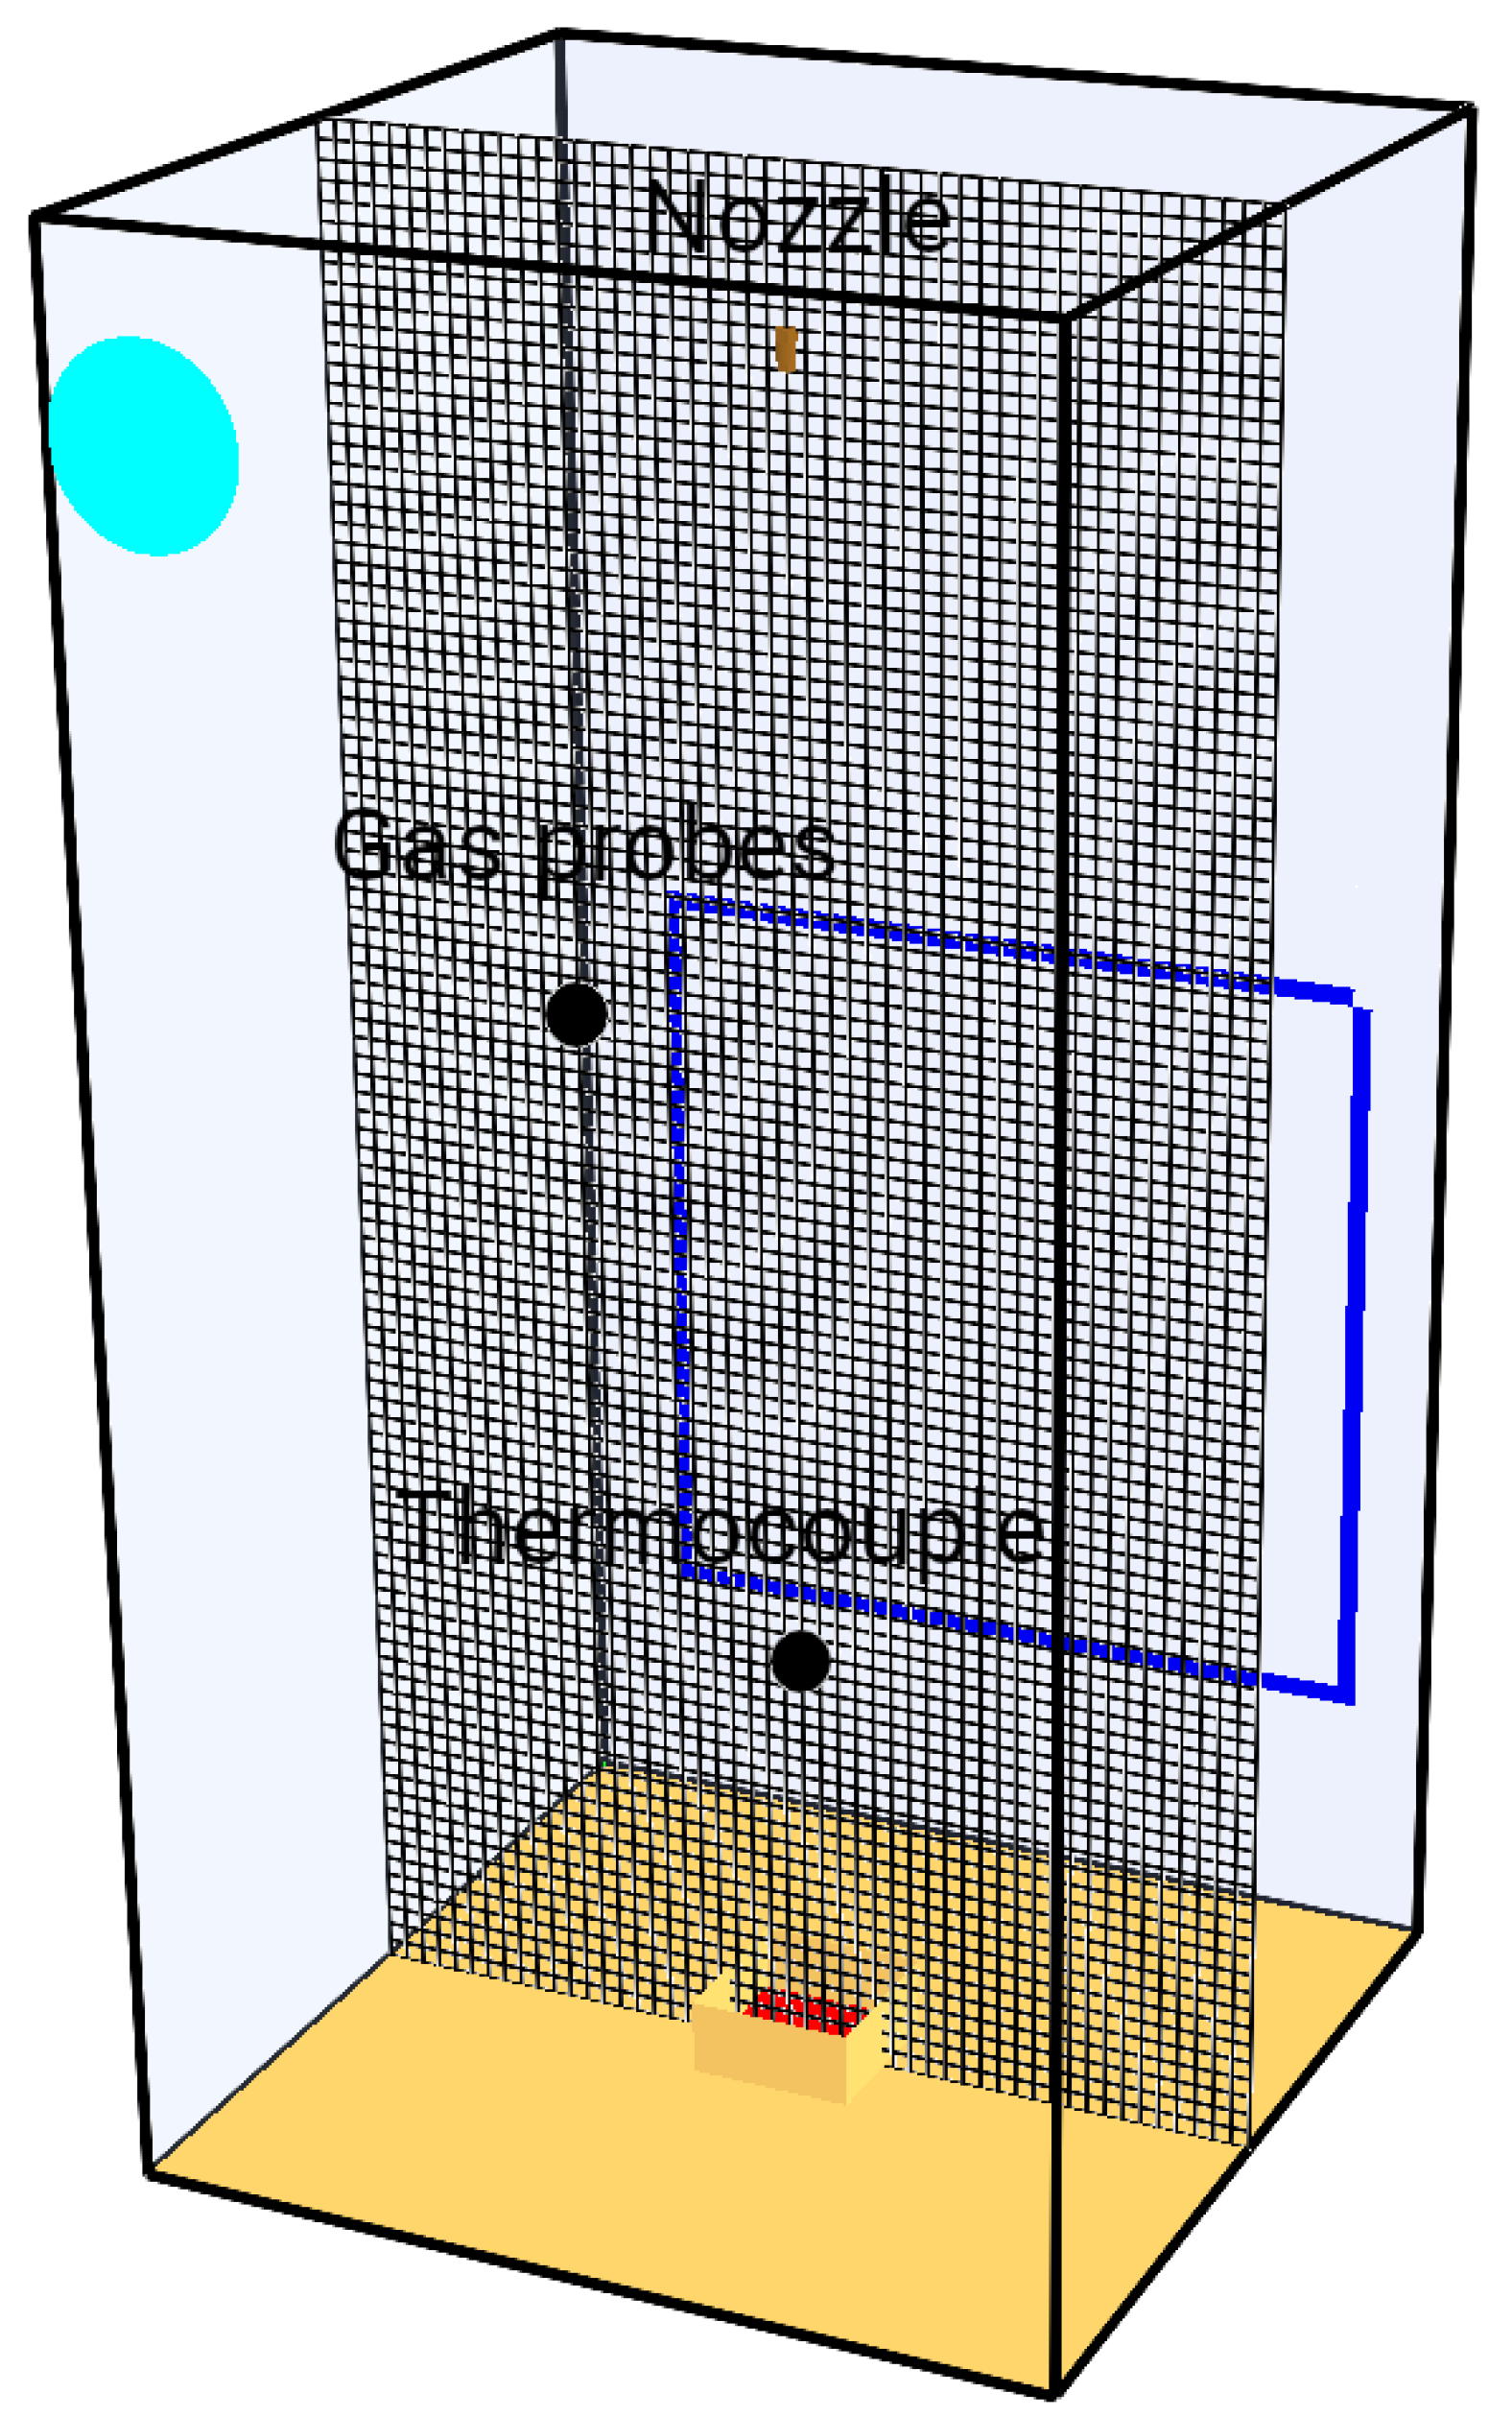
Figure 2.
Mesh sensitivity analysis comparison with experimental data.

Figure 3.
Temperature (°C) at the vertical median plane at 10, 45, 62 and 70 s, with water mist spray cone highlighted in red.
Figure 3.
Temperature (°C) at the vertical median plane at 10, 45, 62 and 70 s, with water mist spray cone highlighted in red.

Figure 4.
O, and CO volume fractions and CO mass fraction at the vertical median plane at 10, 45, 62 and 70 s.
Figure 4.
O, and CO volume fractions and CO mass fraction at the vertical median plane at 10, 45, 62 and 70 s.

Figure 5.
Comparison of temperature and gas concentrations profiles between experimental and numerical results. (a) temperature (b) oxygen volume fraction (c) carbon dioxide volume fraction (d) carbon monoxide mass fraction.
Figure 5.
Comparison of temperature and gas concentrations profiles between experimental and numerical results. (a) temperature (b) oxygen volume fraction (c) carbon dioxide volume fraction (d) carbon monoxide mass fraction.

Figure 6.
Effects of the input parameters on the output quantities for the factorial design method.

Figure 7.
Effects of the input parameters on the output quantities for the variance decomposition method using a linear model.
Figure 7.
Effects of the input parameters on the output quantities for the variance decomposition method using a linear model.

Figure 8.
Effects of the input parameters on the output quantities for the variance decomposition method using a nonlinear model.
Figure 8.
Effects of the input parameters on the output quantities for the variance decomposition method using a nonlinear model.

Figure 9.
Effects of the input parameters on the output quantities for the variance decomposition method using chaos polynomials expansion.
Figure 9.
Effects of the input parameters on the output quantities for the variance decomposition method using chaos polynomials expansion.

Figure 10.
Experimental plots derived from Yinshui et al. [23] with variation of the spray cone angle (a), discharge duration (c) and flow rate (between (a,b)).
Figure 10.
Experimental plots derived from Yinshui et al. [23] with variation of the spray cone angle (a), discharge duration (c) and flow rate (between (a,b)).


Table 1.
Mesh sizes sensitivity analysis in terms of computation time and absolute error.
| Mesh Size (cm) | Number of Cells | CPU Time (h) | Absolute Error (%) |
|---|---|---|---|
| 4.0 | 31,250 | 2.1 | 40.3 |
| 3.3 | 54,000 | 4.0 | 39.4 |
| 3.1 | 65,536 | 5.2 | 32.7 |
| 2.2 | 182,250 | 17.6 | 26.9 |
| 2.0 | 250,000 | 26.3 | 2.0 |
Table 2.
Configurations investigated for sensitivity analyses.
| Method | Sampling | Model(s) | Number of Simulations |
|---|---|---|---|
| Factorial design | Determined | Linear | 16 |
| ANOVA | Quasi-random | Linear Non-linear Chaos expansion | 32 |
Table 3.
Range of input parameters for the sensitivity analyses.
| Input Parameter | Unit | Minimum | Maximum |
|---|---|---|---|
| Q | L/min | 2.0 | 5.0 |
| deg | 60 | 120 | |
| s | 2.0 | 40.0 | |
| µm | 80 | 130 |
Table 4.
Absolute error between the predicted values for the different output quantities and the experimental results of Yinshui et al. [23] for the validation case.
Table 4.
Absolute error between the predicted values for the different output quantities and the experimental results of Yinshui et al. [23] for the validation case.
| Sensivity Analysis Method | Temperature | O Concentration | CO Concentration | CO Concentration |
|---|---|---|---|---|
| Factorial design | 23% | 2% | 16% | 12% |
| Linear ANOVA | 31% | 5% | 28% | 26% |
| Nonlin. ANOVA | 29% | 5% | 24% | 21% |
| Chaos ANOVA | 29% | 5% | 24% | 21% |
Publisher’s Note: MDPI stays neutral with regard to jurisdictional claims in published maps and institutional affiliations. |
© 2022 by the authors. Licensee MDPI, Basel, Switzerland. This article is an open access article distributed under the terms and conditions of the Creative Commons Attribution (CC BY) license (https://creativecommons.org/licenses/by/4.0/).
Share and Cite
MDPI and ACS Style
Robinet, A.; Chetehouna, K.; Cablé, A.; Florentin, É.; Oger, A. Numerical Investigations on Water Mist Fire Extinguishing Performance: Physical and Sensitivity Analysis. Fire 2022, 5, 176. https://doi.org/10.3390/fire5060176
AMA Style
Robinet A, Chetehouna K, Cablé A, Florentin É, Oger A. Numerical Investigations on Water Mist Fire Extinguishing Performance: Physical and Sensitivity Analysis. Fire. 2022; 5(6):176. https://doi.org/10.3390/fire5060176
Chicago/Turabian StyleRobinet, Antonin, Khaled Chetehouna, Axel Cablé, Éric Florentin, and Antoine Oger. 2022. "Numerical Investigations on Water Mist Fire Extinguishing Performance: Physical and Sensitivity Analysis" Fire 5, no. 6: 176. https://doi.org/10.3390/fire5060176