Next Article in Journal
Enhanced Anti-Freezing Heating Cable Standard for Fire Prevention
Next Article in Special Issue
Decision Support Models and Methodologies for Fire Suppression
Previous Article in Journal
Full-Scale Experiments of Water-Mist Systems for Control and Suppression of Sauna Fires
Previous Article in Special Issue
Chromatic Coding (ConForest_RGB) for the Detection of Spatial-Temporal Patterns in Collective Lands in Galicia (Spain)
 
 
Correction published on 21 February 2023, see Fire 2023, 6(3), 80.
Article

Effectiveness in Mitigating Forest Fire Ignition Sources: A Statistical Study Based on Fire Occurrence Data in China

1
State Key Laboratory of Fire Science, University of Science and Technology of China, Hefei 230027, China
2
College of Forestry and Landscape Architecture, Anhui Agricultural University, Hefei 230036, China
*
Author to whom correspondence should be addressed.
Fire 2022, 5(6), 215; https://doi.org/10.3390/fire5060215
Submission received: 21 November 2022 / Revised: 11 December 2022 / Accepted: 12 December 2022 / Published: 14 December 2022 / Corrected: 21 February 2023
(This article belongs to the Special Issue Spatial Statistics and Operational Research for Wildfires Management)

Abstract

:
Control of forest fire ignition sources is the top priority in fire management practices. China has gained great success in reducing forest fires in recent years, and the relevant safety measures taken during this process are worthy of investigation and publicity. Based on fire statistical data through the years between 2003 and 2017, we analyzed the detailed classification of fire ignition sources and their contribution to the annual forest fire occurrence. The role of different ignition sources in altering fire occurrence was quantified and ranked by defining a contribution extent parameter. A statistical tool was also applied to conduct correlation analysis to identify variation patterns of time series data from individual fire causes. The annual fire numbers declined after 2008 and stabilized at a level < 2000 in recent years, pointing to the containment of several major ignition sources. Starting from the legislative development, an accountability system was established at all levels from administrative heads to local residents, paving the way for the multifaceted and full-coverage fire prevention publicity and education as well as the fire use restriction in particular seasons. The effectiveness of management measures in lessening forest fire occurrence was interpreted using the results of correlation analysis among the fire numbers initiated by individual ignition sources.

1. Introduction

Forest fire is a catastrophic phenomenon initiated by an ignition source usually brought in due to human activities in the forest areas. Natural heat sources, such as lightning and spontaneous combustion of humic materials in forest, could also cause problems under certain circumstances. Statistical data show that forest fires in Asia, Europe and North America can be primarily attributed to human factors, accounting for ~97% of the forest fire incidents in the past years [1,2,3,4,5,6]. The well-known “5.6” mega fire occurring in the Great Xing’an Mountains in 1987 was a tragedy caused by the carelessness of forestry workers during machine operations [1]. The “Camp Fire” in California in 2018 resulted in the loss of a historical town in a very short period, owing to the failure of an electrical transmission line after strong wind [7].
Research on fire origin, the characteristics of fire ignition sources and their temporal and spatial distributions has always caught the attention of forestry scientists and scholars in wildfire-swept countries, including China, France, Spain, and the USA. An ignition source has been recognized to be highly reliant on the areas with frequent human activities, such as the farmland and settlements nearby a forest [4,6,8,9]. Given that farming, agricultural, industrial, and domestic fires often occur in adjacent to a forest, fire spread may result in disaster in the nearby forests.
Among the forest fire management tasks, the control of fire ignition sources is often placed as the top priority. However, there are many difficulties in handling such issues in practice [1,10]. Owing to the overlapping junctions of forests and human activities in vast areas, plenty of heat sources can be converted into anthropogenic ignition sources, which are often altered by the enormous differences in education background, work types, living styles and the personal tastes of local residents [3,4,6,11]. As reported in the literature, the proportion of arson (ARS) in remote areas in the USA remains at a high level, which could be considered as the major issues in fire prevention management in some of the states [3,11]. All these facts lead to imminent handicaps in containing forest fire occurrence with satisfaction. Existing studies have been concentrated on the fire phenomena taking place in specific forest areas or individual provinces, and the macro studies at the national level are rarely reported [12]. So far, no reports have been published on the detailed classification of fire ignition sources and their contribution to the annual forest fire occurrence based on the long-term observation of state fire data.
Ranked as the fifth in its forest area worldwide, China is a big country possessing a population over 1.4 billion. Lots of forests are interspersed with farmland and villages in rural areas, with the agribusiness, farming, road and rail transportation, power transmission and tourism being intensively involved. About 30 years ago, the annual number of fires in the nation was recorded at more than 60,000 [2]. Great achievements have been made in recent years: the frequency of forest fire is primarily controlled at a level below 2000 per year, and the forest damage rate is maintained at an extremely low level (<0.5‰) [13,14]. At the movement, tens of thousands of wildfires occur in a year in the USA, and more than half of the Forest Service’s budget is devoted to fire suppression and control [15,16].
The significant decrease in the fire numbers implies a substantial reduction in resource and ecological losses, as well as the costs for fire suppression, emergency rescue service, and postfire care. This is also an effective guarantee for the safety of life, human property and the environment on which human beings rely. Effective management and control of forest fire occurrence in such a large nation with dense population indicate a resolution to the long-term problems, especially under the situations of eminent climate change and global warming, which can be considered as an outstanding contribution to the set goals of carbon neutrality in the currently deteriorating atmospheric environment.
On the basis of the statistical data of forest fire and the classification of fire causes, we explored the root grounds of China’s success in fire prevention in recent years and expounded the effectiveness of relevant management measures taken during this process. Through analyzing the statistical data recorded in the past two decades, we looked into the main components attributed to the annual fire occurrence and the main reasons leading to the decrease in fire numbers. A statistical analysis tool was applied to conduct correlation analysis to identify the variation patterns of time series data from individual fire causes. The pertinence of forest fire occurrence management was then discussed in combination with a series of management measures taken on the front in the forest fire prevention sector. The present study further revealed the importance of anthropogenic fire prevention and flexibility in the ways of managing wildfire ignition sources, which could provide a valuable reference for forest fire management in the countries confronting similar issues.

2. Materials and Methods

China has a vast territory containing a wide range of latitudes. Its diverse terrain and mountain ranges are enriched by the forests with distinct climatic features from the north to the south. Starting from 2003, the policy of closing hillsides to facilitate afforestation was implemented across the nation. As a result, forest land area increased steadily. The total forest area of the nation was recorded as 195.5 Mha in 2003, increased to 207.7 Mha in 2010, and further reached 220.5 Mha in 2015 [17].
Fires usually occur in two seasons, spring and autumn, and are usually sorted as three categories, namely general, major, and extremely large, depending on the burnt area and casualties [2]. In comparison with the northern areas, more fire incidents happen in southern China forest areas every year, reflecting dense population and living style of the residents in the fire-prone areas [2,8,13]. In light of the ascertainment status, fire incidents are split into identified and unidentified cases, whereas the fire causes are classified into four categories: fire use in agricultural activities (FAA), fire use in nonagricultural activities (FUA), other human-related ignition sources (OHR), and natural ignition sources (NIS). As reported in the literature [4], fire ignition sources in European nations are sorted in four types, i.e., accident, negligence, deliberate, and natural, making it difficult for comparisons.
Every fire case was reported by the grassroots level layer by layer, and the recorded results from each province and autonomous region were gathered together and eventually summarized by the Forest Fire Prevention Office of the former State Forestry Administration, which were officially released in the annual Forestry Yearbook in the past years [18]. The statistical results between 2003 and 2019 are listed in Table 1. Since 2017, some statistical data are missing owing to the institutional adjustment of the central government in China and the according adjustment in the focus of forest fire statistics over the nation.
Detailed statistical data for the identified fire cases between 2003 and 2017 are reported in Table 2, and all the fire ignition causes are specified by their abbreviations so as to reduce the column spaces. Although natural ignition sources contain two items, i.e., lightning and spontaneous combustion of humic substances, the respective category was omitted from the table, solely because of the negligible fire case numbers and limitation of the page space.
The data analysis involved in this study was mainly proceeded with Excel. Statistical correlation analysis of parallel time series data was performed by using the sophisticated software IBM SPSS Statistics 21.0. After the linearity check and normal distribution tests among the groups of time series data, the Pearson correlation model was applied to carry out a significance trial, which yielded the correlation evaluation outcomes. Then, the evaluation results were plotted in a chart to exhibit the dependence among the data groups graphically.
The available active fire data from Moderate Resolution Imaging Spectroradiometer (MODIS) and Visible Infrared Imaging Radiometer Suite (VIIRS) were not used in the present study for any validation purposes [19,20]. Although such data are powerful to track the hot spots spread across a nation on daily basis, it was found that it is extremely time consuming to pick up the true fire sources and match them with the historical fire records, which could be partially attributed to the limitation in imaging resolution of the existing remote sensing techniques. Evidently, the well-known MODIS active fire and burnt area products do not provide us any essential information on fire causes [19].

3. Results

3.1. Characteristics of Forest Fire Causes and Their Distribution Patterns

From 2003 to 2017, a sum of 108,968 forest fires occurred in China, at an average of 7265 per year. The number of fires with identified causes during this period was 92,070, and their proportion to the total fire numbers fluctuated between 78.8% and 89.9% at an average of 83.9% per year, as shown in Table 1. The reason why some fire causes could not be identified was mainly due to the complexity of the causes of forest fires and the specificity of wildfires in rural areas. In a review paper [4], Ganteaume et al. revealed that the portion of the fires with identified causes varied between 71% and 87% in different regions of Europe during the years between 2006 and 2010. In the face of the history of fires in remote areas that was difficult to trace back, the investigation of some fires could be concluded with unknown causes eventually. A summation check of the data reported in Table 1 and Table 2 indicated excellent conservation of the results for individual items in the separate categories.
Based on the data in Table 2, the distribution of averaged fire numbers under different categories was plotted in Figure 1. For the fire incidents with identified causes, the percentage of occurrence induced by FAA accounted for 40.7%, whereas that triggered by FUA took up 40.8% closely. A proportion of 2.0% on average is attributed to the fire causes classified as OHR, including ARS and the fire invasion from a neighboring area/country. Despite China’s largest population and difference in personnel quality, the ratio induced by ARS is far lower than that happened in Western countries. As reported by Rodrigues et al. [9], there were nearly 40,000 forest fires caused by ARS in Spain during the period between 2006 and 2010, almost double the number of fires caused by unintended factors in the same period. Maingi and Henry conducted a study on forest fires in Kentucky, USA between 1985 and 2002 and quoted the proportion of fires by ARS in specific forest areas being higher than 75% [3].
Over the years between 2003 and 2017, the proportion of fire incidents caused by natural factors, such as lightning (LTN) and spontaneous combustion (SPC) fluctuated from 0.6% to 9.2% at an average of 1.2% (see Table 1 and Figure 1). Owing to China’s vast territory and variations in climate conditions, a big difference was observed in the proportion of natural fires in the southern and northern forest areas: the number of lightning fires in northern forest areas, especially northeastern forest areas, was relatively high, whereas the probability of lightning fire in southern provinces was low [8,21]. This disparity is essentially governed by local weather and humidity as well as the alive status of surface plants in lightning seasons. Lightning fire has also been found in some European countries, such as Finland, Switzerland, and a few other countries near the Alps [4]. Lightning fires are also quite common in the American continent [3,11].
Fire incidents in relation to agricultural activities were contributed by nine items, including burning the grass in wasteland (uncultivated land) to produce charcoal (BGW), burning slash in the mountains for afforestation (BSA), burning pasture to generate fertile land (BPL), kilning (KLN), and burning surface fuels to create fuelbreaks (BCF). Among these items, the majority of fires were initiated by BGW, taking up a portion of ~77% on average (Figure 1b). Another nine items were sorted into the category of FUA, including smoking (SMK), cooking and heating in wildland (CHW), burning joss paper at grave sites (BJP), burning the mountain to repel beasts (BMB), children playing with fire (CPF), and fire ignited by people with dementia (FPD). Among them, SMK and BJP accounted for an accumulated portion of ~62% (Figure 1c). Fire incidents caused by SPC were rare by comparison with those induced by LTN (Figure 1d). The classification of all these fire causes and their contribution to the fire numbers were a true reflection of the agricultural production, living styles and culture in the remote areas. For instance, many graves are located at the forest edges, and the BJP activities are routinely carried out during the Qingming Festival and the Winter Solstice every year. A little carelessness could result in a fire causing damage to forest resources and human properties nearby.
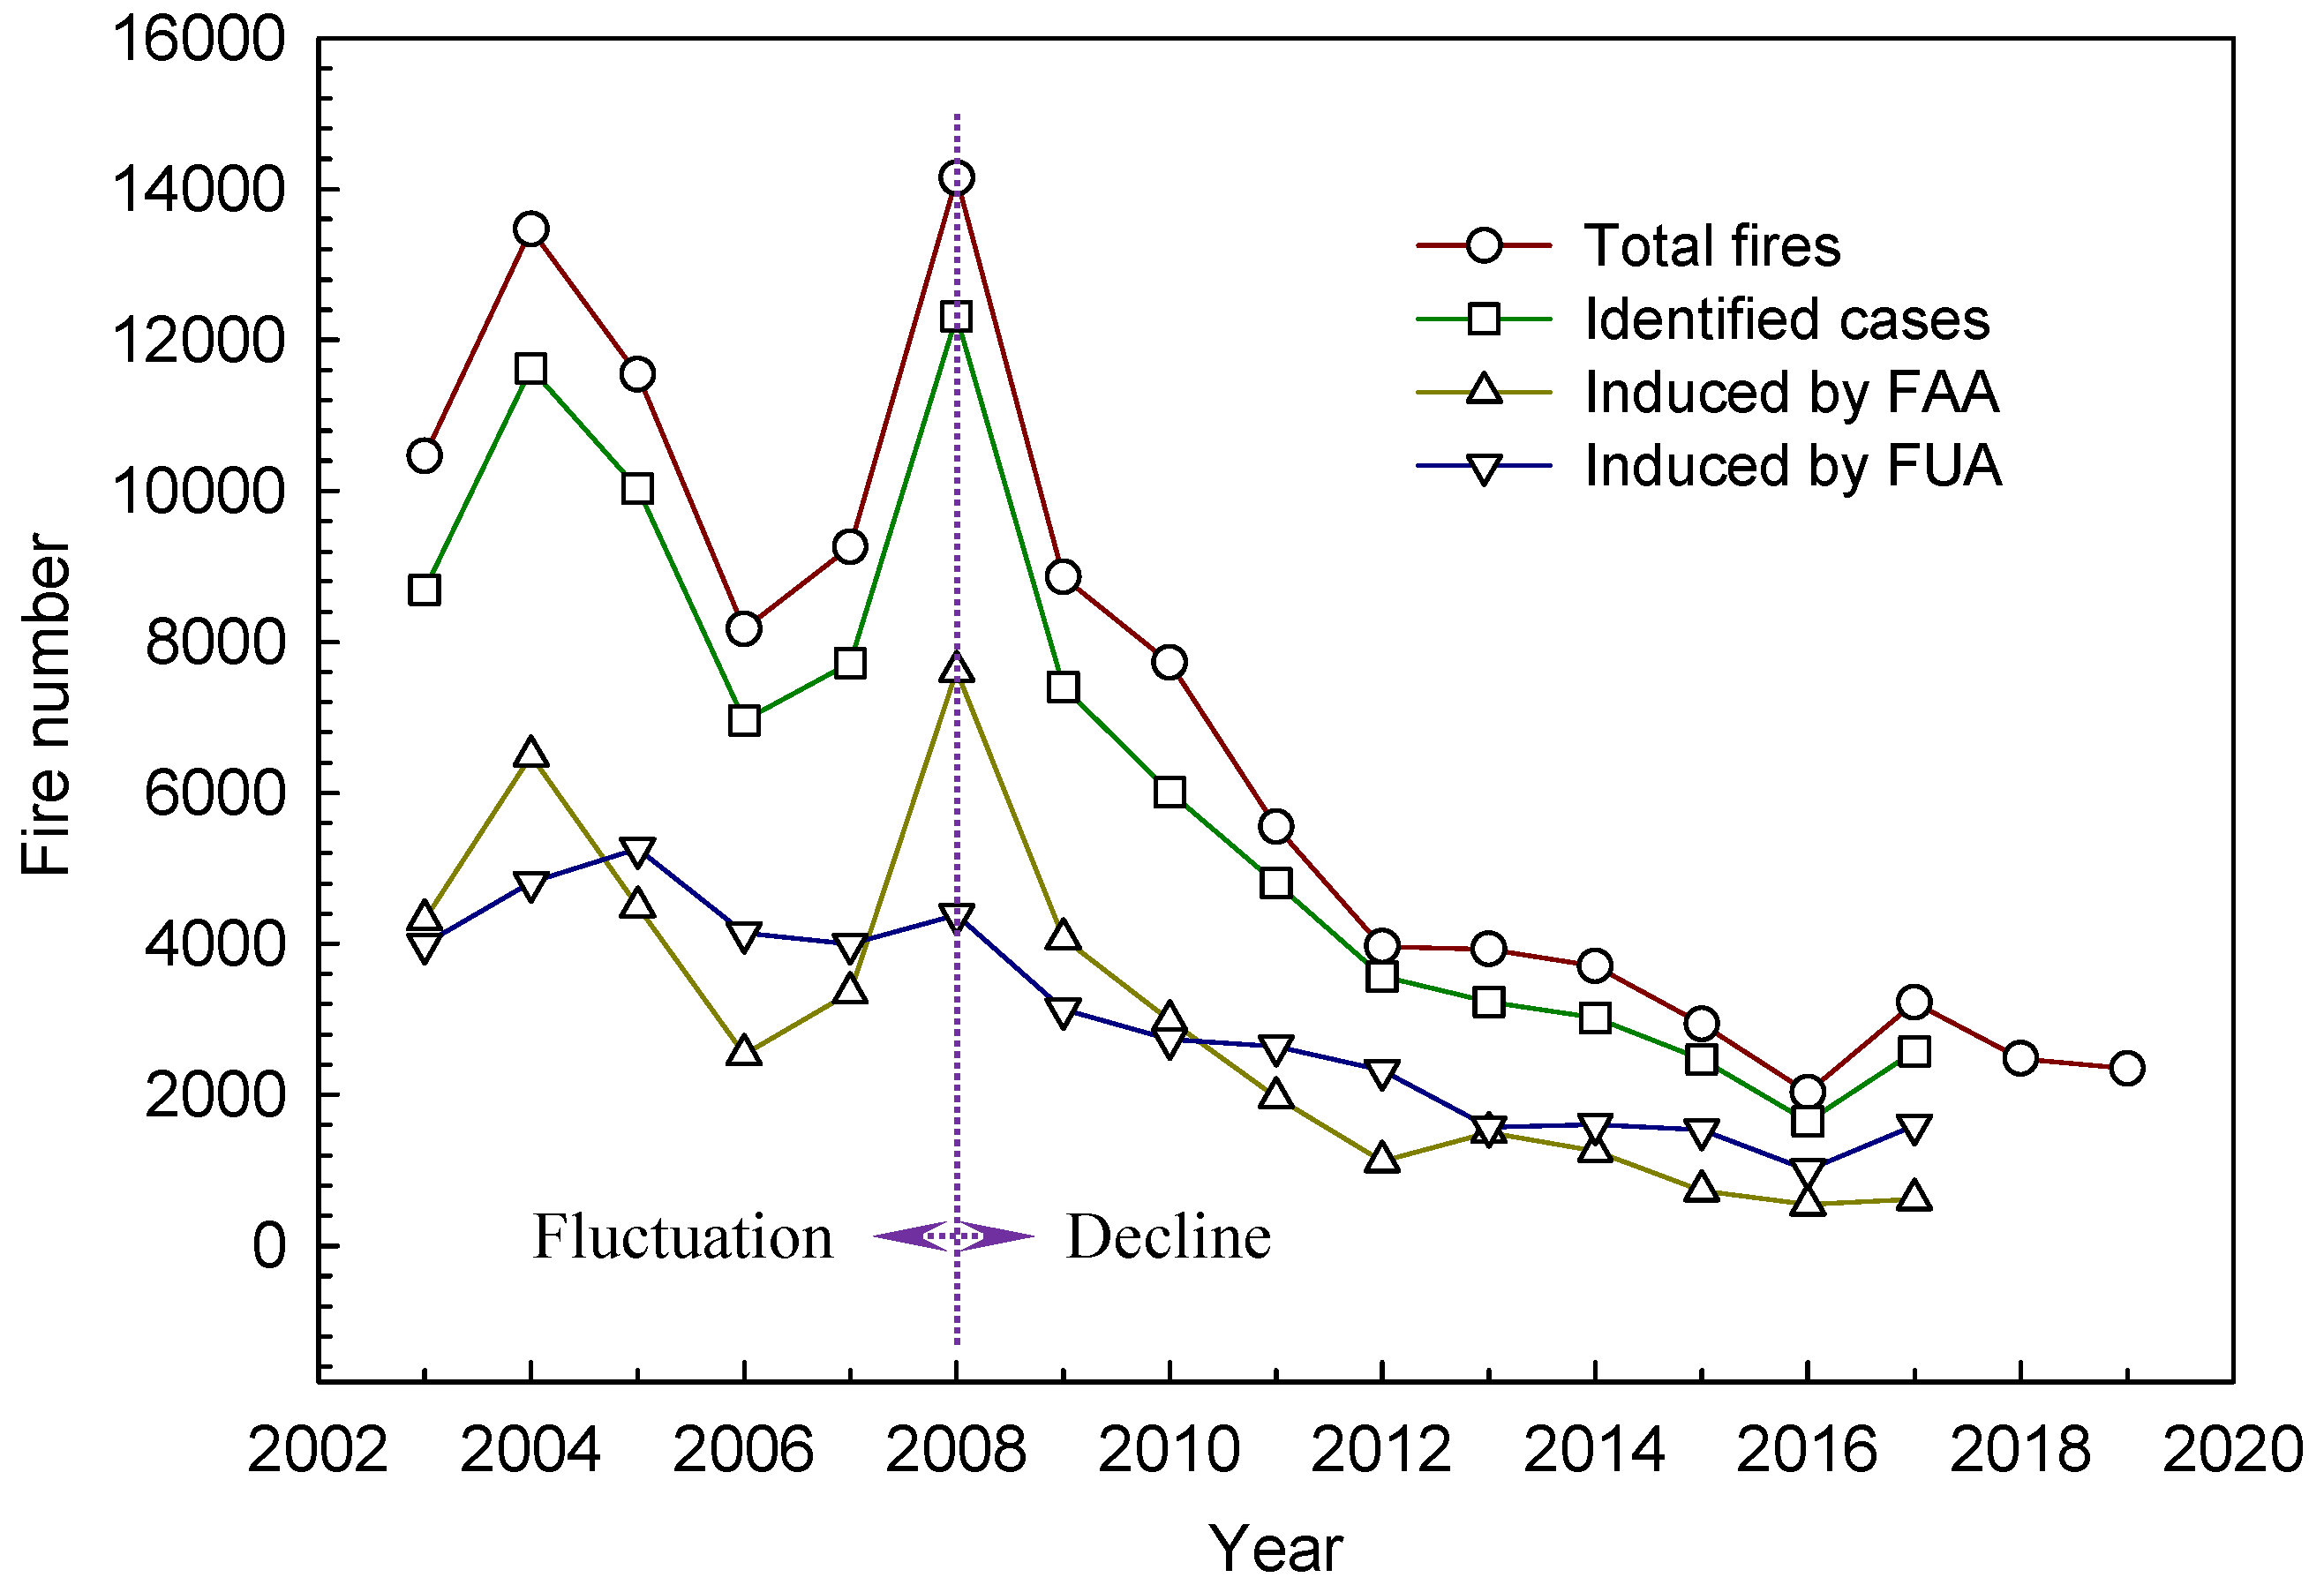
Variation trends of the fire numbers sorted in different categories through the years studied are exhibited in Figure 2. The year of 2008 was observed as the turning point of variation for all the major categories. Before 2008, all the annual fire numbers fluctuated at high levels, which were followed by a significant decline afterwards. As stated previously, owing to the adjustment of governmental agencies, the annual forest fire statistical data were no longer included in the Forestry Yearbook after 2018. As reported by the recently formed Ministry of Emergency Management, the total fire numbers in the latest years have always fallen in the range of <2000 [14,22].
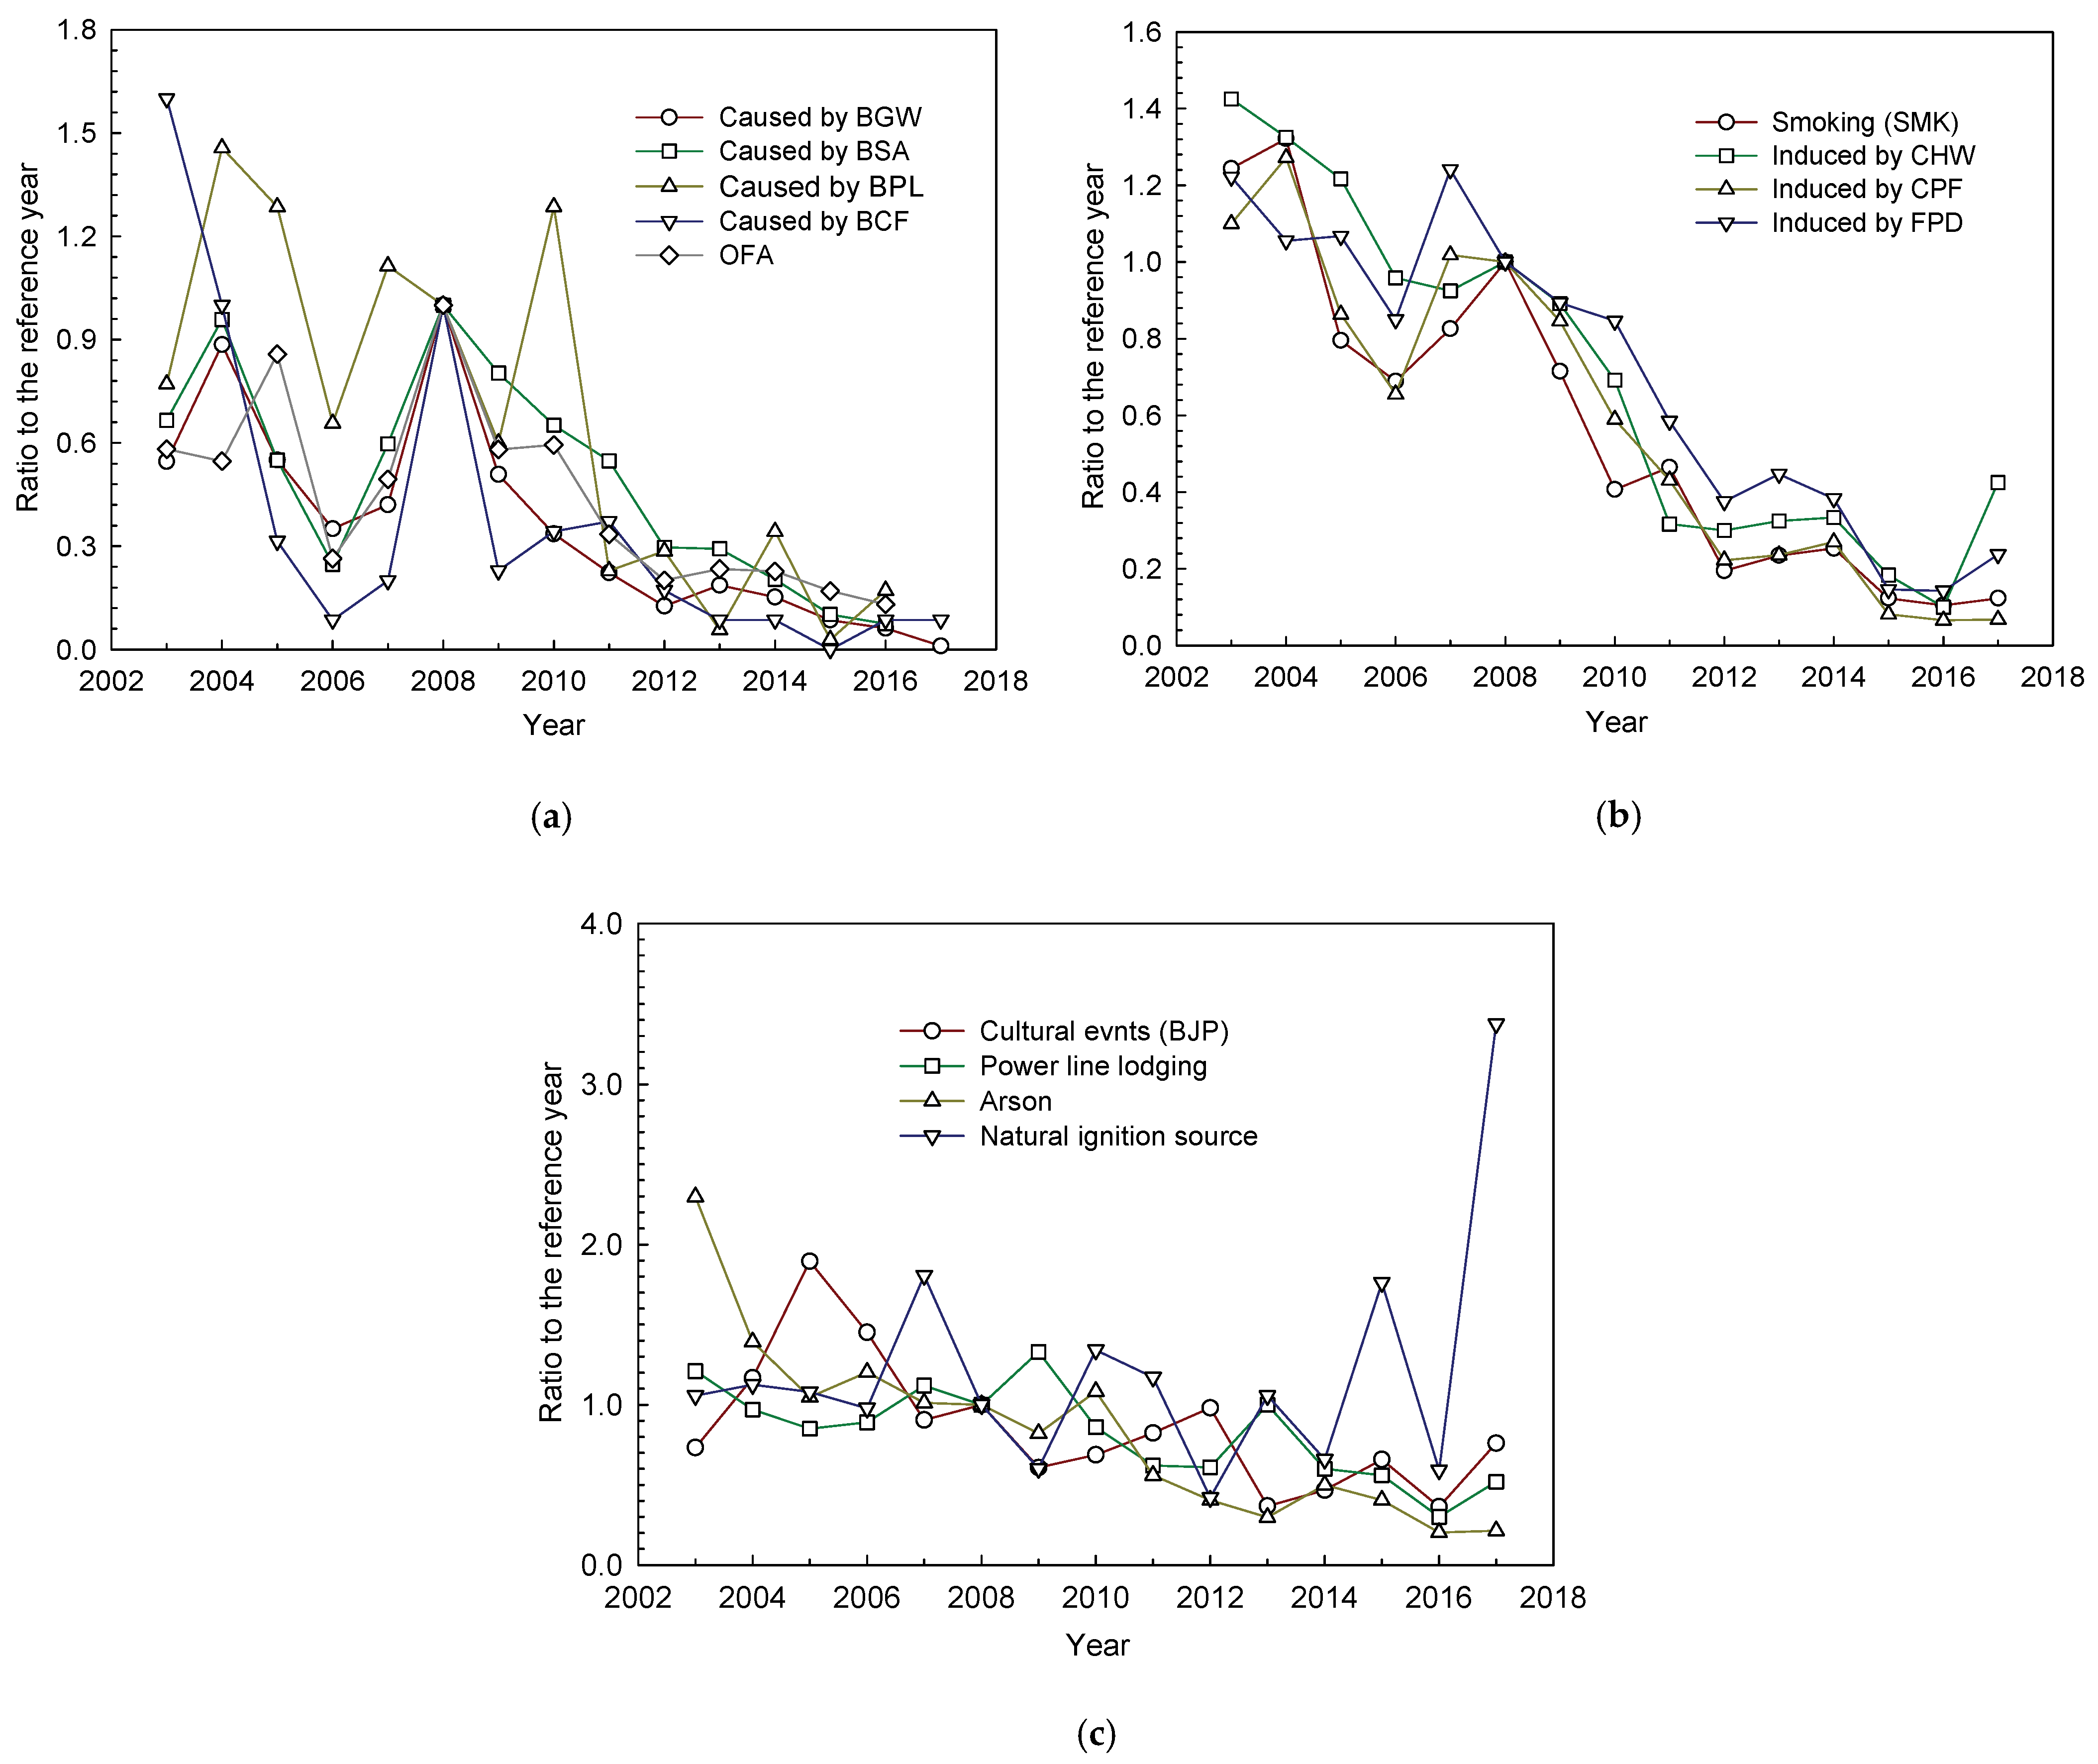
By setting the year of 2008 as the benchmark, the ratios of the results for individual fire causes in the years concerned to that reported in the reference year 2008 were calculated, with their outcomes plotted in Figure 3. The observed variation trends become more evident for the fire causes, such as BGW, and BSA in the category of FAA and SMK, CHW, CPF, and FPD in the category of FUA (Figure 3a,b). On the contrary, an abnormal pattern was found for some other causes, such as BJP, ARS, and the fires triggered by NIS, as shown in Figure 3c. These phenomena highlight the nature of distinct ignition sources contributed to the fires every year.
As revealed in Table 2 and Figure 1c, the power line lodging (PLL) is also an ignition source that can cause forest fire, with its annual numbers fluctuating from several tens to more than one hundred. As a result, their ratios to the reference year vary irregularly in a narrow range (Figure 3c). Although the ratio of the fire numbers by NIS in 2017 is about three times higher than that in 2008, this does not mean there were very big fire numbers caused by natural factors in this year, given that the fire numbers caused by NIS in 2008 were less than one hundred. Furthermore, the significant increase in the fire numbers by NIS could be a reflection of the growing fire risk from natural sources due to the eminent climate change in recent years.

3.2. Analysis of the Key Factors Responsible for the Drop in Fire Numbers

To evaluate the effect of the fire numbers induced by specific fire causes on the drop in fire incidents in a year studied, here we introduced a parameter, the contribution extent to fire reduction ξi(y), which is defined as the ratio of the variation in the case number induced by a specific fire cause to that in the total fire number between a year concerned and a reference year. Explicitly, it is written by
ξi(y) = {[ni(y) − ni(r)]/[N(y) − N(r)]} × 100%
where ni(y) denotes the fire number induced by a fire cause i in a year, and ni(r) represents the fire number obtained by the same fire cause i in the reference year. N(y) is the fire number contributed by all the fire causes in the year concerned, and N(r) signifies the fire number developed by all categories in the reference year.
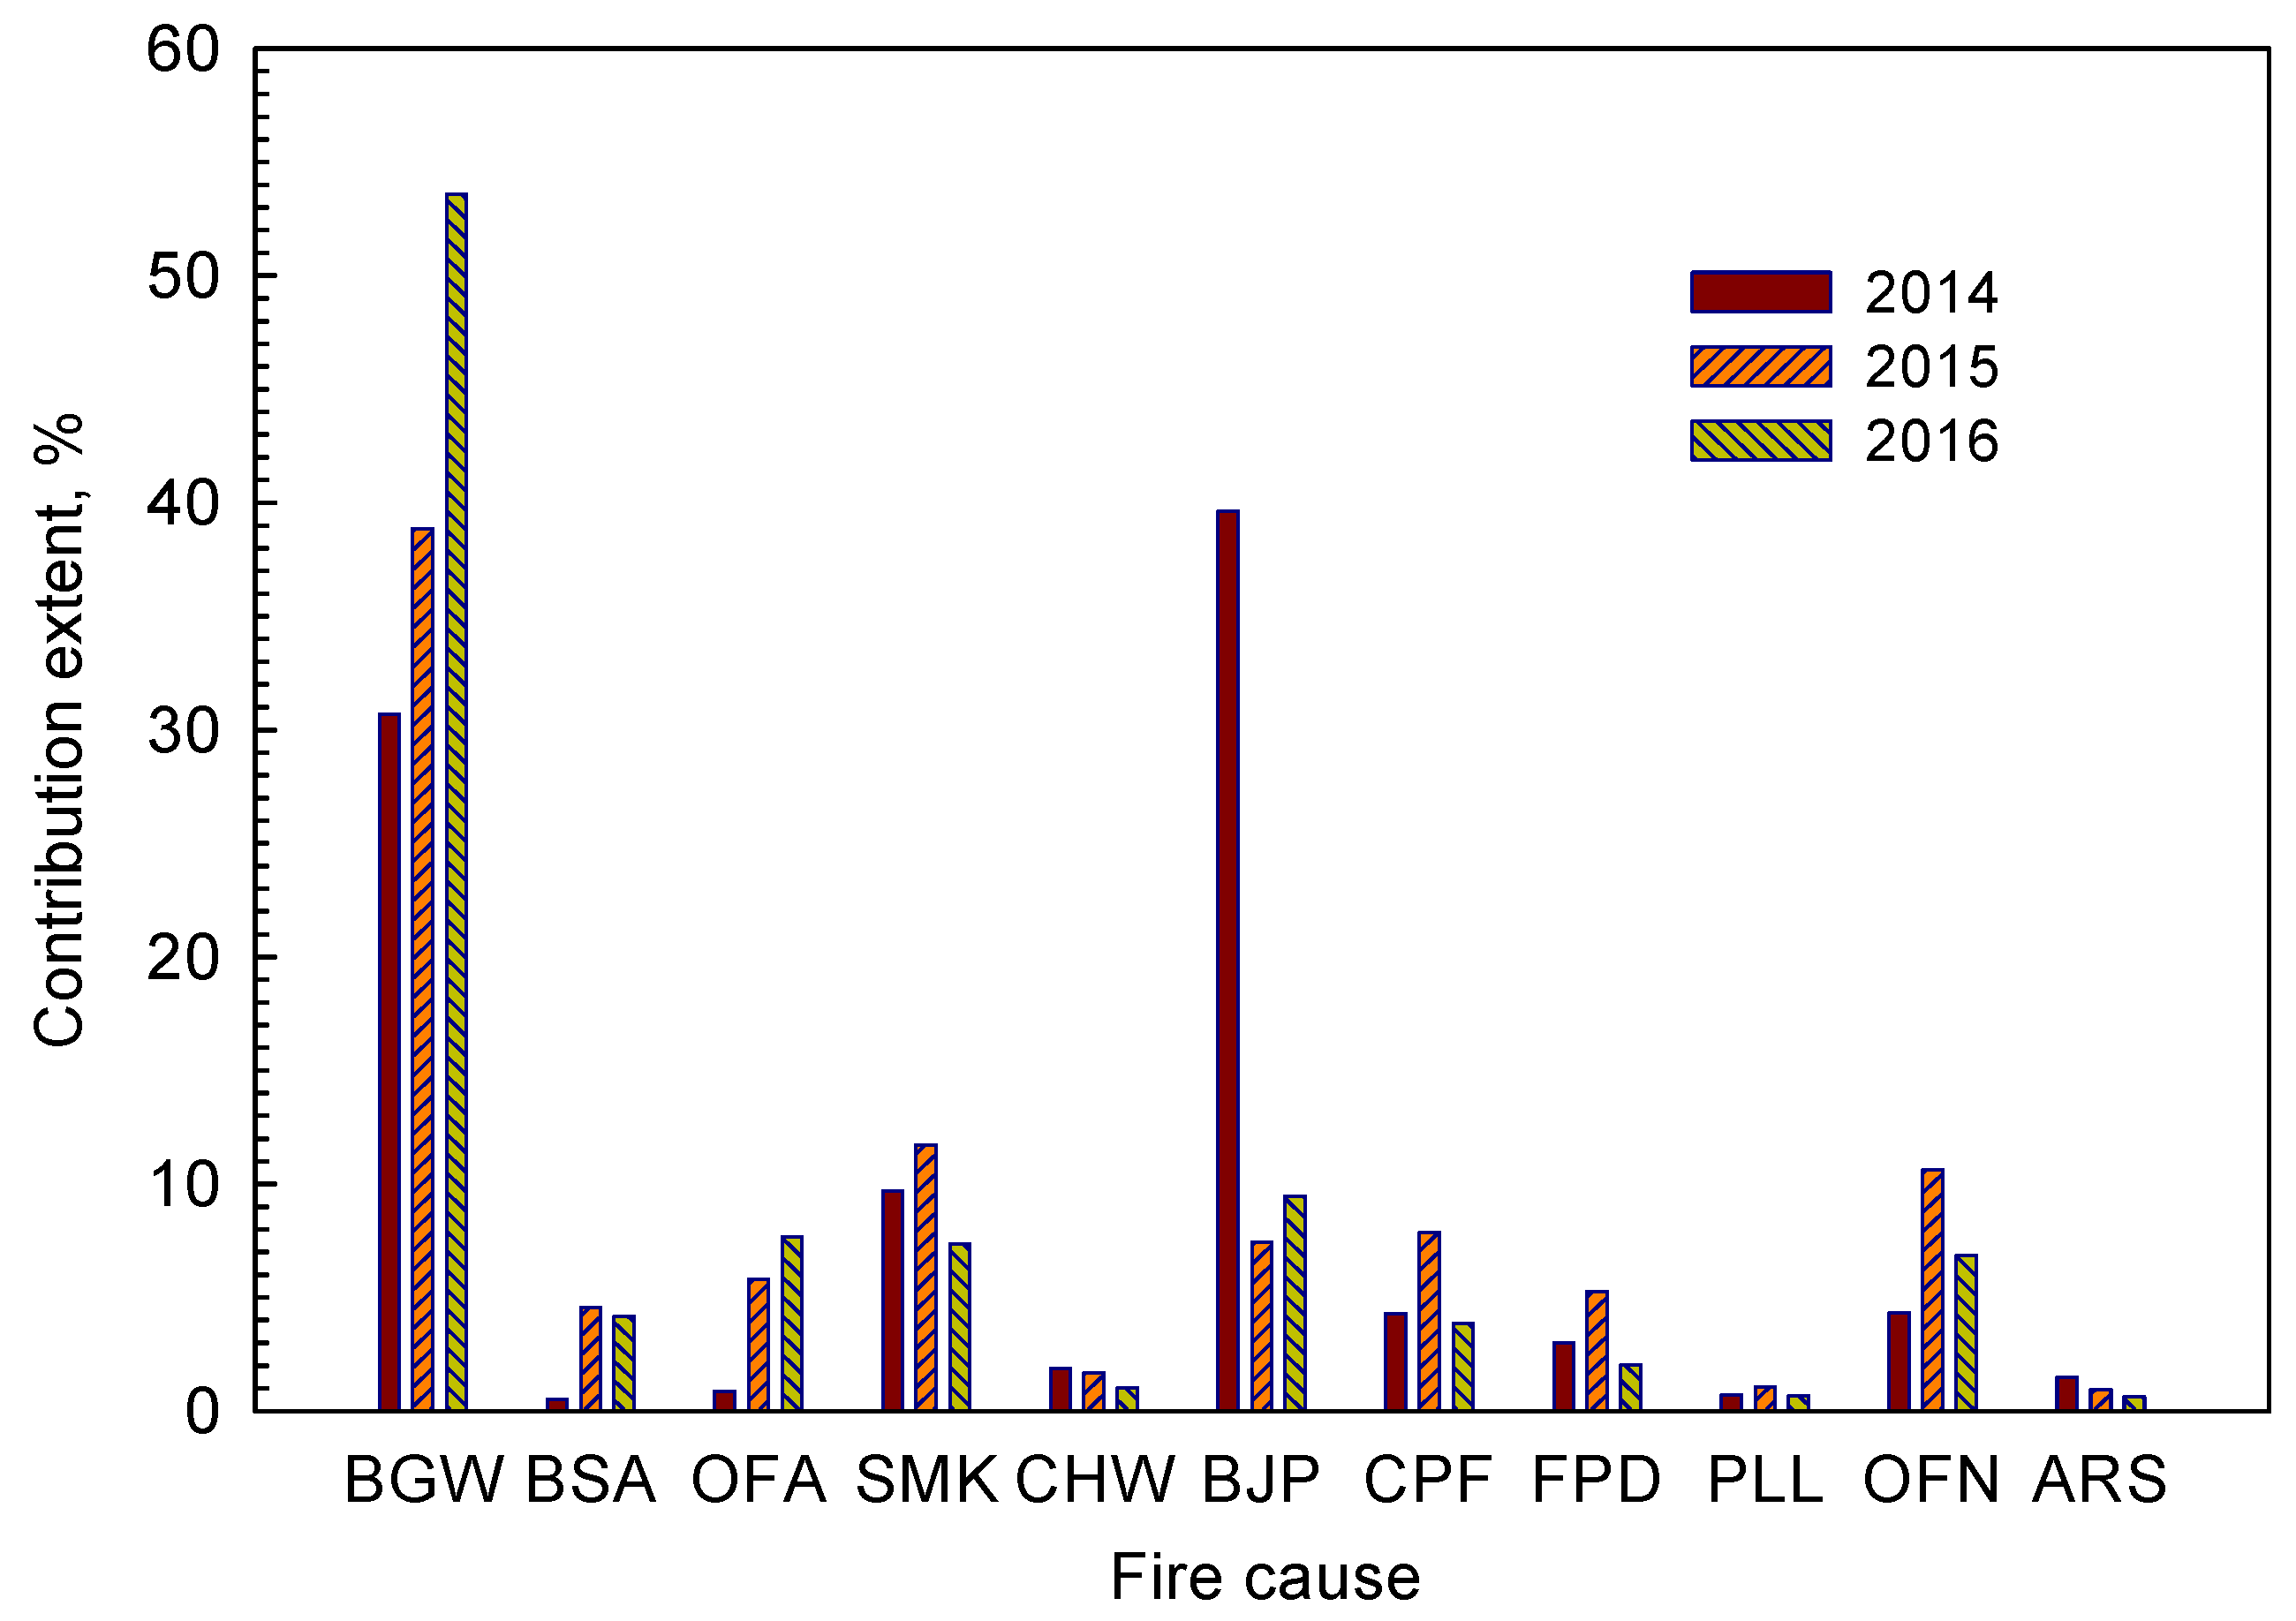
By taking the statistical data in 2008 as the references, we mapped the contribution scores for all the fire causes in the years of 2014, 2015 and 2016, respectively, with the results plotted in the column chart of Figure 4. As shown in Figure 4, the contribution by various fire causes to the overall reduction of the total fire numbers in the years concerned can be mainly attributed to several major causes. Specifically, BGW played a crucial role in the decrease of fire occurrence in the years concerned (31% < ξi(y) < 54%). The items that made significant contributions also included SMK, BJP, and the “others” in the fires raised by nonagricultural activities (OFN) (ξi(y) > 5%). Other causes, such as BSA, OFA, CPF, and FPD, minimally contributed to the decrease in the annual fire numbers, with negligible contributions from the rest in the same categories. The prime decline in fire incidents attributed to BGW revealed the effectiveness of the government’s target-oriented management measures in hazard reduction. A detailed discussion on this aspect is given in the next subsection.
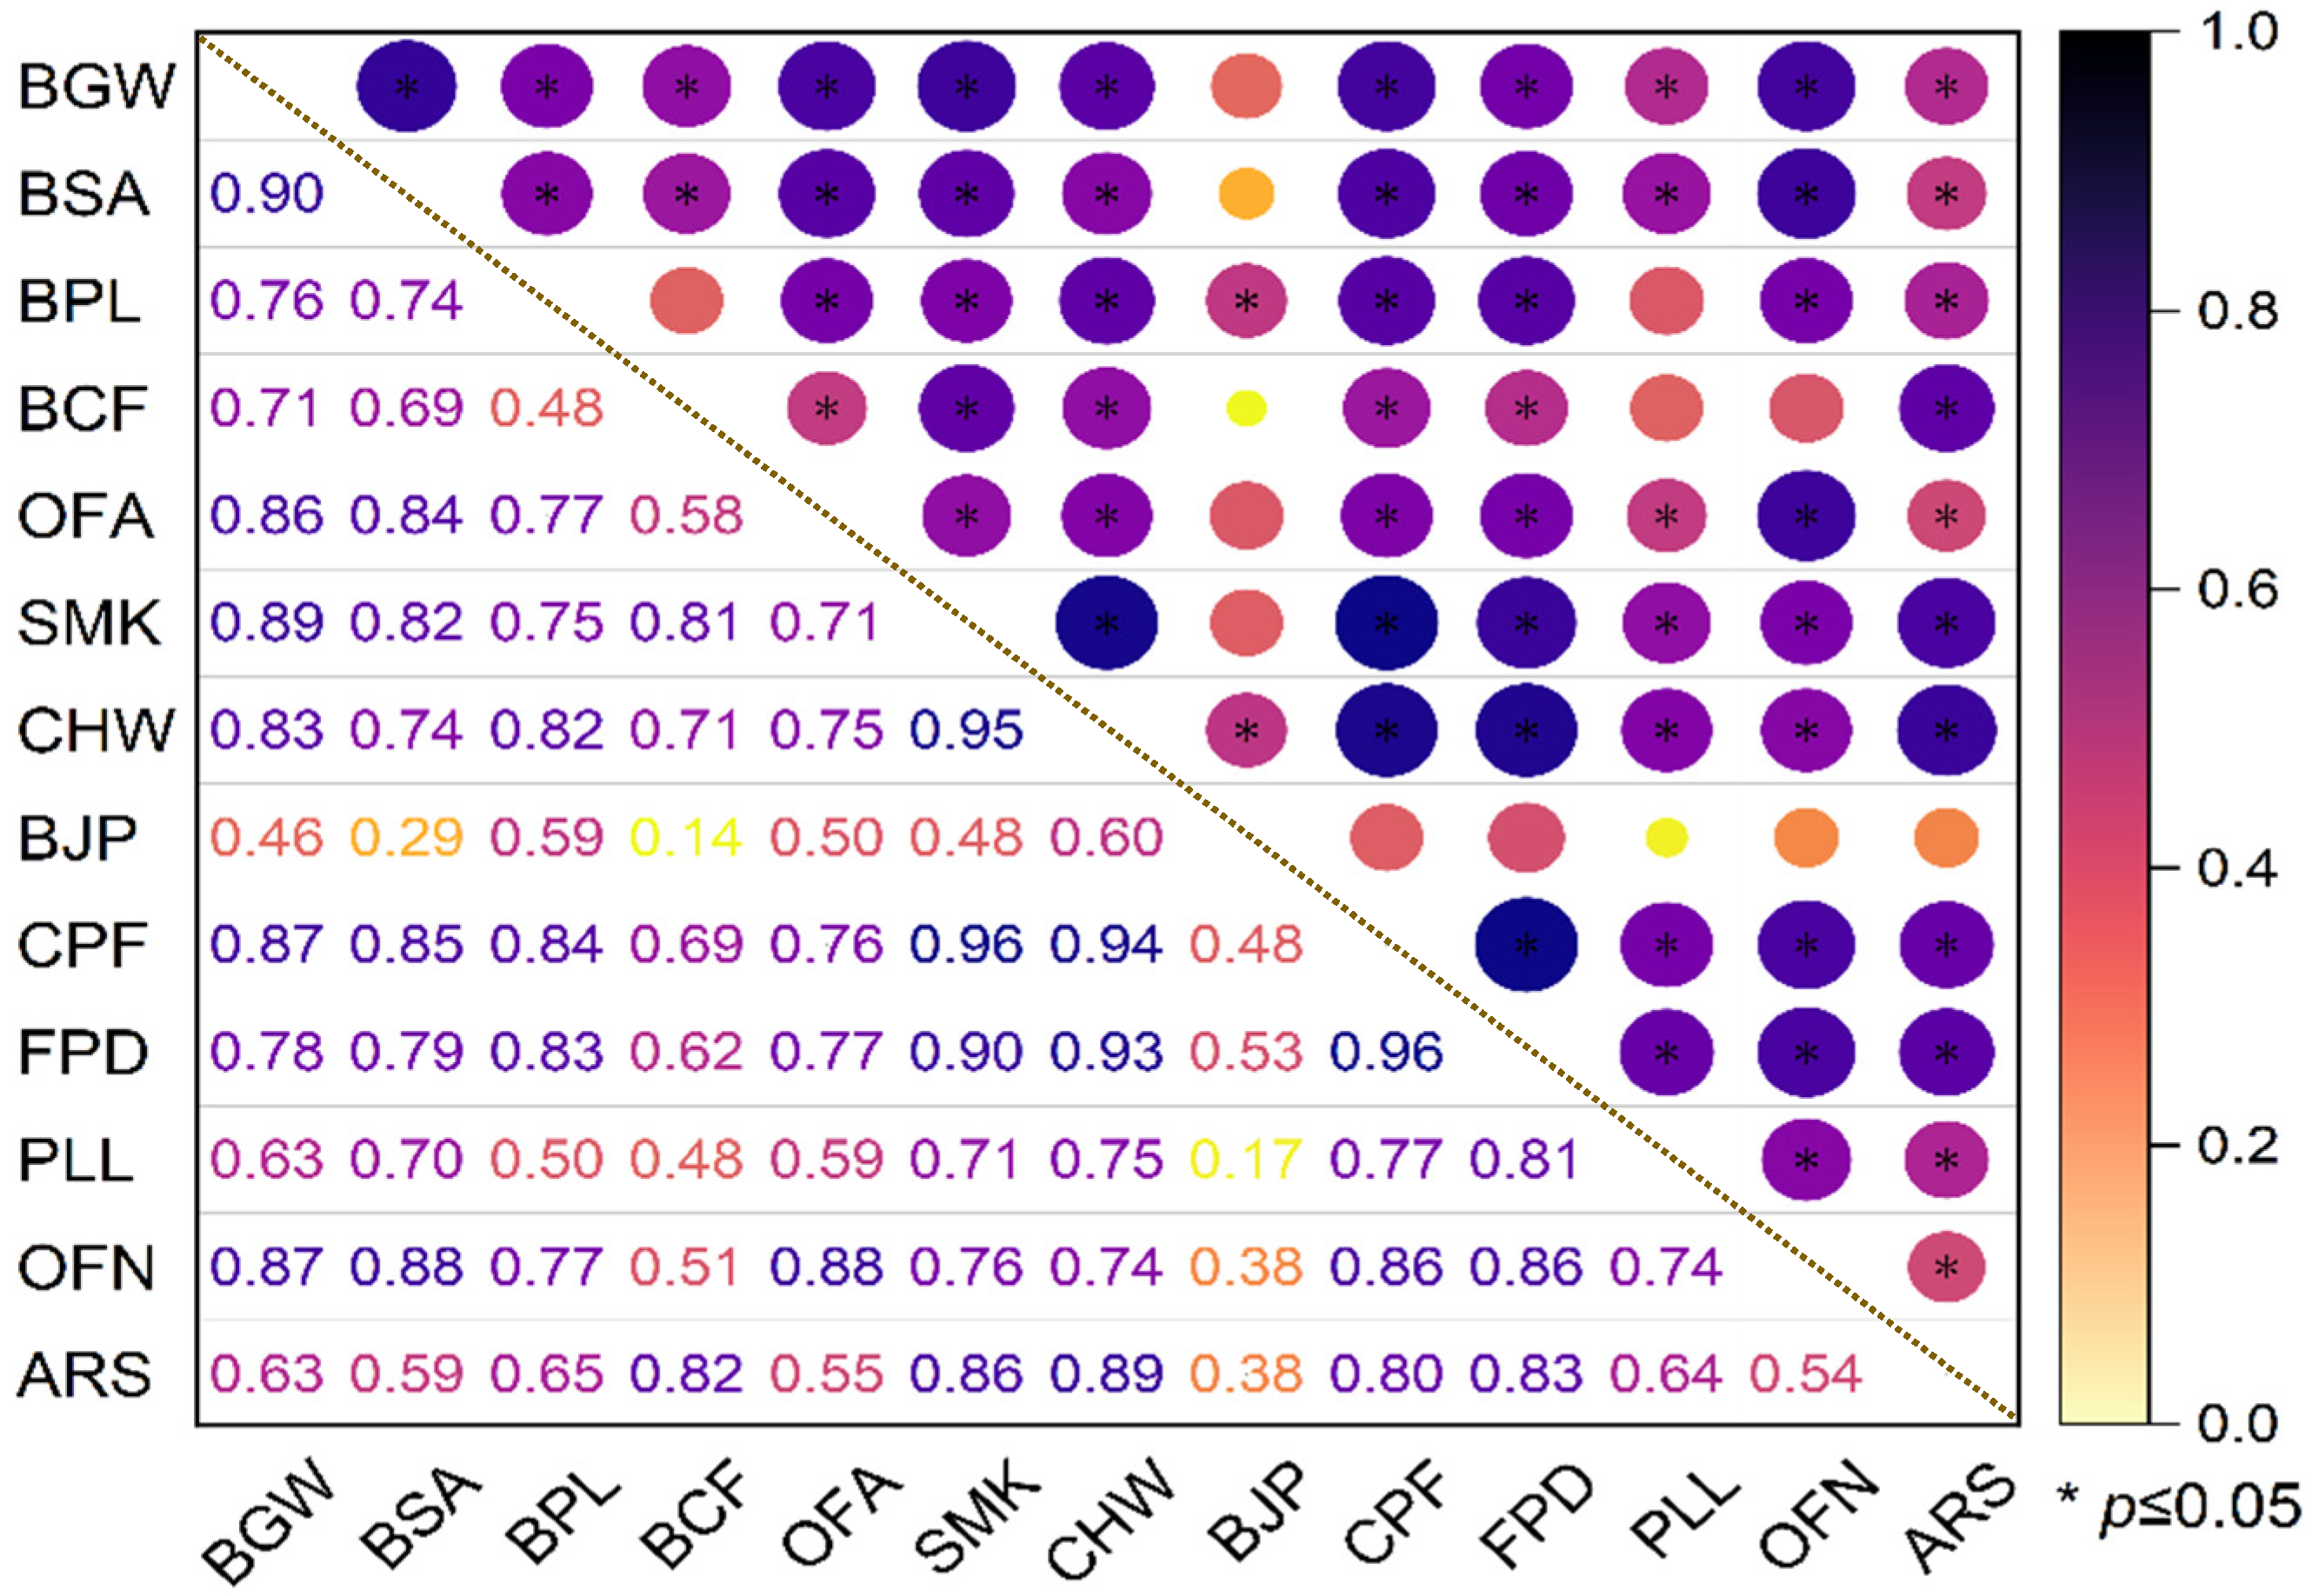
SPSS Statistics was used to analyze the correlations among the time series data recorded for various fire ignition sources. It was found that except for the fire causes with incomplete (less) data sets and those sorted as NIS, the major items met all the conditions for Pearson model analysis. The correlation coefficient evaluation was then performed for the time series datasets between 2003 and 2016.
Figure 5 exhibits the color block distribution of correlation coefficients determined by SPSS Statistics. The correlation coefficients ri ≥ 0.85 were observed for the fire causes such as BGW, BSA, OFA, SMK, CPF, and OFN. High correlations among the fire numbers contributed by these fire causes in the period from 2003 to 2016 reflect the important achievements in raising safety awareness all over the nation to avoid safety accidents caused by the inadvertent use of fire in both daily life and production, as well as the effective management and control of fire ignition sources.
A range of 0.71 ≤ ri < 0.84 was found for the fire causes, such as BPL, BCF, CHW, and FPD, and a value of ri = 0.64 was observed in the correlation between the time series data of PLL and ARS. Given that the items listed here are all sourced from the safety faults containing randomness, we only can expect certain level of correlation among them. In particular, ARS is a type of activity caused by individuals and is often featured by crypticity and uncertainty.
The fire number initiated by BJP reduces in a different way, and the calculated correlation coefficient of ri ~ 0.50 reflects its independence to the other fire causes exhibited in Figure 5. This is primarily because such activities independently take place during the Qingming and Winter Solstice seasons in Chinese lunar calendar. The fire numbers caused by NIS, such as LTN and SPC, do not possess a linear variation feature in their time series data, which coincide with the ignition mechanisms induced by these fire sources. The observed phenomena further validate the reliability of annual statistical data recorded in a number of years.

4. Discussion

The year of 2008 acted as the turning point in forest fire management and control was not by chance, as it coincided with an important event, The XXIX Olympic Games. As predicted by the first author in an article published in 2008 [5], Chinese people took out the spirit of hosting the Olympic Games to forest fire prevention work and made progress in lessening the forest fire incidents of the nation. In 2009, the “Regulations on Forest Fire Prevention Management” were promulgated and implemented, paving the way for the legalization of national fire prevention work. In the same year, the national forest public security power emerged into the fire service system and began to fully participate in forest fire prevention work under the support of the forest fire prevention offices at different levels, thus greatly enhancing the administrative management power for fire prevention and control.
The causes of forest fires were mostly related to the careless use of fire by local residents and tourists in the vicinity of the forest areas, highlighting the lack of fire risk awareness [2,4]. In the subsequent years, enormous efforts were devoted to fire prevention publicity and education, and lots of successful examples were reported in the journal “Forest Fire Prevention” sponsored by the former State Forestry Administration, as the official work experience exchange platform [13]. Law enforcement agencies, forestry authorities, and nature reserve management departments and local governments all made a contribution to the promotion of the knowledge publicity on forest fire prevention laws and regulations, fire safety regulations, firefighting, and emergency avoidance principles.
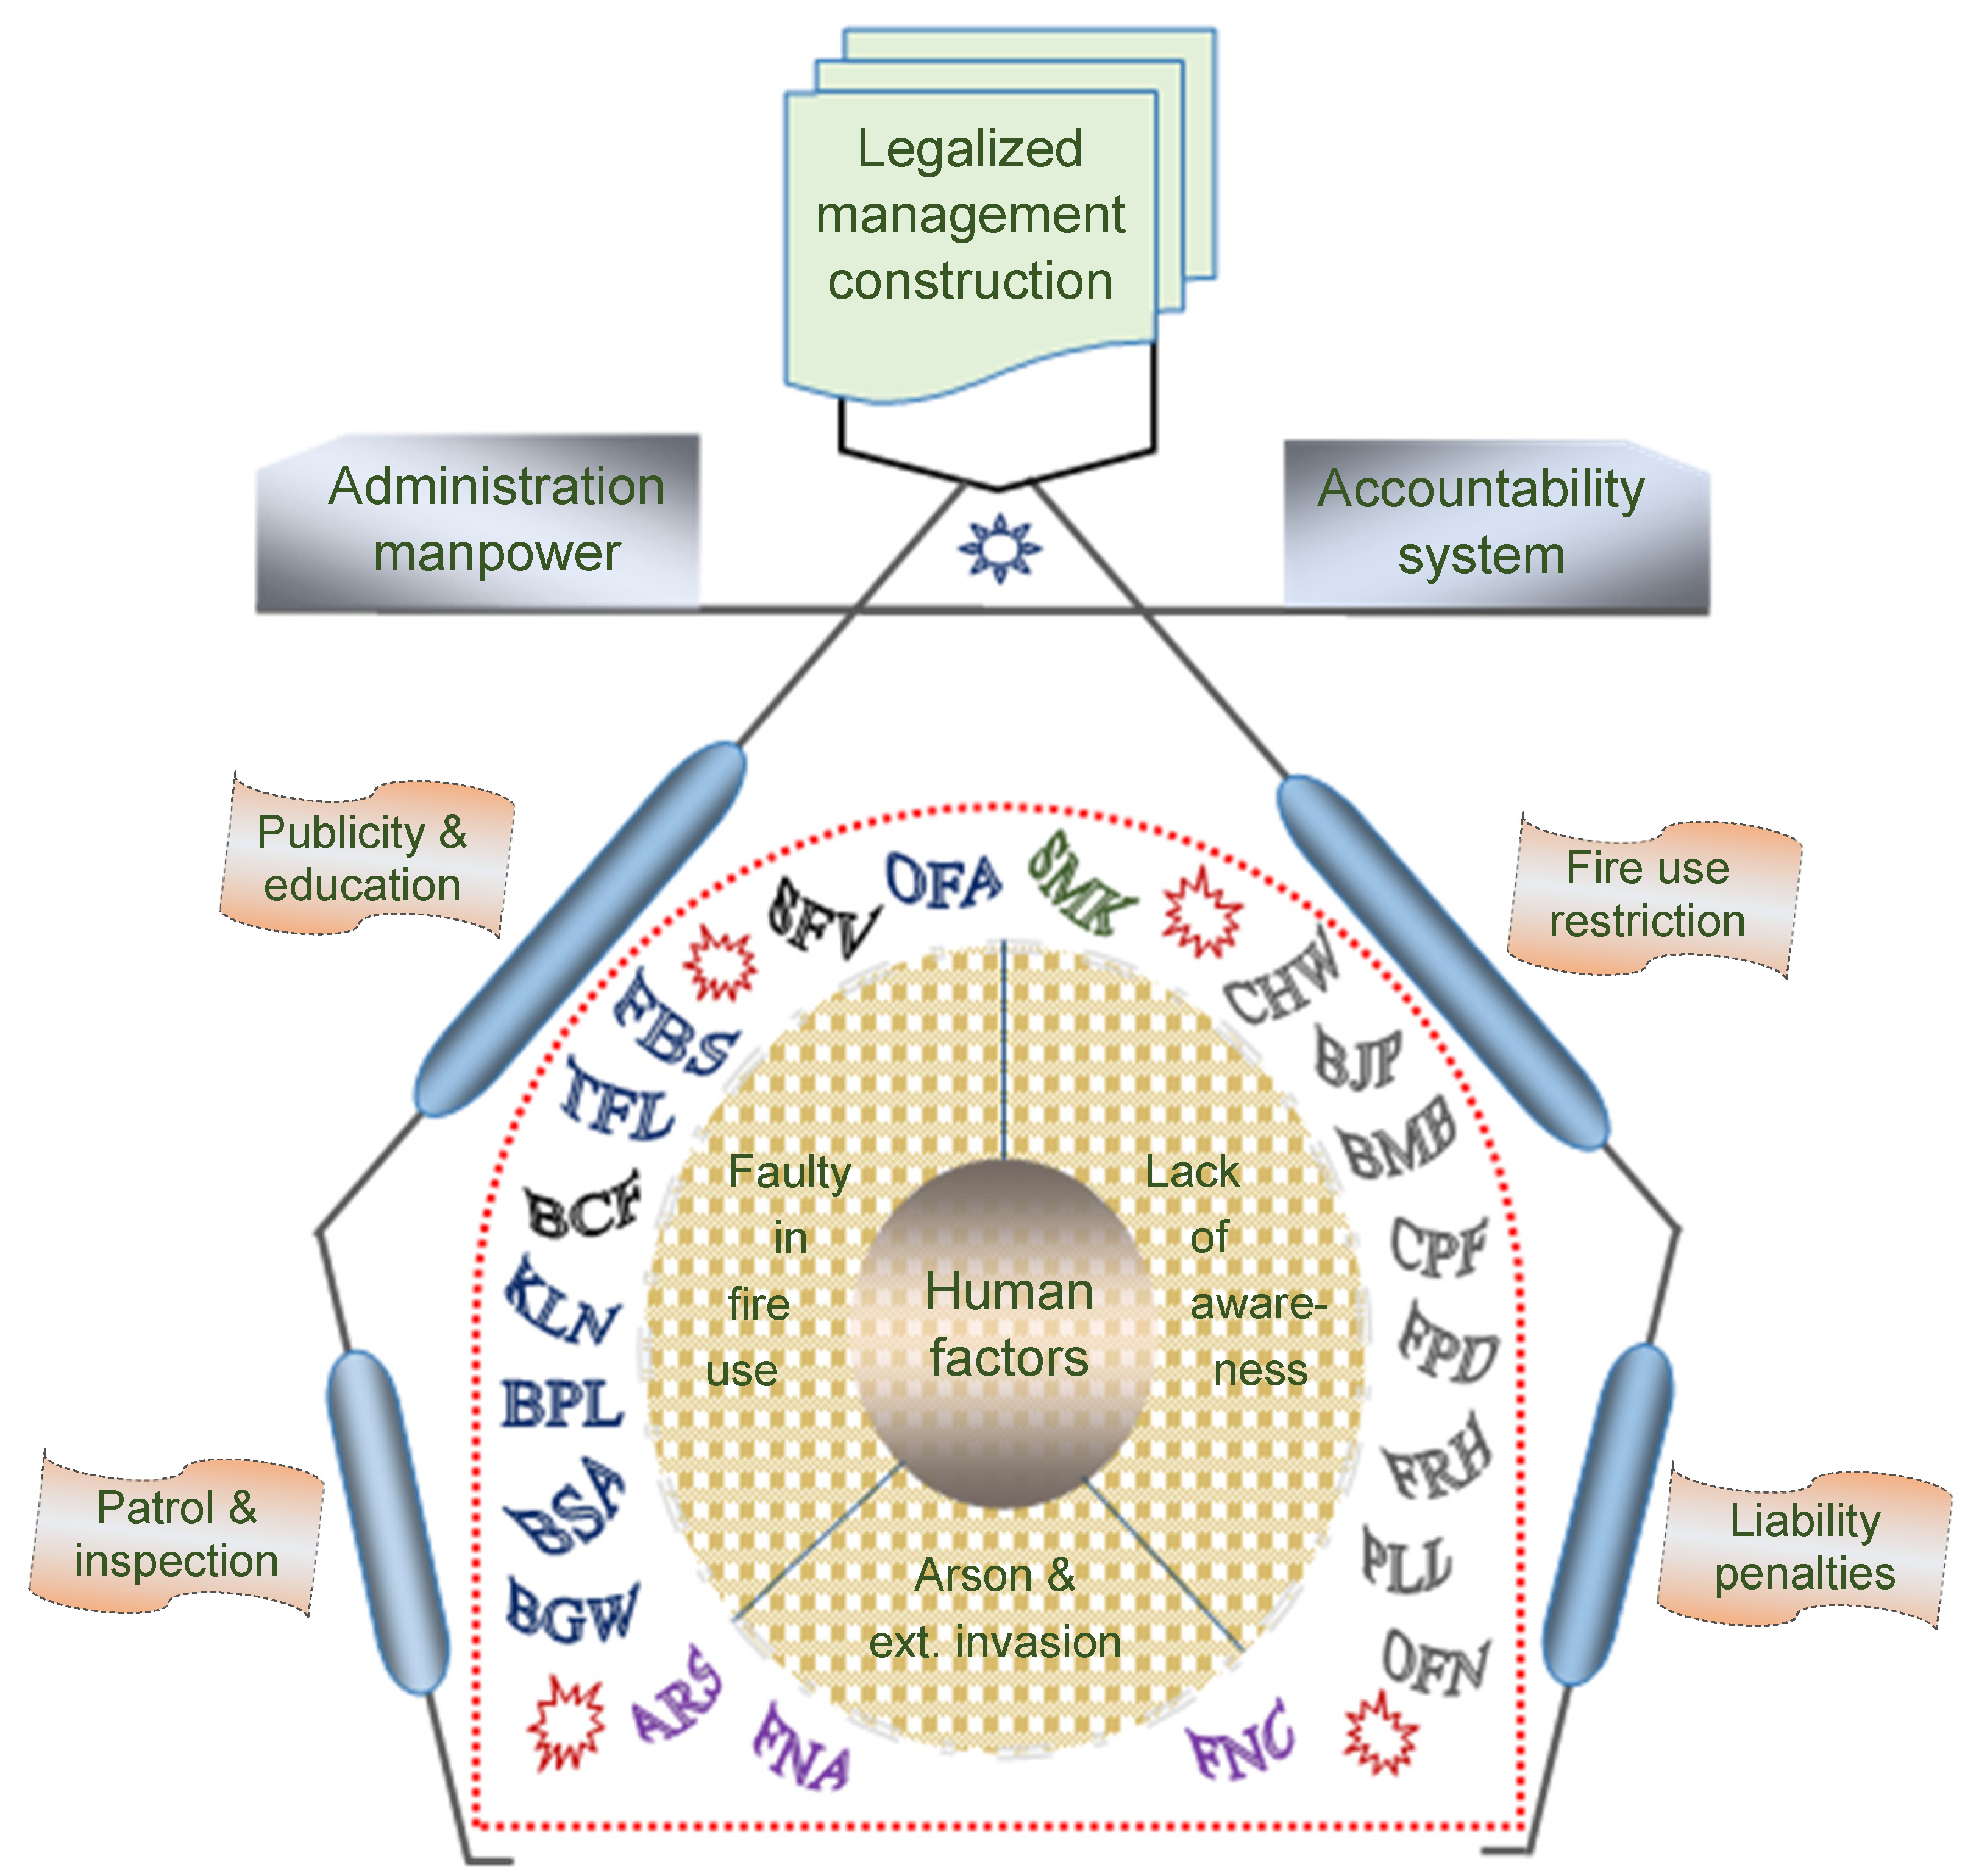
The accountability system of local executive heads for forest fire prevention was also established and implemented in forest areas (Figure 6). Under this administration framework, fire prevention responsibility was eventually shared by local households, orchards, and business owners [23]. For instance, the method of signing a declaration form for forest fire safety was often used to clarify the responsibilities of local residents [24]. Owners of tombs on the mountainside and in the forest were registered, in conjunction with a bilateral declaration for forest fire safety responsibilities signed with the village committee. If a forest fire occurs during the tomb-sweeping activities, the grave owner should bear the corresponding responsibility. These administrative fire control measures in wildfire-prone areas were long embedded in the concept of “assisted and managed community self-sufficiency” initiated by the workers in the USA [5,25]. Enhanced by the unique administration system in China, this concept has been fully expanded to its extreme in practice. Very practical classification of fire ignition sources also provided convenience for administrative operations to reach set goals with effectiveness and efficiency (refer to Figure 6).
The grassroots management teams and law enforcement departments are the main agencies involved in in the strict prohibition of burning grass and weeds in wildland, burning slash for afforestation, and setting off fireworks and firecrackers in fire seasons [13]. Under the unified deployment of the local forest fire prevention headquarters, a grid-based division of responsibilities was then established and proceeded. For example, in Shaoguan City, Guangdong Province, the main leaders of the government of each county (city, district) were directly responsible for the forest fire prevention in their respective jurisdictions. The responsibilities were then clarified in every grid point and allocated to an individual to ensure that all the fire-prone areas had been taken full charge and inspected from time to time [24]. To further ensure that the management of wildfire ignition sources is entirely in place, forest fire prevention supervision is implemented step by step during the fire alert period, which typically involves routine patrols, open and unannounced visits, special inspections, and subsequent guidance for implementing rectification [13,26].
Such nationwide measures played important roles in the simultaneous reduction of the fire incidents triggered by individual human-related fire causes year by year, which have been validated by the correlation analysis among the time series data for a number of items (refer to Figure 5). Up to date, forest fire management has stood the test of time despite the implementation of the policies of returning farmland to forests and afforestation, as well as the pressures brought in by drastic climate change. In such a large country with a massive population living nearby forests, the control of the frequency of forest fire at a very low level is definitely a remarkable success of the nation [13,14].
Worthy of mentioning, another effective measure for forest fire prevention and control in China is the construction of green fire barriers, which lays an important foundation for mitigating fire hazards and their impact [14]. Even though considerable human-caused fires inevitably occur every year, including fires caused by power line failure in forests, the number of major fires within the burnt area over 1000 ha in recent years has been well constrained: there were nine cases classified as major forest fires in 2019, and only seven were counted in 2020 [22,27]. The implementation of these fire prevention measures has played a vital role in the protection of forest resources and the ecological environment, accompanied by a significant reduction in the cost of rescue and aftermath. Evidently, it is also an important contribution to lessening annual carbon emissions of the nation.

5. Conclusions

Characteristics of fire causes and the progress in their control were elucidated at the national level for the first time. As revealed by the fire data over the years since 2003, human factors, such as BGW, BJP, and SMK, act as the major causes for forest fire initiation in China. The annual fire numbers underwent substantial decline after 2008 and stabilized at around 2000 after 2015. The considerable decline was closely related to the fire numbers triggered by the causes, such as BGW, SMK, CPF, and FDP, whereas those induced by BJP and NIS are basically unchanged. Owing to the drop in the total fire numbers, the proportion of fires triggered by natural factors increased from <1% at the early time to ~9% lately.
By defining a contribution extent parameter, it was found that the low number of fires maintained in recent years can be primarily attributed to the substantial decrease in the fire numbers initiated by BGW, with its contribution extent towards 54%; those with significant contributions include OFA and several from FUA. The correlation tests with the Pearson correlation model indicated a noteworthy correlation among the primary factors for the decline in fire numbers, pointing to the effective measures taken in controlling fire ignition sources and managing their potential fire risk. Through legislative construction, an accountability system at every level was established and maintained. With the comprehensive intervention of the forest public security power, multifaceted and full-coverage fire prevention publicity and education were also enhanced. Beyond these efforts, very detailed classification of fire ignition sources also facilitated the administrative operations to achieve the set goals with success.

Author Contributions

Conceptualization, H.W. and Z.S.; methodology, H.W., B.J., and S.A.; data collection, H.W. and K.Z.; formal analysis, H.W., B.J., K.Z., and S.A.; investigation, H.W.; resources, H.W., S.A., and Z.S.; data curation, H.W.; writing—original draft preparation, H.W.; writing—review and editing, H.W., K.Z., S.A., and Z.S.; supervision, H.W.; project administration, H.W.; funding acquisition, H.W. and Z.S. All authors have read and agreed to the published version of the manuscript.

Funding

This research was financially supported by Key Science and Technology Innovation Project of Guangdong Province, China (Grant number, 2020KJCX003).

Institutional Review Board Statement

Not applicable.

Informed Consent Statement

Not applicable.

Data Availability Statement

Data presented in this study are available to be shared upon reasonable request to the corresponding author.

Acknowledgments

The first author would like to express his sincere gratitude to Professional Committee of Forest Fire Prevention, Chinese Society of Forestry, for the arrangements and organization of a number of onsite meetings during the survey on the updated forest fire prevention measures implemented in major forest areas in China.

Conflicts of Interest

The authors declare no conflict of interest.

Abbreviations

ARSarson
BCFburning surface fuels to create fuelbreaks
BGWburning the grass in wasteland (uncultivated land) to produce charcoal
BJP burning joss paper at a grave site
BMBburning the mountain to repel beasts
BPLburning pasture to generate fertile land
BSAburning slash in the mountains for afforestation
CHWcooking and heating in wildland
CPFchildren playing with fire
FAAfire use in agricultural activities
FBSfailure of train brake shoes
FNAfire from a neighboring area/county
FNC fire from a neighboring country
FPDfire ignited by people with dementia
FRHfire escape from a resident house
FUAfire use in nonagricultural activities
KLN kilning
LTNlightning
MODISmoderate resolution imaging spectroradiometer
NISnatural ignition source
OFAthe others in the category of fire use in agricultural activities
OFNthe others in the category of fire use in nonagricultural activities
OHRother human related causes
PLL power line lodging
SFVspitfire by a machinery propelled vehicle
SMKsmoking in wildland
SPCspontaneous combustion
TFLtrain fire leak
UNFunidentified fire cases
VIIRSvisible infrared imaging radiometer suite

References

  1. Pyne, S.J.; Andrews, P.L.; Laven, R.D. Introduction to Wildland Fire; John Wiley and Sons: Chichester, UK, 1996. [Google Scholar]
  2. Yao, S.-R.; Wen, D.-Y. Principles of Forest Fire Protection Management; China Forestry Press: Beijing, China, 2002; pp. 21–24. [Google Scholar]
  3. Maingi, J.K.; Henry, M.C. Factors influencing wildfire occurrence and distribution in eastern Kentucky, USA. Int. J. Wildland Fire 2007, 16, 23–33. [Google Scholar] [CrossRef] [Green Version]
  4. Ganteaume, A.; Camia, A.; Jappiot, M.; San Miguel-Ayanz, J.; Long-Fournel, M. A review of the main driving factors of forest fire ignition over Europe. Environ. Manag. 2013, 51, 651–662. [Google Scholar] [CrossRef] [PubMed] [Green Version]
  5. Wang, H.-H. Exploration of the fire phenomena and countermeasures at the wildland and urban interface. Forest Fire Prev. 2008, 4, 13–15. (In Chinese) [Google Scholar]
  6. Ye, J.-X.; Wu, M.-S.; Deng, Z.-J.; Xu, S.-J.; Zhou, R.-L.; Clarke, K.C. Modeling the spatial patterns of human wildfire ignition in Yunnan province, China. Appl. Geogr. 2017, 89, 150–162. [Google Scholar] [CrossRef] [Green Version]
  7. Robertson, A. Investigators Confirm that PG&E Power Lines Started the Deadly Camp Fire. The Verge [15-05-2019]. Available online: https://www.theverge.com/2019/5/15/18626819/cal-fire-pacific-gas-and-electric-camp-fire-power-lines-cause (accessed on 5 November 2021).
  8. Tian, X.; Zhao, F.; Shu, L.; Wang, M. Distribution characteristics and the influence factors of forest fires in China. Forest Ecol. Manag. 2013, 310, 460–467. [Google Scholar] [CrossRef]
  9. Rodrigues, M.; Jiménez-Ruano, A.; Peña-Angulo, D.; de la Riva, J. A comprehensive spatial-temporal analysis of driving factors of human-caused wildfires in Spain using geographically weighted logistic regression. J. Environ. Manag. 2018, 225, 177–192. [Google Scholar] [CrossRef] [PubMed] [Green Version]
  10. Chas-Amil, M.; Prestemon, J.; Mc Clean, C.; Touza, J. Human-ignited wildfire patterns and responses to policy shifts. Appl. Geogr. 2015, 56, 164–176. [Google Scholar] [CrossRef]
  11. Fusco, E.J.; Abatzoglou, J.T.; Balch, J.K.; Finn, J.T.; Bradley, B.A. Quantifying the human influence on fire ignition across the western USA. Ecol. Appl. 2016, 26, 2390–2401. [Google Scholar] [CrossRef] [PubMed] [Green Version]
  12. Zhang, Z.; Li, J.; Yu, S.; Zhao, J. Spatial accessibility of anthropogenic fire ignition sources of grassland fire in northeast China. Int. J. Wildland Fire 2021, 30, 763–775. [Google Scholar] [CrossRef]
  13. Wang, H.-H. Outstanding achievements and core management mechanisms of forest fire prevention in China. Forest Fire Prev. 2019, 3, 1–8. (In Chinese) [Google Scholar]
  14. Wang, H.-H.; Finney, M.A.; Song, Z.-L.; Wang, Z.-S.; Li, X.-C. Ecological techniques for wildfire mitigation: Two distinct fuelbreak approaches and their fusion. Forest Ecol. Manag. 2021, 495, 119376. [Google Scholar] [CrossRef]
  15. National Interagency Fire Center. Fire Information—Statistics. Available online: https://www.nifc.gov/fireInfo/fireInfo_statistics.html (accessed on 10 June 2019).
  16. Dello, K. Prepare for larger, longer wildfires. Colum: World View. Nature 2017. [Google Scholar] [CrossRef]
  17. State Forestry and Grassland Administration. Annual Development Report. Available online: http://www.forestry.gov.cn/main/62/index.html (accessed on 10 June 2019).
  18. Statistical Yearbook Sharing Platform. China Forestry Statistical Yearbook (2003–2017). Available online: http://www.yearbookchina.com (accessed on 3 November 2021).
  19. MODIS. Active Fire and Burnt Area Products. Available online: http://www.modis-fire.umd.edu (accessed on 18 November 2022).
  20. Visible Infrared Imaging Radiometer Suite (VIIRS)—LAADS DAAC. Available online: https://ladsweb.modaps.eosdis.nasa.gov/missions-and-measurements/viirs/ (accessed on 30 November 2022).
  21. Guo, F.; Su, Z.; Wang, G.; Sun, L.; Lin, F.; Liu, A. Wildfire ignition in the forests of southeast China: Identifying drivers and spatial distribution to predict wildfire likelihood. Appl. Geogr. 2016, 66, 12–21. [Google Scholar] [CrossRef]
  22. Ministry of Emergency Management of the People’s Republic of China. Briefing of National Natural Disasters in 2020. Available online: https://www.mem.gov.cn/xw/yjglbgzdt/202101/t20210108_376745.shtml (accessed on 8 January 2022).
  23. Tian, F.-Q. Strengthen the sense of responsibility, fully implement the system of forest fire prevention chief executive responsibility. Forest Fire Prev. 2015, 1, 12–15. (In Chinese) [Google Scholar]
  24. Wei, S.-J.; Luo, B.-Z.; Li, X.-C.; Wu, Z.-P.; Wang, Z.-S.; Zhou, Y.-F.; Hu, H.-Q.; Sun, L.; Luo, S.-S.; Zhong, Y.-X. Strengthen the supervision of forest fire prevention and consolidate the responsibility for forest fire prevention at the grassroots level. Forest Fire Prev. 2019, 1, 1–5, 14. (In Chinese) [Google Scholar]
  25. Cohen, J.D.; Saveland, J. Structure ignition assessment can help reduce fire damages in the W-UI. Fire Manag. Notes 1997, 57, 19–23. [Google Scholar]
  26. Zhou, S.-R. Talking about the publicity and education of forest fire prevention in ecotourism. Forest Fire Prev. 2017, 4, 21–23. (In Chinese) [Google Scholar]
  27. Ministry of Emergency Management of the People’s Republic of China. Briefing of National Natural Disasters in 2019. Available online: https://www.mem.gov.cn/xw/bndt/202001/t20200116_343570.shtml (accessed on 16 January 2022).
Figure 1. Averaged fire number distribution in terms of fire causes throughout the years studied: (a) among FAA, FUA, OHR, NIS and UNF, (b) within the fire causes of FAA, (c) within FUA and (d) from both OHR and NIS.
Fire 05 00215 g001
Figure 2. Variation in fire case numbers sorted in different categories through the years from 2003 to 2017.
Fire 05 00215 g002
Figure 3. Variation patterns of the ratios of the fire numbers induced by fire causes of FAA (a), FUA (b) and some others (c) to the corresponding fire data in 2008.
Fire 05 00215 g003
Figure 4. Comparison of the extent of contribution of various fire causes to the decrease in annual fire numbers.
Fire 05 00215 g004
Figure 5. Correlations among the variation patterns of fire numbers induced by different fire causes.
Fire 05 00215 g005
Figure 6. Outline of the management measures implemented and their profound role in constraining fire ignition sources.
Fire 05 00215 g006
Table 1. Forest fire statistical data in the years between 2003 and 2019.
Fire Num.Identified Fire IncidentsUnidentified
Fire Use in Agricultural ActivityFire Use in Non-Agricultural ActivityOther Human Related Ignition CauseNatural Ignition Source
CasePerc. %CasePerc. %CasePerc. %CasePerc. %CasePerc. %
200310,463432041.3399538.22852.7930.9177016.9
200413,466649448.2481635.82141.6990.7184313.7
200511,542449238.9526045.61871.6950.8150813.1
20068170253831.1414450.71912.3861.1121114.8
20079260335436.2399643.22152.31591.7153616.6
200814,144761753.9438031.02261.6880.6183313.0
20098859407045.9313135.31561.8530.6144916.4
20107723298138.6273435.41752.31181.5171522.2
20115550196635.4264247.6921.71031.974713.5
20123966112128.3232058.5882.2370.940010.1
20133929150538.3157140.0651.7932.469517.7
20143703125433.9160643.4992.7581.668618.5
2015293672924.8153552.3491.71555.346815.9
2016203454726.9100649.5412.0522.638819.1
2017322361819.2159449.5652.02979.264920.1
20182478n/a * n/a n/a n/a n/a
20192345n/a n/a n/a n/a n/a
* Since 2018, detailed statistical data are missing, owing to the institutional adjustment of the central government in China and the associated change in the focus of forest fire statistics across the nation.
Table 2. Detailed statistical data for the identified fire cases in the years between 2003 and 2017.
FAA *FUA **OHR ***
BGWBSABPLKLNBCFTFLFBSSFVOFASMKCHWBJPBMBCPFFPDFRHPLLOFNARSFNAFNC
20033325321272156120105481092171116289485309141215521937319
2004539446251223570851511601591853565612671697647117898
200533502654571120480869814630065338127088561388954
20062134119233310624960511523033628921512894801017119
200725612883967106466725111143551449314201127798512010
2008609348235103569594287812015873244125322100947841366
200930973872178111547628107964333732261913364869789
201020463144521201156035783109120260214586618917410
20111357264851311231540838130727190148136244947423
2012769143101601218917136155616989596127834459
20131135141213003220206395838104113710041125391
201492598121300121422240741101199786030942525
2015518491000011601082210447363745622134123
20163763661300112492125769293683021417240
2017n/a **60n/an/a3n/an/an/an/a108511205n/a3060n/a52n/a18398
* FAA—fire use in agricultural activities; BGW—burning the grass in wasteland (uncultivated land) to produce charcoal; BSA—burning slash in the mountains for afforestation; BPL—burning pasture to generate fertile land; KLN—kilning; BCF—burning surface fuels to create fuelbreaks; TFL—train fire leak; FBS—faulty of train brake shoes; SFV—spitfire by a machinery propelled vehicle; OFA—the others in the category of fire use in agricultural activities; ** FUA—fire use in nonagricultural activities; SMK—smoking in wildland; CHW—cooking and heating in wildland; BJP—burning joss paper at grave site; BMB—burning the mountain to repel beast; CPF—children playing with fire; FPD—fire ignited by people with dementia; FRH—fire escape from a resident house; PLL—power line lodging; OFN—the others in the category of fire use in nonagricultural activities; *** OHR—other human related ignition sources; ARS—arson; FNA—fire from a neighboring area/county; FNC—fire from a neighboring country.
Publisher’s Note: MDPI stays neutral with regard to jurisdictional claims in published maps and institutional affiliations.