Article

Assessment of a Differential Subgrid Stress Model for Large-Eddy Simulations of Turbulent Unconfined Swirling Flames

Central Aerohydrodynamic Institute (TsAGI), 1 Zhukovsky Str., 140180 Zhukovsky, Russia
*
Authors to whom correspondence should be addressed.
Submission received: 27 January 2023 / Revised: 17 February 2023 / Accepted: 27 February 2023 / Published: 28 February 2023
(This article belongs to the Special Issue Premixed and Non-premixed Flame Propagation and Suppression)

Abstract

:
Swirling flames are widely used in engineering to intensify mixing and stabilize combustion in gas turbine power plants and industrial burners. Swirling induces new instability modes, leading to intensification of coherent structures, asymmetric geometry, vortex core precession, and flame oscillations. Large-Eddy Simulation (LES) has the capability to furnish more accurate and reliable results than the simulations based on Reynolds-averaged Navier–Stokes equations (RANS). Subgrid-scale models in LES need to describe the backscatter (local transfer of kinetic energy from small scales to larger scales) that is intensified in swirling flames. In this paper, the Differential Subgrid Stress Model (DSM), previously developed by the authors, is assessed using an experimental database from Sydney University on swirl-stabilized turbulent unconfined non-premixed methane-air flame. Regime without vortex precession is simulated numerically using the DSM and Smagorinsky subgrid-scale model. Experimental measurements of mean velocity, profiles of mass fractions, and temperature are used for comparison with the simulation data. The standard Smagorinsky model is considered the basic approach. Differences in the flow field statistics obtained in both subgrid-scale LES models are analyzed and discussed. The importance of taking the backscatter into account is highlighted.

1. Introduction

In the previous article [1], a new differential subgrid stress model (DSM) was proposed for Large-Eddy Simulations (LES) of complex turbulent flows. The model was a priori term-by-term calibrated against an open DNS database on homogeneous isotropic turbulence [2]. After that, it was applied to the LES of non-premixed turbulent combustion. To demonstrate the impact of the new subgrid stress model on the scalar fields, the so-called isothermal combustion, where the backward effect of heat release on the flow is excluded, was considered in the previous article [1]. The new subgrid stress model was compared with the classical Smagorinsky model [3], its dynamic version [4], and the WALE model [5]. There appeared to be no significant differences in the resolved velocity and mixture fraction fields. However, the new model was able to simulate the backscatter (local transfer of kinetic energy from small scales to larger scales [6]), in contrast to subgrid viscosity models. The subgrid statistics of the mixture fraction also appeared to depend on the subgrid stress field significantly. For example, in the conducted simulations, subgrid scalar variance was found to be four times lower with the DSM than with the Smagorinsky model. Such differences may be important when advanced turbulence-combustion interaction models are employed.
To better understand the advantages and disadvantages of the DSM, it is necessary to perform tests in anisotropic flows, such as swirling combustion.
Swirling flames are widely used in engineering to intensify mixing and stabilize combustion in gas turbine power plants [7] and industrial burners [8]. Swirling has a significant impact on the characteristics of the flow. In particular, it induces new instability modes, leading to intensification of coherent structures and phenomena similar to asymmetric geometry, vortex core precession, and flame oscillations [9].
For such flows, Large-Eddy Simulation (LES) has the capability to furnish more accurate and reliable results than simulations based on Reynolds-averaged Navier-Stokes equations (RANS) [10]. Different LES approaches were applied to the simulation of swirling flames in many works. A comprehensive review [11] contains more than 400 references. We shall point only to a few examples. Strongly swirled unconfined premixed flame was simulated in Darmstadt Technical University on the basis of the G-equation, numerically tracked using level-set methods [12]. In the work [13], the LES approach together with the flamelet method was applied to study the influence of confinement on premixed turbulent swirling flame. Researchers from Cambridge University used LES with detailed chemistry and a conditional moment closure combustion model to simulate a swirling spray flame close to blowoff [14].
To replicate the essential physical mechanisms related to density variation due to heat release and acoustic perturbations of the pressure field, compressibility effects should be taken into account. Recent experiments show an increase in the energy backscatter intensity in swirling flames [15]. Therefore, subgrid-scale models in LES need to correctly describe the backscatter. It is this property that is an advantage of the DSM [1].
This paper is devoted to the validation of the DSM by comparison of simulation results with the experimental database on swirling combustion and with similar simulations based on the Smagorinsky model.
Swirling combustion was studied experimentally for validation purposes by many researchers. A review of laboratory experiments focused on model validation purposes is given in [16]. To validate the DSM, we have considered several possible sources of the experimental data and rejected some of them for the following reasons: For example, in Sweden, an atmospheric-pressure laboratory swirl burner with a lean premixed methane/air flow, injected in an unconfined low-speed flow of air was studied [17]. Moderate swirl triggered weak vortex breakdown in the downstream direction. Optical measurements were used, including both 3-component and 2-component PIV, filtered Rayleigh scattering to examine the temperature field, and acetone-PLIF to measure the fuel distribution. However, the new DSM was previously applied to non-premixed combustion using the flamelet method in approximation of an infinite-rate reaction, and it was natural to make the following step with a finite-rate non-premixed flamelet model of turbulent combustion. A Ph.D. thesis [18], prepared at Cincinnati University, studied a non-premixed flame in both confined and unconfined conditions with a novel swirling injector, using 2D Laser Doppler Velocimetry (LDV); in this work, diesel fuel was used, and two-phase effects were present, which makes this experiment unsuitable for basic validation. In the Indian Institute of Science (Bangalore), transitional regimes and blowoff of the unconfined, non-premixed swirling flame were studied using CH∗ chemiluminescence imaging and 2D PIV in meridional planes [19]; however, digital data are not available.
Based on this overview, the authors decided to assess the DSM [1] using an open experimental database from the University of Sydney [20]. In these experiments, a swirl-stabilized turbulent unconfined non-premixed methane-air flame is considered. The bluff-body burner of a very simple geometry is used, providing well-defined boundary conditions. An extensive and comprehensive database is available, including the detailed specification of boundary conditions, the 3-component LDV of the velocity field, instantaneous Raman/Rayleigh/LIF measurements of composition with statistical processing (conditional and radial mean values and RMS data are available), and shadowgraph visualization. Various values of the swirl parameter, fuel/air mass flow ratio, and various velocities of fuel and air were considered, resulting in a variety of flow modes (with different shapes of flame, both symmetric and asymmetric, with and without vortex core precession, and with different frequencies of local extinction events).
In addition, the regime without vortex core precession from the Sydney database, denoted SM1, was previously used for comparative testing of several subgrid models [21]. This regime was used in the present paper. It is simulated numerically using the DSM and Smagorinsky subgrid-scale models. For a correct comparison with the work [21], the same model of methane-air kinetics [21,22] and similar geometry of the computational domain are considered.
To perform the simulations, the DSM was reformulated for a compressible solver and extended with several corrections, such as stabilization for the triple velocity correlation model, a compressibility account, and numerical smoothing for grids with non-uniform cell spacing. To calculate the combustion rate, the chosen kinetic scheme was applied to create the library of non-premixed flamelets [23], which also includes temperature to control the sources of components in premixed areas. Our simulations are based on the in-house code zFlare developed at the Central Aerohydrodynamic Institute (TsAGI). The details of spatial and temporal approximation are described in [24].
The rest of the article is organized as follows: Section 2 starts with a description of governing equations, basic closures, and numerical setup. It is followed by the formulation of the flamelet approach used in this study, chemical kinetics and mixture fraction equations, and the modifications introduced to stabilize the DSM approach for flows with turbulence-combustion interaction. A simulation of decaying turbulence carried out to check that the modifications keep the DSM prediction in accordance with theoretical requirements is also described. The section is concluded with the formulation of the swirling burner test case. Section 3 is devoted to the comparison between the simulations and experimental data. Experimental measurements of mean velocity, profiles of mass fractions, and temperature are used for the comparison. The differences in the flow field statistics obtained in the simulations with DSM and Smagorinsky subgrid models are analyzed and discussed. The importance of taking the backscatter into account is highlighted. The presented simulations showed that the combustion characteristics are qualitatively similar to experimental data, according to the temperature profiles and mass fraction fields, although both models have discrepancies at the beginning of the flame bottleneck.

2. Governing Equations and Closures

2.1. Basic System for Compressible Reacting Flow

Our research is based on compressible, spatially filtered Navier–Stokes equations with Boussinesq closure for turbulent scalar transport. The equations read:
ρ ¯ t + x i ρ ¯ u ˜ i = 0 ,
t ρ ¯ u ˜ i + x j ρ ¯ u ˜ i u ˜ j + τ i j x j = p ¯ x i ,
t ρ ¯ E ˜ + x i ρ ¯ H ˜ u ˜ i + τ i j u ˜ j + x i k = 1 N s p h ˜ k μ ˜ S c + μ s g s S c T Y ˜ k x i + x i μ ˜ P r + μ s g s P r T C p T ˜ x i = 0 ,
t ρ ¯ Y ˜ j + x i ρ ¯ Y ˜ j u ˜ i + x i μ ˜ S c + μ s g s S c T Y ˜ j x i = ω ˜ j
In the systems (1)–(4), the summation over repeated indices is adopted. The overbar denotes spatial averaging across the filter of size Δ , whereas the tilde denotes Favre spatial averaging across the same filter, as it is proposed in [25]. Unlike Reynolds averaged correlations, for the spatially filtered correlations, the Germano treatment is used:
a b ¯ = a b ¯ a ¯ b ¯ ,           a b c ¯ = a b c ¯ a ¯ b c ¯ b ¯ c a ¯ c ¯ a b ¯ a ¯ b ¯ c ¯ .
Analogous treatment is applied to correlations that are spatially filtered according to Favre rules ( a b ,   ˜   a b c ˜ ).
The gas is considered as a mixture of N s p species, so it is necessary to solve N s p transport Equation (4) for mass fractions Y ˜ i . In fact, it is possible to solve only N s p 1 equations because the sum of Y ˜ i   is equal to 1; nevertheless, we prefer not to exclude any mass fraction equations to prevent the accumulation of numerical errors. This approach implies the use of a re-normalization procedure to keep the sum of Y ˜ i   equal to unity at each time step of the simulation.
Equations (2) and (3) contain the sum of subgrid and molecular stresses, which is represented as
τ i j = ρ ¯ u i u j ˜ 2 μ ˜ S ˜ i j 1 3 u ˜ k x k δ i j ,
where S ˜ i j = u ˜ i / x j + u ˜ j / x i / 2 is a rate of strain tensor and μ is a dynamic molecular viscosity, defined by Sutherland’s formula:
μ = 1.72 · 10 5 · T 273 3 / 2 273 + 122 T + 122   kg m · s
Energy Equation (3) includes total enthalpy, which is denoted by H ˜ and represents the sum of specific enthalpy of species formation h ˜ 0 = j Y ˜ j h j 0 T ˜ , sensible enthalpy h ˜ s = j Y ˜ j h s , j T ˜ , and kinetic energy, so that H ˜ = h ˜ 0 + h ˜ s + u ˜ i u ˜ i / 2 + k . For the summary enthalpies of separate components, h j T ˜ = h j 0 T ˜ + h s , j T ˜ , approximations by quadratic polynomials are used, based on the database [26] and applicable within the range 250   K < T ˜ < 3000   K . Here k = u i u i ˜ / 2 is the subgrid-scale turbulence energy. Total energy E ˜ equals H ˜ p ¯ / ρ ¯ . Inclusion of species formation enthalpy into H ˜   and E ˜   allows to exclude the chemical source term on the right-hand side of the energy equation. The specific heat of a mixture at constant pressure is calculated as C P = j Y ˜ j d h j / d T ˜ . Energy and species transport equations utilize turbulent subgrid viscosity μ s g s for the closure of scalar-velocity correlations T u j ˜ and Y i u j ˜ , which involve turbulent Prandtl and Schmidt numbers. Hereinafter, these parameters remain constant and equal to 0.9 and 1.0, respectively, although their influence was considered for LES in [27] and for round jets in RANS simulations presented in [28,29]. The energy equation also contains the work produced by subgrid and molecular stresses.
Velocity correlations u i u j ˜ represent the subgrid-scale momentum transport and can be described by either the Smagorinsky model or the more complicated DSM approach, the latter involving six additional differential equations for the components of the subgrid stress tensor u i u j ˜ . To simulate compressible flows with combustion, the DSM model [1], which was originally calibrated against an incompressible database, required several modifications to achieve stability. These modifications include compressibility correction, anisotropy invariant stabilization, subgrid-scale diffusion simplification, and numerical smoothing. All these techniques are described in more detail below. The updated model was tested on decaying turbulence, and its statistical characteristics remained consistent with theoretical requirements.
The chemical source for the j -th mass fraction equation ω ˜ j requires separate consideration due to the influence of turbulence on the mean reaction rates, also known as turbulence-combustion interaction, or TCI. The first channel of TCI, which affects reaction rates due to turbulence fluctuations, results in perturbations of the flame front, affects the formation of premixed areas in recirculation zones, and occasionally can cause fire extinction [30]. The main contribution into ω ˜ j is made by small-scale turbulence that is not resolved within the LES approach. In the present paper, this contribution is simulated with the use of the steady non-premixed flamelet model [23] based on the assumption of high Damköhler numbers.

2.2. Chemical Kinetics and Flamelet Library

For methane-air combustion, the considered species are N 2 , O 2 , CH 4 , CO 2 , and H 2 O . The process of combustion is represented by a global kinetic mechanism by Hu, Zhou and Luo [21,22] with a single unidirectional reaction:
CH 4 + 2 O 2 2 H 2 O + CO 2 .
This simple reaction mechanism does not contain the process of radical formation; it is incapable of reproducing the correct induction time, so it assumes that the flame is already ignited. The rate of the reaction (5) is approximated by the following formula [21,22]:
ω j = m j ν j m CH 4 ν CH 4 ω ,   ω = B · Y CH 4 0.2 Y O 2 1.3 exp E A R 0 T ,
(no summation over j ), where m j is the molecular weight of the j-th component and ν j is the molar stoichiometric coefficient of the j-th component in the reaction. In Equation (5) ( ν CH 4 = 1 , ν O 2 = 2 , ν H 2 O = 2 , ν CO 2 = 1 ), R 0 = 8.314     J · mole 1 · K 1 is the universal gas constant, E A = 2.027 × 10 5     J · mole 1 , and B = 2.119 × 10 11     kg · s 1 · m 3 .
The steady non-premixed flamelet approach is based on the filtered mixture fraction variable z ˜ and its variance z 2 ˜ . The mixture fraction [23] is a variable that describes the mixing. It is zero in pure air and one in fuel and varies between these limiting values.
To determine z ˜ and z 2 ˜ , one should solve two additional differential equations. The first of them is a simple transport equation for a passive scalar, while the second contains two source terms, production P ˜ z and scalar dissipation χ ˜ :
ρ ¯ z ˜ t + x k ρ ¯ z ˜ u ˜ k + ρ ¯ z u k ˜ = 0 , ρ ¯ z 2 ˜ t + x k ρ ¯ z 2 ˜ u ˜ k + ρ ¯ z 2 u k ˜ = ρ ¯ P ˜ z ρ ¯ χ ˜ .
Equation (7) requires closures for turbulent transport terms z u k ˜ and z 2 u k ˜ . They are approximated using turbulent subgrid viscosity ν s g s to maintain compatibility with the Smagorinsky model (the latter will participate in the comparison of subgrid models):
z u k ˜ = z u k ˜ = σ z 1 ν s g s z ˜ x k ,               z 2 u k ˜ = σ z 2 ν s g s z 2 ˜ x k .
Here σ z 1 = σ z 2 = 1 for simplicity. Closures for source terms are standard and are based on ν s g s , filtered gradients for production, and on the subgrid turbulent timescale τ ~ Δ / k ( Δ ) for scalar dissipation:
P ˜ z = 2 z u k ˜ z ˜ x k = 2 σ z 1 ν s g s z ˜ x k z ˜ x k ,
χ ˜ = C χ ε k z 2 ˜ = C χ C E 0 k Δ z 2 ˜ ,   C χ = 2.5 ,                 C E 0 = 0.47 .
The value of C E 0 was found in [1], and the value of C χ was determined in the present study as a result of numerical optimization in a series of preliminary simulations with the Smagorinsky subgrid model. The value of the resolved (i.e., spatially filtered) reaction rate ω ˜ j in Equation (4) is calculated using the assumption (which is similar to an ergodic hypothesis) that spatial filtering is equivalent to integration with the probability density function:
ω ˜ j x 1 ρ ¯ V ρ ξ ω j ξ G ξ x , Δ d V ξ 0 1 ω j z , χ s t x , p ¯ x P D F z , z ˜ x , z 2 ˜ x d z ,
where G x , Δ is the kernel of the spatial filter with characteristic scale Δ , and P D F z , z ˜ , z 2 ˜ is the probability density function of mixture fraction z . Within this paper, a presumed beta PDF [1,23] is used that depends upon two local parameters: z ˜ x and z 2 ˜ x . Additionally, in Equation (9), p ¯ is the local spatially filtered pressure, and χ s t is the local conditionally filtered value of scalar dissipation:
χ s t x χ ξ δ z ξ z s t G ξ x , Δ d V ξ δ z ξ z s t G ξ x , Δ d V ξ ,
where δ a is the Dirac delta function and z s t is the value of the mixture fraction, for which the stoichiometric ratio of diffusive mass fluxes of fuel and oxidizer is reached [23]:
z s t = Y O , O L 0 Y F , F + Y O , O 0.054 ,       L 0 = m O ν O m F ν F = 4 .
Here L 0 is the mass stoichiometric coefficient, and Y F , F and Y O , O are the mass fractions of fuel (methane) at z = 1   and oxidizer (oxygen) at z = 0 , respectively.
Within this paper, the Pitsch and Peters hypothesis [31,32] concerning the distribution of the scalar dissipation χ z is used, which goes back to the Kolmogorov and Oboukhov 1962 theory [33] on the turbulent kinetic energy dissipation distribution. According to Pitsch and Peters, scalar dissipation obeys similar rules and has a lognormal distribution, which means that the logarithm of χ has a Gaussian distribution.
Pitsch and Peters have proposed the following approximation of the lognormal distribution of scalar dissipation:
χ = χ s t z 2 z s t 2 l n z l n z s t .
It is possible to express χ s t from Formula (11). Averaging of this expression and neglecting the contribution of z leads to the following simplified formula for χ ˜ s t that was used in our simulations:
χ ˜ s t = z ˜ s t 2 z ˜ 2 l n z ˜ s t l n z ˜ C χ s t ε ˜ k ˜ z 2 ˜ ,       C χ s t = 1.7 ,       ε ˜ k ˜ z 2 ˜ = C E 0 k ˜ Δ z 2 . ˜
The optimal value of the constant C χ s t = 1.7 was determined in a series of parametric calculations; it differs from the value stated in (8). Note that a significant influence on the levels of temperature was found. This value will be utilized for both DSM and Smagorinsky simulations.
This simplified model for the stoichiometric scalar dissipation rate utilizes cell averaged values, unlike its original definition (10), where the averaging is performed only over the stoichiometric mixture locations inside the filtering region. In the works [31,32], it is taken into account by assuming some distribution of χ z and establishing the relation between χ ˜ and χ s t . However, the question about the validity of the assumed distribution for the considered flow arises. A simplified model (12) can lead to the amplification of flame-turbulence interactions. The authors plan to search for an adequate model and study its influence on the simulation of the presented flow in the future.
Dependencies ω z , χ s t x , p ¯ x and T z , χ s t x , p ¯ x in (9) are determined from the numerical solution of the steady one-dimensional flamelet equations [1,23]. For this purpose, the in-house code zFlare-flamelet (TsAGI) was applied. Calculations were performed for 10 values of χ s t and for 10 values of p ¯ . After that, for each pair χ s t , p ¯ the integrals (9) were calculated for 100 values of z ˜ and 50 values of z 2 ˜ . Thus, a four-dimensional flamelet library of size 100 × 50 × 10 × 10 was obtained.
Due to the fact that this flamelet library describes fire extinction for high χ s t values, the flame front may reveal the presence of extinction holes. Moreover, there could be self-ignition combustion in premixed areas of recirculation. In these cases, the model of steady, non-premixed flamelets can give inadequate reaction rates. To avoid unphysical behavior, an original reaction rate limitation is proposed in this article, which involves bounding by a quasi-laminar reaction rate taken at a temperature T f l obtained from the flamelet library:
ω ˜ B · Y ˜ CH 4 0.2 Y ˜ O 2 1.3 exp E A R 0 max T f l ,   T ˜ .
The T f l parameter is calculated using PDF, analogous to (9), whereas T ˜ is the local value of the resolved temperature obtained from the solution of Equations (1)–(4). The chemical source (9), averaged using the flamelet library, is usually smaller than the right-hand side of (13), which is based on local parameters. Therefore, the restriction (13) works only in rare situations where the model of steady, non-premixed flamelets is inapplicable. For example, sometimes it is observed that the fuel (or oxidizer) is totally consumed on the stoichiometric iso-surface, while the flamelet-based formula (9) predicts a finite rate of the reaction. Such situations can arise because flamelets are used only for the calculation of chemical sources, whereas concentration fields are obtained from Equation (4) and are not strictly coupled with the mixture fraction z ˜ . The flamelet library provides source terms based only on pressure, scalar dissipation rate χ s t , mixture fraction z ˜ and its variance z 2 ˜ . It is not capable of detecting such situations, whereas the restriction (13) solves this problem.
It is necessary to consider the possibility of using the kinetic scheme from [21] with the TCI approach described above. As stated in the article [34], this kinetics by Zhou is based on Westbrook’s 1981 set of 3 kinetics [35] for premixed methane-air flames. It uses the same value of E A , the same powers of concentration, although kinetics by Zhou has a higher pre-exponential multiplier and neglects density.
Testing of this kinetics in laminar flame calculations revealed that it significantly overestimates laminar flame speed, predicting values of 1.5 2   m / s near stoichiometric mixture depending on the equivalence ratio, whereas the experimental values are close to 0.4   m / s . However, it is well known that flamelet models of TCI have a low sensitivity to the chemical kinetics. To check the possibility of using the kinetics from [21], the flamelet library data obtained with this kinetics was compared with analogous data obtained using the four-reaction quasi-global kinetic scheme of methane-air oxidation by Basevich et al. [36]. The latter was verified to give an appropriate laminar flame front velocity for the equivalence ratio below 1. The third kinetics in this comparison is BFER2 kinetics by Franzelli et al. [
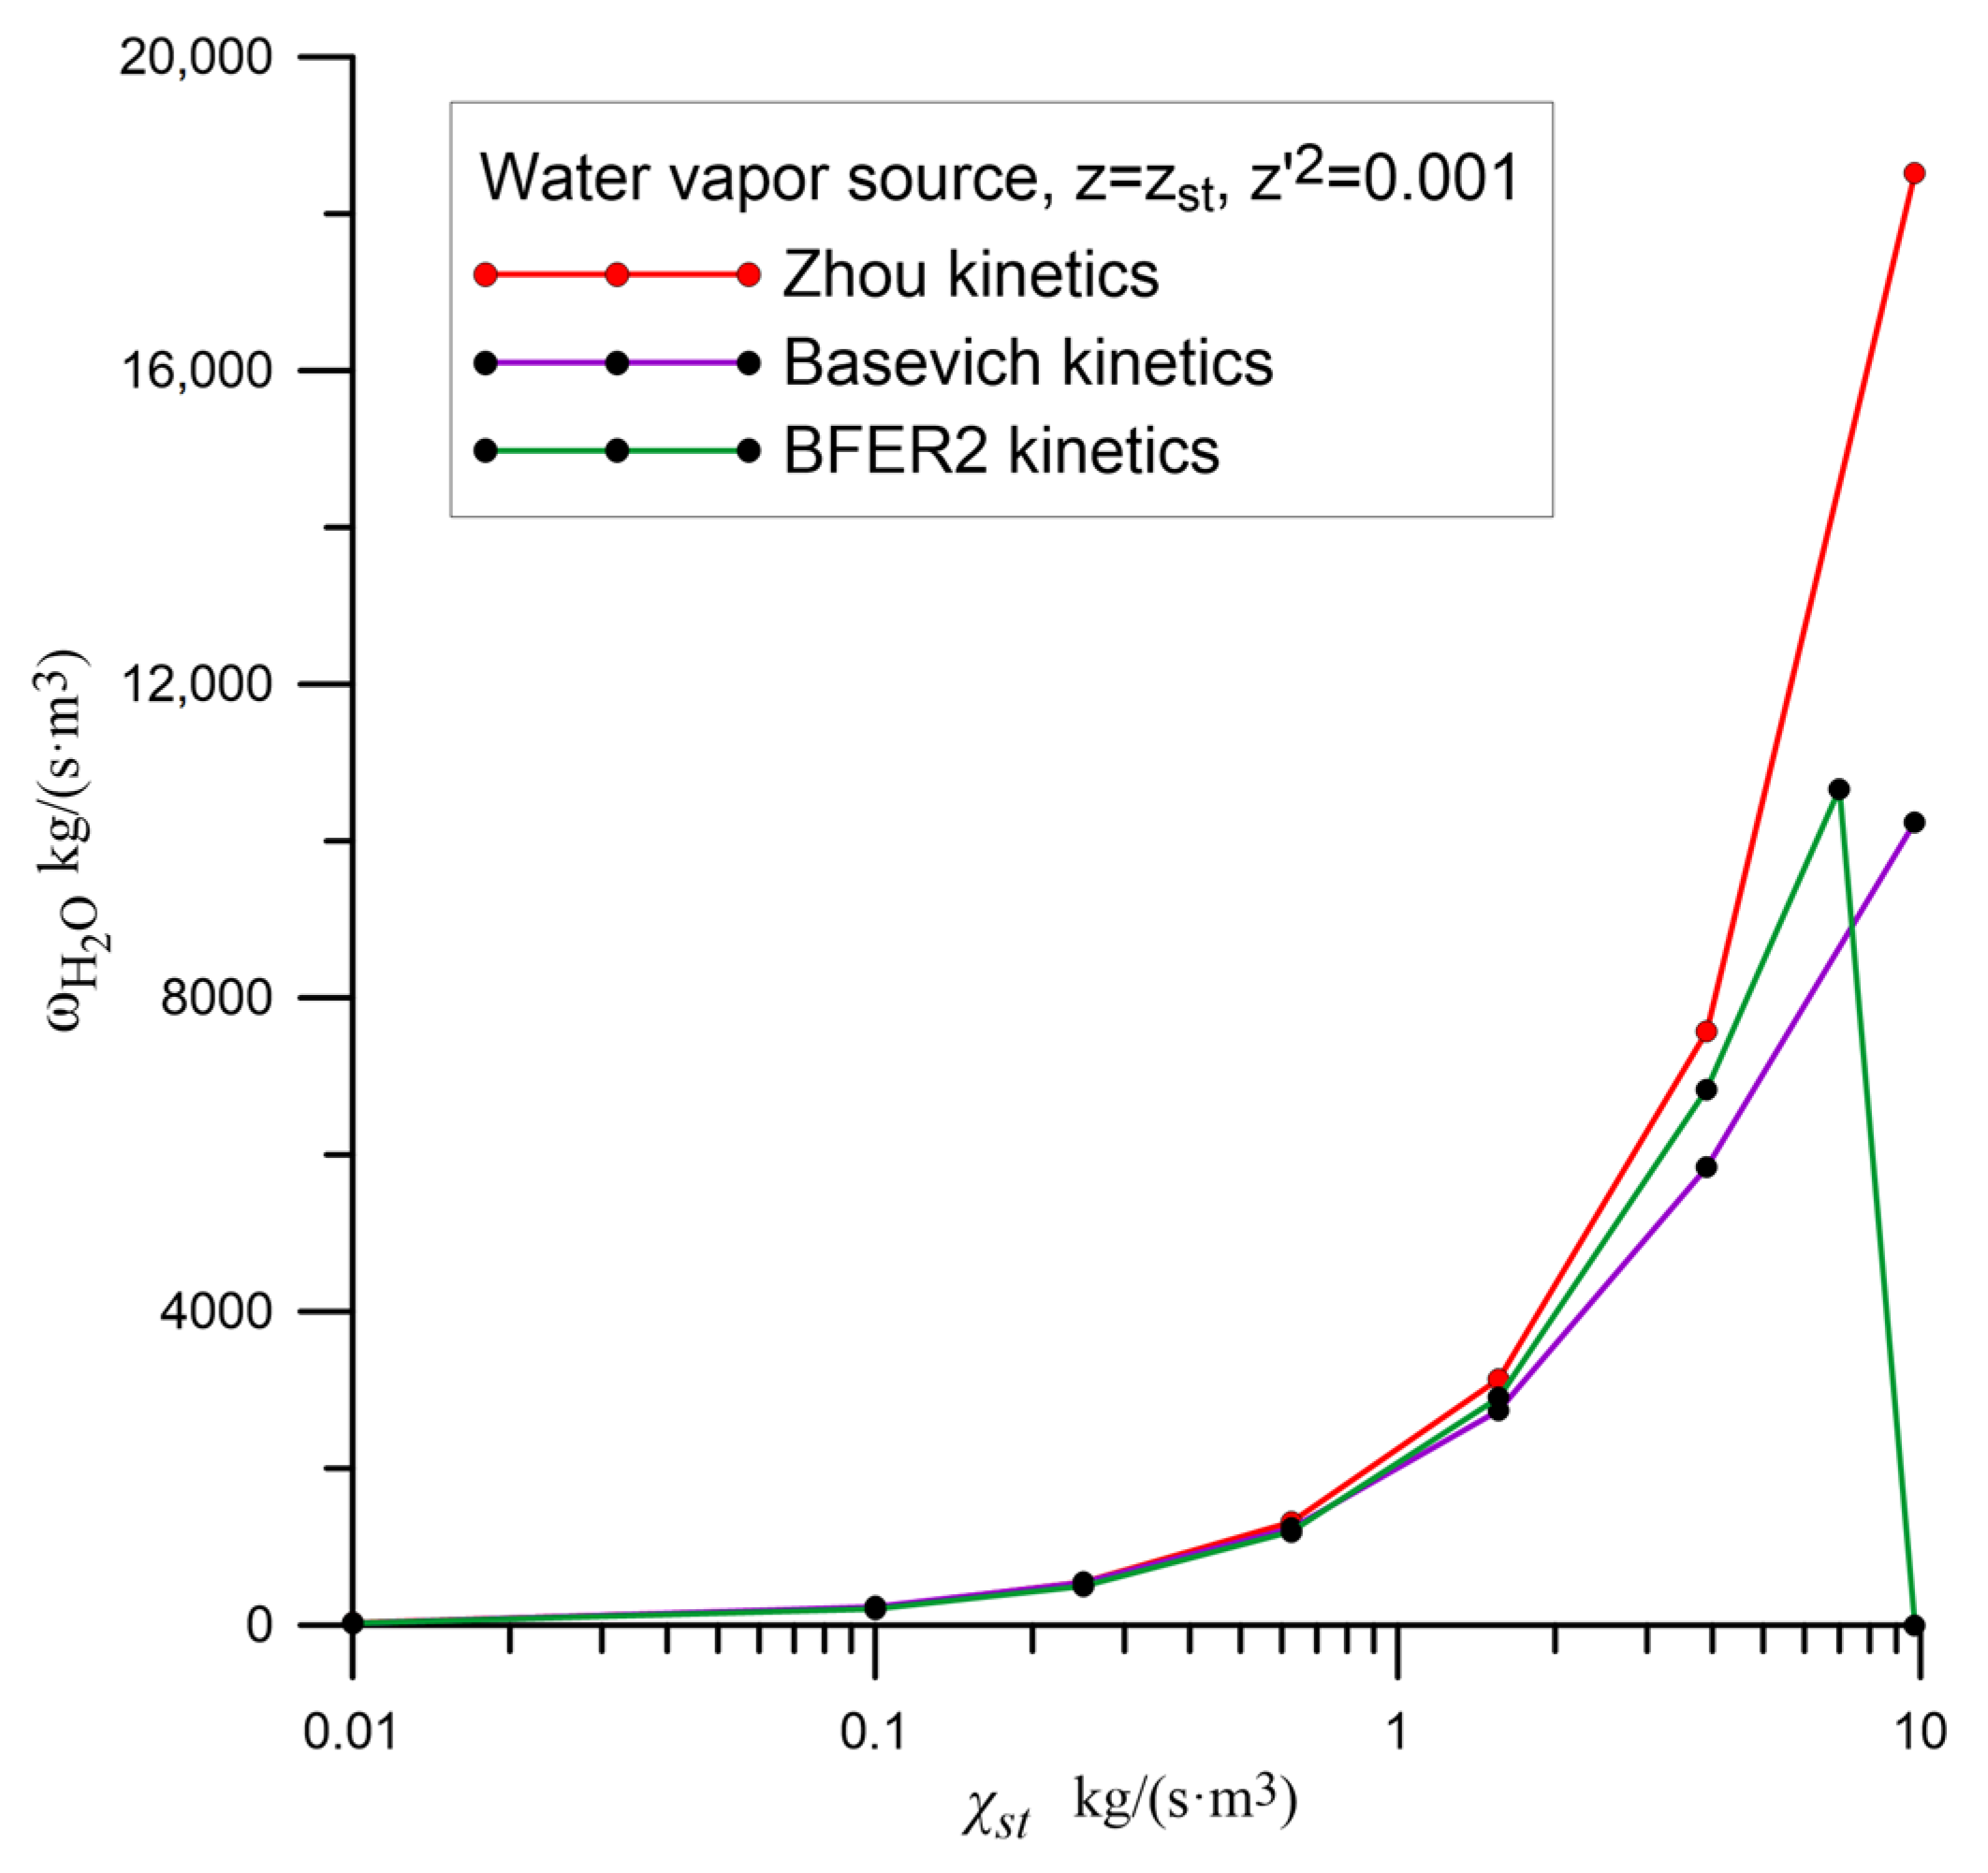
37], which was developed to describe partially premixed flames and to represent methane-air combustion in a wide range of equivalence ratio values, which is justified according to its representation of laminar flame speed. Because different reactions are used in these kinetic schemes, we compared the cell-averaged source for H 2 O . The results are given in Figure 1.
In the simulations presented below, the time-averaged value of scalar dissipation at the stoichiometric surface is χ s t ~ 1 5 . According to Figure 1, for these values of χ s t , the flamelet model predicts close values of the average chemical source with all considered kinetic schemes.
The largest differences in prediction of the cell-averaged source with these kinetic schemes can be found at high values of χ s t , and they affect the description of the extinction. In the case of Zhou kinetics, extinction occurs at a very high value χ s t = 192 , which is almost not found in calculations. The Basevich et al. kinetics show complete extinction at χ s t = 20 . The Franzelli et al. kinetics has the lowest extinction value of the scalar dissipation rate, which is equal to χ s t = 9 . To understand the role of extinction, the comparison between Zhou kinetics and BFER2 kinetics in the simulations of the swirling burner will be provided below.

2.3. DSM Model Formulation and Modifications

In the DSM approach, six differential equations for the subgrid stress tensor components are solved:
ρ ¯ u i u j ˜ t + x k ρ ¯ u ˜ k u i u j ˜ + ρ u i u j u k ¯ + p u i ¯ δ j k + p u j ¯ δ i k μ u i u j ˜ x k                                                                                 = ρ ¯ u i u k ˜ u ˜ j x k ρ ¯ u j u k ˜ u ˜ i x k + p u i x j + u j x i ¯ 2 μ u i x k u j x k ¯ .
It requires closures for turbulent transport T i j k = ρ u i u j u k ¯ + p u i ¯ δ j k + p u j ¯ δ i k , for the pressure-strain tensor Φ i j = p u i x j + u j x i ¯ , which is responsible for the turbulence kinetic energy redistribution between the Cartesian components, and for the dissipation rate tensor ρ ¯ ε i j = 2 μ u i x k u j x k ¯ . The latter tensor can be considered isotropic, ε i j 2 3 ε δ i j , in developed turbulent flows [38]. Here ε is the dissipation rate, which is calculated in the current article according to [1].
Compared to [1], several modifications were introduced in the model to account for the compressibility effects in the considered flows.
The first improvement affected the triple velocity correlation term. It turned out that the previously proposed model may be insufficiently stable in compressible flows, so we added a term representing the simple gradient diffusion with the weight α d i f f = 0.2 to the T i j k model:
ρ u i u j u k ¯ = 1 α d i f f ρ ¯ i j k C T 1 k 1 / 2 Δ δ k l + C T 3 Δ 2 u ˜ k x l u i u j ˜ x l α d i f f σ R μ s g s u i u j ˜ x k ,  
σ R = 0.22 C μ ,           C μ = 0.09 .
This modification completely removes “implosion instability”. Under “implosion instability”, we mean amplification of the disturbances in the rarefaction zone near the methane injector observed in the preliminary simulations without the modification. This effect may occur due to weak rarefaction, when anisotropic turbulent transport is unable to suppress the growing velocity gradients, so subgrid-scale parameters experience unphysical behavior by amplifying rarefaction during the implosion. The key difference between the additional term and the previously introduced C T 1 -term is that turbulent subgrid viscosity μ s g s depends on the strain tensor norm S = 2 S ˜ i j S ˜ i j 1 / 2 , consequently it is connected to the resolved field, whereas the C T 1 -term adopts “turbulent viscosity” based on subgrid parameters only.
The second improvement is related to accounting for compressibility in the pressure-strain correlation closure. The basic representation of the closure is as follows [1]:
Φ 0 = C Φ 1 a ρ ¯ ε + C Φ 2 0 ρ ¯ k S + C Φ 2 1 ρ ¯ k Δ S Ω Ω S + C Φ 2 2 ρ ¯ k Δ Ω 2 1 3 tr Ω 2 I                                                                                                   + C Φ 2 3 ρ ¯ Δ 2 S Ω Ω + Ω Ω S 2 3 tr S Ω Ω I tr Ω 2 S + C Φ 3 ρ ¯ k a S + S a 2 3 tr a S I + C Φ 4 ρ ¯ k Ω a a Ω , C Φ 1 = 3.0 ,       C Φ 2 0 = 1.04 ,       C Φ 2 1 = 0.136 ,       C Φ 2 2 = 0.058 ,         C Φ 2 3 = 0.23 ,       C Φ 3 = 0.34 ,       C Φ 4 = 1.2 .
with tensor multiplication obeying the matrix rule, A B i j = A i k B k j . Here I = δ i j is a unity tensor, S and Ω are the resolved (deviatoric) strain rate and rotation tensors, respectively.
S i j = 1 2 u ˜ i x j + u ˜ j x i 1 3 div V ˜ δ i j ,               Ω i j = 1 2 u ˜ i x j u ˜ j x i .
Hereinafter, a i j , A 2 and A 3 denote the anisotropy tensor and its invariants:
a i j = u i u j ˜ k 2 3 δ i j ,           A 2 = a i j a j i ,           A 3 = a i j a j k a k i .
In compressible flows, the strain tensor closure should also contain the separate terms “linear” in the divergence of velocity and “anisotropy tensor” a i j . The form of this term was considered, e.g., in [39], where it was calibrated to obtain the correct turbulent kinetic energy downstream the shock wave:
Φ i j a   d i v = C d i v min div V ˜ ,   0 ρ ¯ k a i j .
This term was incorporated into the present model, but due to the fact that we are simulating a subsonic flow, the coefficient C d i v is different and equals 0.4 .
The third modification implies anisotropy invariant stabilization, which bounds the Lumley’s invariant   A = 1 9 / 8 A 2 A 3 by a near-zero value A m i n to prevent possible numerical instabilities near a two-component limit of turbulence. Moreover, this improvement also helps to have an adequate probability density function for the A 2 invariant, as is illustrated below.
To understand the working principle of this fix, let us consider a case of small A falling within the range A m i n < A < 2 A m i n . Then the subgrid-scale stress tensor is shifted towards the isotropic form,
u i u j ˜ * = α i s o u i u j ˜ + 1 α i s o · ( 2 k / 3 ) δ i j .
The value of the “isotropization factor” α i s o is obtained according to the formula
α i s o = 1 A l i m A 9 4 A 2 27 8 A 3 ,
where A l i m = A m i n + A 2 / 4 A m i n . This choice of α i s o guarantees that after the isotropization, A > A m i n .
The value of A m i n is chosen to be 0.1. To demonstrate the effect of this improvement, we show the one-point probability density function of A 2 in a series of isotropic decaying turbulence simulations (see Figure 2). The blue line represents the PDF before the limitation, and the black line represents the PDF after the limitation. In this figure, the peak near the maximum allowed value of A 2 = 8 / 3 vanishes after implementing the anisotropy invariant stabilization.
The fourth modification to this model is necessary for simulations on non-uniform grids. It introduces a modification to the numerical scheme to make it more dissipative. The problem is that the DSM approach utilizes central differences for convective term approximation. Depending on the flow regime, this numerical scheme may produce even-odd decoupling. One of the ways to avoid this problem is to use asymmetric one-sided gradients for the source terms of turbulent parameters. Although it removes oscillations with high wavenumbers for a uniform grid, it may have problems with non-uniform grids. Here arises one more problem, which is connected to a commutation error when the filter size gradient Δ / x i exists. These two factors make the representation of the highest resolved frequencies highly inaccurate, especially in the cells stretched in one direction. In this case, it would be better to have a more dissipative numerical scheme to suppress the oscillations, which are usually four or three cells in wavelength.
The simple solution is numerical smoothing, which subtracts the error of two different approximations of the strain rate tensor in the momentum equation. In other words, it is an additional numerical flux i j which is added to the momentum equation as follows:
t ρ ¯ u ˜ i + x j ρ ¯ u ˜ i u ˜ j + τ i j x j + i j x j = x j μ 2 S ˜ i j 2 3 div V ˜   δ i j p ¯ x i ,
i j = C s m o o t h μ s g s u ˜ i x j + u ˜ j x i 2 3 div V ˜   δ i j u ˜ i x j + u ˜ j x i 2 3 div V ˜   δ i j .
Here, the square brackets denote the gradients calculated at the cell sides by using values of u ˜ i from the centers of the adjacent cells, whereas the angle brackets represent the gradients, which were calculated by interpolating the u ˜ i / x j values from the centers of the adjacent cells. In our simulations, C s m o o t h = 0.5 .
On a uniform grid, this modification introduces numerical smoothing of third order with respect to cell size, O h 3 . It also complies with the requirement of preserving the scheme’s conservativity.
To check all these modifications and make sure the final formulation of the DSM model represents the basic turbulence statistics properly, test simulations of decaying isotropic turbulence were performed. A grid of 128 × 128 × 128 cells in a periodic box of size 2 π × 2 π × 2 π   m 3 was used with an integral turbulent length scale of L = 3.94   m . To specify the initial velocity field, the box was filled with harmonic waves according to the von Karman spectrum. The simulations were performed until the resolved energy reached one tenth of its initial value, which was taken as E k 0 = u i u i ˜ / 2 = 1000   m 2 / s 2 .
In Figure 3, the comparison between the new, more dissipative method and the basic method shows that the longitudinal energy spectrum E u u k x starts to deviate from Kolmogorov’s “–5/3” law at wavenumber 30, whereas the basic method starts deviating at wavenumber 40. This tendency emphasizes that the waves with wavelengths equal to four cells are still present in the simulations with the basic version of the model, whereas with the modified version, these parts of the spectrum have already started to dissipate. In addition, the inertial subrange of the spectrum remains close enough to Kolmogorov’s law. This allows us to conclude that all the modifications do not impair the description of isotropic turbulence.

2.4. Formulation of the Test Case

The test case represents a non-premixed, unconfined flame in a swirl burner. The data were obtained by two research groups: the velocity measurements were performed by Yasir Al-Abdeli at the University of Sydney, whereas the temperature and species concentrations were measured at Sandia National Laboratories by Dr. Rob Barlow and Dr. Peter Kalt. These two groups had the same burners, although the wind tunnels providing the co-flow were different. Sandia National Laboratories had a cross-section measuring 310 × 310   mm , whereas the research at Sydney University utilized a smaller wind tunnel with a cross-section of 130 × 130   mm . Peter Kalt and Rob Barlow investigated concentrations and temperature, so they used pure C H 4 as fuel, whereas Yasir Al-Abdeli considered the combustion of CNG, which contained 90 % of C H 4 and 10 % of butane and other hydrocarbons, although this should not significantly affect velocity measurements. The burner consists of a bluff-body surrounded by an annular shroud measuring 60   mm in diameter. The bluff-body face measures 50   mm in diameter and has a central fuel inlet, that is 3.6   mm in diameter. The annular shroud has tangential inlets to control swirling. There are three inlets downstream: the honeycomb, which is made of wire mesh, and the flow straightener. The latter is applied due to the perpendicularity of the main air inlets and the annular shroud.
The experimental database contains three types of test cases. The cases marked with SM are non-premixed methane flames; the cases labeled SMH contain hydrogen in combination with methane as fuel, so these cases require more complicated kinetics. Finally, the cases designated SMA represent partially non-premixed combustion, as stated by Yasir Al-Abdeli, so the simulations of these cases using the mixture fraction-based flamelets may be inadequate.
Our simulations were focused on the case SM1, as we decided to compare our results to the data obtained by Hu, Zhou, and Luo [21], who applied the Pressure Implicit Splitting Operator algorithm to perform the pressure-velocity correction in their solver.
The case SM1 has a fuel axial velocity of 32.7   m / s , axial velocity of external swirled air of 38.2   m / s , tangential velocity of 19.1   m / s . This results in a swirl number equal to 0.5. The co-flow longitudinal velocity is 20   m / s . The visual flame length is estimated at approximately 120   mm . The Reynolds number for the swirled external jet is 75 , 900 , whereas for the internal fuel jet, it is 7200 .
To perform an LES, it is necessary to use computational grids with cell sizes that correspond to the inertial interval of the turbulence. Unless resolving the boundary layer on the bluff-body face is required, it is enough to take at least one tenth of the integral turbulence length scale as the size of a cell. Taking into account our computational capabilities, we chose approximately 200 cells in the longitudinal ( z -axis) direction with sizes close to 1   mm .
Our computational grid, which is shown in Figure 4, is 128 × 128 × 192 cells in the x , y , and z directions, respectively. To describe the central jet, 20 cells were placed across its diameter, so the grid has refinement near the central axis. The computational domain itself is 100 × 100 × 250   mm . It has a square shape to avoid grid skewness. The round shapes of inflowing jets were approximated with a second order of accuracy using the injector boundary condition described in [40].
The boundary conditions are the following: subsonic inflow for the central fuel inlet; annular shroud inlet and co-flow; constant pressure outflow at the outlet ( p o u t = 95 , 300   Pa was specified to prevent inflow); and symmetry planes for the bluff-body face and side surfaces. “Subsonic inflow” means solving the Riemann problem at boundaries. To avoid reflection of acoustic waves from side planes, it is better to make the external part of the grid coarse to suppress them with higher dissipation. After trying the Riemann-type boundary condition on side surfaces, it was found to be unreliable due to the proximity to the jet because it can reverse the flow and lead to a qualitatively different solution.
The grid contained 3.145 million cells. The time step for the PDF flamelet model was limited to 7 × 10 8   s , whereas in our program, quasi-laminar simulations typically require the time steps of 10 8   s to replicate the chemical reactions correctly. The time required for the central jet to traverse the flame is approximately 4   ms , so the simulation time interval should be about 20 40   ms . It was found that the bottleneck-shaped structure of the flame becomes stable after 12   ms , although after 20   ms it slowly disappears, presumably due to the interaction with the side boundary conditions. This process may occur due to the lack of ejection into the swirling region, which is partially suppressed in our simulation by the impermeability of the side walls. However, there exists an almost statistically steady state before the collapse of the bottleneck structure. We chose our primary time averaging interval in the middle of this state, between 14 and 17   ms . We also continued our simulation up to 40   ms . Further simulations revealed that the flow evolves into a completely different conic-type structure of the flame. A comparison of the time-averaged pressure fields before and after the breakup of the bottleneck is shown in Figure 5. The rarefaction zone appears near the side boundaries, and while it flows downstream, it slowly destroys high pressure zones near the bottleneck. This process takes place in both Smagorinsky and DSM simulations, so its dependence on the subgrid-scale stress model is weak. Thus, we conclude that it takes place mainly due to interactions of the acoustics with the boundaries.
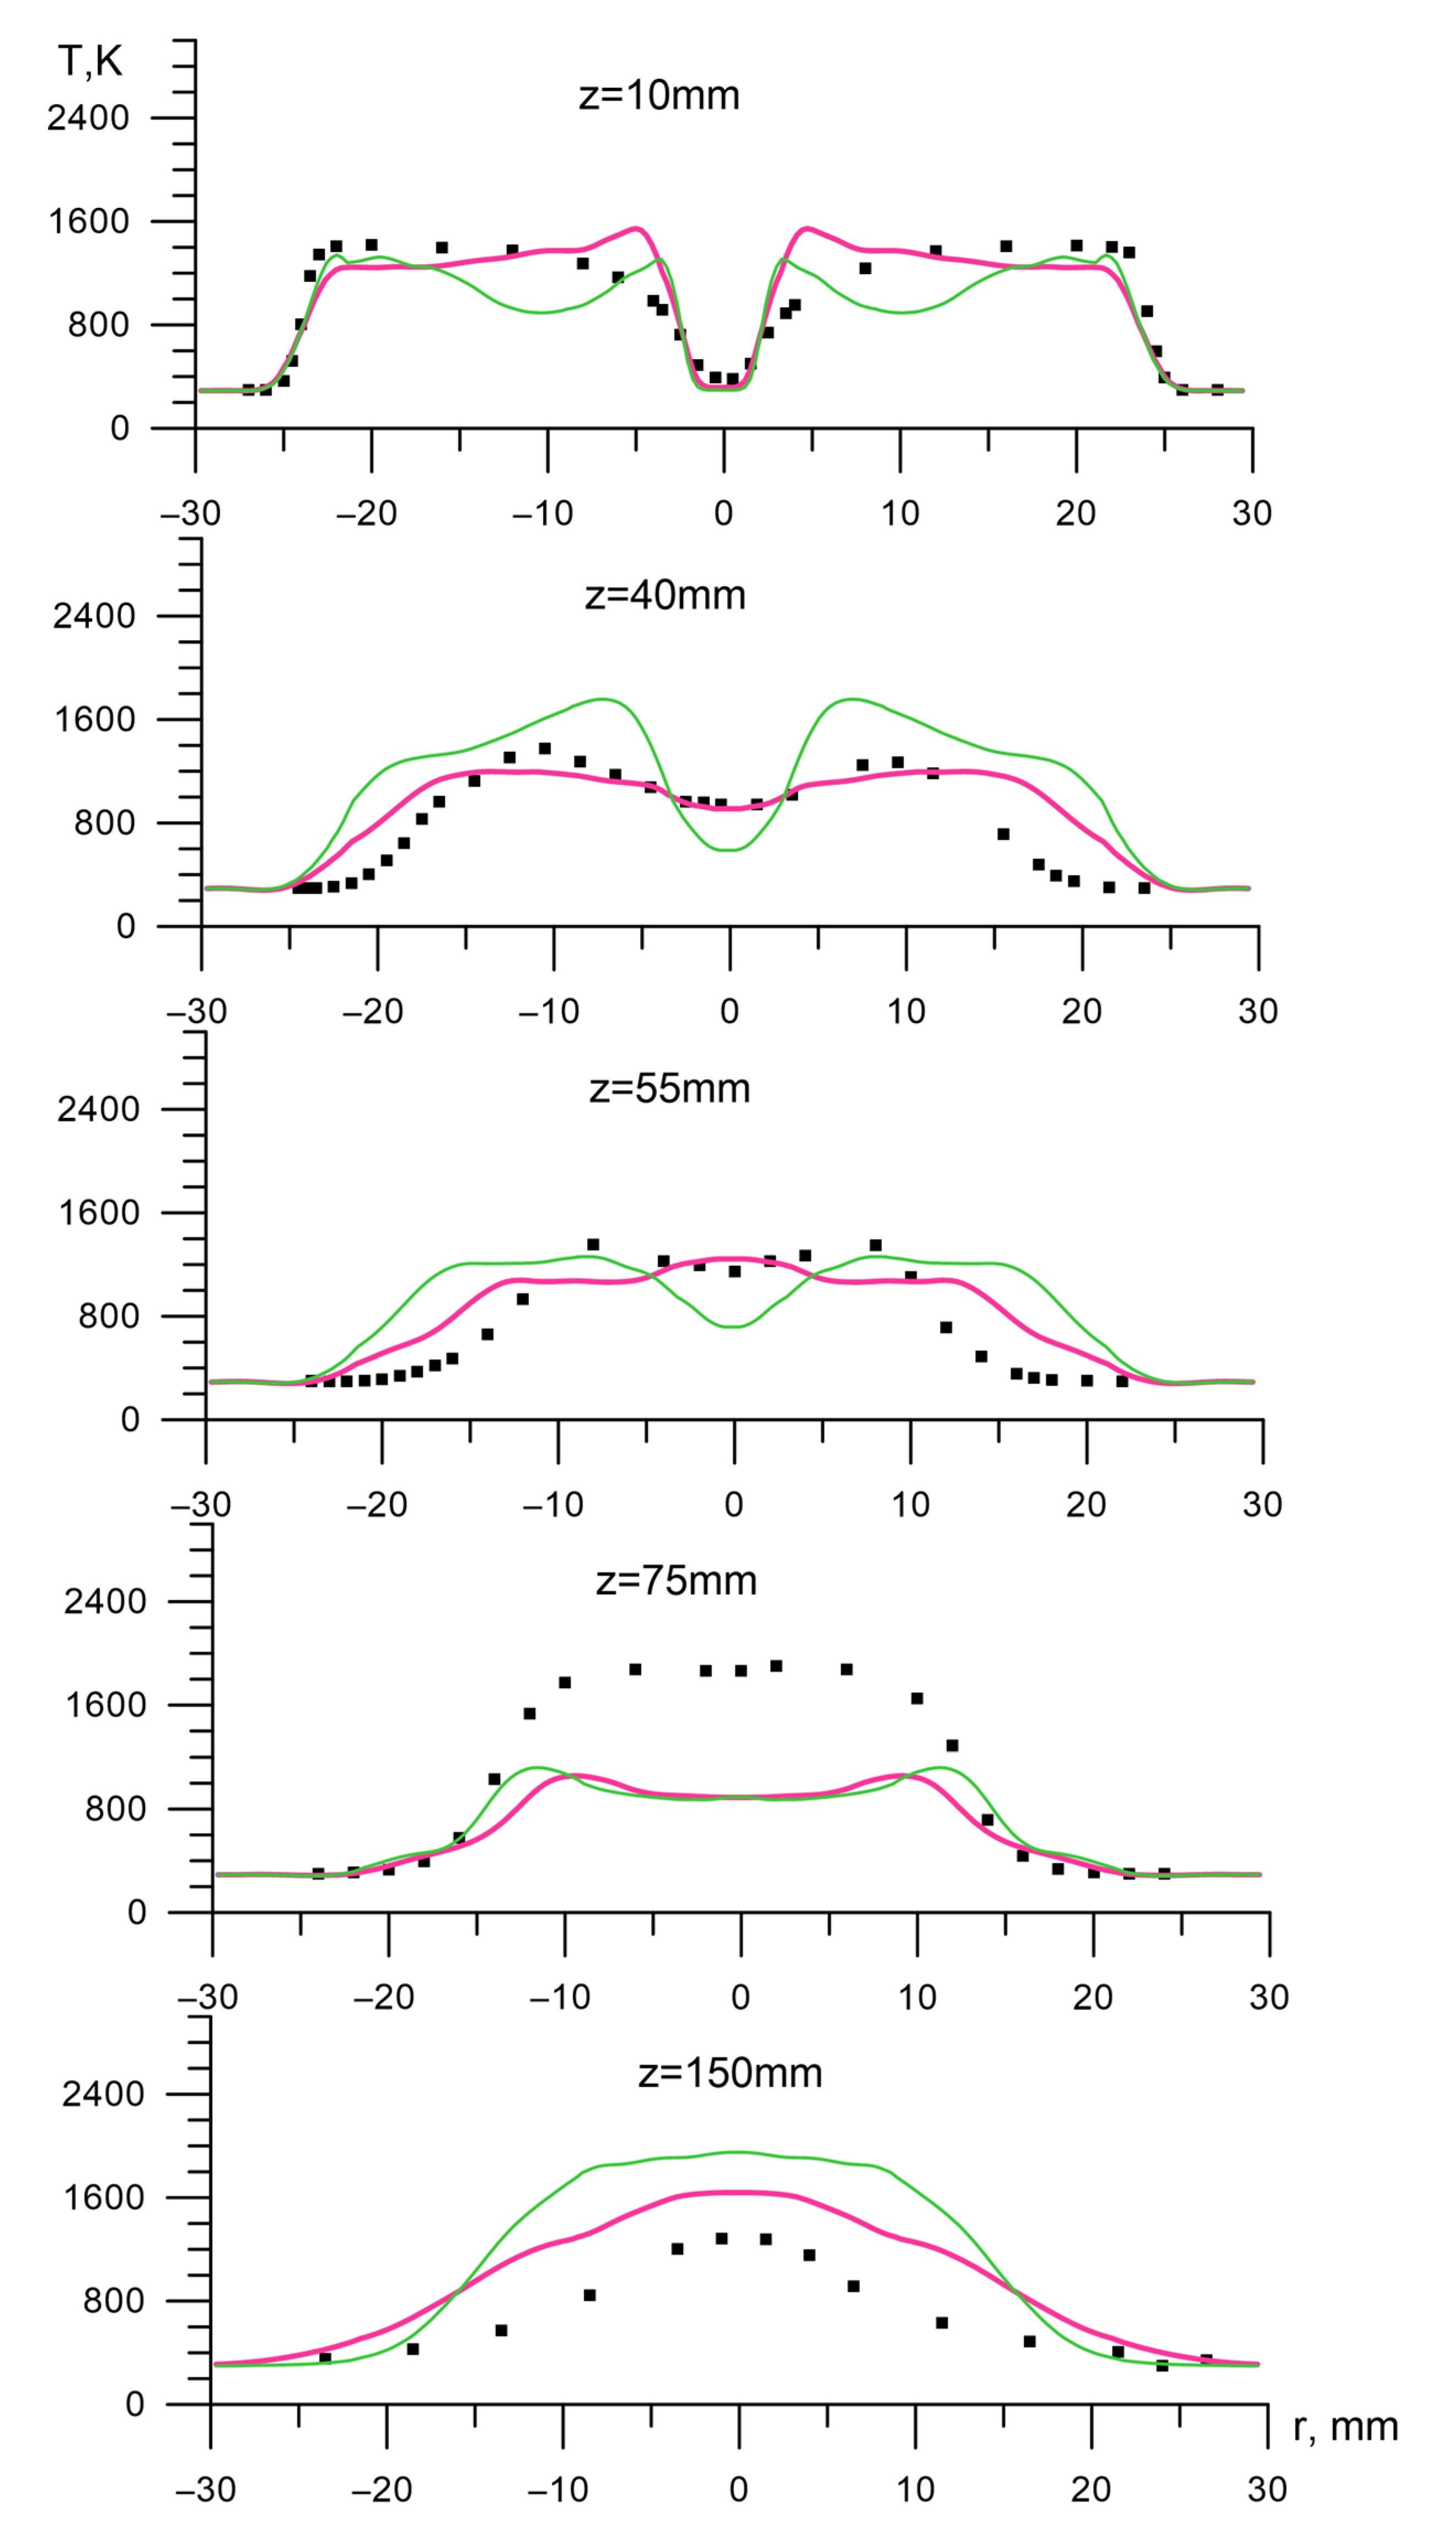
Hereinafter, all the provided results will refer to the flow structure observed before the bottleneck breakup, namely between 13 and 19 ms. Time averaging was applied from 14 to 17 ms. During the averaging period, azimuthally-averaged instant temperature fields were found to be stable.

3. Results and Discussion

In this section, the time- and azimuthally-averaged data will be compared with experimental measurements and other authors’ simulations. As stated by Hu, Zhou, and Luo [21], different turbulent combustion models predict different positions of the bottleneck. The second-order moment model (SOM) tends to develop bottleneck upstream from its experimental position, while the PDF-based flamelet approach shifts the bottleneck downstream.
Time and azimuthally-averaged axial velocity comparison between the Smagorinsky and DSM models with PDF flamelets shown in Figure 6 revealed a weak influence of the subgrid-scale model on the bottleneck effect. However, the subgrid model has a significant impact on the central fuel jet and its penetration length, as shown in the 20 and 70 mm sections. The mixing of the central jet with surrounding gas is too slow in the Smagorinsky model simulation, whereas the DSM model gives a more adequate mixing rate, which is consistent with experimental measurements.
Comparison of the distant sections (100 and 120 mm) revealed that the presented simulations are closer to the experiment near the axis compared to the Hu, Zhou, and Luo profiles. This may be the result of a different numerical scheme and a different turbulence-combustion interaction model, as well as the reaction rate limitation for premixed zones (13). The main discrepancy in the velocity field is observed in the surrounding flow. This flow is too fast in the present simulation due to the acceleration produced by the imperfect value of the pressure specified at the outlet.
Overall, despite the proximity of the side walls and flow acceleration, the DSM model reveals some advantages over the standard Smagorinsky model, according to the velocity field.
The temperature comparison shown in Figure 7 revealed that the DSM model tends to demonstrate higher temperatures compared to the Smagorinsky model with the same value of C χ s t (see Equation (12)). In the regions near the bluff-body face, the temperature in the simulation with the DSM is higher than the experimental value, which is 723 ± 150   K . This effect can be related to the different turbulent transport of components and the different mixing rate predicted by the two subgrid models.
The scalar product of fuel and oxidizer gradients, Y C H 4 · Y O 2 , can be used to estimate the location of zones with non-premixed and premixed diffusive combustion. It is a well-known approximate method for combustion mode analysis, which is also known as the Takeno flame index [41]. It is based on the observation that in unpremixed combustion, the fuel and the oxidizer are mostly located on different sides of the flame, and their diffusive fluxes (that are counter-directional to the gradients of their concentrations) have opposite directions. On the contrary, in premixed diffusive combustion, the fuel and the oxidizer are mostly located on the same side of the flame, and their diffusive fluxes are codirectional. However, it is important to note that the Takeno flame index based on the gradients of resolved concentrations provides only an approximate estimation of the combustion mode because the latter is determined by the local values of gradients on the scale of very small eddies, which are not resolved in the simulation. Figure 8 shows the stoichiometric iso-surface z = z s t colored by the values of Y C H 4 · Y O 2 . The premixed combustion areas ( Y C H 4 · Y O 2 > 0 ) appear near the end of the flame and near the recirculation zones. In these regions, our quasi-laminar limitation (13) works. Non-premixed zones ( Y C H 4 · Y O 2 < 0 ) are situated mostly near the bottleneck.
The time and azimuthally-averaged temperature fields are shown in Figure 9. These fields demonstrate that in the bottleneck region, where the combustion proceeds in non-premixed diffusion mode, the heat release mostly occurs near the stoichiometric iso-surface. The cross-sections extracted from these fields are compared with the experiment and with Hu, Zhou, and Luo simulations in Figure 10.
The comparison shown in Figure 9 illustrates the different levels of temperature in the simulations with the Smagorinsky model and DSM. Moreover, it reveals problems with the description of the initial part of the bottleneck, between 40 and 55 mm. However, in a 75 mm section, our simulations (especially with the DSM) show better consistency with the experiment. The most downstream section, which is partially premixed, reveals a higher temperature due to the fact that the employed kinetics do not describe the premixed zones correctly. Our tests show that it strongly (by several orders of magnitude) underpredicts the induction time compared to the detailed kinetics. It is typical for global kinetic mechanisms designed for the simulation of diffusive flames. For the DSM, this effect is even more significant than in the Smagorinsky model because it predicts a higher mixing rate of fuel and oxidizer.
Profiles of temperature at 10 mm sections reveal their concave shape, especially for the Smagorinsky model. This is due to the presence of the premixed regions and the oversimplified model for stoichiometric scalar dissipation rate (12), which tends to provide lower values of χ s t for regions where the resolved mixture fraction z ˜ is close to unity. Although this model excludes runtime integration, it lacks accuracy. The main flaw of this model is that it overestimates the local dependence on z ˜ . The concave shape near the axis between 40 and 55 mm sections for the Smagorinsky model is due to the underestimated mixing rate of the methane jet, leading to its higher penetration length.
Profiles of combustion products demonstrate behavior similar to the temperature plots, although we provide them in Figure 11 to verify that the quasi-laminar limitation (13) is capable of predicting the concentration fields.
To consider the influence of different kinetics, especially in premixed zones, and to investigate the role of extinction, we provide the comparison between Zhou and BFER2 kinetics in Figure 12. Both simulations were carried out with the Smagorinsky model and flamelet library. The restriction analogous to (13) was implemented for all reaction rates separately, according to their Arrhenius parameter values for forward and backward reactions.
Figure 12 reveals that the BFER2 kinetics, which are designed for partially premixed flames, significantly improve the description of the final section at z = 150   mm . This result is due to the fact that this section belongs to a premixed part of the flame (see Figure 8). This condition, in combination with a broad, nearly stoichiometric region, makes the restriction (13) switch the source to a quasi-laminar solution, which improves the temperature profile. The 40   mm and 55   mm sections show that, with BFER2 kinetics, the central fuel jet is shorter. It can be explained by the weaker acceleration of the gas because of lower heat release and extinction in the BFER2 kinetic scheme.
It is also interesting to compare the capabilities of LES and RANS simulations. In Figure 13, the present results are compared with the RANS simulation of the same SM1 case from the Sydney experiment performed by De Meester, Naud, Maas, and Merci [42]. This was an axisymmetric simulation with k - ε turbulence model and a flamelet EMST [43] combustion model. Due to the lack of provided data, this simulation was included only in CO 2 comparison. It shows a significant discrepancy in the RANS profile in a 40 mm section, demonstrating overestimated thickness of the initial part of the bottleneck.
Investigation of the instantaneous fields obtained in the DSM simulation revealed the presence of backscatter events (negative production rates of the subgrid-scale turbulence energy, P = u i u j ˜ u ˜ i / x j ) near the central fuel jet. The regions of these events correlate well with the regions of significant velocity divergence and of high amplitude pressure fluctuations. Note that the backscatter can even be seen in a time-averaged field. It is demonstrated in Figure 14, where the time-averaged subgrid-scale kinetic energy production field and iso-surface corresponding to the negative production rate of 1700   m 2 / s 3 are shown. We conclude that the DSM model reveals not only instantaneous bursts of inversed energy cascade transport, but also continuous areas where the production of subgrid-scale stresses is negative. This effect may also have an impact on a higher mixing rate and, accordingly, on the length of the fuel jet core. It cannot be captured by a Boussinesq-type non-negative subgrid-scale viscosity model.

4. Conclusions

A previously published differential subgrid stress model (DSM) was adapted for anisotropic non-isothermal combustion flows. Several new stabilization techniques were introduced to obtain robust behavior from the model in conjunction with a central difference scheme for convective fluxes. The compliance with theoretical requirements was proved by comparing the turbulence kinetic energy spectrum in the isotropic decaying turbulence test case. The statistical characteristics of the second anisotropy invariant in the DSM model were improved by suppressing its tendency to form highly anisotropic states.
Analysis of premixed areas showed that the self-ignition combustion is significant in the downstream ( z > 120   mm ) sections of the flame and in the recirculation areas. Strictly speaking, a non-premixed flamelet model is inapplicable in such a case, but this effect can be taken into account by the use of the quasi-laminar expressions for the reaction rates.
The comparison between two different kinetic schemes revealed that in the areas of premixed combustion, the quasi-laminar restriction gives better results than the kinetic scheme, which predicts better laminar flame speed. The influence of extinction was observed near the fuel jet; it leads to a lower penetration length because of a lower heat release and a lower heat-induced acceleration of gas.
Both the Smagorinsky model and the DSM experienced accuracy problems in the initial sections of the bottleneck, although the new DSM performed somewhat better in the sections farther downstream of the injection plane. Moreover, the DSM predicts the penetration length of the central fuel jet, which is closer to experimental data than with the Smagorinsky model.
The backscatter effect was observed in the DSM simulations. Instantaneous backscatter events appear in the regions where significant dilatational fluctuations are produced by the strong pressure waves. Interestingly, the backscatter is present even in the time-averaged field, especially in the initial part of the jet. This effect can have a significant impact on the turbulence statistics, which involve the features of the instantaneous subgrid-scale stress tensor.
In the presented simulations, the agreement with the experiment remains far from ideal. It is not essential from the viewpoint of the main objective of this article: the comparison of two different subgrid-scale models. To achieve coincidence with the experimental data, additional investigation is necessary. It must include the improvement of both the mathematical model of the flow and the numerical approach. In particular, the role of the TCI model should be studied; different TCI models need to be compared. The boundary conditions applied in the present study can also be improved. Too close proximity of the outer boundaries to the swirling jet and the pressure specified at the outlet can influence the bottleneck position and cause a slow structural change in the flame. As it is shown in [44], variation in the co-flow velocity shifts the bottleneck and can even lead to its disappearance. All these issues will be considered in future work.

Author Contributions

Conceptualization, V.S. and V.V.; methodology, A.T. and R.B.; programming, R.B., L.U. and A.T.; data analysis and interpretation, A.T., R.B. and A.N. All authors have read and agreed to the published version of the manuscript.

Funding

The research was funded by a grant from the Russian Science Foundation No. 21-71-10105, https://rscf.ru/en/project/21-71-10105/ (accessed on 27 January 2023).

Institutional Review Board Statement

Not applicable.

Informed Consent Statement

Not applicable.

Data Availability Statement

The reference experimental data used for comparison is publicly available at the University of Sydney website, https://web.aeromech.usyd.edu.au/thermofluids/swirl.php/ (accessed on 27 January 2023).

Conflicts of Interest

The authors declare no conflict of interest.

References

  1. Balabanov, R.; Usov, L.; Troshin, A.; Vlasenko, V.; Sabelnikov, V. A Differential Subgrid Stress Model and Its Assessment in Large Eddy Simulations of Non-Premixed Turbulent Combustion. Appl. Sci. 2022, 12, 8491. [Google Scholar] [CrossRef]
  2. Johns Hopkins Turbulence Databases. Available online: http://turbulence.pha.jhu.edu/ (accessed on 27 January 2023).
  3. Smagorinsky, J. General circulation experiments with the primitive equations: I. The basic experiment. Mon. Weather Rev. 1963, 91, 99–164. [Google Scholar] [CrossRef]
  4. Germano, M.; Piomelli, U.; Moin, P.; Cabot, W.H. A dynamic subgrid-scale eddy viscosity model. Phys. Fluids 1991, 3, 1760–1765. [Google Scholar] [CrossRef] [Green Version]
  5. Nicoud, F.; Ducros, F. Subgrid-scale stress modelling based on the square of the velocity gradient tensor. Flow Turb. Combust. 1999, 62, 183–200. [Google Scholar] [CrossRef]
  6. Ballouz, J.G.; Ouellette, N.T. Tensor geometry in the turbulent cascade. J. Fluid Mech. 2018, 835, 1048–1064. [Google Scholar] [CrossRef]
  7. Gupta, A.K. Gas turbine combustion: Prospects and challenges. Energy Convers. Manag. 1997, 38, 1311–1318. [Google Scholar] [CrossRef]
  8. Sengupta, A.; Mukherjee, R.; Mishra, V.K. Performance and emission characteristic of burners: A review. AIP Conf. Proc. 2021, 2341, 030027. [Google Scholar] [CrossRef]
  9. Syred, N. A review of oscillation mechanisms and the role of the precessing vortex core (PVC) in swirl combustion systems. Prog. Energy Combust. Sci. 2006, 32, 93–161. [Google Scholar] [CrossRef]
  10. Hu, L.Y.; Zhou, L.X.; Zhang, J. Large-eddy simulation of a swirling diffusion flame using a SOM SGS combustion model. Numer. Heat Transf. Part B Fundam. 2006, 50, 41–58. [Google Scholar] [CrossRef]
  11. Gicquel, L.Y.; Staffelbach, G.; Poinsot, T. Large eddy simulations of gaseous flames in gas turbine combustion chambers. Prog. Energy Combust. Sci. 2012, 38, 782–817. [Google Scholar] [CrossRef] [Green Version]
  12. Freitag, M.; Janicka, J. Investigation of a strongly swirled unconfined premixed flame using LES. Proc. Combust. Inst. 2007, 31, 1477–1485. [Google Scholar] [CrossRef]
  13. Nogenmyr, K.J.; Cao, H.J.; Chan, C.K.; Cheng, R.K. Effects of confinement on premixed turbulent swirling flame using large eddy simulation. Combust. Theory Model. 2013, 17, 1003–1019. [Google Scholar] [CrossRef]
  14. Giusti, A.; Mastorakos, E. Detailed chemistry LES/CMC simulation of a swirling ethanol spray flame approaching blow-off. Proc. Combust. Inst. 2017, 36, 2625–2632. [Google Scholar] [CrossRef] [Green Version]
  15. Kazbekov, A.; Steinberg, A.M. Influence of flow structures and combustion on cross-scale turbulent kinetic energy transfer in premixed swirl flames. Proc. Combust. Inst. In press. [CrossRef]
  16. Al-Abdeli, Y.M.; Masri, A.R. Review of laboratory swirl burners and experiments for model validation. Exp. Therm. Fluid Sci. 2015, 69, 178–196. [Google Scholar] [CrossRef]
  17. Nogenmyr, K.J.; Fureby, C.; Bai, X.S.; Petersson, P.; Collin, R.; Linne, M. Large eddy simulation and laser diagnostic studies on a low swirl stratified premixed flame. Combust. Flame 2009, 156, 25–36. [Google Scholar] [CrossRef]
  18. Soni, A. Experimental Investigation of Flame Aerodynamics for Confined and Unconfined Flow for a Novel Radial-Radial Novel Injector Using 2D Laser Doppler Velocimetry. Ph.D. Thesis, University of Cincinnati, Cincinnati, OH, USA, 2019. Available online: https://etd.ohiolink.edu/apexprod/rws_etd/send_file/send?accession=ucin1552656922178471&disposition=inline (accessed on 26 February 2023).
  19. Santhosh, R.; Basu, S. Transitions and blowoff of unconfined non-premixed swirling flame. Combust. Flame 2016, 164, 35–52. [Google Scholar] [CrossRef]
  20. Swirl flows and flames database. The University of Sydney—Aerospace, Mechanical and Mechatronic Engineering. Available online: https://www.aeromech.usyd.edu.au/thermofluids/swirl.htm (accessed on 27 January 2023).
  21. Hu, L.Y.; Zhou, L.X.; Luo, Y.H. Large-eddy simulation of the Sydney swirling nonpremixed flame and validation of several subgrid-scale models. Numer. Heat Transf. Part B Fundam. 2008, 53, 39–58. [Google Scholar] [CrossRef]
  22. Zhou, L. Theory and Modeling of Dispersed Multiphase Turbulent Reacting Flows; Butterworth-Heinemann: Oxford, UK, 2018; p. 320. [Google Scholar]
  23. Peters, N. Laminar diffusion flamelet models in non-premixed turbulent combustion. Prog. Energy Combust. Sci. 1984, 10, 319–339. [Google Scholar] [CrossRef]
  24. Bakhne, S.; Sabelnikov, V.A. Method for choosing the spatial and temporal approximations for the LES approach. Fluids 2022, 7, 376. [Google Scholar] [CrossRef]
  25. Burcat, A.; Ruscic, B. Third Millenium Ideal Gas and Condensed Phase Thermochemical Database for Combustion (with Update from Active Thermochemical Tables); Report No. ANL-05/20; Argonne National Lab (ANL): Argonne, IL, USA, 2005; p. 414. [Google Scholar] [CrossRef] [Green Version]
  26. Erlebacher, G.; Hussaini, M.; Speziale, C.; Zang, T. Toward the Large Eddy Simulation of Compressible Turbulent Flows. NASA CR 187460 1987, 238, 155–185. [Google Scholar] [CrossRef] [Green Version]
  27. Ingenito, A.; Bruno, C. LES of a supersonic combustor with variable turbulent Prandtl and Schmidt numbers. In Proceedings of the 46th AIAA Aerospace Sciences Meeting and Exhibit, Reno, NV, USA, 7–10 January 2008. [Google Scholar] [CrossRef]
  28. Mokhtar, A.; Bounif, A.; René, E. Scalar turbulence model investigation with variable turbulent Prandtl number in heated jets and diffusion flames. Heat Mass Transf. 2008, 44, 1065–1077. [Google Scholar] [CrossRef]
  29. Tushkanov, A.S. Termicheski i khimicheski neravnovesniye processy v fakele marshevogo dvigatelya tverdogo topliva. In Thermally and Chemically Nonequilibrium Processes in the Jet of the Solid Fuel Marching Engine; Moscow Aviation Institute: Moscow, Russia, 2019; Available online: https://mai.ru/upload/iblock/a44/Dissertatsiya-Tushkanov-finalnaya-versiya.pdf (accessed on 26 February 2023).
  30. Masri, A.R.; Kalt, P.A.M.; Al-Abdeli, Y.M.; Barlow, R.S. Turbulence–chemistry interactions in non-premixed swirling flames. Combust. Theory Model. 2007, 11, 653–673. [Google Scholar] [CrossRef]
  31. Pitsch, H.; Chen, M.; Peters, N. Unsteady flamelet modeling of turbulent hydrogen-air diffusion flames. Symp. (Int.) Combust. 1998, 27, 1057–1064. [Google Scholar] [CrossRef]
  32. Pitsch, H.; Steiner, H. Large eddy simulation of a turbulent piloted Methane/Air diffusion flame. Phys. Fluids 2000, 12, 2541–2554. [Google Scholar] [CrossRef]
  33. Oboukhov, A. Some specific features of atmospheric turbulence. J. Fluid Mech. 1962, 13, 77–81. [Google Scholar] [CrossRef]
  34. Wang, F.; Zhou, L.X.; Xu, C.X.; Goldin, G.M. Comparison between a composition PDF transport equation model and an ASOM model for simulating a turbulent jet flame. Int. J. Heat Mass Transf. 2008, 51, 136–144. [Google Scholar] [CrossRef]
  35. Westbrook, C.K.; Dryer, F.L. Simplified reaction mechanisms for the oxidation of hydrocarbon fuels in flames. Combust. Sci. Technol. 1981, 27, 31–43. [Google Scholar] [CrossRef]
  36. Basevich, V.Y.; Belyaev, A.A.; Frolov, S.M. “Global” kinetic mechanisms for calculating turbulent reactive flows. I. The basic chemical heat release process. Chem. Phys. Reports. 1998, 17, 1747–1771. [Google Scholar]
  37. Franzelli, B.; Riber, E.; Gicquel, L.Y.M.; Poinsot, T. Large Eddy Simulation of combustion instabilities in a lean partially premixed swirled flame. Combust. Flame 2012, 159, 621–637. [Google Scholar] [CrossRef] [Green Version]
  38. Hanjalic, K.; Launder, B. Modelling Turbulence in Engineering and the Environment; Cambridge University Press: Cambridge, UK, 2011; ISBN 978-0-521-84575-5. [Google Scholar]
  39. Konstantinov, D.N. Opisanie perekhoda turbulentnosti cherez skachok uplotneniya na baze modeley turbulentnosti klassa DRSM. [Description of the turbulence transition through the shock wave on the basis of DRSM-class turbulence models.] Trudy MFTI. Proc. Mosc. Inst. Phys. Technol. 2021, 13, 128–138. Available online: https://mipt.ru/upload/medialibrary/730/trudy-mfti-_1_49_1.pdf (accessed on 26 February 2023). (In Russian). [CrossRef]
  40. Bakhne, S.; Vlasenko, V.V.; Voloshchenko, O.V.; Zosimov, S.A.; Ivankin, M.A.; Nozdrachev, A.Y.; Sabelnikov, V.A.; Sysoev, A.V.; Troshin, A.I.; Shiryaeva, A.A. SOpyt testirovaniya i primeneniya programmy zFlare dlya chislennego modelirovaniya techenij s goreniem v kanalah [Experience in testing and using the zFlare code for numerical simulation of flows with combustion in ducts.] In collection of papers: Prakticheskie aspekty reshenija zadach gorenija i ajerodinamiki s primeneniem novyh reshatelej paketa prikladnyh programm EWT-CAGI. [Practical aspects of solving combustion and aerodynamics problems using new solvers of the EWT-TsAGI application software package.] Ed. by S.M. Bosnyakov. Trudy CAGI, 2022; 2810, 34–98. (In Russian) [Google Scholar]
  41. Yamashita, H.; Shimada, M.; Takeno, T. A numerical study on flame stability at the transition point of jet diffusion flames. Symp. (Int.) Combust. 1996, 26, 27–34. [Google Scholar] [CrossRef]
  42. De Meester, R.; Naud, B.; Maas, U.; Merci, B. Hybrid RANS/PDF calculations of a swirling bluff body flame (’SM1’). In Turbulence Heat and Mass Transfer 6. Proceedings of the Sixth International Symposium on Turbulence Heat and Mass Transfer; Begel House Inc.: Danbury, CT, USA, 2009. [Google Scholar] [CrossRef] [Green Version]
  43. Subramaniam, S.; Pope, S.B. A mixing model for turbulent reactive flows based on Euclidean minimum spanning trees. Combust. Flame 1998, 115, 487–514. [Google Scholar] [CrossRef]
  44. Soloklou, M.N.; Golneshan, A.A. Numerical investigation on effects of fuel tube diameter and co-flow velocity in a methane/air non-premixed flame. Heat Mass Transf. 2020, 56, 1697–1711. [Google Scholar] [CrossRef]
Figure 1. Averaged water vapor source comparison. Purple line denotes Basevich et al. kinetics, red line denotes Zhou kinetics, green line denotes Franzelli et al. BFER2 kinetics.
Fire 06 00094 g001
Figure 2. A 2 probability density function with and without anisotropy invariant stabilization.
Fire 06 00094 g002
Figure 3. Longitudinal energy spectrum with and without modifications (14) to the DSM.
Fire 06 00094 g003
Figure 4. Computational domain with a grid and the initial distribution of the axial velocity field.
Fire 06 00094 g004
Figure 5. Averaged pressure fields before the bottleneck breakup, 14–17 ms (a), and after the breakup, 20–40 ms (b).
Fire 06 00094 g005
Figure 6. Comparison of the averaged axial velocity. Black squares denote experimental data; the red line denotes Hu, Zhou, and Luo simulations with Smagorinsky and PDF flamelet; the green line represents our simulation with the Smagorinsky model; and the blue line represents our simulation with the DSM model.
Fire 06 00094 g006
Figure 7. Temperature field, t = 16 ms: Smagorinsky model (a), and DSM (b).
Fire 06 00094 g007
Figure 8. Instantaneous stoichiometric iso-surface colored by Y C H 4 · Y O 2 , t = 16 ms: (a) Smagorinsky model and (b) DSM.
Fire 06 00094 g008
Figure 9. Time- and angle-averaged temperature field, (a) Smagorinsky model, and (b) DSM.
Fire 06 00094 g009
Figure 10. Comparison of the average temperature profiles. Designations as in Figure 6.
Fire 06 00094 g010
Figure 11. Water vapor mass fraction comparison. Designations as in Figure 6.
Fire 06 00094 g011
Figure 12. Comparison of the average temperature profiles with different kinetics. The green line denotes the simulation with Zhou kinetics; thick pink line denotes the simulation with BFER2 kinetics. All simulations were based on the Smagorinsky model.
Fire 06 00094 g012
Figure 13. CO 2 mass fraction comparison. The red line denotes Hu, Zhou, and Luo simulations with Smagorinsky-Lilly and PDF flamelet; the green line represents our simulation with the Smagorinsky model; the blue line represents our simulation with the DSM model; and the orange line denotes the. axisymmetric RANS simulation from [42].
Fire 06 00094 g013
Figure 14. Production of subgrid stresses field and iso-surface where P = 1700   m 2 / s 3 .
Fire 06 00094 g014
Disclaimer/Publisher’s Note: The statements, opinions and data contained in all publications are solely those of the individual author(s) and contributor(s) and not of MDPI and/or the editor(s). MDPI and/or the editor(s) disclaim responsibility for any injury to people or property resulting from any ideas, methods, instructions or products referred to in the content.

