Article

An Experimental Study on the Transportation Characteristics of Perfluoro(2-methyl-3-pentanone) in a Straight Pipe

1
State Key Laboratory of Fire Science, University of Science and Technology of China, Hefei 230026, China
2
AECC Commercial Aircraft Engine Co., Ltd., Shanghai 200241, China
*
Author to whom correspondence should be addressed.
Fire 2023, 6(4), 156; https://doi.org/10.3390/fire6040156
Submission received: 7 February 2023 / Accepted: 12 April 2023 / Published: 14 April 2023
(This article belongs to the Special Issue Advances in Fire Suppression)

Abstract

:
Gaseous fire suppressants are usually stored in a vessel via pressurization, and then discharged out through pipelines. The flow behaviors of the agents in pipes greatly affect its dispersion in space, as well as the fire extinguishing results. Here, an experimental study was carried out on the transportation characteristics of perfluoro(2-methyl-3-pentanone) (C6F12O) in a horizontal straight pipe with the temperature and pressure recorded synchronously. At a filling pressure of 1800 kPa and a filling density of 517 kg·m−3, the agent release was completed in 2.0 s with the pipeline pressure peak of 1145 kPa and the pipeline temperature nadir of −10.6 °C. In comparison to that of bromotrifluoromethane (CF3Br) under the same conditions, the temperature and pressure curves of C6F12O exhibited similar varying trajectories but a much smaller amplitude, which could be ascribed to their different thermophysical properties. When keeping the other conditions unchanged, raising the filling pressure C6F12O reduces the discharge duration and the pipeline temperatures. Increasing the filling density extends the discharge duration, but shows little influence on the pipeline temperatures. The results were expected to provide useful information for the model validation and engineering design of a C6F12O fire-suppressing system with a predictable performance.

1. Introduction

Great efforts have been devoted to looking for ideal halon replacers since the use of CF3Br was banned, by the Montreal Protocol and its subsequent revisions, for its effect on the ozone layers. Perfluoro(2-methyl-3-pentanone), denoted as C6F12O, has become one of the most promising halon replacers with satisfactory environmental friendliness, as well as fire extinguishing efficiency and toxicity [1]. Since being proposed by 3 M as a new kind of clean fire suppressant, numerous studies have been conducted on C6F12O, including studies on its physicochemical properties [2,3], fire extinguishing capacity [4,5], material compatibility [6,7], thermal decomposition products [8], etc. These studies provide valuable directions on the model computation and practical applications of C6F12O in the context of real fire suppression. In 2003, C6F12O was recognized as an available halon alternative and substitute in the significant new alternatives policy (SNAP) program of the United States Environment Protection Agency (EPA) [9]. It was also listed in the fire extinguishing system design standards of ISO 14520 and NFPA 2001 [10,11]. Currently, C6F12O is widely used in the areas of electrical and electronic cabinets, ships, libraries, etc.
Similar to many other gaseous fire suppressants of halons and hydrofluorocarbons (HFCs), C6F12O is usually stored in a vessel via pressurization. Once the valve was actuated, the pressurized agent was ejected into the piping manifold and then distributed into space. The transportation characteristics of the fire suppressant in the pipes showed a great influence on its atomization and its distribution in space, as well as in its fire extinguishing results [12]. Therefore, understanding the state of C6F12O in pipes is indispensable for creating an effective fire suppression system design.
Although extensive research has been carried out on C6F12O, as mentioned above, seldom have the transportation behaviors of C6F12O in pipes been seen. Recently, Fan reported the flow characteristics of C6F12O in a complex pipeline with multi-branches [13]. By comparing the experimental data with hydraulic calculations, it was deduced that C6F12O only conformed to single-phase flows in the initial upstream section of the pipeline, but presented with a two-phase flow state in the following main pipe and downstream section of the pipeline. In comparison to that of bromotrifluoromethane (CF3Br), which has been tested within detailed studies under various conditions [14,15,16,17], investigations on C6F12O have been scarce up till now. More accurate experiments are still necessary for a better understanding of the flow behaviors of C6F12O in pipes.
In this work, the discharge process of C6F12O in a horizontal straight pipe was, in a full scale, experimentally studied. The pressures and temperatures in the vessel and pipes were recorded with a high sampling rate. Meanwhile, CF3Br was tested as a counterpart for comparison since it has always served as the baseline for screening halon replacer candidates. The effects of source pressure and the filling density on the flow parameters of C6F12O were explored by a series of contrast trials. The transportation characteristics of C6F12O in the pipe were summarized based on experimental observations and its thermophysical properties.

2. Materials and Methods

Figure 1 schematically illustrates a typical experimental setup of the agent discharge system. A spherical vessel with the volume of 3.89 L was connected with a horizontal straight pipe through a solenoid valve. The pipe was 2.0 m long with an inner diameter of 14 mm. A convergent nozzle with an inner diameter of 12 mm was also equipped at the end of the pipe.
The pressure (P) and temperature (T) data in the vessel and the pipe were synchronously traced by thermocouples and pressure sensors with a sampling frequency of 4096 Hz. As shown in Figure 1, two thermocouples were installed on the top (Tv0) and the bottom of the vessel (Tv1), respectively. The other four thermocouples were anchored equidistantly on the pipe with a spacing of 0.66 m (T1–T4). There were five pressure sensors installed on the system. One located the upper part of the vessel (Pv1) and four other ones positioned on the pipe (P1–P4). At each measuring point of the pipe, the thermocouple and the pressure sensor were arranged face to face. The measuring errors of temperature, pressure and agent mass were estimated as 1.0%, 0.5% and 1.0%, respectively. The errors were mainly caused by the instruments and the discharge system. In addition to these, the error of agent mass also originated from the loss in the filling process. The pressure sensors, thermocouples and the electronic scale were all calibrated before measurements were taken.
C6F12O and CF3Br with a purity above 99.5% were chosen as the fire suppressants. As is the case in a typical experiment, the vessel was first pumped in order for it to become a vacuum. Then, it was filled with a certain amount of liquid C6F12O, then pressurized by nitrogen until reaching the desired pressure. After that, the P–T recording system was started. Once the fast-opening solenoid valve was actuated, the agent in the vessel was forced out into the straight pipe and discharged from the nozzle into an unconfined space. The test of CF3Br was conducted in the same discharge system under similar conditions. Table 1 lists the tests with different filling pressures and filling densities. The filling pressure is the source pressure in the vessel that was achieved by nitrogen pressurization. The filling density was defined as the mass agent of the liquid divided by the vessel volume. All the tests were conducted at a room temperature of about 20 °C.

3. Results and Discussion

3.1. Pressures and Temperatures in the Discharge System

Figure 2a shows, in test 1 of C6F12O, all of the pressure and temperature profiles as a function of time. The plots of the vessel pressure (Pv0) and the pipeline pressure (P1–P4) are located in the lower part of the pattern. Upon the beginning of the agent spray, Pv0 dropped continuously from 1822 kPa to atmospheric pressure. The time length of such a process was defined as the discharging duration (td). From the trace of Pv0 versus time, the td of test 1 was determined as 2.0 s. Different to the uninterrupted dropping of Pv0, the pipeline pressure plots (P1–P4) exhibited an asymmetric hump shape, which could be roughly divided into three stages of “rapid increase, gentle decrease and continuous decrease”. Taking P1 as an example, in the first stage of 0–0.23 s (marked in yellow), P1 increased rapidly from zero to a peak pressure of 1145 kPa, at a high rising rate of 4978 kPa·s−1. Then, it declined gently with fluctuations at an average rate of 488 kPa·s−1 in the time range of 0.23–0.63 s (marked in blue). In the final stage of 0.63–2.0 s (marked in pink), P1 decreased continuously from 950 kPa to zero at an average decreasing rate of about 693 kPa·s−1. The peak pressure decreased farther down the pipe from P1 (1145 kPa) to P4 (803 kPa) with the gap between the neighboring points of 100–150 kPa. Meanwhile, the time by which the four measuring points reached the peak pressure increased upstream from P4 (0.18 s) to P1 (0.23 s), with an interval of about 15–20 ms.
The temperature curves of test 1 are located in the upper part of Figure 2a. The two T plots of the vessel that are at the top decreased very slowly, with a total reduction of about 3.3 °C for the upper gas (Tv0) and only 0.5 °C for the liquid below (Tv1). The piping temperature plots (T1–T4) were kept nearly flat in the period of 0–0.63 s. In the following stage, they declined quickly to levels below zero, showing a total reduction of about 26–30 °C. The nadir point of T1 was as low as −10.6 °C.
Figure 2b presents the P–T profiles from the trial of CF3Br (test 2), which followed trajectories that are similar to those of C6F12O, albeit with distinct details. From the monotonically declining curve of Pv0, the td of CF3Br was determined as 3.0 s, which is much longer than that of C6F12O. Likewise, the piping pressure plots were hump shaped with a quick rise and a slow drop. The peak pressures of P1–P4 were in the range of 1300~1570 kPa, which were about 400–500 kPa higher than those of C6F12O. However, the spacing of the peak values of P1–P4 (60 kPa) was only half of that of C6F12O.
In the vessel of CF3Br, Tv0 dropped by 5 °C in the range of 0–1.0 s. Then, it was kept nearly flat until the end of the agent’s release. Meanwhile, Tv1 remained constant within the initial stage and then decreased rapidly to zero (1.0–1.5 s) at a rate of about 32 °C·s−1. There were two big drops in the piping temperature traces (T1–T4). The first occurred at the beginning of discharge with a drop of 9~21 °C, and the second was in the latter part of discharge with a reduction of 25–40 °C. At the end of the agent’s release, all the temperature points in the pipe fell below −20 °C. T1 even reached the lowest point of −44 °C, which is significantly lower than that of C6F12O.

3.2. Transportation Characteristics of C6F12O in the System

The nonlinear changes in Figure 2 imply complex flow behaviors with respect to the suppressants during the rapid release process. As shown above, the P–T profiles of C6F12O exhibited a varying trend that was similar to CF3Br but with a much lower amplitude, which could be ascribed to their different thermophysical properties. Table 2 listed some of the typical parameters of the two agents, revealing their remarkable differences regarding vapor pressure and boiling points. At a room temperature and atmospheric pressure, the C6F12O was a liquid, while the CF3Br was a gas. When stored in the vessel and fed through a pipe, the agents experienced phase changes between gas and liquid with the pressure changing. Based on the P–T data acquired, the transportation properties of C6F12O in the system were analyzed comparatively with CF3Br as a reference.

3.2.1. Variations in the Vessel

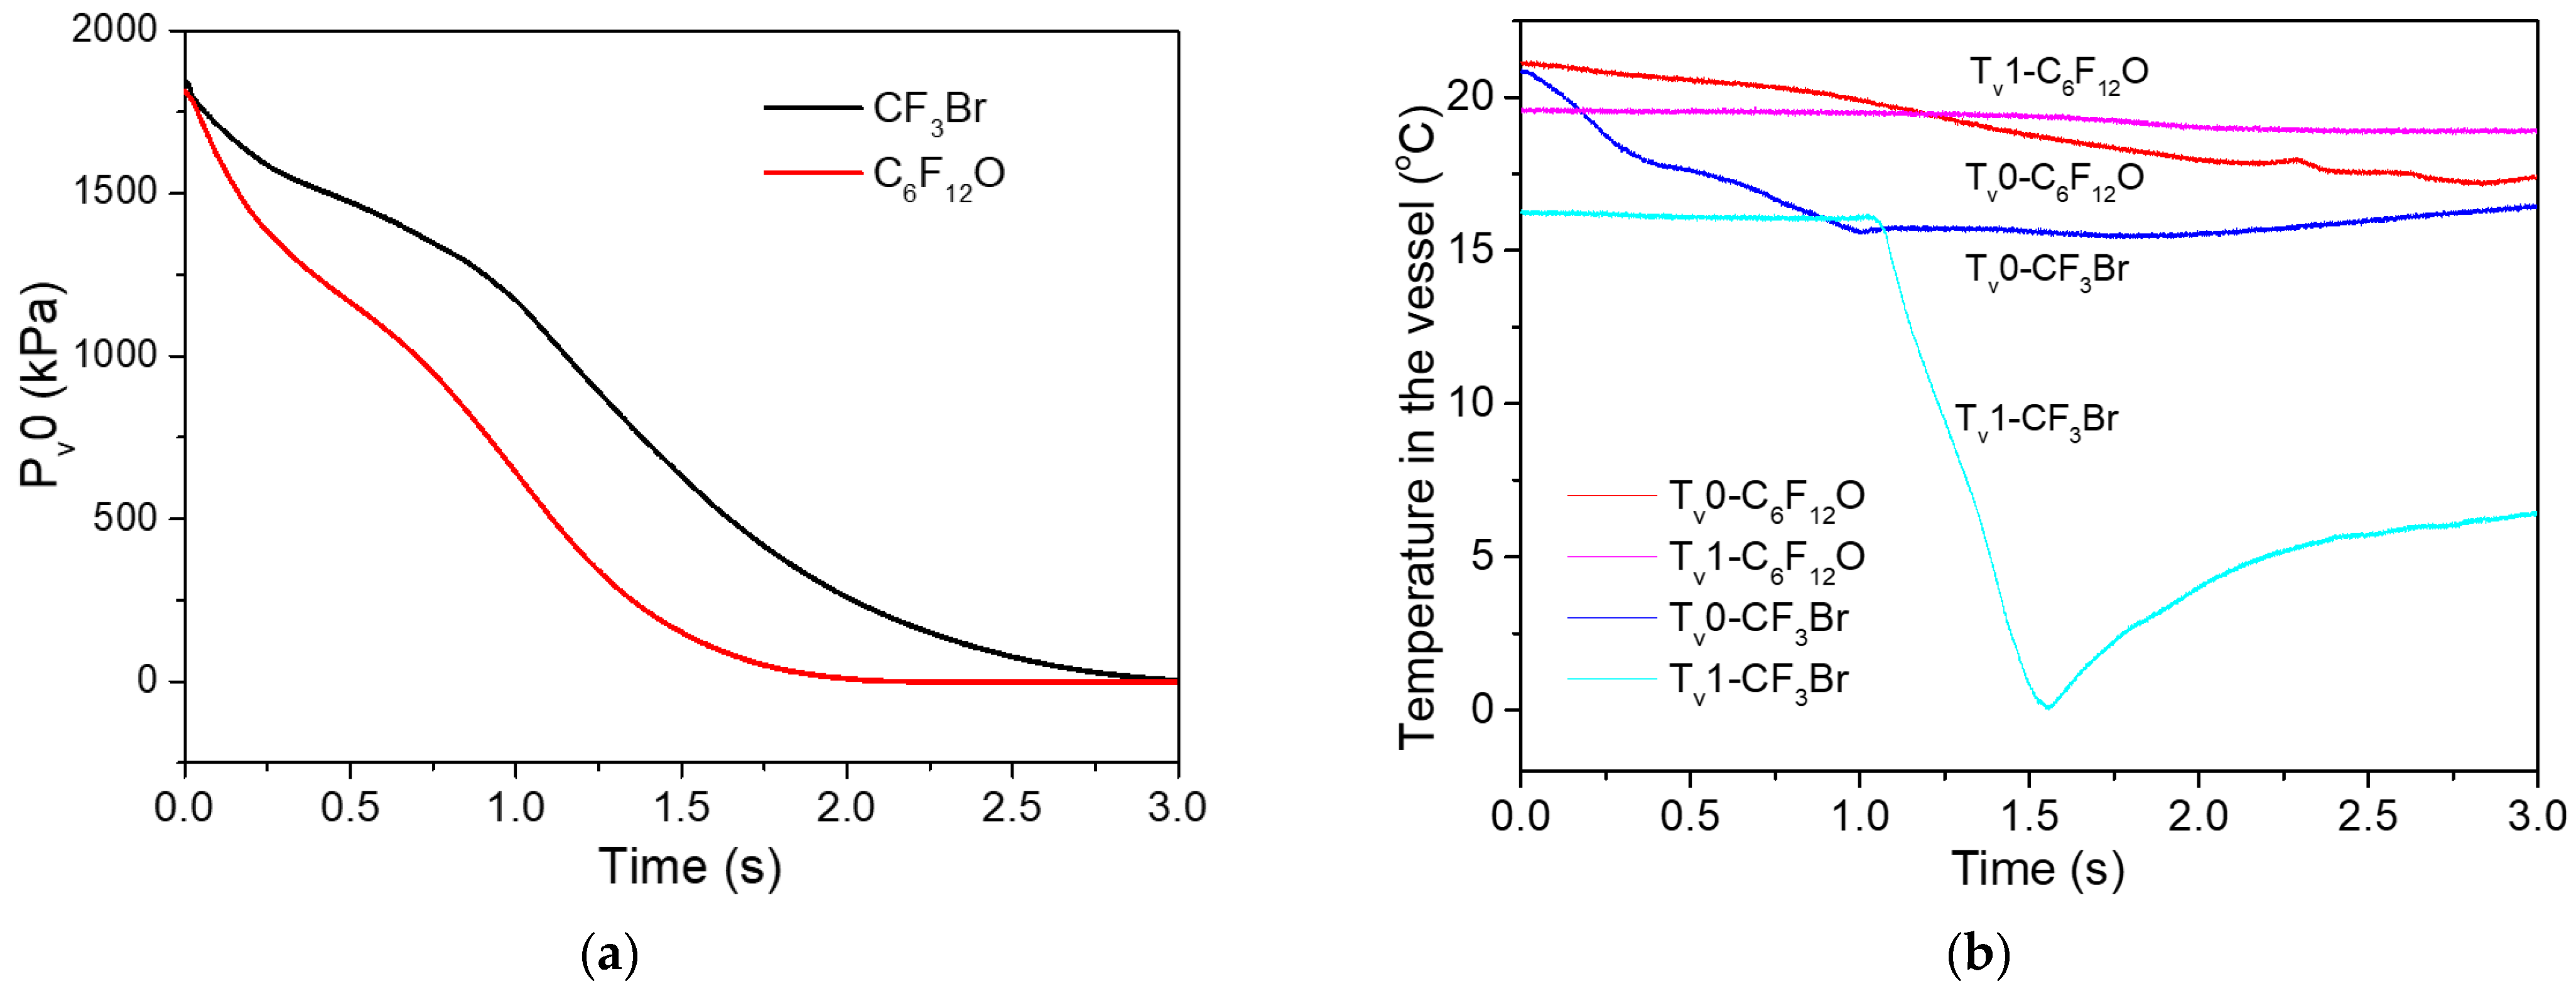
Both C6F12O and CF3Br were stored as liquids in a vessel under a nitrogen pressurization of about 1800 kPa. The liquid located at the lower part of the vessel with nitrogen dissolved, while the ullage was a mixture of nitrogen and agent vapor. As the system was depressurized, a dissolution of nitrogen and vaporization of liquefied agent occurred, which counteracted the pressure decline in the vessel and extended the discharge duration. As is confirmed by Figure 3a, both Pv0 plots were characteristics of the pressure offset in the middle stage with reduced dropping rates. For the C6F12O with a lower vapor pressure and higher boiling point, the pressure compensating effect was relatively weak since there was little vaporization and what gas there was mainly came from the process of nitrogen separating from the liquid. As to the CF3Br with a much higher vapor pressure and lower boiling point, the effect of pressure offset was stronger from the combined contributions of nitrogen dissolution and agent vaporization. Therefore, the Pv0 of CF3Br decreased at a slower rate than that of C6F12O.
Figure 3b shows the variation of temperatures in the vessel during release process of CF3Br. The Tv0 first decreased by 5 °C in the initial 1.0 s, and this was due to gas expansion and liquid vaporization. Then, it reached a plateau, indicating a new single-phase gas status in the vessel. The vessel filled with “liquid, vapor and nitrogen” transformed into one filled with the gaseous mixture of “nitrogen and vapor”. Much different to that of CF3Br, the Tv0 of C6F12O decreased steadily and slowly along with only gas expansions and with little phase change.
The Tv1 of CF3Br initially did not change much since it was submersed in the liquid [19]. As the liquid in the vessel ran out, it experienced a vaporization of the liquid and an expansion of the remaining gas in the vessel, which showed a big temperature reduction of about 15 °C. The Tv1 of C6F12O remained constant in the first stage, similar to that of CF3Br for comparable reasons. In the latter part with gas discharge, only a small temperature drop of 0.3 °C was displayed. When considering its low vapor pressure and high boiling point, there were little phase changes taking place in the vessel of C6F12O. Therefore, the reduction in Tv1 was minimal during the whole process.

3.2.2. Variations in the Pipe

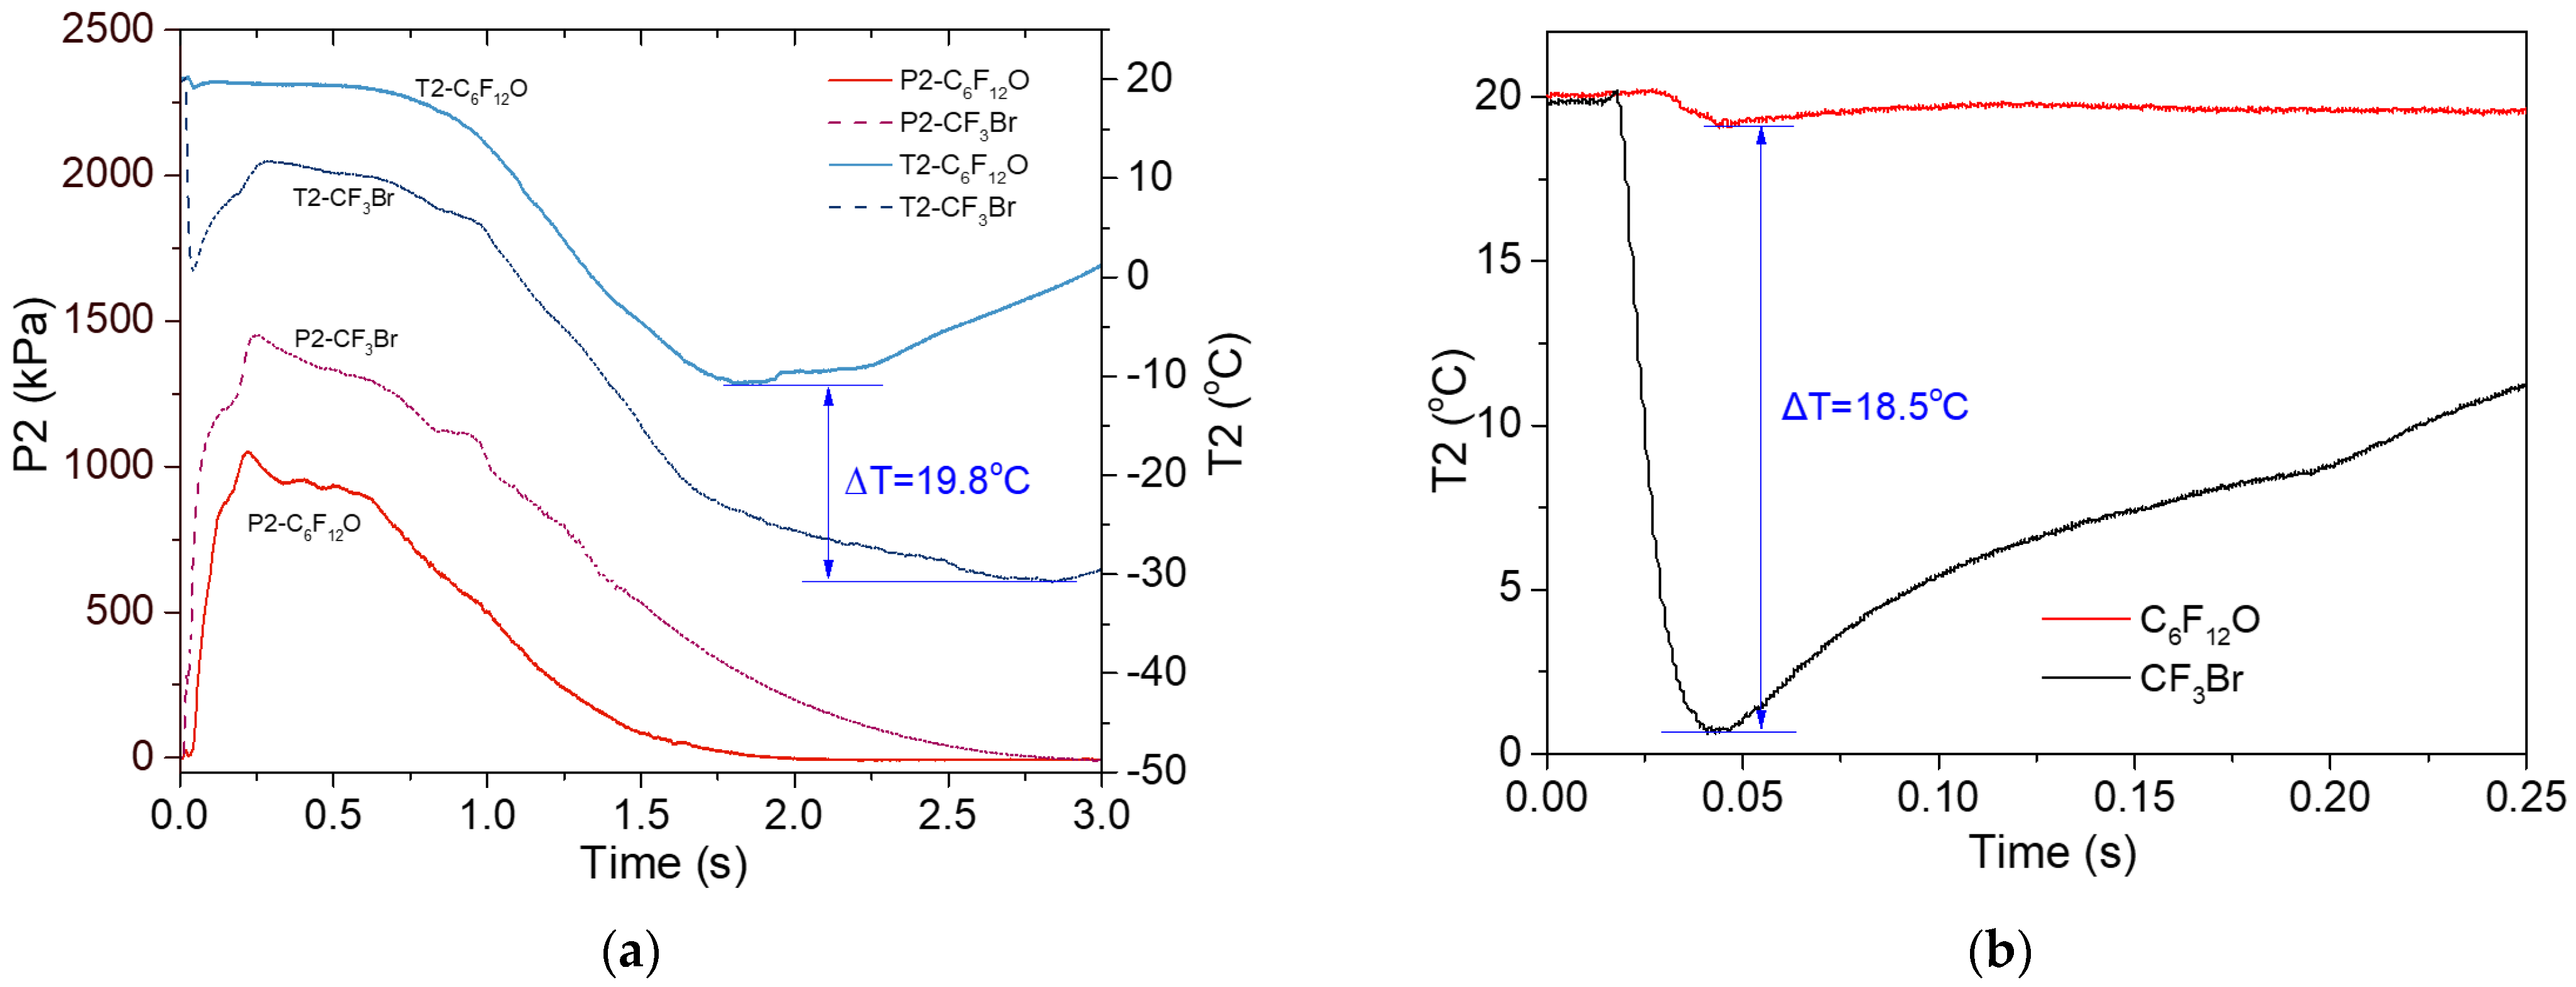
Initially, the pipe was full of air when at an atmospheric pressure. Once the valve was opened, the ullage pressure in the vessel drove the liquid C6F12O out from the vessel into the pipe. Before the agent entered the pipe, the pressure wave propagated forward, which made the pressure sensors in the pipe first detect a pressure increase [20]. When the pressure wave arrived at the nozzle, it was restricted by the convergent nozzle and a pressure bounce back was triggered [21]. Thus the air in the pipe was compressed by the pressures from the two ends, which led to a temperature rise. As seen in Figure 4, with T2 and P2 serving as examples, in this very initial stage of only about 30 ms, both the temperature and the pressure in the pipe increased.
After this short period, the pressurized liquid C6F12O flew into the pipe. For the pressure difference, the liquid agent entering the pipe would evaporate immediately, together with the escape of the dissolved nitrogen. Such a process further improved the pressure in the pipe, but led to a temperature decrease due to the endothermic process of vaporization. With more fluid flowing into the pipe, both P2 and T2 went up again. When the fluid filled the pipe, P2 attained the peak value. In this very short stage with the pipeline pressure increasing, the agent in the pipe existed mainly in a gaseous state.
With the discharge ongoing, the C6F12O that flowed into the pipe entered a steady state under the co-effects of the driving force of nitrogen and the friction resistance from the pipe wall. The T2 curve remained stable and the P2 decreased gently. During this middle stage, the fluid in the pipe existed mainly as a liquid, as well as a small amount of nitrogen and C6F12O vapor, which is typical of a gas-liquid two-phase flow. As the pressure dropped, the mass ratio of gas to liquid in the pipe increased. With the liquid C6F12O gradually being consumed, the release process enters the final period with the agent in the pipe being in the form of nitrogen and C6F12O vapor. The expansion of gas brought about a big temperature decrease. At the end of the discharge, the pressure and temperature curves simultaneously went downward to the nadirs.
The P2 and T2 profiles of CF3Br are also presented in Figure 4a for the purpose of comparison. The comparable trajectory implies similar phase changes as were described above. However, there are also some remarkable differences. During the whole release process, the P2 of CF3Br remained above that of C6F12O, and the T2 of CF3Br stayed below that of C6F12O. Moreover, the T2 of CF3Br exhibited two much bigger temperature drops. Under the experimental conditions, the CF3Br vapor was liquefied during the nitrogen pressurization, which contained superheat [20]. When the CF3Br liquid entered the pipe, intense flashing vaporization occurred, resulting in the first temperature reduction. As is shown in Figure 4b, the nadir temperature of CF3Br was 18.5 °C lower than that of C6F12O. In the following stage with an evolving gas-liquid two-phase flow, the CF3Br in the pipe displayed a higher pressure and lower temperature than that of C6F12O. When it came to the final stage with a gas expansion, the second big temperature drop appeared, with the gap between the two T2 nadirs of 19.8 °C.
In the test of CF3Br, it was also observed that P1 had the highest peak pressure, and that P4 hit the peak pressure first out of all the four piping pressures that were similar to C6F12O. Considering fluid behaviors in the pipe, such phenomena may be attributed to the restriction of the convergent nozzle. It was known that the strength of pressure wave waned along the pipe. As the nearest point to the valve, P1 sensed the highest peak pressure for the least pressure loss. On the other hand, as the nearest point to the nozzle, P4 first showed the peak value because the bounce back of the pressure wave reached P4 prior to the other three measuring points.

3.3. Effect of the Filling Pressure on the Flow Behaviors of C6F12O

Figure 5a displays the Pv0 plots from the three tests at the filling pressures of 1910, 2540 and 3230 kPa, whilst keeping the mass of the C6F12O similar, respectively. With the filling pressure increasing, the Pv0 declined at a faster rate. As is seen in the pattern inset in the upper part of Figure 5a, the td approximately decreased linearly with the source pressure rising. This was different to the result of CF3Br that was reported by Jia (which was inset in the lower part of Figure 5a), where the injection duration first decreased sharply and then decreased steadily when the release pressure reached a certain value [17]. In their tests of CF3Br, flashing vaporization contributed the most to the pressure compensation in the vessel, which led to the elongation of td. The proportion of such contribution was relatively high at low filling pressures, but dropped at higher filling pressures. However, in the current experiments of C6F12O, the pressure compensation was much smaller, and the source pressure dominated the discharge duration. Further, more tests at varied filling pressures were needed to validate the result.
Figure 5b,c presents the P–T variations in the pipe of C6F12O at the three filling pressures. In Figure 5b, with P2 as an example, the peak values of P2 increased with the filling pressure rising, while the piping temperature decreased with the source pressure increasing. As shown in Figure 5c, at the Pv0 of 1910, 2540 and 3230 kPa, T1 showed the lowest values of −8.8, −13.8 and −19.7 °C, respectively. Similarly, a nearly linear relationship was exhibited in the patterns inset in Figure 5b,c. For the current system, the rapid release could be regarded as an adiabatic expansion process. The source pressure in the vessel was the driving force for the agent transportation. With the agent flowing, the pressure energy would transform into dynamic energy and heat energy. Higher filling pressures not only accelerated the fluid flow and shortened the discharge time, but also led to a lower temperature in the pipe.

3.4. Effect of the Filling Density on the Flow Behaviors of C6F12O

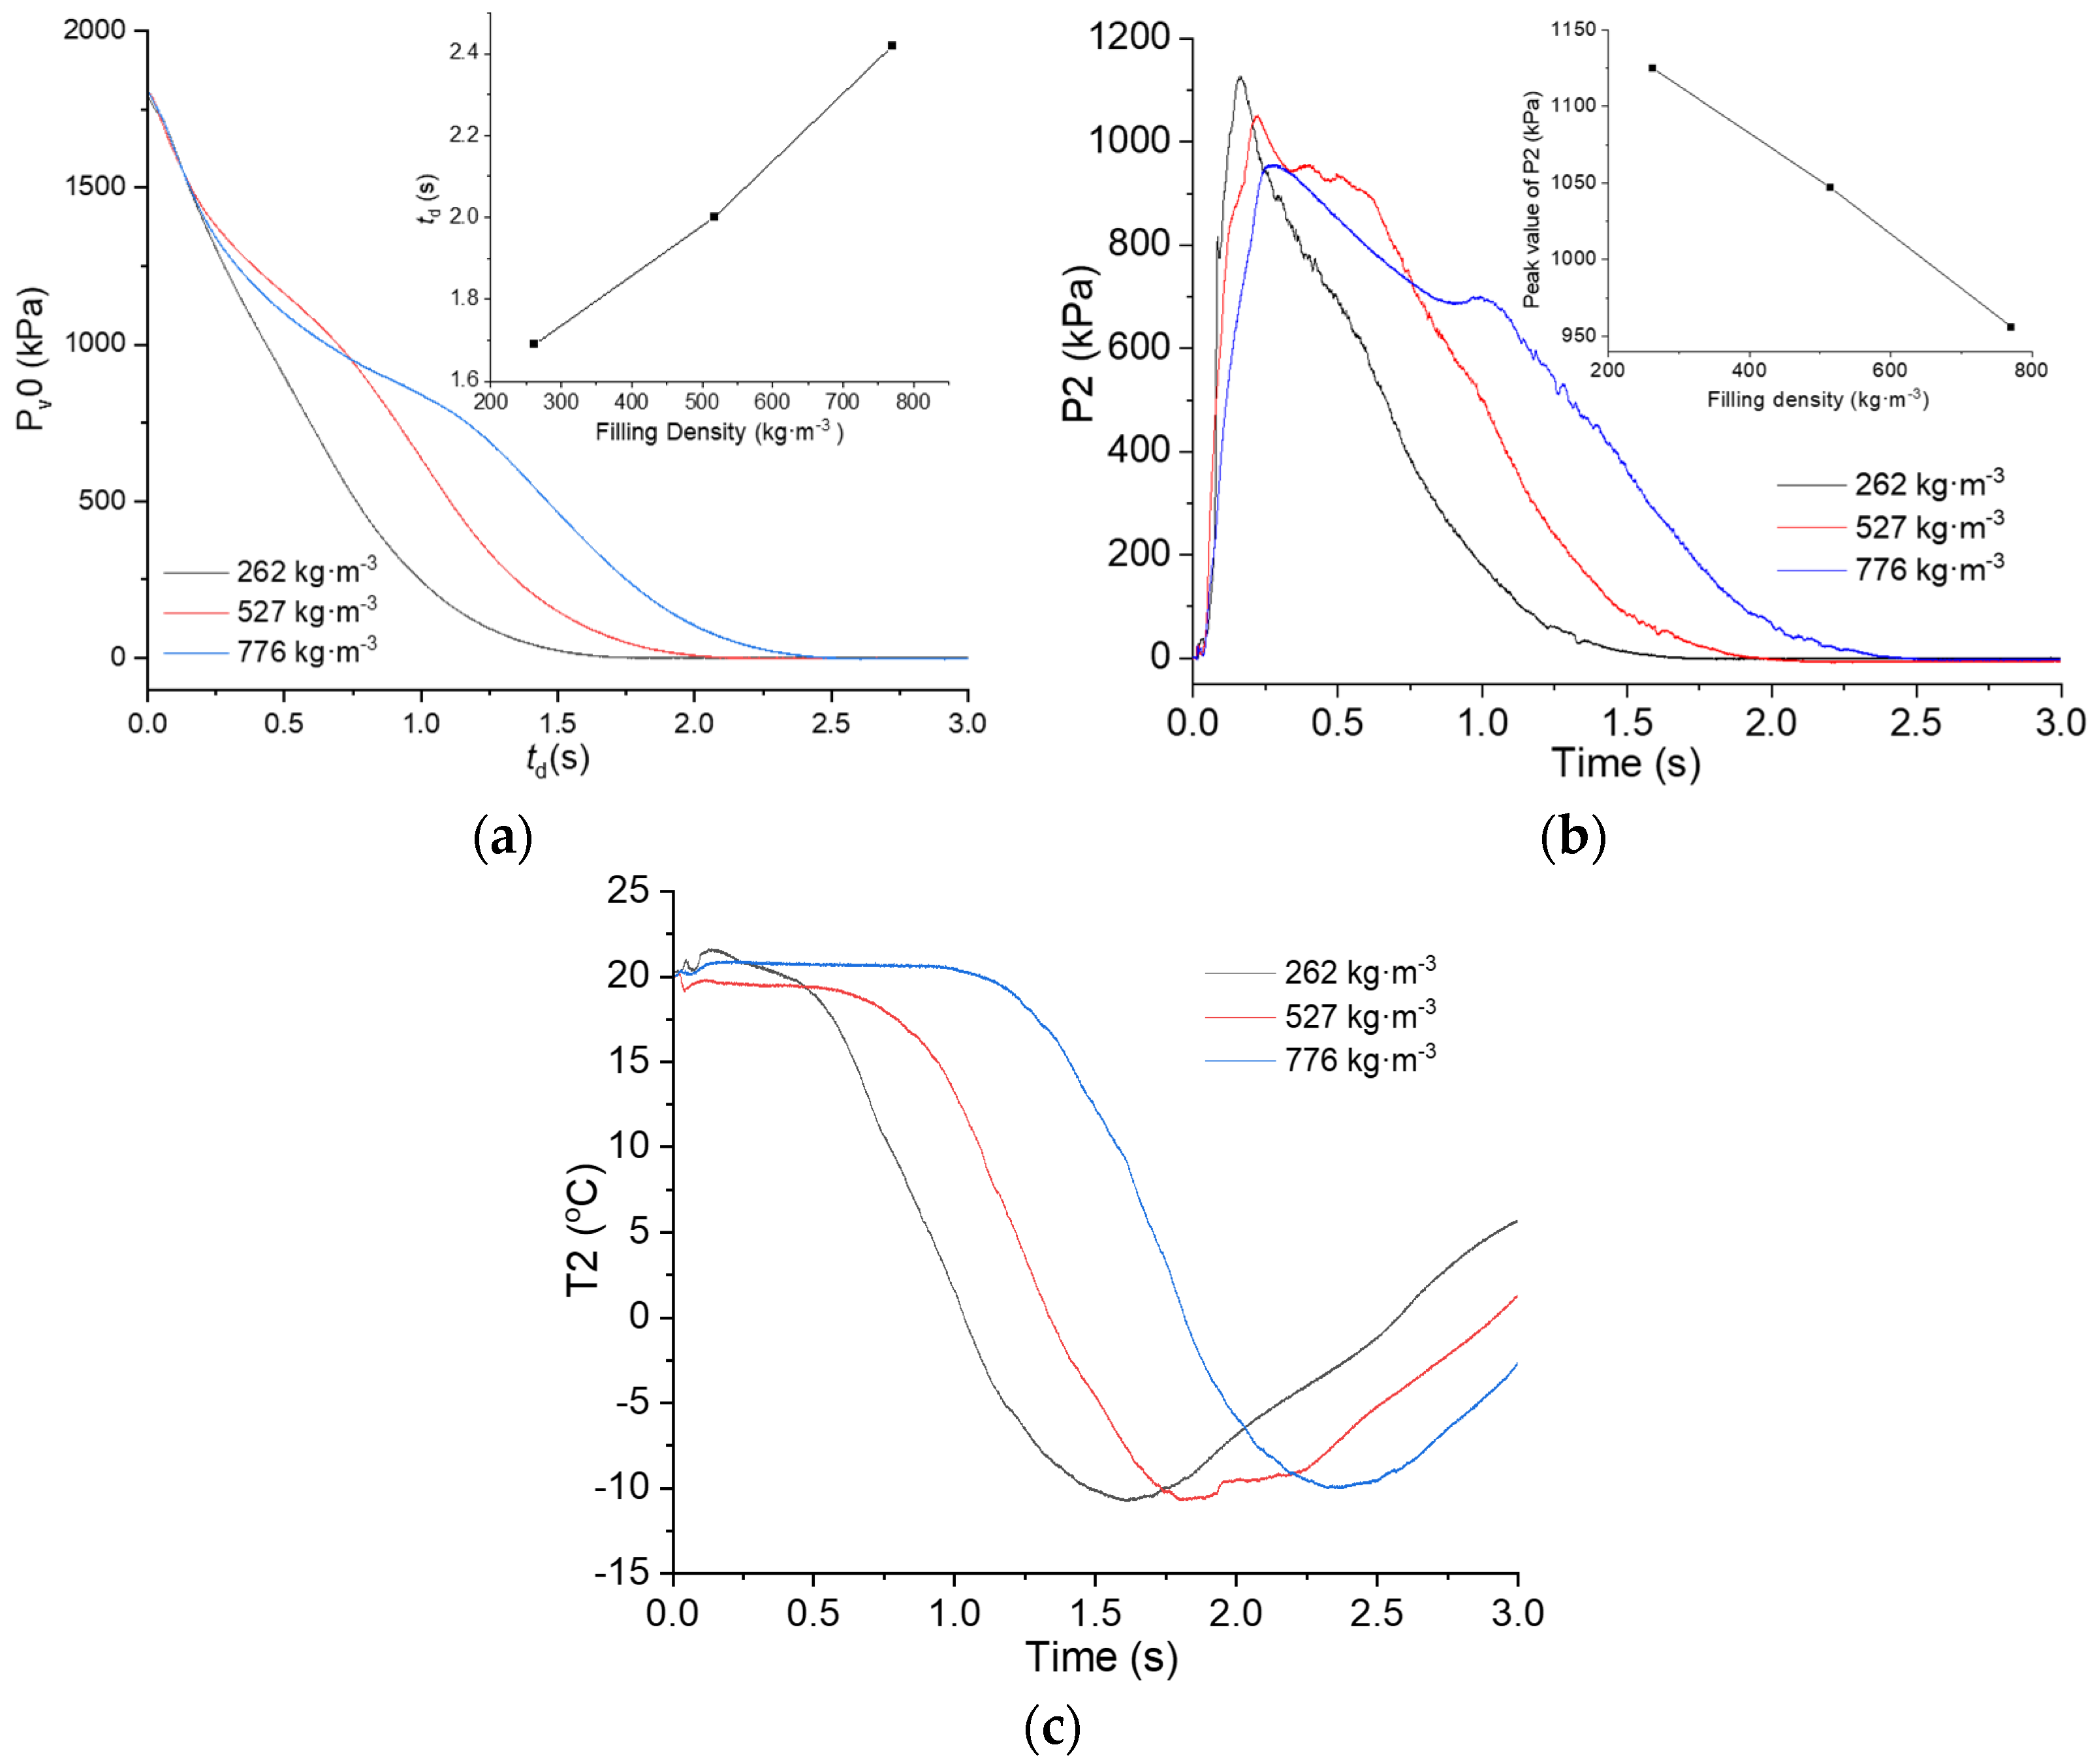
Figure 6a shows the changes that were tracked in Pv0 in the C6F12O tests at different filling densities. With the agent mass increasing, the td correspondingly increased (as is seen in the pattern inset in Figure 6a). Meanwhile, the peak pressure of the pipe went down. As shown in Figure 6b, with P2 as an example, the peak value decreased from 1170 kPa to 956 kPa when the filling density increased from 262 to 776 kg·m−3, which also displayed a nearly linear varying trend (as is seen in the pattern inset in Figure 6b). Figure 6c gave the temperature traces of T2 in the three tests. With the filling density rising, the time that the plot began decreasing was postponed, but the decreasing rate and the nadir value remained unchanged. The lowest point was around −10 °C for all the three T2 plots.

4. Conclusions

In this work, the transportation characteristics of C6F12O in a straight pipe during a rapid release process were studied by tracking the temperature and pressure variations simultaneously. The effects of the filling pressure and the filling density on the flow behaviors of C6F12O were examined through a series of tests. Based on the experimental data, the main conclusions were drawn as follows:
  • Under the driving of pressurized nitrogen, the C6F12O was sprayed out of the pipe very rapidly. In the process of just a few seconds, the agent in the pipe experienced complex changes within the three stages of “gas, gas-liquid mixture and gas”. The intermediate stage exhibited characteristics of gas-liquid two-phase flow, which is where the fluid was dominated by liquid C6F12O together with a small amount of vapor and nitrogen;
  • Upon the release of C6F12O, the pressure in the vessel went steadily downward until it reached zero, while the vessel temperature just showed a minor drop of several degrees Celsius. The pipeline pressure plots exhibited an asymmetric hump shape, which contained three stages of “rapid increase, gentle decrease and continuous decrease”. In the first two stages, the piping temperature remained stable. However, a big drop of about 30 °C in the piping temperature occurred in the third stage of gas discharge;
  • In comparison to that of the CF3Br released under similar conditions, the temperature and pressure curves of C6F12O exhibited similar trajectories, but with much lower varying amplitudes. Moreover, such differences can be mainly ascribed to their different vapor pressures and boiling points;
  • With other conditions being the same, raising the filling pressure in the vessel of the C6F12O reduced the discharge duration and the pipeline temperatures. Increasing the filling density extended the discharge duration, but showed little influence on the pipeline temperatures.
The experimental data were expected to validate the computer code predictions of C6F12O in pipeline transportations, which will be useful for the design of a C6F12O fire suppressing system in the areas of aircraft, shops, libraries, etc.

Author Contributions

Conceptualization, S.L. and J.W.; methodology, Q.H. and C.Z.; data curation, Q.H., Y.C. and X.N.; validation, C.Z. and J.H.; formal analysis, Y.C. and X.N.; writing—review and editing, X.N.; supervision, J.W. and S.L. All authors have read and agreed to the published version of the manuscript.

Funding

This research was funded by the National Natural Science Foundation of China (U1933126), the National Science and Technology Major Project (J2019-VIII-0010-0171) and the Fundamental Research Funds for the Central Universities of China (WK2320000053).

Institutional Review Board Statement

Not applicable.

Informed Consent Statement

Not applicable.

Data Availability Statement

Not applicable.

Conflicts of Interest

The authors declare no conflict of interest.

References

  1. Xing, H.; Lu, S.; Yang, H.; Zhang, H. Review on Research Progress of C6F12O as a Fire Extinguishing Agent. Fire 2022, 5, 50. [Google Scholar] [CrossRef]
  2. 3M Company. 3MTM Novec1230TM Fire Protection Fluid; 3M Company: Saint Paul, MN, USA, 2020. [Google Scholar]
  3. Mclinden, M.O.; RPerkins, A.; Lemmon, E.W.; Fortin, T.J. Thermodynamic Properties of 1,1,1,2,2,4,5,5,5-Nonafluoro-4-(trifluoromethyl)-3-pentanone: Vapor Pressure, (p, ρ, T) Behavior, and Speed of Sound Measurements, and an Equation of State. J. Chem. Eng. Data 2015, 60, 3646–3659. [Google Scholar] [CrossRef]
  4. Kim, A.; Crampton, G.; Kanabus-Kaminska, M. Performance of Novec1230 in Electronic Facility Fire Protection; NRCC-53526; National Research Council Canada: Montreal, QC, Canada, 2010.
  5. Pagliaro, J.L.; Linteris, G.T. Hydrocarbon Flame Inhibition by C6F12O (Novec 1230): Unstretched Burning Velocity Measurements and Predictions. Fire Saf. J. 2017, 87, 10–17. [Google Scholar] [CrossRef] [Green Version]
  6. Li, Y.; Zhang, X.; Tian, S. Insight into the Compatibility Between C6F12O and Metal Materials: Experiment and Theory. IEEE Access. 2018, 6, 58154–58160. [Google Scholar] [CrossRef]
  7. Zhang, X.; Lan, J.; Tian, S.; Rao, X.; Li, X.; Yuan, Z.; Jin, X.; Gao, S.; Zhang, X. Study of Compatibility between Eco-friendly Insulating Medium C6F12O and Sealing Material EPDM. J. Mol. Struct. 2021, 1244, 130949. [Google Scholar] [CrossRef]
  8. Ditch, B.D.; Rivers, P.E.; Thomas, S.D. Thermal decomposition product testing with C6F-ketone. In Proceedings of the Halon Options Technical Working Conference (HOTWC), Albuquerque, NM, USA, 24–26 April 2001; pp. 349–354. [Google Scholar]
  9. Environmental Protection Agency. Protection of Stratospheric Ozone: Listing of substitutes for Ozone-depleting Substances, Final Rule and Proposed Rule; United State Environmental Protection Agency: Washington, DC, USA, 2003.
  10. ISO 14520-1; Gaseous Fire Extinguishing Systems-Physical Properties and System Design, Part 5: FK-5-1-12 Extinguishant. ISO: Geneva, Switzerland, 2023.
  11. National Fire Protection Association (NFPA). Standard on Clean Agent Fire Extinguishing Systems; National Fire Protection Association (NFPA): Quincy, MA, USA, 2001. [Google Scholar]
  12. Womeldorf, B.; Mitchell, M.; Grosshandler, M. Selection of a Simulant of CF3Br for Use in Engine Nacelle Certification Tests. In Proceedings of the Halon Options Technical Working Conference (HOTWC), Albuquerque, NM, USA, 9–11 May 1995; pp. 197–210. [Google Scholar]
  13. Fan, W.; Gao, Z.; Wang, D.; Yang, Y.; Gao, Y. Study on the Flow Characteristics of Fire Extinguishing Agent FK-5-1-12 in the Pipeline Release Process. Fire Mater. 2022, 46, 376–387. [Google Scholar] [CrossRef]
  14. Williamson, H.V. Halon 1301 flow in pipelines. Fire Technol. 1976, 12, 18–32. [Google Scholar] [CrossRef]
  15. Elliott, D.G.; Garrison, P.W.; Klein, G.A.; Moran, K.M. Flow of Nitrogen Pressurized Halon 1301 in Fire Extinguishing Systems; JPL Publication: Pasadena, CA, USA, 1984.
  16. Kim, J.; Baek, B.; Lee, J. Numerical analysis of flow characteristics of fire extinguishing agents in aircraft fire extinguishing systems. J. Mech. Sci. Technol. 2009, 23, 1877–1884. [Google Scholar] [CrossRef]
  17. Jin, J.; Pan, R.; Li, Q.; Chen, R. Effects of Release Pressure on the Transportation Characteristics in Pipeline and the Diffusion Behaviors in Enclosure Space of Typical Gas Extinguishing Agent. J. Loss Prevent. Proc. 2021, 70, 104441. [Google Scholar] [CrossRef]
  18. Bromotrifluoromethane. Available online: https://webbook.nist.gov/cgi/cbook.cgi?ID=C75638&Mask=4 (accessed on 6 December 2022).
  19. Tuzla, K.; Palmer, T.; Chen, J.C.; Sundaram, R.K.; Yeung, W.S. Development of Computer Program for Fire Suppression Fluid Flow, Report Number ITF 2000-1, Vols. I and II; Institute of Thermo-Fluid Engineering & Science, Lehigh University: Bethlehem, PA, USA, 2000. [Google Scholar]
  20. Jin, J.; Hua, M.; Yan, P.; Zhang, H.; Li, Q.; Pan, X. The Transport and Diffusion Characteristics of Superheated Fire Extinguish Agent Released via Different Nozzles in a Confined Space. Saf. Sci. 2020, 129, 104787. [Google Scholar] [CrossRef]
  21. Singh, J.; Zerpa, L.E.; Partington, B.; Gamboa, J. Effect of Nozzle Geometry on Critical-subcritical Flow Transitions. Heliyon 2019, 5, e01273. [Google Scholar] [CrossRef] [PubMed] [Green Version]
Figure 1. Schematic illustration of the experimental setup.
Fire 06 00156 g001
Figure 2. Pressure and temperature profiles versus time in the tests: (a) C6F12O and (b) CF3Br.
Fire 06 00156 g002
Figure 3. Comparison of the P–T profiles in the vessel of the two tests: (a) Pv0; (b) Tv0 and Tv1.
Fire 06 00156 g003
Figure 4. Comparison of the P–T profiles of the two tests: (a) P2 and T2; (b) T2.
Fire 06 00156 g004
Figure 5. P–T profiles of the C6F12O tests at different filling pressures: (a) Pv0, the pattern inset in the upper part showed td at different filling pressures, pattern inset in the lower part was due to the CF3Br from ref. [17]; (b) P2, the pattern inset showed the peak values of P2 at different filling densities; (c) T1, the pattern inset showed the T1 nadir at different filling pressures.
Fire 06 00156 g005
Figure 6. P–T profiles of the C6F12O tests at different filling pressures: (a) Pv0, the pattern inset showed the td of the tests at different filling densities; (b) P2, the pattern inset showed the peak values of P2 at different filling densities; (c) T2.
Fire 06 00156 g006
Table 1. The discharge tests of the C6F12O and CF3Br used.
Test SequenceAgentAgent Mass
(kg)
Filling Density (kg·m−3)Filling Pressure
(kPa)
1C6F12O2.015171822
2CF3Br2.025191846
3C6F12O2.125451910
4C6F12O2.085352540
5C6F12O2.145503230
6C6F12O1.022621799
7C6F12O2.055271812
8C6F12O3.027761813
Table 2. The typical parameters of C6F12O and CF3Br [2,18].
AgentMolecular WeightBoiling Point
(°C)
Vapor Pressure (kPa)Liquid Density
(kg·m−3, 22 °C)
C6F12O31649.2401.60
CF3Br149−57.816201.57
Disclaimer/Publisher’s Note: The statements, opinions and data contained in all publications are solely those of the individual author(s) and contributor(s) and not of MDPI and/or the editor(s). MDPI and/or the editor(s) disclaim responsibility for any injury to people or property resulting from any ideas, methods, instructions or products referred to in the content.