Article

Using a Statistical Model to Estimate the Effect of Wildland Fire Smoke on Ground Level PM2.5 and Asthma in California, USA

1
Health Sciences Research Institute, University of California, Merced, 5200 N. Lake Road, Merced, CA 95343, USA
2
USDA Forest Service, Pacific Southwest Region, 351 Pacu Lane, Bishop, CA 93514, USA
3
USDA Forest Service, Pacific Southwest Research Station, 800 Buchanan St., WAB, Albany, CA 94706, USA
*
Author to whom correspondence should be addressed.
Fire 2023, 6(4), 159; https://doi.org/10.3390/fire6040159
Submission received: 31 January 2023 / Revised: 10 April 2023 / Accepted: 12 April 2023 / Published: 16 April 2023
(This article belongs to the Section Fire Social Science)

Abstract

:
Forest fire activity has been increasing in California. Satellite imagery data along with ground level measurements of PM2.5 have been previously used to determine the presence and level of smoke. In this study, emergency room visits for asthma are explored for the impacts of wildland smoke over the entire state of California for the years 2008–2015. Smoke events included extreme high-intensity fire and smoke along with low and moderate smoke events. The presence of wildland fire smoke detected by remote sensing significantly increased fine particulate matter (PM2.5) and significantly increased the odds of exceeding expected concentrations of PM2.5 at ground level. Smoke observed above a monitoring site increases the chance of PM2.5 exceeding 35 µg m−3 (odds ratio 114 (87–150) when high levels of smoke are detected). The strength of association of an asthma emergency room visit is increased with higher PM2.5 concentrations. The odds ratios (OR) are highest for asthma hospital visits when daily mean PM2.5 concentrations experienced exceed 35 µg m−3 for multiple days (OR 1.38 (1.21–1.57) with 3 days). Nonetheless, on days with wildland fire smoke, the association of an emergency room visit for asthma due to PM2.5 is not observed. Further study is needed to confirm these findings and determine if this is a product of smoke avoidance and reduction of personal exposure during smoke episodes.

1. Introduction

The frequency and severity of large-scale forest fires has been increasing in California and the US [1,2,3,4,5]. This tendency is likely to continue over the next century with the continued warming temperatures and drought that have led to this increased wildfire activity [6,7]. Respiratory hospital admissions are projected to increase from wildland fire emissions under climate change [8].
Reintroduction of fire into wildland areas, particularly wilderness areas, to restore historic vegetation structure significantly reduces the risk of large catastrophic wildland fires [9]. Smoke is inevitable, whether it comes from fires that are ecologically beneficial or large destructive fires where suppression fails. Fires of historic size and intensity can be managed in the California Sierra Nevada to within current air quality standards [10]. Allowing more fire onto the wilderness landscape can result in less smoke transporting longer distances into densely populated areas and an overall decrease in human exposure to smoke [11,12]. Managing these smaller fires as a natural forest process when conditions allow can limit smoke exposure from unwanted large high-intensity fires.
Large high-intensity fires lead to changes in forest composition, deforestation, and contamination of air with smoke [13]. Smoke particles include air pollutants such as fine particulate matter less than 2.5 microns in diameter (PM2.5), which are known as irritants of the respiratory tract [14,15,16].
Research indicates that PM2.5 can increase the likelihood of emergency department visits due to asthma [17]. In addition, older adults and young children have been shown to have increased vulnerability to all forms of PM2.5 pollution, most likely due to frail respiratory function and immature development of the respiratory tract [18,19]. Wildland fire smoke is associated with increased risk of respiratory and cardiovascular disease [20,21,22]. The elderly are at increased risk of respiratory diseases when exposed to short-term PM2.5 from smoke [23]. Nonetheless, several epidemiological studies around the world did not find an association between exposure to particulate matter from forest fires and asthma [24,25,26,27]. Multi-pollutant modeling found that increased concentrations of nitrogen dioxide (NO2) and ozone (O3) drive emergency room visits for asthma in California and not PM2.5 [28]. Smoke is a complex mixture of pollutants that change as the plume ages. Asthma hospital visits’ direct cause is likely due to a synergetic impact from all pollutants. PM2.5 is used in this study because it is an excellent indicator of levels of smoke during a wildfire event [4]. The level of smoke (e.g., extremely high PM2.5 during high-intensity fires versus limiting emissions with prescribed fire) and duration of the event potentially explain some of the differences in findings of association.
Asthma attacks can be triggered by many different irritants in the air and dependent on personal exposure levels. PM2.5 composition primarily depends on the source and the area of emission [29,30,31]. Consequently, it is expected that asthmatics may not react similarly to exposure to PM2.5 from industrial sources [32] and PM2.5 produced by biomass burning [33]. Reducing exposure to outdoor air pollutants by planning activities for when air pollution is low can be an effective precaution to avoid an asthma trigger. Thus, the contribution of increased ambient PM2.5 from forest fire smoke to emergency department visits due to asthma in California is little understood.
The focus of this work is to determine the impacts of all forest fires on PM2.5 concentrations and asthma. In this study, we hypothesize that short-term exposure to PM2.5 from forest fires impacts emergency department visits due to asthma in California, USA. We examined a large and spatially diverse number of locations in California over almost a decade, including the years 2008–2015. Smoke intensities from all fires are used to determine impacts. Included are both large high-intensity events and low-intensity smoke events from smaller wildland fires more typical to the fire-prone ecosystems in California to understand if reducing the intensity of the smoke event has an impact on asthma emergency room visits.

2. Methods

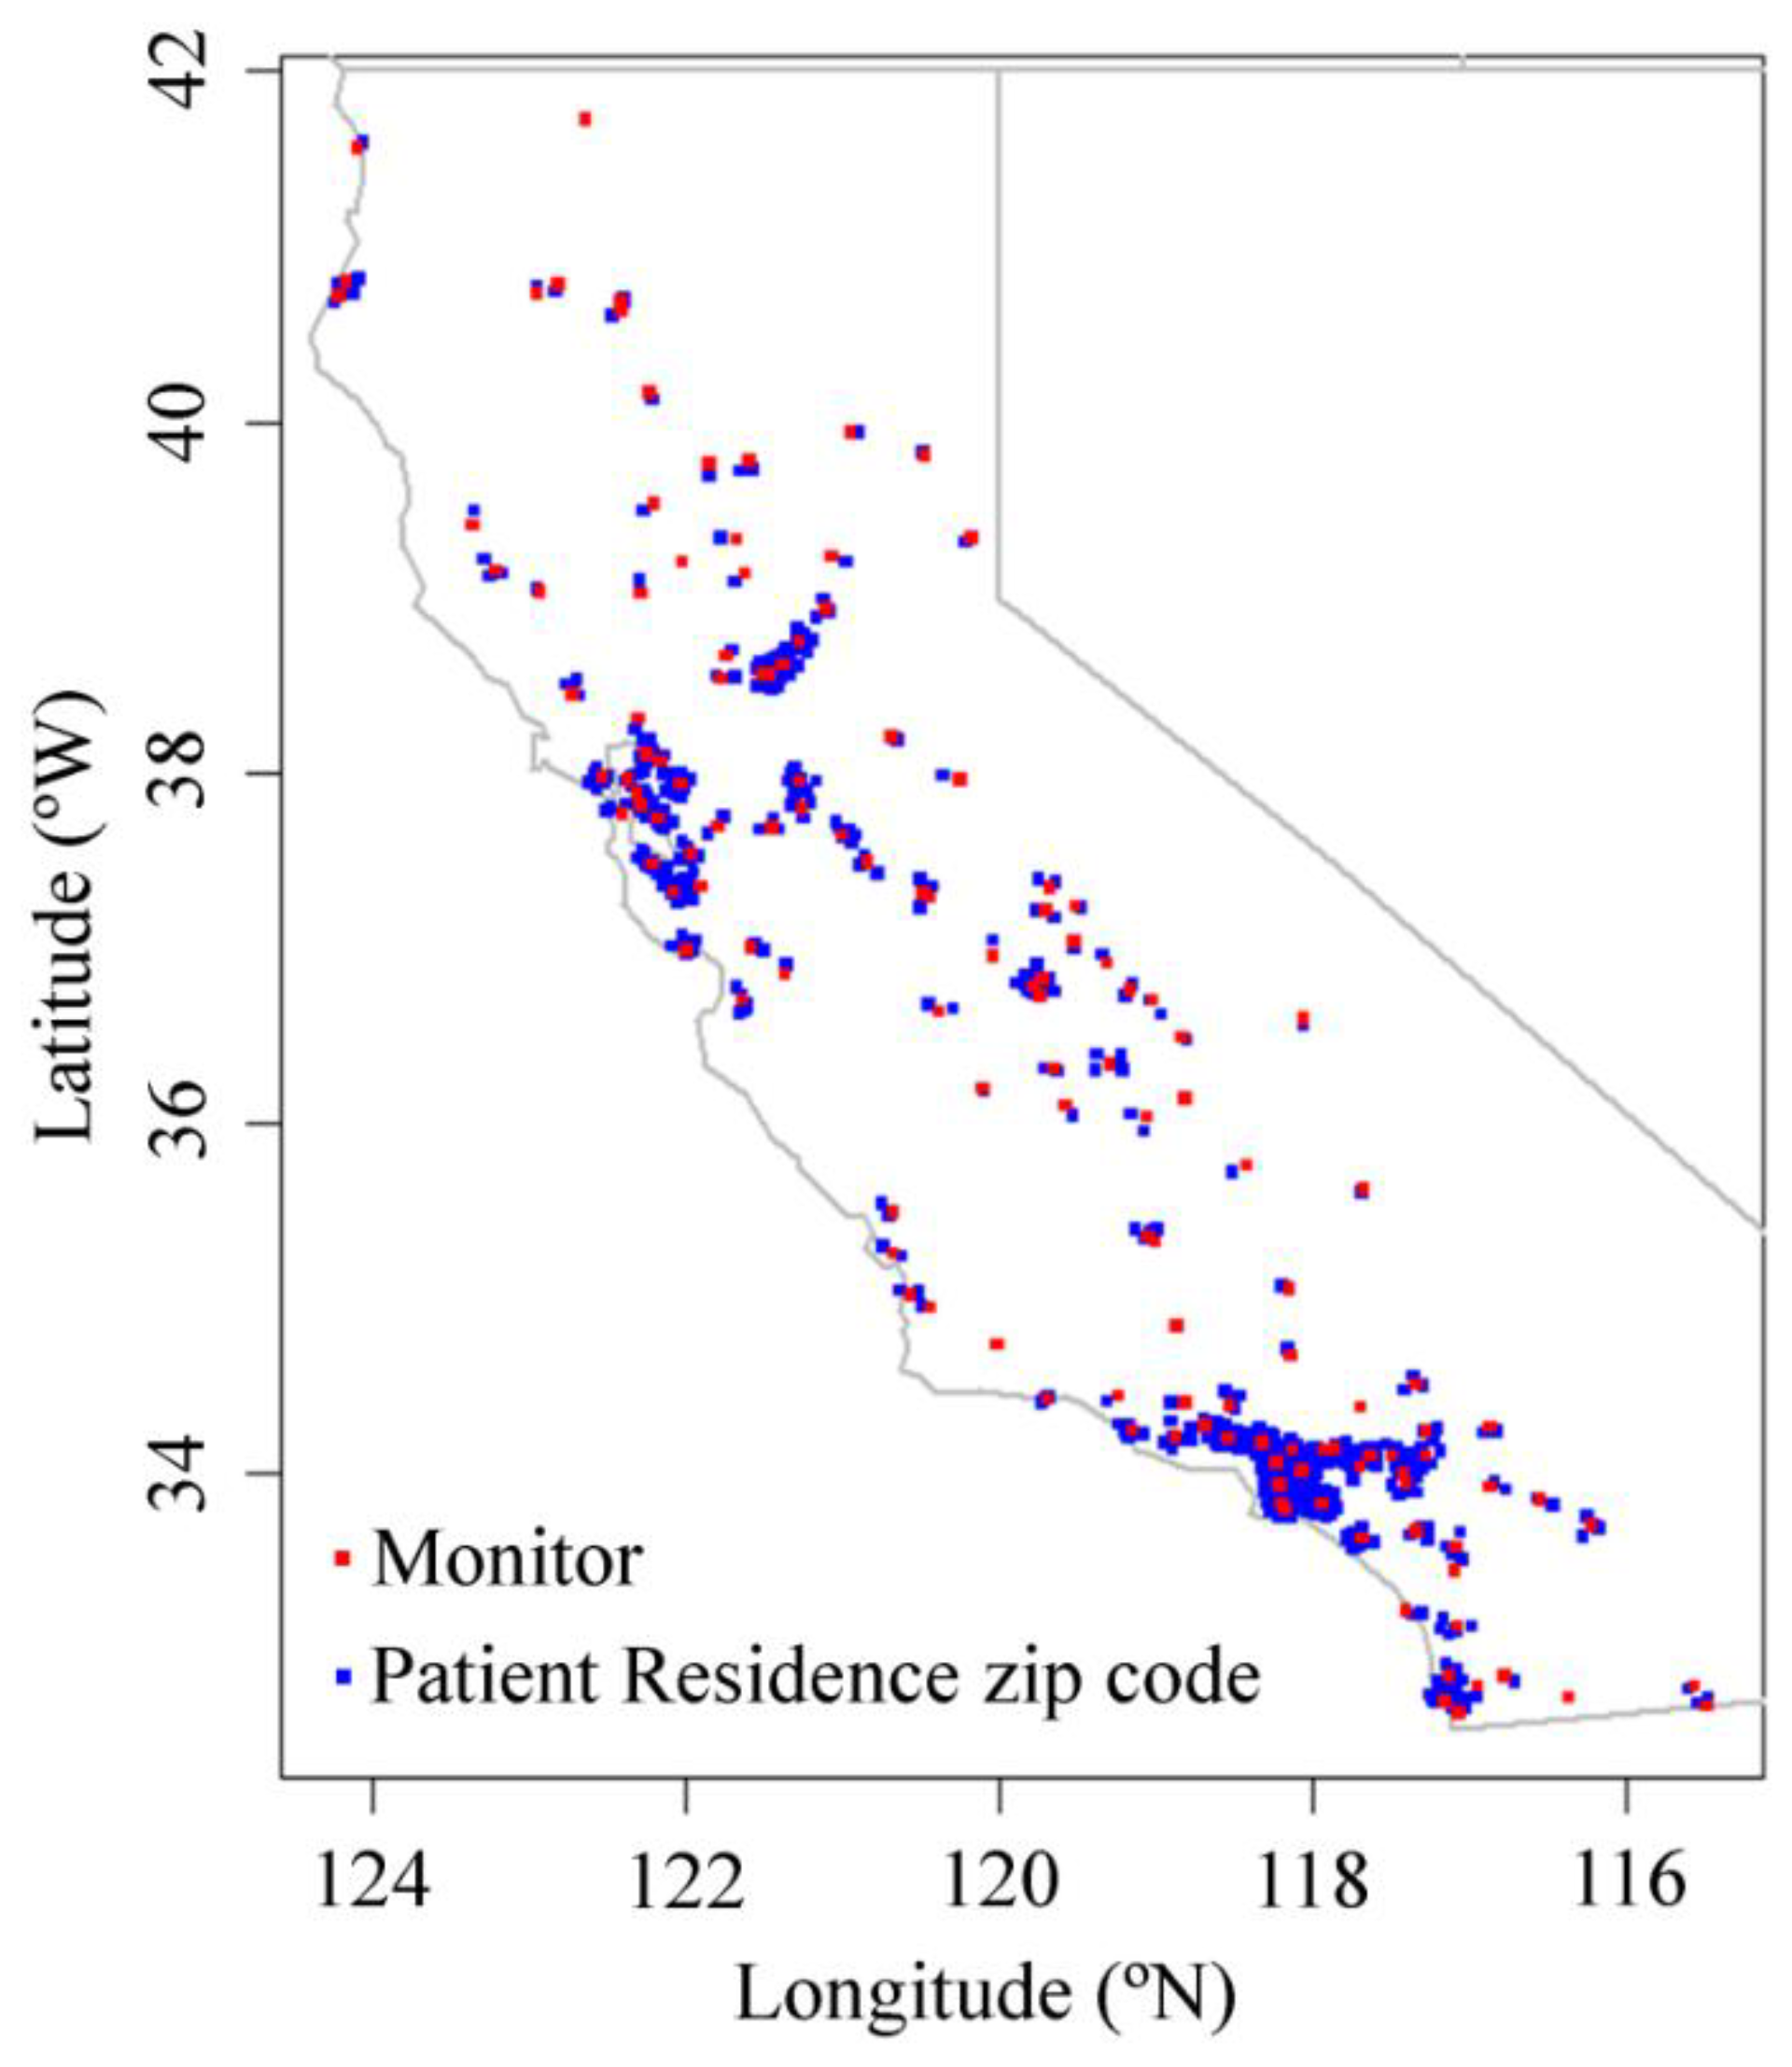
2.1. Data and Participants

Hospital data from California’s Office of Statewide Health Planning and Development (OSHPD) from the years 2008–2015 in California, USA were used. Emergency department visits due to asthma attacks classified by the International Classification of Diseases, 9th Revision (ICD-9) codes were used to select the cases for investigation. The information from individual patient records, including patient’s zip code, gender, birthdate, service date, diagnoses, cause of injury, and treatments/procedures was collected for analysis.

2.2. PM2.5 and Smoke Data

PM2.5 data (Figure 1) are from the U.S. Environmental Protection Agency (U.S. EPA 2017), Interagency Monitoring of Protected Visual Environments (IMPROVE 2017), Tribal Exchange Network (TREX 2017), and U.S. Forest Service. U.S. Forest Service data were collected at permanent monitoring sites using Met One, Inc. (Grants Pass, OR, USA) beta attenuation monitors (BAMs).
Smoke density data is from the National Oceanic and Atmospheric Administration Hazard Mapping System Fire and Smoke Product (NOAA 2018). This product is a daily generated spatial extent estimation of remotely sensed smoke concentration (low, medium, and high density). Smoke is identified from multiple geostationary and polar orbiting satellites with manually generated HMS smoke plumes [34] and has been proven to be a quality predictor of ground-level PM2.5 concentrations [35]. The HMS product is based on visible wavelength and therefore a measure only available during daylight hours. Mapped plumes reflect smoke in the entire atmospheric column and do not necessarily represent the ground level but have been proven to predict it well [35]. We validated ground concentrations and mapped plumes using the approach outlined in Preisler et al. 2015. The presence of smoke plumes (particularly high-density smoke) when combined with PM2.5 in an autoregressive statistical model can be used to reliably identify periods of wildfire smoke impacts with 95% accuracy [35].

2.3. Statistical Models

2.3.1. Odds of Asthma Emergency Room Visit

Studies on PM exposure and hospital admittance typically use case-crossover designs where each emergency room visit event is matched with 3–4 non-event days [28,36,37,38]. In the present study, all days and locations with at least one hospital admittance (event) were included in the data along with a sample of days with no event. We developed a statistical model to estimate the effects of various explanatory variables on the odds of hospital admittances for asthma. The explanatory variables studied were: PM2.5 levels on the day and prior seven days; smoke level from wildland fires on the day and prior seven days; day in year (as a surrogate for weather and other seasonally specific variables); population size in the corresponding zip code; and spatial location (as a surrogate for differences between locations not captured by the other variables in the model). Only variables that were found to have a significant effect on the model were included in the final model. Variables were included and removed using stepwise regression. Because we only have a sample of non-event days, we can only model effects of covariates on the odds of an event relative to the average odds. Therefore, the absolute probability of an event cannot be estimated.
Specifically, we used the following semi-parametric logit model to estimate the relationships between explanatory variables and the log-odds of at least one hospital admission for asthma:
Log{p/(1 − p)} = βo + s(lon,lat) + s(day) + s(population) + s(pm) + smk0 + smk1.7 + dmpx
where p is the probability of at least one asthma patient admitted to hospital on a given day and location; population is the population size in the corresponding zip code; lon and lat are the longitude and latitude of the center of the zip code polygon; day is the day-in-year; pm is the daily mean PM2.5 on the current date and location; smk0 is a categorical variable indicating the level of smoke on the current day; smk1.7 is a categorical variable indicating the number of days with HMS high density of smoke from fires in the past seven days; and dpmx is a categorical variable indicating the number of days in the previous week with a PM2.5 value greater than x µg m−3. The cutoff value x in dpmx will be determined by the data. The function s(lon,lat) is a smooth spline surface, and s(day) is a smooth periodic spline, both to be estimated from the data, together with the rest of the terms in equation [1]. As mentioned above, the intercept in equation [1] is not estimable with the sample design in our study. However, all other terms are estimable and provide a value for the estimated effect of each of the covariates on the odds ratio (OR).
Estimation was done within the open-source R statistical package [39].

2.3.2. Odds of Elevated PM2.5 Values

A logistic regression model was used to estimate the effects of smoke from fire on the odds of PM2.5 exceeding x µg m−3 at a given location and date. We chose three thresholds of exceedance: x = 10, 20, and 35 µg m−3. The National Ambient Air Quality Standard for 24-h PM2.5 in the USA is 35 µg m−3 and can be a pollutant threshold representative of smoke exposure [40]. The estimated odds of PM2.5 exceeding x µg m−3 depend on location and day in year. Higher elevation sites in the Sierra Nevada tend to experience high summer concentrations of PM2.5 with low concentrations in the winter, while lower elevation (typically more urban) locations in the Central Valley tend to experience the opposite, with high winter PM2.5 and relatively lower summer PM2.5, where their summer lows are similar to the summer highs at higher elevation sites [35,41].
Specifically, we fitted the following model:
Log{(p/(1 − p)} = βo + s(lon,lat,day) + smk0
where p is the probability of the PM2.5 value at a given location and date exceeding x µg m−3; smk0 is a categorical variable indicating the level of smoke on the given day; and s(lon,lat,day) is a three-dimensional spline function used as a surrogate to account for differences in seasonal patterns at various locations in California. For example, areas near Fresno California tend to have higher PM2.5 values in the winter months, which lead to higher probabilities of exceeding x µg m−3 even on days with no fire or detectable smoke above. Similar to the model in [1], estimation for model [2] was done within the open-source R statistical package [39].

3. Results

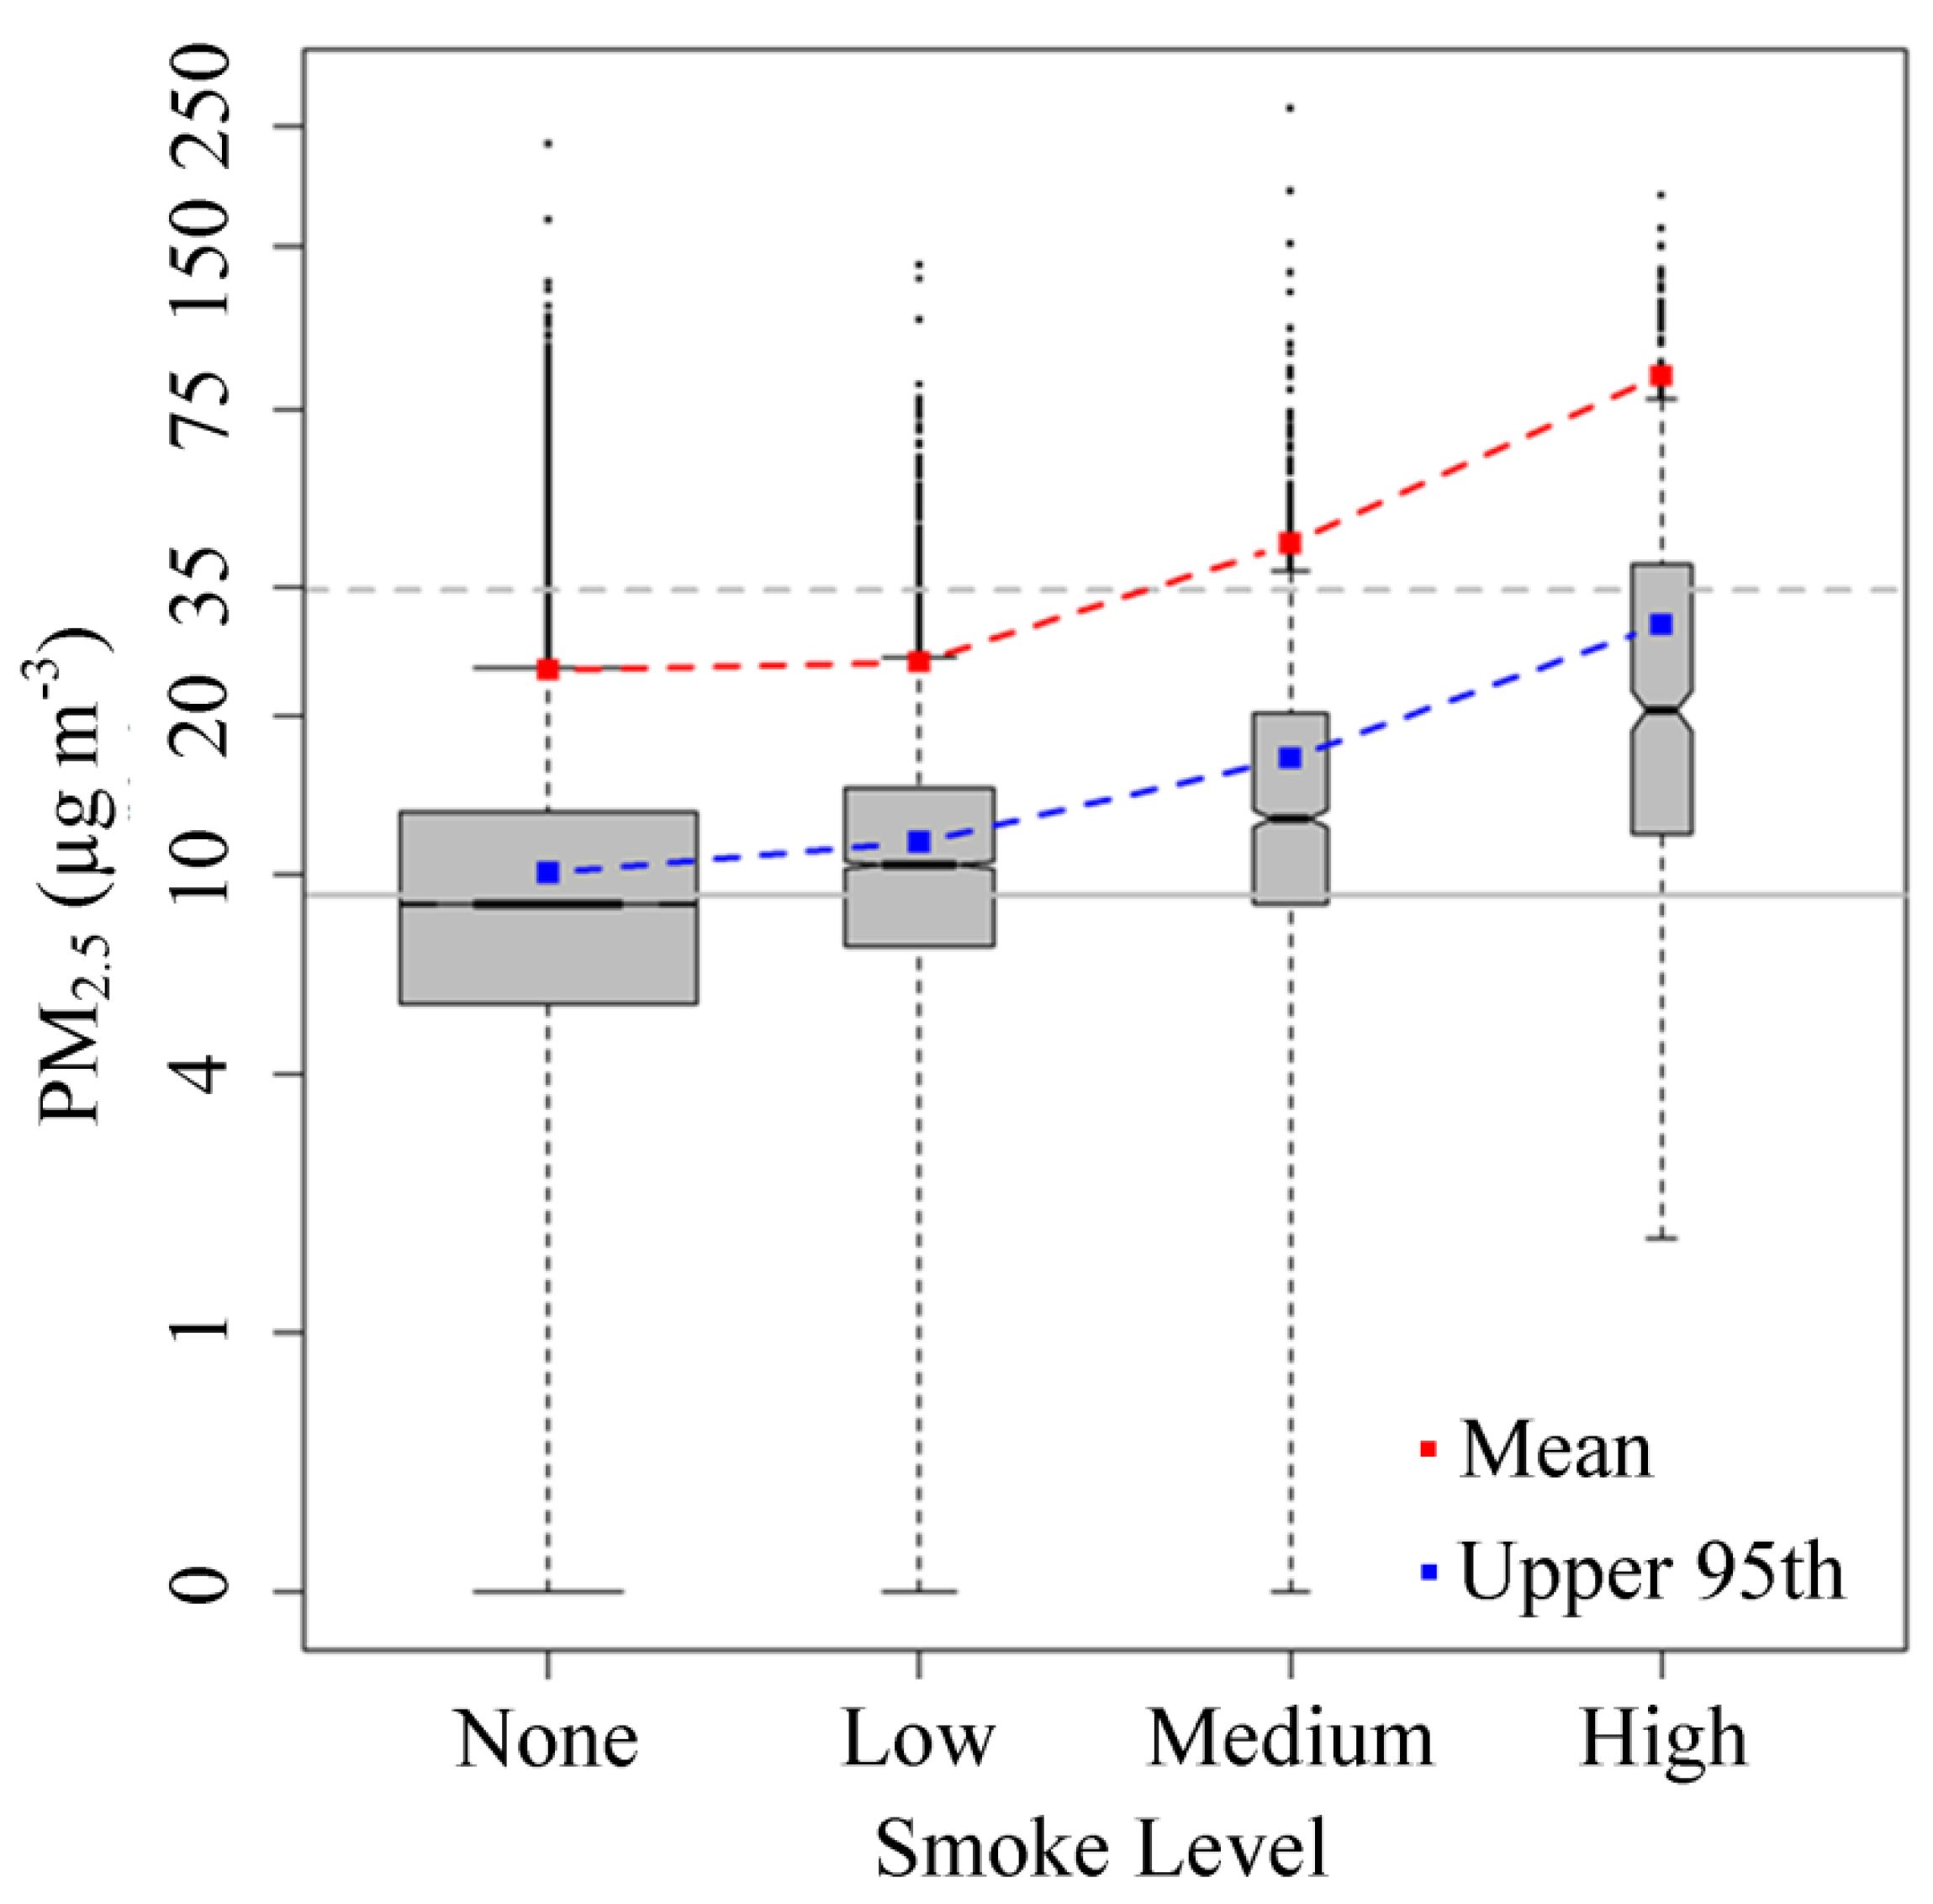
3.1. Effect of Smoke from Fires on Daily PM2.5 Levels

Overall, in the presence of smoke from fires in the atmospheric column in the HMS data, daily PM2.5 values are higher, with the average PM2.5 on days with a high level of smoke being ~20 µg m−3 higher than corresponding days with no smoke above (Figure 2). The significant increase in PM2.5 with increasing density of HMS smoke data is consistent with other analysis [35]. Results from the logistic model (Equation (2)) indicate that the odds of PM2.5 exceeding a cutoff point x µg m−3 increase significantly with increasing HMS smoke level (Table 1). The latter is after controlling for the confounding effects of seasonal and location patterns included in Equation (2). For example, the odds of exceeding 35 µg m−3 on days with high smoke above are 35 times greater (95% CL 21–58) than the odds for days with no smoke. This number is even higher (114 with 95% CL 87–150) if the year 2008 is included in the model (Table 1). In California, 2008 was an active fire year where smoke was present across most of the state, particularly in late June and early July. Smoke was well mixed and present at ground level across most of the state and particularly impacted the Central Valley. These results are similar to what Preisler et al. (2015) found: HMS is an effective tool for attributing ground-level PM2.5 concentrations above the expected at a given site from wildland fire smoke when combined with ground data.
Fire appears to have an impact on PM2.5 values, significantly increasing both the mean value and the chances of exceeding 10, 20, and 35 µg m−3 when smoke reaches the location.

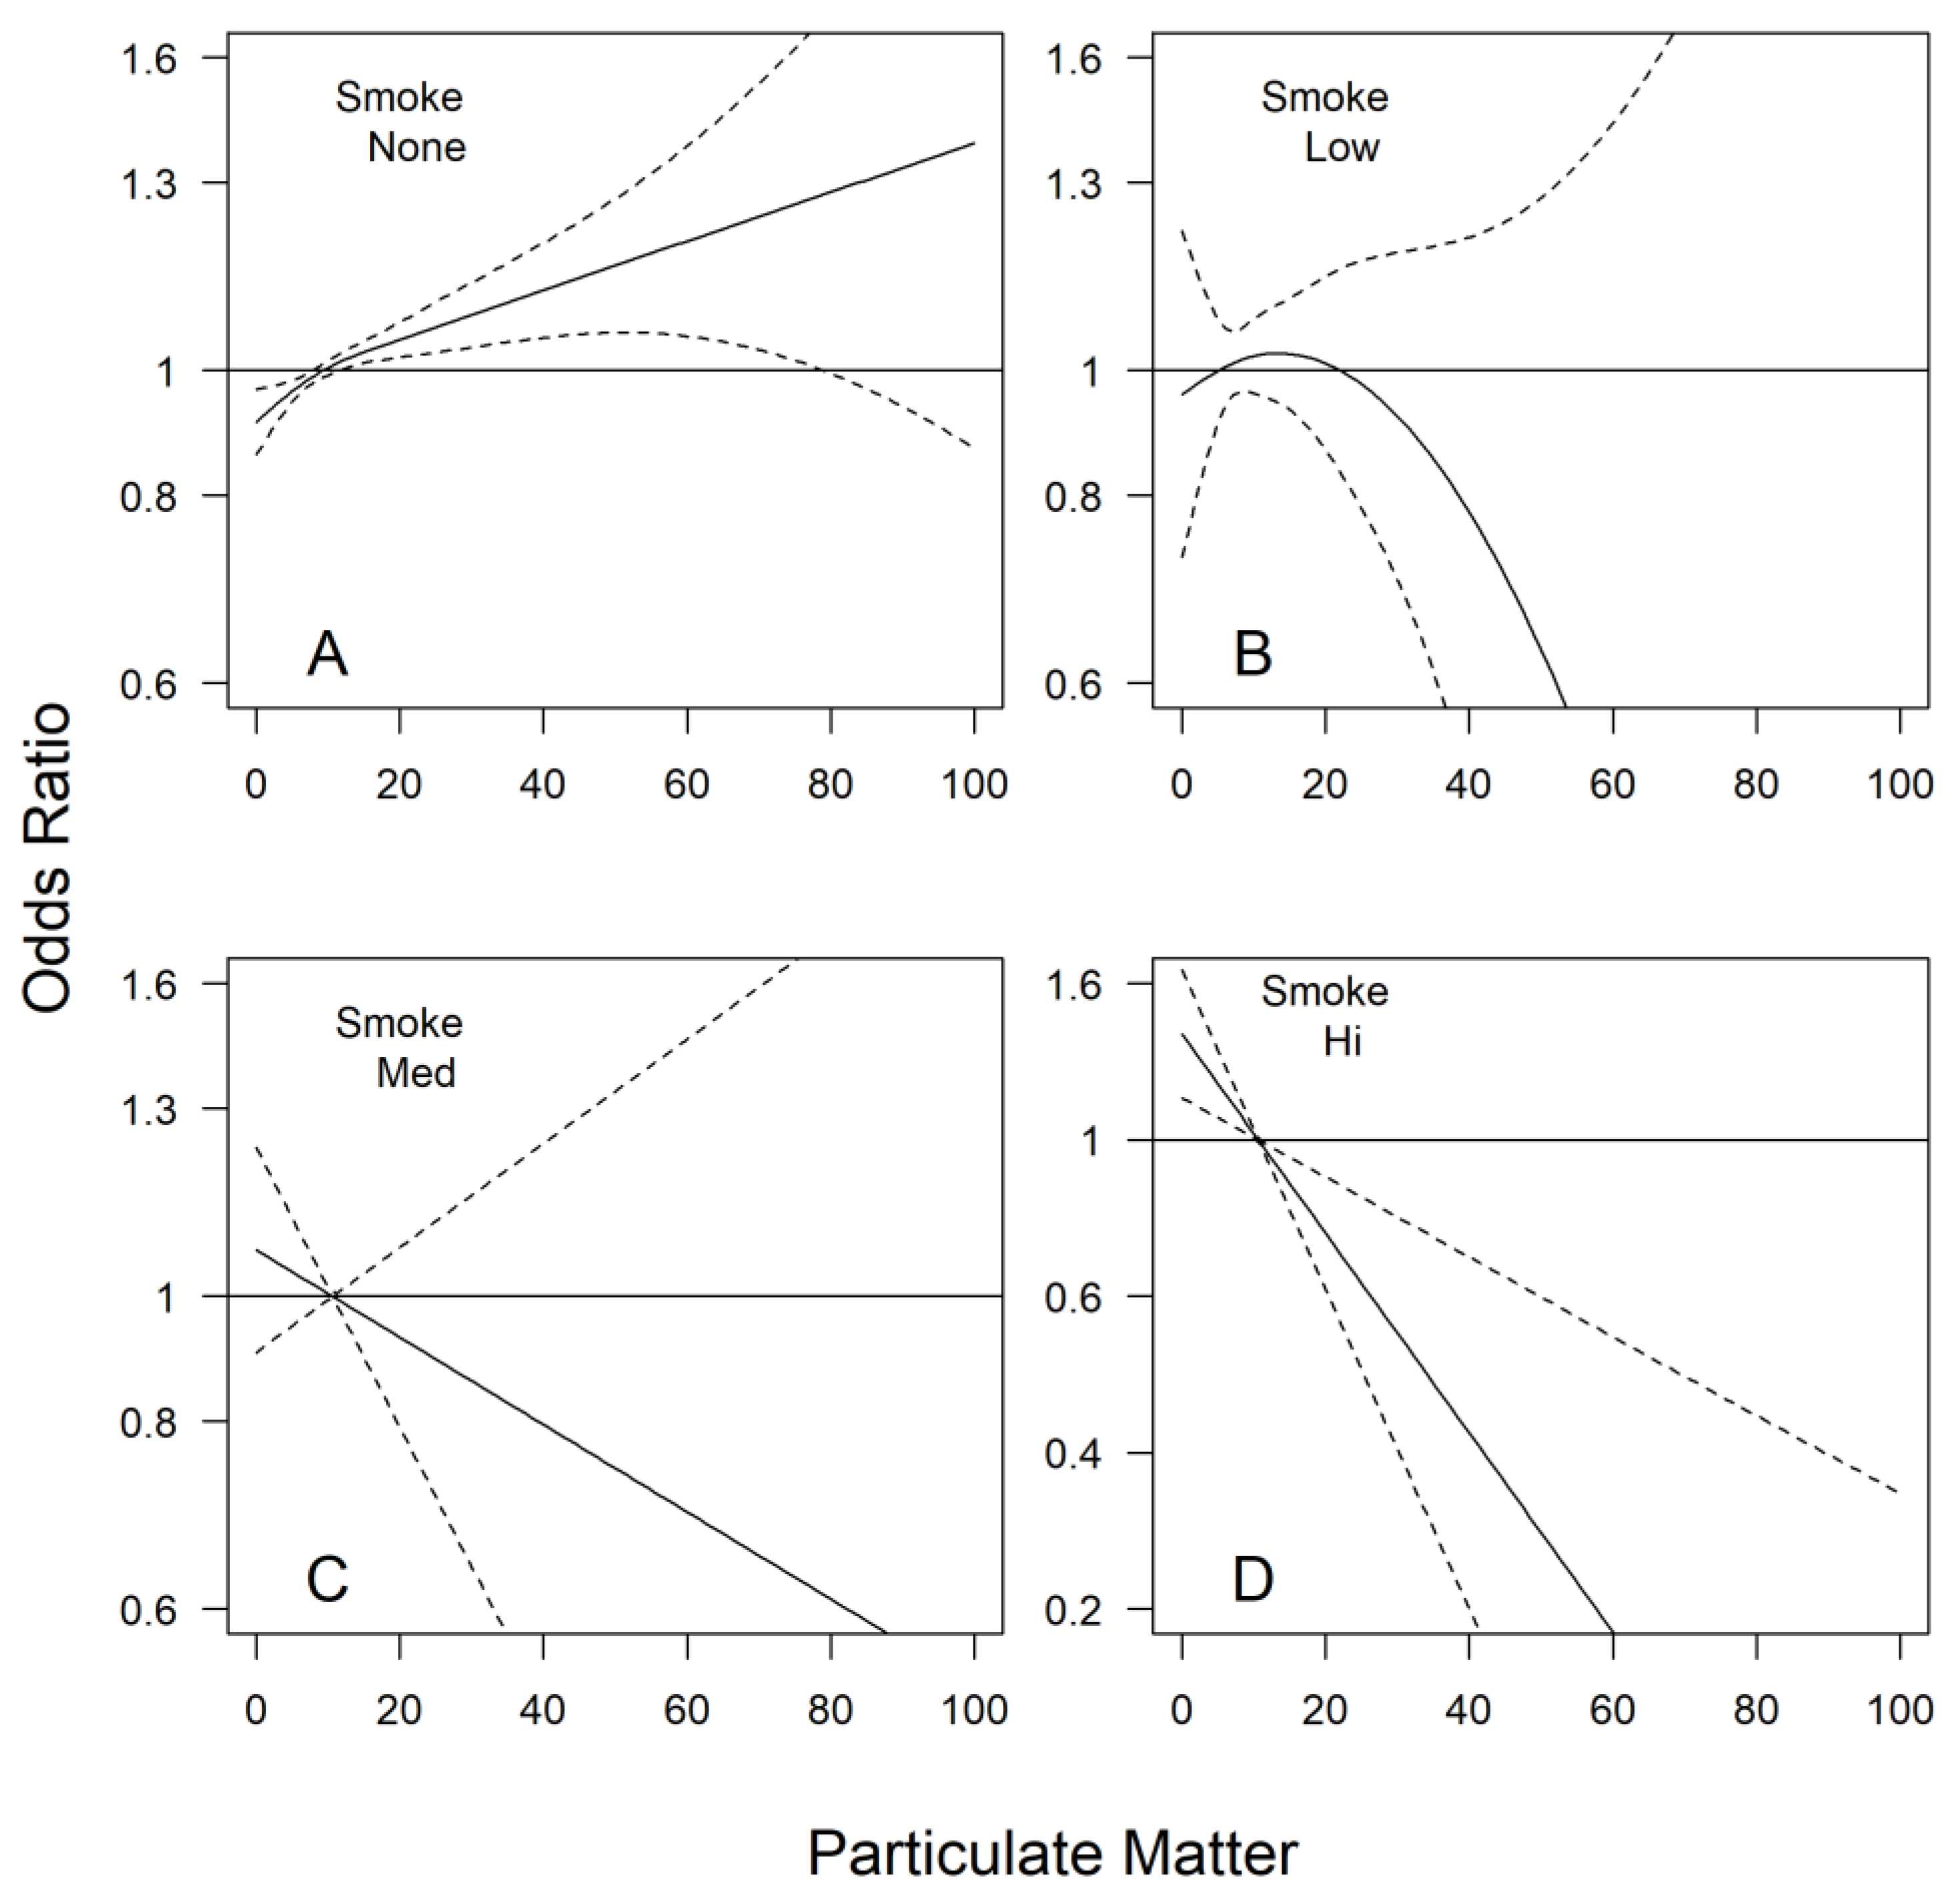
3.2. Effect of PM2.5 on Asthma Emergency Room Visit Cases

After controlling for all confounding factors in Equation (1), there were significant increases in the odds of emergency room visits with increasing values of PM2.5 (Figure 3A), but only when there were no high levels of smoke detected by satellites.
On days with no smoke (Figure 3A), we noted a significant increase in the odds of an emergency room visit with increasing PM2.5, but only up to about ~80 µg m−3. The increase for values above ~80 µg m−3 was not significant, possibly due to the small number of cases in this range. The odds of an event were 1.3 (1.1–1.4) times larger when PM2.5 = 60 µg m−3 compared to the odds when PM2.5 = 10 µg m−3. There seem to be no significant changes (increase or decrease) in the odds of an event for days with a low or medium level of smoke relative to the odds for no-smoke days (curves in Figure 3B,C) are not significant). High levels of ambient smoke do not increase the odds of emergency room visits (Figure 3D). The lack of association is possibly due to a reduction of personal exposure and/or changes in exposure levels to other pollutants (i.e., NO2 and O3) more responsible for asthma visits to the emergency room [28,37].
Other factors affecting the odds of an event were the number of days with PM2.5 exceeding 35 µg m−3 (Table 2) and the number of days with high level of smoke (Table 3) in the previous six days. We also tried other cutoff points for exceedance (e.g., 10 or 20 µg m−3), arriving at similar results. However, the variable with the 35 µg m3 cutoff point had the highest explanatory power.
In conclusion: Days with high levels of smoke from fires significantly increase PM2.5 ground level concentrations, and hence, the chances of fine particulate matter exceeding 10, 20, or 35 µg m−3. Additionally, there is an increase in emergency room visits with increasing PM2.5 on the day of admittance or the previous six days.

4. Discussion

Previous studies [17,42,43] have connected increased concentrations of ground-level PM2.5 with significant increases in the odds of an asthma emergency room visit. Our results agree with this increase in general, but interestingly, it is not as effective with increases in PM2.5 from wildland fire smoke. Extreme levels of smoke and the subsequent high PM2.5 concentrations cause an increase in emergency room visits for asthma, particularly when smoke is present for many days [21]. Smoke from wildfire, in contrast from residential wood burning, typically occurs during the hot season, and additionally, high temperatures can correlate with increased fire activity and their subsequent emissions. Additionally, there is an apparent absence of causal relation between PM2.5 concentrations and increased acute human mortality associated with, but not necessarily caused by, PM2.5 exposure, while being causally associated with temperature [44,45].
Our finding of a lack of significant effect on asthma patients during wildland fire smoke events, especially with lag0, is consistent with other studies [43,46,47]. The findings on lack of association of fire smoke with asthma were found to vary with location. Further investigation of this issue in California is warranted. Our focus on elevated PM2.5 associated with smoke from wildland fire attempted to reduce confounders and limit the error with using remote-sensing data alone to represent ground-level concentration [35] and subsequent population exposure to PM2.5. Understanding the impacts to human health during smoke seasons of varying intensities is paramount to providing accurate advice to people living in a smoke-prone area and potential ways to mitigate some of the health impacts of smoke through changing the timing and intensity of emissions.
Fire information has been effective in promoting public understanding of air quality impacts and smoke avoidance [48]. It is also easy to see and smell wildland fire smoke, and with timely communication, this allows people to reduce their personal exposure through avoidance, air filtration, and other mitigations. News releases, while not effective for evaluating smoke effects, are useful for informing the public of potential smoke periods [49]. In California, air regulators and fire managers have become increasingly effective at messaging and providing the public early warning of smoke potential, likely helping people reduce their exposure, particularly if they are sensitive (e.g., asthmatics). Indeed, public health forecast-based interventions at lower levels can have the greatest benefits and risk reductions [50]. The combination of early warning and easy personal detection may explain the reduction in asthma emergency room visits during smoke events, where asthmatics are forewarned of potential exposure and protect themselves from exposure. Additional reduction of exposure is possibly gained through the easy availability of room and home filters and widespread outreach in how to create a home clean room during wildland fire smoke events.
Asthmatics are affected by specific chemical elements and emissions sources of PM2.5 [51], and wildland fire smoke may not have the same impacts as anthropogenic sources (e.g., traffic, industrial, agriculture, etc.). Further study is needed to understand causal reasons for reduced OR of having an emergency room visit during periods of high smoke levels for asthmatics. Technological improvements (e.g., in home air purification, mask design, etc.) combined with robust and effective outreach and information sharing from fire and air managers may be effectively reducing the current impacts from smoke on human health.

5. Conclusions

Smoke reaching a site increases the average PM2.5 level at that site and increases the chance of PM2.5 concentrations exceeding 35 µg m−3. There is a significant increase in asthma patients at hospitals when there are multiple days with PM2.5 values > 35 µg m−3. However, when fires cause high levels of smoke to reach a given site, the association is not observed. On average, fewer people will go to the hospital during a forest fire smoke event, possibly due to avoiding exposure (e.g., leaving the area, staying indoors, indoor air filtration systems (clean room), wearing a mask, etc.) or some other way of reducing their personal exposure. Further research is needed to confirm.
Consequently, because of the above confounding effect, asthma emergency room visit data may not be a good way to study the effects of smoke from fires on people’s health. Alternatively, if people are staying indoors and taking precautions so as not to get exposed to smoke from fires, perhaps this means that outreach, forecasting, and easy smoke detection by the individual (smell and visibility) are allowing people (particularly sensitive groups) to actively reduce their personal exposure and mitigating smoke impacts. Personal awareness and subsequent preventive actions are potentially providing a model for people living in a smoke-prone environment to protect themselves by limiting wildland fires’ potential to negatively affect their health, not because PM2.5 from fires does not affect health, but rather because the exposure of people to smoke from fires is minimized by their actions.

Author Contributions

Conceptualization, R.C.; Methodology, H.P.; Software, H.G.; Formal analysis, H.P., M.E. and H.G.; Resources, R.C.; Writing—original draft, D.S.; Writing—review & editing, R.C.; Supervision, R.C. All authors have read and agreed to the published version of the manuscript.

Funding

This research received no external funding.

Data Availability Statement

Hospital data from California’s Office of Statewide Health Planning and Development (OSHPD). Air Quality data can be obtained from the U.S. Environmental Protection Agency, Interagency Monitoring of Protected Visual Environments (IMPROVE 2017), Tribal Exchange Network, and U.S. Forest Service. Smoke density data is from the National Oceanic and Atmospheric Administration Hazard Mapping System Fire and Smoke Product.

Conflicts of Interest

The authors declare no conflict of interest.

References

  1. Calkin, D.E.; Gebert, K.M.; Jones, J.G.; Neilson, R.P. Forest Service Large Fire Area Burned and Suppression Expenditure Trends, 1970–2002. J. For. 2005, 103, 179–183. [Google Scholar] [CrossRef]
  2. Duclos, P.; Sanderson, L.M.; Lipsett, M. The 1987 Forest Fire Disaster in California: Assessment of Emergency Room Visits. Arch. Environ. Health Int. J. 1990, 45, 53–58. [Google Scholar] [CrossRef] [PubMed]
  3. Miller, J.D.; Safford, H. Trends in Wildfire Severity: 1984 to 2010 in the Sierra Nevada, Modoc Plateau, and Southern Cascades, California, USA. Fire Ecol. 2012, 8, 41–57. [Google Scholar] [CrossRef]
  4. Navarro, K.M.; Cisneros, R.; O’Neill, S.M.; Schweizer, D.; Larkin, N.K.; Balmes, J.R. Air-Quality Impacts and Intake Fraction of PM 2.5 during the 2013 Rim Megafire. Environ. Sci. Technol. 2016, 50, 11965–11973. [Google Scholar] [CrossRef] [PubMed]
  5. Westerling, A.L.; Hidalgo, H.G.; Cayan, D.R.; Swetnam, T.W. Warming and earlier spring increase western U.S. forest wildfire activity. Science 2006, 313, 940–943. [Google Scholar] [CrossRef]
  6. Flannigan, M.; Stocks, B.; Wotton, B. Climate change and forest fires. Sci. Total Environ. 2000, 262, 221–229. [Google Scholar] [CrossRef] [PubMed]
  7. Heyerdahl, E.K.; Brubaker, L.B.; Agee, J.K. Annual and decadal climate forcing of historical fire regimes in the interior Pacific Northwest, USA. Holocene 2002, 12, 597–604. [Google Scholar] [CrossRef]
  8. Liu, Y.; Goodrick, S.L.; Stanturf, J.A. Future U.S. wildfire potential trends projected using a dynamically downscaled climate change scenario. For. Ecol. Manag. 2013, 294, 120–135. [Google Scholar] [CrossRef]
  9. Stockdale, C.A.; McLoughlin, N.; Flannigan, M.; Macdonald, S.E. Could restoration of a landscape to a pre-European historical vegetation condition reduce burn probability? Ecosphere 2019, 10, e02584. [Google Scholar] [CrossRef]
  10. Schweizer, D.; Cisneros, R. Wildland fire management and air quality in the southern Sierra Nevada: Using the Lion Fire as a case study with a multi-year perspective on PM2.5 impacts and fire policy. J. Environ. Manag. 2014, 144, 265–278. [Google Scholar] [CrossRef] [PubMed]
  11. Schweizer, D.; Preisler, H.K.; Cisneros, R. Assessing relative differences in smoke exposure from prescribed, managed, and full suppression wildland fire. Air Qual. Atmos. Health 2019, 12, 87–95. [Google Scholar] [CrossRef]
  12. Graw, R.L.; Anderson, B.A. Strategies to reduce wildfire smoke in frequently impacted communities in south-western Oregon. Int. J. Wildl. Fire 2022, 31, 1155–1166. [Google Scholar] [CrossRef]
  13. Dale, V.H.; Joyce, L.A.; McNulty, S.; Neilson, R.P.; Ayres, M.P.; Flannigan, M.D.; Hanson, P.J.; Irland, L.C.; Lugo, A.E.; Peterson, C.J.; et al. Climate change and forest disturbances. Bioscience 2001, 51, 723–734. [Google Scholar] [CrossRef]
  14. Kampa, M.; Castanas, E. Human health effects of air pollution. Environ. Pollut. 2008, 151, 362–367. [Google Scholar] [CrossRef] [PubMed]
  15. Pénard-Morand, C.; Annesi-Maesano, I. Air pollution: From sources of emissions to health effects. Breathe 2004, 1, 108–119. [Google Scholar] [CrossRef]
  16. Perez-Padilla, R.; Schilmann, A.; Riojas-Rodriguez, H. Respiratory health effects of indoor air pollution. Int. J. Tuberc. Lung Dis. 2010, 14, 1079–1086. [Google Scholar]
  17. Fan, J.; Li, S.; Fan, C.; Bai, Z.; Yang, K. The impact of PM2.5 on asthma emergency department visits: A systematic review and meta-analysis. Environ. Sci. Pollut. Res. 2016, 23, 843–850. [Google Scholar] [CrossRef] [PubMed]
  18. Kim, Y.-K.; Kim, S.-H.; Tak, Y.-J.; Jee, Y.-K.; Lee, B.-J.; Kim, S.-H.; Park, H.-W.; Jung, J.-W.; Bahn, J.-W.; Chang, Y.-S.; et al. High prevalence of current asthma and active smoking effect among the elderly. Clin. Exp. Allergy 2002, 32, 1706–1712. [Google Scholar] [CrossRef] [PubMed]
  19. Silverman, R.A.; Ito, K. Age-related association of fine particles and ozone with severe acute asthma in New York City. J. Allergy Clin. Immunol. 2010, 125, 367–373.e5. [Google Scholar] [CrossRef]
  20. Liu, J.C.; Pereira, G.; Uhl, S.A.; Bravo, M.A.; Bell, M.L. A systematic review of the physical health impacts from non-occupational exposure to wildfire smoke. Environ. Res. 2015, 136, 120–132. [Google Scholar] [CrossRef]
  21. Kiser, D.; Metcalf, W.J.; Elhanan, G.; Schnieder, B.; Schlauch, K.; Joros, A.; Petersen, C.; Grzymski, J. Particulate matter and emergency visits for asthma: A time-series study of their association in the presence and absence of wildfire smoke in Reno, Nevada, 2013–2018. Environ. Health 2020, 19, 92. [Google Scholar] [CrossRef] [PubMed]
  22. Gan, R.W.; Liu, J.; Ford, B.; O’Dell, K.; Vaidyanathan, A.; Wilson, A.; Volckens, J.; Pfister, G.; Fischer, E.V.; Pierce, J.R.; et al. The association between wildfire smoke exposure and asthma-specific medical care utilization in Oregon during the 2013 wildfire season. J. Expo. Sci. Environ. Epidemiol. 2020, 30, 618–628. [Google Scholar] [CrossRef]
  23. Liu, J.C.; Wilson, A.; Mickley, L.J.; Dominici, F.; Ebisu, K.; Wang, Y.; Sulprizio, M.P.; Peng, R.D.; Yue, X.; Son, J.-Y.; et al. Wildfire-specific Fine Particulate Matter and Risk of Hospital Admissions in Urban and Rural Counties. Epidemiology 2017, 28, 77–85. [Google Scholar] [CrossRef] [PubMed]
  24. Jacobson, L.d.S.V.; Hacon, S.d.S.; de Castro, H.A.; Ignotti, E.; Artaxo, P.; Ponce de Leon, A.C.M. Association between fine particulate matter and the peak expiratory flow of schoolchildren in the Brazilian subequatorial Amazon: A panel study. Environ. Res. 2012, 117, 27–35. [Google Scholar] [CrossRef] [PubMed]
  25. Jalaludin, B.; Smith, M.; O’Toole, B.; Leeder, S. Acute effects of bushfires on peak expiratory flow rates in children with wheeze: A time series analysis. Aust. N. Z. J. Public Health 2000, 24, 174–177. [Google Scholar] [CrossRef]
  26. Vora, C.; Renvall, M.J.; Chao, P.; Ferguson, P.; Ramsdell, J.W. 2007 San Diego Wildfires and Asthmatics. J. Asthma 2011, 48, 75–78. [Google Scholar] [CrossRef] [PubMed]
  27. Wiwatanadate, P.; Liwsrisakun, C. Acute effects of air pollution on peak expiratory flow rates and symptoms among asthmatic patients in Chiang Mai, Thailand. Int. J. Hyg. Environ. Health 2011, 214, 251–257. [Google Scholar] [CrossRef]
  28. Tavallali, P.; Gharibi, H.; Singhal, M.; Schweizer, D.; Cisneros, R. A multi-pollutant model: A method suitable for studying complex relationships in environmental epidemiology. Air Qual. Atmos. Health 2020, 13, 645–657. [Google Scholar] [CrossRef]
  29. Harrison, R.M.; Jones, A.M.; Lawrence, R.G. Major component composition of PM10 and PM2.5 from roadside and urban background sites. Atmos. Environ. 2004, 38, 4531–4538. [Google Scholar] [CrossRef]
  30. Tsapakis, M.; Lagoudaki, E.; Stephanou, E.G.; Kavouras, I.G.; Koutrakis, P.; Oyola, P.; von Baer, D. The composition and sources of PM2.5 organic aerosol in two urban areas of Chile. Atmos. Environ. 2002, 36, 3851–3863. [Google Scholar] [CrossRef]
  31. Watson, J.G.; Chow, J.C.; Houck, J.E. PM2.5 chemical source profiles for vehicle exhaust, vegetative burning, geological material, and coal burning in Northwestern Colorado during 1995. Chemosphere 2001, 43, 1141–1151. [Google Scholar] [CrossRef]
  32. Jung, C.; Young, L.; Hsu, H.; Lin, M.; Chen, Y.; Hwang, B.; Tsai, P. PM2.5 components and outpatient visits for asthma: A time-stratified case-crossover study in a suburban area. Environ. Pollut. 2017, 231, 1085–1092. [Google Scholar] [CrossRef] [PubMed]
  33. Chuang, H.-C.; Sun, J.; Ni, H.; Tian, J.; Lui, K.H.; Han, Y.; Cao, J.; Huang, R.-J.; Shen, Z.; Ho, K.-F. Characterization of the chemical components and bioreactivity of fine particulate matter produced during crop-residue burning in China. Environ. Pollut. 2019, 245, 226–234. [Google Scholar] [CrossRef]
  34. Ruminski, M.; Simko, J.; Kibler, J.; Kondragunta, S.; Draxler, R.; Davidson, P.; Li, P. Use of multiple satellite sensors in NOAA’s operational near real-time fire and smoke detection and characterization program. Proc. SPIE 2008, 7089, 76–86. [Google Scholar] [CrossRef]
  35. Preisler, H.; Schweizer, D.; Cisneros, R.; Procter, T.; Ruminski, M.; Tarnay, L. A statistical model for determining impact of wildland fires on Particulate Matter (PM 2.5) in Central California aided by satellite imagery of smoke. Environ. Pollut. 2015, 205, 340–349. [Google Scholar] [CrossRef] [PubMed]
  36. Gharibi, H.; Entwistle, M.R.; Ha, S.; Gonzalez, M.; Brown, P.; Schweizer, D.; Cisneros, R. Ozone pollution and asthma emergency department visits in the Central Valley, California, USA, during June to September of 2015: A time-stratified case-crossover analysis. J. Asthma 2019, 56, 1037–1048. [Google Scholar] [CrossRef]
  37. Entwistle, M.R.; Gharibi, H.; Tavallali, P.; Cisneros, R.; Schweizer, D.; Brown, P.; Ha, S. Ozone pollution and asthma emergency department visits in Fresno, CA, USA, during the warm season (June–September) of the years 2005 to 2015: A time-stratified case-crossover analysis. Air Qual. Atmos. Health 2019, 12, 661–672. [Google Scholar] [CrossRef]
  38. Stowell, J.D.; Geng, G.; Saikawa, E.; Chang, H.H.; Fu, J.; Yang, C.-E.; Zhu, Q.; Liu, Y.; Strickland, M.J. Associations of wildfire smoke PM2.5 exposure with cardiorespiratory events in Colorado 2011–2014. Environ. Int. 2019, 133, 105151. [Google Scholar] [CrossRef] [PubMed]
  39. R Core Team. R: A Language and Environment for Statistical Computing; R Foundation for Statistical Computing: Vienna, Austria, 2019. [Google Scholar]
  40. Schweizer, D.; Cisneros, R.; Traina, S.; Ghezzehei, T.A.; Shaw, G. Using National Ambient Air Quality Standards for fine particulate matter to assess regional wildland fire smoke and air quality management. J. Environ. Manag. 2017, 201, 345–356. [Google Scholar] [CrossRef]
  41. Cisneros, R.; Schweizer, D.; Preisler, H.; Bennett, D.H.; Shaw, G.; Bytnerowicz, A. Spatial and seasonal patterns of particulate matter less than 2.5 microns in the Sierra Nevada Mountains, California. Atmos. Pollut. Res. 2014, 5, 581–590. [Google Scholar] [CrossRef]
  42. Pope, C.A.; Dockery, D.W. Health Effects of Fine Particulate Air Pollution: Lines that Connect. J. Air Waste Manag. Assoc. 2006, 56, 709–742. [Google Scholar] [CrossRef]
  43. Wettstein, Z.S.; Hoshiko, S.; Fahimi, J.; Harrison, R.J.; Cascio, W.E.; Rappold, A.G. Cardiovascular and Cerebrovascular Emergency Department Visits Associated With Wildfire Smoke Exposure in California in 2015. J. Am. Heart Assoc. 2018, 7, e007492. [Google Scholar] [CrossRef]
  44. Cox, T.; Popken, D.; Ricci, P.F. Temperature, not Fine Particulate Matter (PM2.5), is Causally Associated with Short-Term Acute Daily Mortality Rates: Results from One Hundred United States Cities. Dose-Response 2013, 11, 319–343. [Google Scholar] [CrossRef]
  45. Roberts, S. Interactions between particulate air pollution and temperature in air pollution mortality time series studies. Environ. Res. 2004, 96, 328–337. [Google Scholar] [CrossRef] [PubMed]
  46. Cisneros, R.; Schweizer, D.; Gharibi, H.; Tavallali, P.; Veloz, D.; Navarro, K. Air Quality Impacts during the 2015 Rough Fire in Areas Surrounding the Sierra Nevada, California. Fire 2021, 4, 31. [Google Scholar] [CrossRef]
  47. Borchers Arriagada, N.; Horsley, J.A.; Palmer, A.J.; Morgan, G.G.; Tham, R.; Johnston, F.H. Association between fire smoke fine particulate matter and asthma-related outcomes: Systematic review and meta-analysis. Environ. Res. 2019, 179, 108777. [Google Scholar] [CrossRef]
  48. Cisneros, R.; Brown, P.; Cameron, L.; Gaab, E.; Gonzalez, M.; Ramondt, S.; Veloz, D.; Song, A.; Schweizer, D. Understanding Public Views about Air Quality and Air Pollution Sources in the San Joaquin Valley, California. J. Environ. Public Health 2017, 2017, 4535142. [Google Scholar] [CrossRef]
  49. Cisneros, R.; Alcala, E.; Schweizer, D.; Burke, N. Smoke complaints caused by wildland fire in the southern Sierra Nevada region, California. Int. J. Wildl. Fire 2018, 27, 677. [Google Scholar] [CrossRef]
  50. Rappold, A.G.; Fann, N.L.; Crooks, J.; Huang, J.; Cascio, W.E.; Devlin, R.B.; Diaz-Sanchez, D. Forecast-Based Interventions Can Reduce the Health and Economic Burden of Wildfires. Environ. Sci. Technol. 2014, 48, 10571–10579. [Google Scholar] [CrossRef]
  51. Ng, C.F.S.; Hashizume, M.; Obase, Y.; Doi, M.; Tamura, K.; Tomari, S.; Kawano, T.; Fukushima, C.; Matsuse, H.; Chung, Y.; et al. Associations of chemical composition and sources of PM2.5 with lung function of severe asthmatic adults in a low air pollution environment of urban Nagasaki, Japan. Environ. Pollut. 2019, 252, 599–606. [Google Scholar] [CrossRef] [PubMed]
Figure 1. Fine particulate (PM2.5) monitor and patient resident zip code locations for California, USA.
Fire 06 00159 g001
Figure 2. Boxplots showing the distribution of fine particulate matter (PM2.5) on days with no smoke from fires relative to days with low, medium, or high levels of smoke.
Fire 06 00159 g002
Figure 3. Estimated odds ratio of an emergency room visit, as a function of increasing fine particulate matter (PM2.5) and smoke level, relative to the odds at the average PM2.5 value of 10 µg m−3 at (A) no smoke, (B) low smoke level, (C) medium smoke level, and (D) high smoke level, above the site as detected by satellites.
Fire 06 00159 g003
Table 1. Estimated odds ratios (with 95% confidence interval) for PM2.5 exceeding 35, 20, or 10 µg m−3 relative to odds on days with no smoke above.
Odds Ratio for PM2.5 (µg m−3) Exceeding: Smoke Level
LowMediumHigh
353.29 (2.6–4.2)26.81 (20.8–34.5)114 (87–150)
202.74 (2.5–3.0)10.94 (9.5–12.6)34.73 (28.5–42.3)
102.06 (1.9–2.2)4.27 (3.8–4.8)9.03 (7.2–11.3)
All values are statistically significant.
Table 2. Estimated odds ratio of at least one asthma emergency room visit as a function of number of days with PM2.5 values greater than 35 in the previous week, evaluated via Equation (1).
Days with PM2.5 > 35 µg m−3One DayTwo DaysThree Days
Odds ratio1.23 *1.36 *1.38 *
(95% Confidence Bounds)(1.12–1.35) *(1.19–1.55) *(1.21–1.57) *
* Odds significantly larger than odds when zero days in previous week with PM exceeding 35 µg m3.
Table 3. Estimated odds of at least one asthma emergency room visit in fire smoke days relative to odds on days with no smoke exposure in the previous week.
Days with High Smoke1 Day2 Days3 Days4+ Days
Odds Ratio1.000.830.31 *0.28 *
(95% Confidence Bounds)(0.83–1.21)(0.51–1.34)(0.11–0.89) *(0.14–0.58) *
* Odds significantly different from odds on days with no smoke.
Disclaimer/Publisher’s Note: The statements, opinions and data contained in all publications are solely those of the individual author(s) and contributor(s) and not of MDPI and/or the editor(s). MDPI and/or the editor(s) disclaim responsibility for any injury to people or property resulting from any ideas, methods, instructions or products referred to in the content.

