
Mapping South Florida Daily Fire Risk for Decision Support Using Fuel Type, Water Levels, and Burn History


1
Center for Geospatial Analytics, North Carolina State University, Raleigh, NC 27695, USA
2
Department of Parks, Recreation and Tourism Management, North Carolina State University, Raleigh, NC 27695, USA
*
Author to whom correspondence should be addressed.
Fire 2023, 6(6), 236; https://doi.org/10.3390/fire6060236
Submission received: 10 May 2023
/
Revised: 7 June 2023
/
Accepted: 9 June 2023
/
Published: 14 June 2023
(This article belongs to the Section Fire Science Models, Remote Sensing, and Data)
Abstract
:Mapping fire risk in South Florida depends on spatially varying water levels, fuel characteristics, and topography. When surface water levels recede below the lowest topographic features (cypress strands, marshes, etc.), the ecosystem loses its natural, wetted fire breaks, and landscape-level fire risk increases. We developed a geospatial method to generate daily, categorical fire risk maps; the maps visualize low-to-high risk areas using a newly developed 100 m DEM, modeled water levels, fuel types, and fire management units. We assigned fire risk by creating a water level distribution for each unique combination of fuel type and fire management unit; fire risk was then assigned for each pixel based on risk percentiles commonly used by fire management agencies. Assigning risk based on unique fuel types and management units helped avoid over- or under-assigning fire risk that may occur when applying landscape-level “average” risk relationships. Daily maps also incorporated (1) energy release component data to better estimate fuel moisture and (2) historical burn footprints to reduce risk in recently burned areas. Our data-driven approach generated at management-relevant spatial scales may enable more informed prescribed burn planning and may increase the efficiency of staff and resource allocation across the landscape on high-wildfire-risk days.
Keywords:
fire risk; South Florida; decision support; Everglades; Big Cypress; wildfire; prescribed fire1. Introduction
Globally, fire frequency is expected to increase due to climate change, although fire size and intensity may be moderated in fuel-limited systems [1,2,3]. Unprecedented wildfire seasons have already been observed in fire-prone areas due to climate-driven hotter and drier weather, as well as increased fuel loads [4,5,6]. Global areas designated as “fire-prone” are expected to grow, and existing fire-prone areas will likely experience, on average, longer wildfire seasons [6,7,8]. The need for management-relevant fire risk modeling is a global issue that spans fire regimes and geographies. Fire risk modeling occurs at varying spatial resolutions and extents spanning short (hours to weeks [9,10]) and long (years to decades [11,12]) time scales [13,14]. Fire managers in the United States primarily rely on the National Fire Danger Rating System (NFDRS), managed by the Wildland Fire Assessment System at the United States Department of Agriculture Forest Service Rocky Mountain Research Station, for active fire management decisions. Other national fire risk models have also been developed by countries undertaking significant fire management and fire suppression operations (e.g., Australia (Australia Fire Danger Rating System), Canada (Canadian Forest Fire Danger Rating System), EU (European Forest Fire Information System)).
The US NFDRS requires a consistent set of data inputs and produces a fire risk score based on region, fuel type, and recent weather conditions [15]. These standardized risk metrics are necessary to support national fire management strategies and resource allocation because they provide a common system to communicate risk and align fire management priorities across local, state, and federal agencies [16]. However, these national products are often too coarse to address the local, place-based fire management challenges facing fire managers, particularly in unique landscapes [17]. There is a need for place-based geospatial tools driven by both data and local fire management knowledge [16,17,18]. Here, we detail the development and applications of a custom geospatial fire risk model in South Florida, USA, and discuss its use by federal fire managers.
South Florida has one of the largest prescribed fire programs in the US and is unique in that daily water levels are critical to assessing fire risk for its vegetative areas [19,20,21]. As existing fire risk and fire behavior models (e.g., NFDRS, FlamMap, BehavePlus) do not directly incorporate surface water levels, this region provides an ideal location for Florida, which is mostly controlled by strong seasonal precipitation and overland flow from surrounding water districts that are heavily managed and support significant agricultural operations and rapid urban development. Florida’s urban population has doubled to ~22 million people in the last two decades, with most urban development occurring in the form of infill and edge expansion; South Florida is now home to more than 6 million residents in the greater Miami–Fort Lauderdale–Pompano Beach metro area [22,23].
Significant draining for agricultural conversion occurred in South Florida during the 1800s and 1900s, with smaller amounts of conversion thereafter; currently, South Florida fruit groves and pastureland are the second largest land cover class following protected areas [24]. The Everglades National Park (Everglades) and Big Cypress Preserve (Big Cypress) cover 9000 km2 of southern Florida. When combined with the South Florida Water Management District (SFWMD) lands to the north and east, the study area covers 12,500 km2 (Figure 1). This area, also known as the Southern Greater Everglades, spans multiple ecoregions from upland pines and deep cypress strands in northern Big Cypress to sawgrass-dominated marshes of the coastal Everglades [25].
Fire is a dominant ecological process across this landscape. Because both the prescribed fire season and wildfire season are influenced by water levels, managers require a fire risk model that captures the influence of hydrology on their ability to safely and effectively conduct prescribed fires, as well as safely and efficiently allocate staff and resources during the wildfire season. Large wildfires burn several hundred square kilometers every 3–10 years on average and are started by both accidental human ignitions and lightning strikes during the late spring and summer months [26,27]; the average wildfire (WF) is ~3700 acres with an average of ~75,000 acres burned annually. Prescribed fires are generally smaller, though some are in the order of several thousands of acres, and are conducted frequently, with at least some portion of most management units burning annually [28,29]. The average prescribed fire (RX) is ~1000 acres with ~100,000 acres burned annually. Most prescribed fires are conducted in the late winter and spring months with annual variability in the average number and size of prescribed fires dependent on weather and water level conditions (Figure 2C).
Three landscape elements directly influence the Greater Everglades fire regime: the plain-like landform (flat topography), seasonal subtropical moist climate, and fire-adapted shrubs and grasses. The wildfire regime aligns with seasonal precipitation in this dry-to-moist subtropical environment; the wet season (June to October) can bring >75 cm of precipitation per month, while the dry season (November to May) averages 25–50 cm per month (Figure 2B) [33] (gauge data same as the figure above). Thus, wildfire season typically peaks toward the end of the dry season in April and May, when even the water-dominated sloughs (i.e., swampy backwaters of the open coast) can carry fire because the above-water portions of grasses are sufficiently dry. The tall grass and shrub understory regenerate quickly post fire in this warm climate and it is common for fuel loads to return to near pre-burn conditions within several years after a fire (Figure 2A) [28,34]. There are other locations around the world with similar topography, seasonal climate, and vegetation (Figure 2D), and the place-based fire risk considerations evaluated here could translate to managing wildland fires in other landscapes.
In 1958, Everglades National Park conducted the first prescribed burn in a national park, with the goal of perpetuating the park’s iconic open pine ecosystem [27,34]. However, fire has a much longer cultural and ecological history in this landscape [27,35]. Pre-contact, multiple Native American tribes, including, but not limited to, the Seminole, Calusa, and Miccosukee, resided in or near tree hammocks, dense and often-isolated stands of hardwood trees, throughout the Everglades and Big Cypress. Burning the landscape was a cultural practice intertwined with their deep commitment to land stewardship; fires also promoted the growth of medicinal herbs and other forage and opened the understory to invite wildlife and improve hunting [27,36]. Currently, fire management prioritizes protecting tree hammocks and the fire-avoidant species contained therein because they are valuable archaeological sites and contain rich biodiversity [29]. Other wildland fire management considerations include the spatial distribution of endangered species habitats, designated wilderness areas, a major travel corridor, and public and private infrastructure within large expanses of publicly managed lands. Our locally informed, geospatial fire risk model helps fire managers to strategize and allocate resources in order to protect tree hammocks and other resources while safely igniting and managing fires in other parts of the landscape.
The Greater Everglades ecosystem is valued for flood mitigation, water filtration, imperiled ecosystems (e.g., pine rocklands), ~40 threatened and endangered species, and outdoor recreation opportunities [25,37,38]. The natural spaces of the Greater Everglades are directly adjacent to significant suburban housing expansion that has been ongoing for decades; the significant footprint of land use change continues to alter hydrologic flows and requires significant water management infrastructure [39,40]. The Everglades Depth Estimation Network (EDEN), a series of in situ water gauges, was created in 1999 to monitor changes in hydrology and contribute data to support adaptive natural resource management in the Everglades. The EDEN Network has grown to include more than 300 gauges distributed throughout the Everglades and adjacent management areas, and a suite of modeled hydrology products is openly available from the United States Geological Survey (Figure 1). These water monitoring data support decisions about where and when to retain or release water and provide an invaluable long-term perspective on how flows and water levels have changed over the lifetime of the gauge network [41].
Water level information is integral to fire management in the Everglades, and EDEN water level measurements are the most accessible (publicly available) and reliable source of daily hydrologic information in this region. Satellite observations are not yet able to compete with in situ measurements due to the necessary compromises of temporal, spatial, and spectral resolutions. Even with appropriate temporal resolution (daily), obtaining accurate high-resolution water surfaces in a wetland environment is complicated; in this flat landscape, inches can change fire risk conditions [42]. Attempting to model these fine temporal scale hydrologic changes requires gauges and modeled water surfaces, as well as a high-resolution horizontal digital elevation model (DEM).
The objective of this effort was to work alongside South Florida fire managers to leverage EDEN water surfaces, customized vegetation classifications, and a high resolution (DEM) to help estimate daily fire risk. We contribute a novel geospatial decision support model for South Florida that provides spatially detailed fire risk information beyond that of national-scale fire risk products. We also produced a high-resolution open-source DEM for public use. The model was co-produced by local fire managers and researchers and is designed such that fire managers can access a Github-hosted openly available R package to run FireHydro from their desktops. The risk classifications combine fire management expertise with a data-driven perspective on fire risk variability based on historical water level conditions. Our method is uniquely suited to an ecosystem where small fluctuations in surface water levels and topography drive fire behavior. We combine our understanding of the landscape’s hydrologic patterns, vegetation fuel characteristics, and fire management regimes to generate a daily fire risk map to support decision making for wildland fire use.
2. Model Inputs and Parameters
We developed a workflow that relies on parallel processing to compute risk for each individual pixel. We started with a daily water level raster from the EDEN data repository following their quality assurance procedures and then subtracted a DEM to yield a water level raster. We intersected the fuel layer, management units, and water level raster to assign each pixel both a fuel type, management unit, and daily water level. Based on the fire management risk percentiles (described in Section 2.1.2 below), we assigned each pixel a daily risk category of high, moderately high, moderate, moderately low, or low depending on how the pixel’s daily water level value aligned with the historic water level percentiles. Finally, additional modifications to the five-class risk map were made based on the daily ERC values for Big Cypress and the Everglades (Section 2.1.5) and the three most recent years of historical burn footprints (Section 2.1.6). Three outputs are produced from each run of the FireHydro model: (1) a water level and fuel-based risk map (2) a water level and fuel-based risk map modified by the daily ERC values (3) a water level and fuel-based risk map where risk is reduced within historical footprints. We have also designed the model to accept ongoing changes whereby managers can incorporate field validation of the risk maps based on observed water levels as well as the historic context of fire behavior under different water level conditions.
2.1. Model Overview and Data Descriptions
The FireHydro model generates a daily fire risk map for southern Florida using a water surface, a digital elevation model (DEM), vegetation fuel types, management units, energy release component (ERC) values from local meteorological stations, and historic burn footprints. The spatial extent of the model includes the Everglades National Park (Everglades), Big Cypress National Preserve (Big Cypress), and the water conservations areas of the South Florida Water Management District (SFWMD); the model extent aligns with the available water surface data from the Everglades Depth Estimation Network (EDEN) run by the United States Geological Survey (USGS). The output map(s) assign fire risk into five categories (high, moderately high, moderate, moderately low, and low) at a 30 m resolution. FireHydro produces multiple output products to better represent the variety of data and risk considerations needed for fire management decision support. Input data descriptions are below (Figure 3).
2.1.1. DEM
As of spring 2023, no publicly available high-resolution DEM exists for South Florida, so we merged openly available lidar-derived USGS DEMs to create a seamless DEM covering our study area (Figure 2). The horizontal resolutions of the source DEMs ranged from 1 m to 3 m resolution with a centimeter vertical resolution [43]. We resampled the final DEM at a 100 m horizontal resolution to reduce computation time and avoid ascribing overprecision relative to the modeled water surface data available at a 400 m horizontal resolution.
2.1.2. Water Levels
We subtracted the DEM from the modeled daily water surface, which is collected via an automated download from the EDEN website, to yield the daily water level. Water is above ground where water level values are positive; water is below ground where water level values are negative. Daily EDEN interpolated water surfaces use 250 water gauge depth measurements to apply separate radial basis functions within eight subdomains in order to estimate daily median water level (NAVD88) at a 400 m horizontal resolution and a centimeter vertical resolution. The eight subdomains control for the effects of major infrastructure, such as berms and canals, that impact landscape hydrology. The modeled water surface data are validated using 284 independent water level measurements with a root mean square error of 4.78 cm. [44].
We assembled a historic distribution of water levels by regularly sampling the water surface once per week for 10 years (2012–2021; total n = 520) (Figure 3, right panel). We used historic water levels to provide a baseline for assessing current landscape risk and to guide discussion and risk classification exercises with fire managers. Because the relationships between water levels and fire risk differ throughout the landscape, we created individual distributions of water levels for each fuel type within each management unit (Figure 4). In total, we created 115 unique fuel type and management unit water level distributions, and water levels within each distribution were classified into one of the five risk categories ranging from high to low. We used the following data percentiles to delineate risk classes: 3% lowest water levels = high risk; 3.01–10% lowest = moderately high; 10.01–20% lowest = moderate; 20.01–30% = moderately low; 30.01–100% = low. These percentiles translate directly to common wildland fire management quantiles used to delineate risk by the National Park Service and other agencies [45,46,47].
2.1.3. Vegetation Fuel Types
The Everglades National Park and Big Cypress National Preserve fire management offices rely on 11 fuel types derived from 30 m resolution vegetation data to estimate expected fire behavior [48]. These fuel types, used by the National Wildfire Coordinating Group, are classified nationally [49,50], but local fire management staff have reclassified vegetation communities across southern Florida to better suit the place-based details of fuel characteristics beyond the National Fire Danger Rating System fuel models. These 11 fuel types include short, sparse dry climate grass (GR1); low load very coarse humid climate grass (GR3); high load very coarse humid climate grass (GR8); moderate load humid climate grass-shrub (GS3); urban/suburban (NB1); agricultural field (NB3); open water (NB8); bare ground (NB9); low load humid climate shrub (SH6); low load broadleaf litter (TL2); small downed logs (TL4). Ruiz et al. 2021′s initial 30 m resolution vegetation data were unavailable in the water conservation areas, so we crosswalked the more than 50 vegetation categories in the Florida Cooperative Land Cover Map to one of the 11 fuel types already in use [48,51]. In summary, “GR” fuel types comprise collections of different grass species, “GS” fuel types comprise both grass and shrub species, “NB” fuel types comprise different categories of non-burnable or ‘non-natural’ materials, “SH” fuel types comprise collections of different shrub species, and “TL” fuel types represent different categories of timber litter.
2.1.4. Management Units
We used 15 management units to delineate areas of the landscape with similar hydrological conditions that are likely to carry fire similarly during a wildfire or prescribed fire. Depending on the location, managers may expect the same fuel type in two different management units to behave differently or require different risk classifications. For example, a comparison of the water level values at the “low” to “moderately low” risk threshold for low load humid climate shrub fuels in the North 75 and South 41 management units shows the variability in water levels within the same fuel type across management units. In North 75, the low- to moderately-low-risk threshold occurs at approximately the −25 cm water level, whereas the South 41 threshold is much closer to the 0 cm water level (Figure 4). Small shifts in the water level distributions affect data-derived risk percentiles, and these transition points are customized to more localized hydrologic conditions when management units are used to subdivide the landscape.
2.1.5. Energy Release Component
We incorporated an energy release component (ERC) to estimate landscape-level fuel availability [52]. ERC quantifies the estimated potential energy (BTU/ft2) available to burn, which is directly related to the 1000 h composite fuel moisture. ERC values are calculated daily for each Remote Automatic Weather station (RAWS) using the NFDRS-designated fuel model for that station and the 24 h maximum/minimum temperature, maximum/minimum relative humidity, and precipitation duration [46]. ERC increases as fuels dry and temperatures rise.
Daily shifts in ERC are small because the calculation does not include wind or fine fuel moisture and the ERC has memory, meaning it incorporates the conditions from the previous seven days, making significant daily changes in ERC values rare. Fire management staff also use the 3/10/20/30 percentile breaks to define ERC risk; these percentiles map to ERC values of 33+/30/22/9 [45]. For both Big Cypress and Everglades, ERC values are averaged across all meteorological stations within the respective park and a single risk score is assigned within each park boundary.
2.1.6. Energy Release Component
We incorporated historic wildfire and prescribed fire burn footprints to decrease the assigned fire risk based on fire activity from the three preceding years. How fire risk is decreased due to historical burns depends on the fuel type, but the risk reduction does not distinguish between wildfire or prescribed fire or differentiate fire severity outcomes. We apply risk reductions differently across fuel types to account for faster regeneration and return to pre-fire fuel loads in grass fuel types and relatively slower regeneration in more forested or denser fuel loads that take longer to return to pre-fire fuel loads. We apply risk reductions as follows: for GR and GS fuel types, risk is reduced for one year post burn; for NB fuel types, risk is reduced for two or three years post burn depending on the management unit; and for SH and TL fuel types, risk is reduced for three years post burn. For example, for grasses that regenerate quickly, the fire risk is reduced for one year post fire by one risk category, whereas for later succession fuel types (e.g., cypress), fire risk is decreased for up to three years post fire. Historic burn footprints rely on manual updates from a National Park Service GIS database and so do not reflect real-time data.
3. Model Results and Performance
3.1. Model Outputs
FireHydro outputs four maps for each model run of a given date (Figure 5). Multiple output maps were necessary because a single map does not communicate the complexity of factors that may alter fire risk across the landscape. Each output map represents additional variables to consider in day-to-day fire management; these maps can act as decision support for staffing and staging wildfire suppression resources, conducting successful prescribed burns, or informing water management strategies that influence hydrologic flow.
3.1.1. Water Level Risk
The water level risk map is the foundational output and all other risk modifications were made from this initial map (Figure 5A). We used the water level risk map for calibration and understanding persistent wetness (low risk) and dryness (high risk) in different management units and fuel types. Linking fire risk outcomes across management units (where on the landscape), type of fuel (what would burn), and daily water level (how might the fire travel) provides fire and fuels specific information beyond that available from only a water surface. The risk classes and historical water level distribution model inputs are designed such that managers can directly and iteratively modify risk thresholds (water level values/percentiles) through an input .CSV file as additional data are acquired. This process and example modifications are detailed in Section 3.2—Model Evaluation.
While we anticipate that fire managers will modify the 3/10/20/30 risk thresholds for certain fuels and management units, the predetermined risk breaks in FireHydro appropriately track the seasonal pattern of fire risk and management-relevant risk transitions through the most active wildland fire months (Figure 6). January and February historically are the most active months for prescribed burns; precipitation is relatively low, but the landscape still retains some water from the prior wet season that provides more predictable wetted fire breaks for prescribed fire operations (Figure 2B,C). In the January and February risk maps, there are patches of moderately low to moderate risk, indicating that there may be areas with fuels available to burn and that these areas may be less likely to result in an escaped prescribed fire due to adjacent inundated areas (low risk) (Figure 6).
March acts as a transition from the prime prescribed fire season to wildfire season in April and May. Prescribed fire operations do occur in March, but this depends heavily on the timing and intensity of seasonal drying. April and May display an overall increase in landscape-level risk, though we are able to identify unusual years such as 2019. In 2019, December to February were drier than average resulting in elevated fire risk earlier in the year, but spring precipitation significantly reduced fire risk during April and May. June and July maps show the onset of the wet season; smaller, more readily controlled wildfires are still relatively common in June, but the number of wildfires declines significantly in July. Fire managers do also conduct prescribed fires during the summer months when conditions are appropriate (Figure 2C and Figure 6).
3.1.2. ERC-Modified Risk
The ERC-adjusted risk output (Figure 5B) for 18 April 2019, reflects increased risk across the landscape due to a relatively high ERC value (28). We created a categorical reference table to modify water level risk by ERC (Table A1). Not all water level risk classes (assigned by fuel and management unit) will increase or decrease based on the daily ERC value. Although rare, it is possible for the risk map to decrease based on ERC, but this only occurs when ERC values are unusually low and water levels are unusually high (low risk). When ERC risk is moderate, the overall risk may not change due to ERC. The highest ERC risk class represents rarer combinations of increasingly hot and dry periods that last for multiple weeks and result in overall elevated fire risk, while the lower ERC risk classes account for the majority of days where ERC will not increase fire risk. Managers find a separate ERC map useful because it provides a landscape-level ‘average’ measure that incorporates recent weather into perceived risk.
3.1.3. Historical Burn Modified Risk
Risk maps adjusted for historical burn footprints always decrease risk in pixels where a fire has occurred in the last one-to-three years (Figure 5C). Generating this map as a stand-alone product allows fire managers to compare risk between the initial output map, where fuel loads are assumed constant within a given fuel type (Figure 5A), and a map where fuels have been reduced by a recent fire. When considering the allocation of resources, maps showing reduced risk from recent fires help managers prioritize different fire containment strategies.
3.2. Model Evaluation
Validating a fire risk model in this landscape is complex because the model objective is to represent perceived fire risk for both prescribed fires and wildfires. There is a need to merge data-driven approaches for model validation with input from experienced professionals, particularly in areas where monitoring data at the necessary spatial resolution are inconsistent or unavailable. Difficulties arise because there are tradeoffs in using a more conservative or more liberal risk assignment method. Risk estimates that lean conservative are likely beneficial in the context of wildfire preparedness, but risk estimates that are too conservative may further limit the number of days deemed ‘in prescription’ (i.e., days with appropriate weather, air quality, and staffing conditions) to conduct prescribed burns. Conversely, risk estimates that are not conservative enough could lead to being underprepared during a wildfire or attempting to ignite prescribed fires when a fire escape is more likely. There is also a lack of consistent, field-based measurements documenting how water levels correspond to perceived and experienced fire risk. Together, the multi-purpose nature of this model and the limitation of not being able to statistically predict fire occurrence and spread lead us to also rely on the input and refinements from local fire management staff to evaluate the model.
3.2.1. Water Level Risk Classes
We performed initial model evaluation by assessing the seasonality of water level risk by fuel type and management unit (Figure 6). We then sampled 12 days that included significant historical rain events (i.e., hurricanes and tropical storms), notable wildfires with elevated landscape-level fire risk, and successful prescribed fires that met management objectives. We sampled four days for each of the three categories: rainy, wildfire, and prescribed fire. We sampled prescribed fires that were both near and far from infrastructure (canals, roads, etc.) and prescribed fires that had detailed documentation about the objectives, day of burn conditions, and outcomes for the burn.
Model outputs were reviewed by local fire managers, during which fire managers provided insight on how to best evaluate the model. Generally, we evaluated the model by comparing FireHydro outputs for a given day to fire managers’ perceived risk on that day by reviewing the percentage of the landscape assigned to all risk classes and identifying localized areas for which the assigned risk class was exceptionally biased (notably over or under the manager’s perceived risk). This evaluation process was iterative and may continue to evolve with management expertise, as the input CSV makes for straightforward risk threshold modifications.
For days immediately following hurricanes and tropical storms, greater than 99% of the landscape was classified as low risk. For days when major wildfires burned, greater than 75% of the landscape was classified as moderate risk or above. Even during peak wildfire activity, portions of the landscape that readily retain water, such as deep cypress strands that have not burned in decades, are still classified as low or moderately low risk. Water retention in these areas was validated by individual gauge measurements and management feedback. For days with successfully prescribed fires, model evaluation criteria are more uncertain. Generally, these days display pockets of moderately low to moderate risk surrounded by large extents of low risk. Risk maps on these days show that parts of the landscape may be sufficiently dry to carry fire, but these areas are surrounded by large stretches of low-risk areas that act as sufficiently wetted fire breaks.
3.2.2. Iterating with Fire Managers and Sample Risk Class Modifications
In addition to landscape-level seasonality and identifying characteristic fire risk days, there are also important fine-scale spatial patterns of fire risk that require evaluation. We iterated on several different methods with managers to improve fire risk accuracy in localized areas. The standard water level risk percentiles appear to over-assign risk in wetter management units and under-assign risk in drier management units. To refine these risk percentiles, we brought regional fire managers together to evaluate fire risk maps from recent days. We asked fire managers to identify and discuss what areas on the map have over- or under-assigned risk. This discussion illuminated what areas on the landscape they believe to experience similar hydrologic conditions; these newly grouped areas did not always align with the existing management unit boundaries that were used to build the water level distribution curves. Referencing multiple output risk maps from several different days, fire managers both added and subtracted management unit boundaries to more accurately group similar areas of the landscape. In total, eight existing management units were edited which resulted in an increase in total management units from 15 to 19; ultimately, most of the new units were made to better capture the influence of roads (or lack thereof) and existing natural features that impact local hydrology.
Following the regrouping of management areas, adjustments to risk percentiles were still necessary within certain fuels and management units (Figure 7). Risk percentile adjustments were made to the six different fuel types (GR1, GR3, GR8, SH6, TL2, TL4) in the Deep Lake management unit because the standard fire management risk percentiles under-assigned risk in the prairies (GR1, GR3, GR8) and pinelands (SH6) and over-assigned risk in the western cypress strands (TL4) (Figure 7B,C). The modified risk percentile map more accurately reflects fire risk in April because the grass (GR) fuel types indicate higher risk due to their increased relative drying and the pinelands (SH6) show increased risk because these are generally drier areas of the landscape (Figure 7D). Cypress strands are generally wetter and can behave as reliable firebreaks even when water levels are beneath the surface. Note that the western portion of cypress (TL4) in this subsetted area shows overall lower risk due to its location deeper in the cypress strands when compared to other more eastern areas of cypress closer to the prairie edge.
3.2.3. ERC and Historical Burn Footprints
We iterated on the strength of the ERC fire risk modification and the historical burn risk reductions with fire managers. We worked through several different ERC modifications until the landscape’s average ERC risk adjustment better reflected how managers use ERC data for decision making. The final ERC risk modification includes ERC as supplementary data that do not overpower fire risk assigned by the water level risk thresholds. With fire manager feedback, our historical burn risk reductions evolved from reducing risk by one class for three years regardless of fuel type to fuel-type-dependent risk reductions where the timing of reduced risk varies from one to three years. Model evaluation is ongoing for different combinations of ERC risk modifications and risk reduction within historical burn footprints.
4. Discussion
Together with local fire managers, we iteratively developed a daily, geospatial fire risk model, “FireHydro”, for the Everglades National Park, Big Cypress National Preserve, and the water conservation areas managed by the South Florida Water Management District (SFWMD). The model generates a five-class fire risk map using a framework uniquely suited to flat topography, mosaiced fuel types, and strong dependence on seasonal water levels (Figure 1). With input from local fire managers, we subdivided the landscape into management units to create historical water level distributions for individual fuel types. We applied fire management percentile risk breaks (3/10/20/20) adapted from the National Wildfire Coordinating Group’s documentation on Preparedness and Fire Danger Operating Plans [47].
With local fire manager support, we used these risk distribution thresholds to delineate the five high- to low-risk classes (Figure 3 and Figure 4) and evaluated model performance based on the model’s ability to capture the seasonality of fire risk during months that transition from the prime prescribed fire season (January, February, and March) to the wildfire season (April and May) to the wet season (June and July) (Figure 6). Iterative meetings were conducted with local fire managers to co-produce FireHydro, and we worked alongside fire managers to edit management unit boundaries and modify risk percentiles where needed (Figure 7). Finer scale model performance and risk assignments for certain fuel types in specific management units required additional and ongoing feedback from local fire managers.
The model provides a suite of three daily automated risk maps (water level risk, ERC modified risk, and historical burn reduced risk) in approximately one hour of computing time (Figure 5). With an openly available R package forthcoming and easy-to-modify model inputs, fire managers can continue to work with and refine the risk classification schemes. The goal is to make FireHydro a ‘living’ tool that managers can run, edit, and revise using an input CSV file. The model, along with documentation, is provided to managers so the model can be run in-house. These results and model descriptions are representative of work to date; the model parameters and inputs will continue to evolve as new data are made available and fire managers continue to field validate the output maps. This model can also be adapted to other landscapes, although challenges may arise in areas with less available geospatial data, fewer hydrological gauges, and less active fire and water management (Figure 2D).
FireHydro allows managers to assess daily fire risk throughout the active fire months, and when the model is run daily or weekly, it can illuminate which parts of the landscape are retaining water longer or losing water faster than anticipated. FireHydro contributes to implementation strategies for conducting prescribed burns and suppressing wildfires. For example, when fire managers are hoping to conduct a prescribed fire, they try to optimize resources based on location, staffing, and anticipated burn conditions [53]. FireHydro acts as a first line of decision support by indicating what burn units may be available or unavailable to burn based on water levels. Using a daily mapped product allows fire managers to home in on plausible units and spend less time evaluating burn units on the ground or by air. Similarly, when a wildfire ignition is reported, fire managers can leverage FireHydro outputs, along with other real-time fire weather information, to develop initial estimates on likely direction, rate, and extent of spread, which are necessary for evaluating different containment strategies. These decisions rely heavily on estimating water levels and an accurate map can make the difference between ordering costly air resources and additional personnel versus knowing that existing fire breaks should hold or at least slow the fire, indicating that a less aggressive initial containment approach should be sufficient [54].
The model can also help ease the complexity of communicating fire risk conditions in such a unique, hydrology-driven landscape. For example, in late summer when the western and central United States experience high fire risk, conditions in South Florida may be ideal for prescribed burning because of moderate to high water levels that lower fire intensity, reduce spotting, and serve as wetted fire breaks [55]. Identifying, understanding, and explaining these differences in wildland fire conditions in South Florida versus other regions is critical to minimize unnecessary restraints on prescribed burning [56]. This is even more impactful when burn windows and resources are limited. Conversely, during the late winter months when the rest of the nation may not be experiencing drought or heightened fire risk, South Florida could be experiencing drying and reduced water levels (e.g., winter of 2019). In these situations, South Florida fire management can benefit from supporting information from FireHydro outputs to demonstrate that the landscape is at a high risk of fire due to lower-than-normal water levels. This additional information can make it easier to justify additional resources and national prioritization. FireHydro outputs act as both a prescribed fire planning tool as well as a tool for demonstrating the need for additional resources and staffing during wildfire season.
Finally, mapped outputs from FireHydro allow fire managers to directly overlay other important local features, such as protected archaeological sites or private and public infrastructure. No single product can encapsulate the complete suite of considerations that come into play when prescribed fire planning and wildfire response, so FireHydro is intended to be used alongside other management-relevant map products and additional weather indices. Moreover, it provides fire managers with cross-boundary perspectives on fire risk because multiple jurisdictions are included within the mapped footprint. With additional data relating to in situ fuel consumption measurements and FireHydro output maps, it may also be possible for FireHydro to provide data to support prescribed fire smoke management decisions.
As with any model, assumptions and simplifications are necessary to incorporate the best available data into the creation of a useful product. Even with the finest resolution (30 m) vegetation fuel dataset available, the 11 fuel classes cannot always accurately map all fuel spatial configurations or fully differentiate the nuanced fuel composition that ultimately governs fire behavior. The EDEN water surfaces provide the best available hydrology data for this landscape, but water levels in this landscape can change over much finer spatial scales than 400 m. Water levels are also changing over longer time scales due to ecological restoration efforts happening across the Greater Everglades. Infrastructure (roads, berms, etc.) is being removed or raised so as not to impede surface flow; these modifications, while beneficial for restoring natural ecosystems, change where water flows and pools across the landscape. Restoration efforts are currently underway and changes to average water levels have already occurred in some parts of the Everglades [39]. It may be necessary to modify FireHydro’s historical water level distribution such that we draw sample water level values from the most recent three to five years, instead of the past decade.
Limitations on the water level accuracy are introduced due to the 400 m resolution modeled water surfaces and the lidar-derived DEM. While the EDEN interpolated water surfaces are divided into subdomains to improve accuracy and have a low average root mean square error (<5 cm), the existing subdomains are unable to capture all unique hydrologic conditions caused by roads, culverts, or other infrastructure [44]. The limited number and spatial locations of water gauges are the main factors prohibiting the creation of more subdomains that could better account for water surface heterogeneity. It is also difficult to quantify uncertainties introduced by subtracting the DEM from the interpolated water surfaces. Because the DEM is a lidar-derived product, the DEM may be biased toward higher elevation values due to the inability of lidar to penetrate the ground in dense-vegetation- and surface-water-dominated landscapes [57]. An overall landscape bias toward higher topography may overestimate fire risk. This occurs because we subtract the DEM (biased high) from EDEN water surfaces which could result in lower, or more negative, water levels than would actually be observed. We will continue to validate our DEM as additional high-resolution DEMs are made available for this landscape.
Numerous factors contribute to fire risk and, ultimately, how fires ignite and spread [58]. Rather than attempting to predict fire occurrence, the FireHydro model focuses on understanding, if an ignition were to occur, whether the water level conditions are right for fire spread, and if so, to what spatial extent might the fire spread before hitting wetted fire breaks. We do not account for detailed fuel characteristics like most other physics-based fire spread models; for FireHydro to provide fire-spread-specific estimates, it would require integrating additional weather data, fuel moisture, and fuel load data into the output fire risk maps. Additionally, without capturing winds and other dynamic daily factors in our model, it is unfeasible to use final wildfire or prescribed fire footprints as a form of validation. There is also uncertainty around how to most accurately categorically reduce risk in burned areas over time and by fuel type. Simplified relationships may hold for most of the landscape, but additional field validation is necessary to spatially refine these risk reductions.
We evaluated the percentage of the landscape in each risk class across 12 different characteristic days (four wildfire days, four prescribed fire days, and four days following tropical storms or hurricanes). Wildfire days were, as expected, dominated by areas of moderate to high risk, prescribed fire days were mostly low to moderate risk areas, and days following significant rain events showed >95% of the modeled area as low risk. As fire managers work to revise risk relationships in priority fuel types by incorporating additional field observations, risk modifications should be created with these baselines of proportionate landscape risk in mind.
Future improvements to fire risk modeling in South Florida could focus on expanding monitoring efforts and leveraging forecasted water levels. Below, we detail near-term and long-term priorities for future work related to monitoring and forecasting fire risk.
Near-term monitoring priorities include a pilot monitoring program for systematic regular sampling to provide water level measurements in a variety of fuel types under different hydrologic conditions. A monitoring program could improve model validation through (1) an in situ survey of fuel and water levels stratified across fuel types and water level conditions and (2) the installation of additional gauges in priority areas of the landscape that can best inform anticipated fire behavior. Additional EDEN gauges may also be needed as hydrologic flows continue to evolve due to the removal of old infrastructure. Remotely sensed data, such as LANDSAT, could also be leveraged to detect burn severity and extent. Incorporating these products into the model could more efficiently and effectively map necessary fuel risk reductions from historic burns and more readily extend FireHydro to new landscapes.
Long-term monitoring priorities include using satellite observations of water levels to validate and or calibrate the interpolated water surface; this would also open opportunities for similar methods to be applied in other landscapes, such as those outlined above, without existing gauge networks (Figure 2D). Wildfires in 2022 burned over 500,000 acres in the grass and wetland ecosystems outside of Rosario, Argentina; these fires are an example of fire management in wetland environments that could benefit from improvements in satellite water surface and fuel moisture observations. Improvements in estimating water surface and fuel moisture in wetlands are a key step to reliably adapting the FireHydro model to new landscapes.
A near-term forecasting priority is to generate a fourth FireHydro output that overlays spatially continuous forecasted wind speeds over the current output risk maps. Fire managers are keen to understand forecasted wind speed (average and maximum) and direction, as this has implications for how a wildfire might spread or the ability to conduct a prescribed burn based on anticipated fire spread and acceptable smoke dispersal. Landscape-level wind data are a critical piece of any fire weather forecast, but it is unique to have wind data spatially overlaid with water- and fuel-based fire risk metrics. Future additions to the suite of FireHydro outputs should also include additional weather- and atmospheric-based data, such as the hot–dry–windy index or other metrics that integrate near-real-time air temperature, relative humidity, and wind data.
Two opportunities exist for long-term improvements of fire risk forecasts in the region. The first is an extension of the current FireHydro model that ingests near-term forecasted water levels from the EverForecast model [59]. Using the daily outputs from EverForecast would allow fire managers to anticipate fire risk under similar historical precipitation patterns and also provide uncertainty bounds on water levels in any given grid cell. The second long-term forecasting priority is to use FireHydro, together with other resource management decision support tools, in a scenario development context to explore tradeoffs in water management decision making. Many competing resource management decisions depend on predictable water flows—a water management strategy that diverts water to prioritize habitat conditions for an endangered species (e.g., wading birds, crayfish, etc.) that may result in unwarranted fire danger in another subregion of the landscape. Providing a suite of scenario-based geospatial tools could allow resource managers to more readily visualize the tradeoffs of their decisions, particularly during times of drought or high precipitation [60,61].
5. Conclusions
South Florida’s highly seasonal precipitation, near-flat topography, mosaic of fire-adapted and fire-avoidant species, year-round warm temperatures, and variety of fire ignition sources have shaped the landscape and its unique fire regime. Partnering with fire managers, we co-produced a geospatial fire risk model, FireHydro, that provides localized fuel and water level information to inform management strategies for both prescribed fire ignitions and wildfire suppression. We also created an openly available high-resolution DEM to forward future research that relies on detailed topography data. FireHydro is one of few place-based and manager-driven fire risk products, and FireHydro demonstrates the added detail and benefit of characterizing fire risk with the assistance of expert knowledge at localized scales. In unique fire environments, the creation and adoption of localized fire risk models, in addition to the NFDRS fire risk metrics, could provide untapped, valuable information to local fire managers.
Author Contributions
Conceptualization, J.V. and K.J.; methodology, J.V. and K.J.; software, K.J.; validation, J.V. and K.J.; writing—original draft preparation, K.J.; writing—review and editing, J.V.; visualization, K.J.; supervision, J.V.; project administration, J.V.; funding acquisition, J.V. All authors have read and agreed to the published version of the manuscript.
Funding
This research was funded by the National Park Service grant number P20A C01020-01.
Data Availability Statement
The FireHydro visualization tool was created using publicly available datasets referenced in the manuscript. Risk relationships as defined by fire managers are reported in the aggregate in the manuscript.
Acknowledgments
We thank Jill Houseknecht, James Sullivan, Pat Edwards, Orlando Genao, Michael Gue, Jack Weer, Dylan Scottat Big Cypress National Preserve and Everglades National Park for their input on model development and iterations to improve model performance. We thank Justin Shedd at the National Park Service for data sharing and project guidance. We thank Troy Hill for his efforts on a previous version of the model, and we also thank two anonymous reviewers for their improvements to the manuscript.
Conflicts of Interest
The authors declare no conflict of interest.
Appendix A

Table A1.
Final risk class outcomes based on combined initial water level risk class and the ERC risk class. For both water level and ERC risk classes, 1 = high risk and 5 = low risk.
Table A1.
Final risk class outcomes based on combined initial water level risk class and the ERC risk class. For both water level and ERC risk classes, 1 = high risk and 5 = low risk.
| Final Fire Risk Class | Water Level Risk Class | ERC Risk Class |
|---|---|---|
| High | 1 | 1, 2 |
| Moderately High | 1 | 3 |
| Moderately High | 2 | 1, 2, 3 |
| Moderate | 1, 2 | 4, 5 |
| Moderate | 3 | 1, 2, 3 |
| Moderate | 4 | 1, 2 |
| Moderately Low | 4 | 3 |
| Moderately Low | 3 | 4, 5 |
| Moderately Low | 5 | 1, 2, 3 |
| Low | 4, 5 | 4, 5 |
References
- Senande-Rivera, M.; Insua-Costa, D.; Miguez-Macho, G. Spatial and Temporal Expansion of Global Wildland Fire Activity in Response to Climate Change. Nat. Commun. 2022, 13, 1208. [Google Scholar] [CrossRef] [PubMed]
- Rogers, B.M.; Balch, J.K.; Goetz, S.J.; Lehmann, C.E.R.; Turetsky, M. Focus on Changing Fire Regimes: Interactions with Climate, Ecosystems, and Society. Environ. Res. Lett. 2020, 15, 030201. [Google Scholar] [CrossRef]
- Halofsky, J.E.; Peterson, D.L.; Harvey, B.J. Changing Wildfire, Changing Forests: The Effects of Climate Change on Fire Regimes and Vegetation in the Pacific Northwest, USA. Fire Ecol. 2020, 16, 4. [Google Scholar] [CrossRef] [Green Version]
- Keeley, J.E.; Syphard, A.D. Large California Wildfires: 2020 Fires in Historical Context. Fire Ecol. 2021, 17, 22. [Google Scholar] [CrossRef]
- McColl-Gausden, S.; Bennett, L.; Clarke, H.; Ababei, D.; Penman, T. The Fuel–Climate–Fire Conundrum: How Will Fire Regimes Change in Temperate Eucalypt Forests under Climate Change? Glob. Chang. Biol. 2022, 28, 5211–5226. [Google Scholar] [CrossRef]
- Boisramé, G.F.S.; Brown, T.J.; Bachelet, D.M. Trends in Western USA Fire Fuels Using Historical Data and Modeling. Fire Ecol. 2022, 18, 8. [Google Scholar] [CrossRef]
- Jolly, W.M.; Cochrane, M.A.; Freeborn, P.H.; Holden, Z.A.; Brown, T.J.; Williamson, G.J.; Bowman, D.M.J.S. Climate-Induced Variations in Global Wildfire Danger from 1979 to 2013. Nat. Commun. 2015, 6, 7537. [Google Scholar] [CrossRef] [Green Version]
- Jones, M.W.; Abatzoglou, J.T.; Veraverbeke, S.; Andela, N.; Lasslop, G.; Forkel, M.; Smith, A.J.P.; Burton, C.; Betts, R.A.; van der Werf, G.R.; et al. Global and Regional Trends and Drivers of Fire Under Climate Change. Rev. Geophys. 2022, 60, e2020RG000726. [Google Scholar] [CrossRef]
- Worsnop, R.P.; Scheuerer, M.; Di Giuseppe, F.; Barnard, C.; Hamill, T.M.; Vitolo, C. Probabilistic Fire-Danger Forecasting: A Framework for Week-Two Forecasts Using Statistical Post-Processing Techniques and the Global ECMWF Fire Forecast System (GEFF). Weather Forecast. 2021, 36, 2113–2125. [Google Scholar] [CrossRef]
- Fernandes, K.; Bell, M.; Muñoz, Á.G. Combining Precipitation Forecasts and Vegetation Health to Predict Fire Risk at Subseasonal Timescale in the Amazon. Environ. Res. Lett. 2022, 17, 074009. [Google Scholar] [CrossRef]
- Hood, S.M.; Varner, J.M.; Jain, T.B.; Kane, J.M. A Framework for Quantifying Forest Wildfire Hazard and Fuel Treatment Effectiveness from Stands to Landscapes. Fire Ecol. 2022, 18, 33. [Google Scholar] [CrossRef]
- Parisien, M.-A.; Miller, C.; Parks, S.A.; DeLancey, E.R.; Robinne, F.-N.; Flannigan, M.D. The Spatially Varying Influence of Humans on Fire Probability in North America. Environ. Res. Lett. 2016, 11, 075005. [Google Scholar] [CrossRef]
- Oliveira, S.; Rocha, J.; Sá, A. Wildfire Risk Modeling. Curr. Opin. Environ. Sci. Health 2021, 23, 100274. [Google Scholar] [CrossRef]
- Iglesias, V.; Balch, J.K.; Travis, W.R. U.S. Fires Became Larger, More Frequent, and More Widespread in the 2000s. Sci. Adv. 2022, 8, eabc0020. [Google Scholar] [CrossRef] [PubMed]
- Cohen, J.D.; Deeming, J.E. The National Fire-Danger Rating System: Basic Equations; U.S. Department of Agriculture, Forest Service, Pacific Southwest Forest and Range Experiment Station: Berkeley, CA, USA, 1985; pp. 1–23.
- Zacharakis, I.; Tsihrintzis, V.A. Environmental Forest Fire Danger Rating Systems and Indices around the Globe: A Review. Land 2023, 12, 194. [Google Scholar] [CrossRef]
- Walding, N.G.; Williams, H.T.P.; McGarvie, S.; Belcher, C.M. A Comparison of the US National Fire Danger Rating System (NFDRS) with Recorded Fire Occurrence and Final Fire Size. Int. J. Wildland Fire 2018, 27, 99. [Google Scholar] [CrossRef]
- Hunter, M.E.; Colavito, M.M.; Wright, V. The Use of Science in Wildland Fire Management: A Review of Barriers and Facilitators. Curr. For. Rep. 2020, 6, 354–367. [Google Scholar] [CrossRef]
- Ruiz, P.L.; Sah, J.P.; Ross, M.S.; Spitzig, A.A. Tree Island Response to Fire and Flooding in the Short-Hydroperiod Marl Prairie Grasslands of the Florida Everglades, USA. Fire Ecol. 2013, 9, 38–54. [Google Scholar] [CrossRef]
- Platt, R.V. A Model of Exurban Land-Use Change and Wildfire Mitigation. Environ. Plan. B Plan. Des. 2006, 33, 749–765. [Google Scholar] [CrossRef]
- Everglades National Park Headquarters National Park Service Begins Prescribed Fire Operations across South Florida. Available online: https://www.nps.gov/ever/learn/news/2021soflrxfirepr.htm (accessed on 15 March 2023).
- U.S. Census Bureau. American Community Survey 1-Year Estimates. Available online: http://censusreporter.org/profiles/31000US33100-miami-fort-lauderdale-pompano-beach-fl-metro-area/ (accessed on 1 June 2023).
- Rifat, S.A.A.; Liu, W. Quantifying Spatiotemporal Patterns and Major Explanatory Factors of Urban Expansion in Miami Metropolitan Area During 1992–2016. Remote Sens. 2019, 11, 2493. [Google Scholar] [CrossRef] [Green Version]
- Volk, M.; Hoctor, T.; Nettles, B.; Hilsenbeck, R.; Putz, F. Florida Land Use and Land Cover Change in the Past 100 Years. In Florida’s Climate: Changes, Variations, & Impacts; Digital Repository; Florida Climate Institute, Florida State University: Tallahassee, FL, USA, 2017; ISBN 978-1-979091-04-6. [Google Scholar]
- Stainback, G.A.; Lai, J.H.; Pienaar, E.F.; Adam, D.C.; Wiederholt, R.; Vorseth, C. Public Preferences for Ecological Indicators Used in Everglades Restoration. PLoS ONE 2020, 15, e0234051. [Google Scholar] [CrossRef] [PubMed]
- Inglis, N.C.; Vukomanovic, J. Visualizing When, Where, and How Fires Happen in U.S. Parks and Protected Areas. IJGI 2020, 9, 333. [Google Scholar] [CrossRef]
- Stevenson, J. Evolution of Fire Management in Florida’s State Parks. In Fire in Ecosystem Management: Shifting the Paradigm from Suppression to Prescription; Tall Timbers Research Station: Tallahassee, FL, USA, 1998; Volume 20, pp. 99–101. [Google Scholar]
- Houseknect, J.; Big Cypress National Preserve, Copeland, FL, USA. Personal communication, 2023.
- O’Leary, M.; Pernas, T.; Sullivan, J. Big Cypress National Preserve Fire Management Plan; National Park Service: Big Cypress Preserve Florida, FL, USA, 2020; pp. 1–112.
- U.S. Fish and Wildlife Service Southeast Region. Prescribed Fire Transition Panoramic; Flicker: San Francisco, CA, USA, 2008.
- Florida Climate Center. Available online: https://climatecenter.fsu.edu/climate-data-access-tools (accessed on 15 March 2023).
- Sayre, R.; Karagulle, D.; Frye, C.; Boucher, T.; Wolff, N.; Breyer, S.; Wright, D.; Martin, M.; Butler, K.; Van Graafeiland, K.; et al. An assessment of the representation of ecosystems in global protected areas using new maps of World Climate Regions and World Ecosystems. Glob. Ecol. Conserv. 2020, 21, e00860. [Google Scholar] [CrossRef]
- Cioffi, F.; Conticello, F.R.; Lall, U. Stochastic Scenarios for 21st Century Rainfall Seasonality, Daily Frequency, and Intensity in South Florida. J. Water Resour. Plann. Manag. 2020, 146, 04020058. [Google Scholar] [CrossRef]
- Snyder, J.; Ross, M.; Koptur, S.; Sah, J. Developing Ecological Criteria for Prescribed Fire in South Florida Pine Rockland Ecosystems; Bureau of Land Management: Southeast Environmental Research Center, Florida International University Digital Commons; U.S. Geological Survey: Miami, FL, USA, 1997; pp. 1–114.
- Fowler, C.; Konopik, E. The History of Fire in the Southern United States. Hum. Ecol. Rev. 2007, 14, 12. [Google Scholar]
- Wear, D.N.; Greis, J.G. The Southern Forest Futures Project: Technical Report; USDA-Forest Service, Southern Research Station: Asheville, NC, USA, 2013; pp. 1–542.
- Pearlstine, L.G.; Pearlstine, E.V.; Aumen, N.G. A Review of the Ecological Consequences and Management Implications of Climate Change for the Everglades. J. N. Am. Benthol. Soc. 2010, 29, 1510–1526. [Google Scholar] [CrossRef] [Green Version]
- D’Acunto, L.E.; Pearlstine, L.; Haider, S.M.; Hackett, C.E.; Shinde, D.; Romañach, S.S. The Everglades Vulnerability Analysis: Linking Ecological Models to Support Ecosystem Restoration. Front. Ecol. Evol. 2023, 11, 1111551. [Google Scholar] [CrossRef]
- Harvey, J.W.; Wetzel, P.R.; Lodge, T.E.; Engel, V.C.; Ross, M.S. Role of a Naturally Varying Flow Regime in Everglades Restoration: High-Flow Restoration of Wetland Ecology. Restor. Ecol. 2017, 25, S27–S38. [Google Scholar] [CrossRef]
- Graf, W.L. Water Resources Science, Policy, and Politics for the Florida Everglades. Ann. Assoc. Am. Geogr. 2013, 103, 353–362. [Google Scholar] [CrossRef]
- Romañach, S.S.; Haider, S.M.; Hackett, C.; McKelvy, M.; Pearlstine, L.G. Managing Multiple Species with Conflicting Needs in the Greater Everglades. Ecol. Indic. 2022, 136, 108669. [Google Scholar] [CrossRef]
- Papa, F.; Frappart, F. Surface Water Storage in Rivers and Wetlands Derived from Satellite Observations: A Review of Current Advances and Future Opportunities for Hydrological Sciences. Remote Sens. 2021, 13, 4162. [Google Scholar] [CrossRef]
- U.S. Geological Survey. USGS Original Product Resolution FL_Peninsular 2022. Available online: https://rockyweb.usgs.gov/vdelivery/Datasets/Staged/Elevation/OPR/Projects/ (accessed on 16 December 2021).
- Haider, S.; Swain, E.; Beerens, J.; Petkewich, M.; McCloskey, B.; Henkel, H. The Everglades Depth Estimation Network (EDEN) Surface-Water Interpolation Model, Version 3; USGS Greater Everglades Priority Ecosystems Science Program; U.S. Department of the Interior: Washington, DC, USA, 2020; pp. 1–44.
- Finney, M.A.; McHugh, C.W.; Grenfell, I.; Riley, K.L. Continental-Scale Simulation of Burn Probabilities, Flame Lengths, and Fire Size Distribution for the United States. In Proceedings of the VI International Conference on Forest Fire Research, Coimbra, Portugal, 15–18 November 2010. [Google Scholar]
- Jolly, W.; Freeborn, P.; Page, W.; Butler, B. Severe Fire Danger Index: A Forecastable Metric to Inform Firefighter and Community Wildfire Risk Management. Fire 2019, 2, 47. [Google Scholar] [CrossRef] [Green Version]
- Interagency Standards for Fire and Fire Aviation Operations Group. Chapter 10: Preparedness; National Interagency Fire Center: Boise, ID, USA, 2023; p. 220.
- Ruiz, P.; Schall, T.; Shamblin, R.; Whelan, K. The Vegetation of Everglades Natinoal Park: Final Report; National Park Service: Fort Collins, CO, USA, 2021.
- National Wildfire Coordinating Group Surface Fuel Model Descriptions. Available online: https://www.nwcg.gov/publications/pms437/fuels/surface-fuel-model-descriptions (accessed on 31 March 2023).
- Scott, J.H.; Burgan, R.E. Standard Fire Behavior Fuel Models: A Comprehensive Set for Use with Rothermel’s Surface Fire Spread Model; U.S. Department of Agriculture, Forest Service, Rocky Mountain Research Station: Ft. Collins, CO, USA, 2005; pp. 17–66.
- Florida Natural Areas Inventory. Cooperative Land Cover, Version 3.6. 2022. Available online: https://www.fnai.org/services/coop-land-cover (accessed on 11 December 2022).
- Hall, B.; Brown, T.; Bradshaw, L.; Jolly, W.; Nemani, R. National Standardized Energy Release Component Forecasts. In Proceedings of the 5th Symposium on Fire and Forest Meteorology, Boston, MA, USA, 16 November 2003; American Meteorological Society: Boston, MA, USA; Orlando, FL, USA, 2003; p. 172. [Google Scholar]
- National Wildland Fire Coordinating Group. NWCG Standards for Prescribed Fire Planning and Implementation. Fire Use Subcommittee; 2022; pp. 1–51. Available online: https://www.nwcg.gov/sites/default/files/publications/pms484.pdf (accessed on 9 May 2023).
- Reimer, J.; Thompson, D.K.; Povak, N. Measuring Initial Attack Suppression Effectiveness through Burn Probability. Fire 2019, 2, 60. [Google Scholar] [CrossRef] [Green Version]
- Menges, E.S.; Marks, P.L. Fire and Flood: Why Are South-Central Florida Seasonal Ponds Treeless? Am. Midl. Nat. 2008, 159, 8. [Google Scholar] [CrossRef]
- van Wagtendonk, J.W. The History and Evolution of Wildland Fire Use. Fire Ecol. 2007, 3, 3–17. [Google Scholar] [CrossRef]
- Medeiros, S.; Hagen, S.; Weishampel, J.; Angelo, J. Adjusting Lidar-Derived Digital Terrain Models in Coastal Marshes Based on Estimated Aboveground Biomass Density. Remote Sens. 2015, 7, 3507–3525. [Google Scholar] [CrossRef] [Green Version]
- Cruz, M.G.; Alexander, M.E.; Kilinc, M. Wildfire Rates of Spread in Grasslands under Critical Burning Conditions. Fire 2022, 5, 55. [Google Scholar] [CrossRef]
- Pearlstine, L.G.; Beerens, J.M.; Reynolds, G.; Haider, S.M.; McKelvy, M.; Suir, K.; Romañach, S.S.; Nestler, J.H. Near-Term Spatial Hydrologic Forecasting in Everglades, USA for Landscape Planning and Ecological Forecasting. Environ. Model. Softw. 2020, 132, 104783. [Google Scholar] [CrossRef]
- Gamboa, G.; Otero, I.; Bueno, C.; Arilla, E.; Ballart, H.; Camprubí, L.; Canaleta, G.; Tolosa, G.; Castellnou, M. Participatory Multi-Criteria Evaluation of Landscape Values to Inform Wildfire Management. J. Environ. Manag. 2023, 327, 116762. [Google Scholar] [CrossRef]
- Thompson, M.P.; Gannon, B.M.; Caggiano, M.D.; O’Connor, C.D.; Brough, A.; Gilbertson-Day, J.W.; Scott, J.H. Prototyping a Geospatial Atlas for Wildfire Planning and Management. Forests 2020, 11, 909. [Google Scholar] [CrossRef]
Figure 1.
Study area map of the Everglades Depth Estimation Network (EDEN) modeled water surface extent including Big Cypress National Preserve (brown), Everglades National Park (green), and South Florida Water Management District (SFWMD) water conservation areas (purple) overlaid with major roads (white) and boundaries of current fire management units (black). Yellow points are locations of EDEN gauges and blue points are locations of Remote Access Weather Stations that provide energy release component data. Note, individual EDEN gauges may be excluded from a given day’s interpolated water surface based on immediate QAQC measures conducted by the EDEN team.
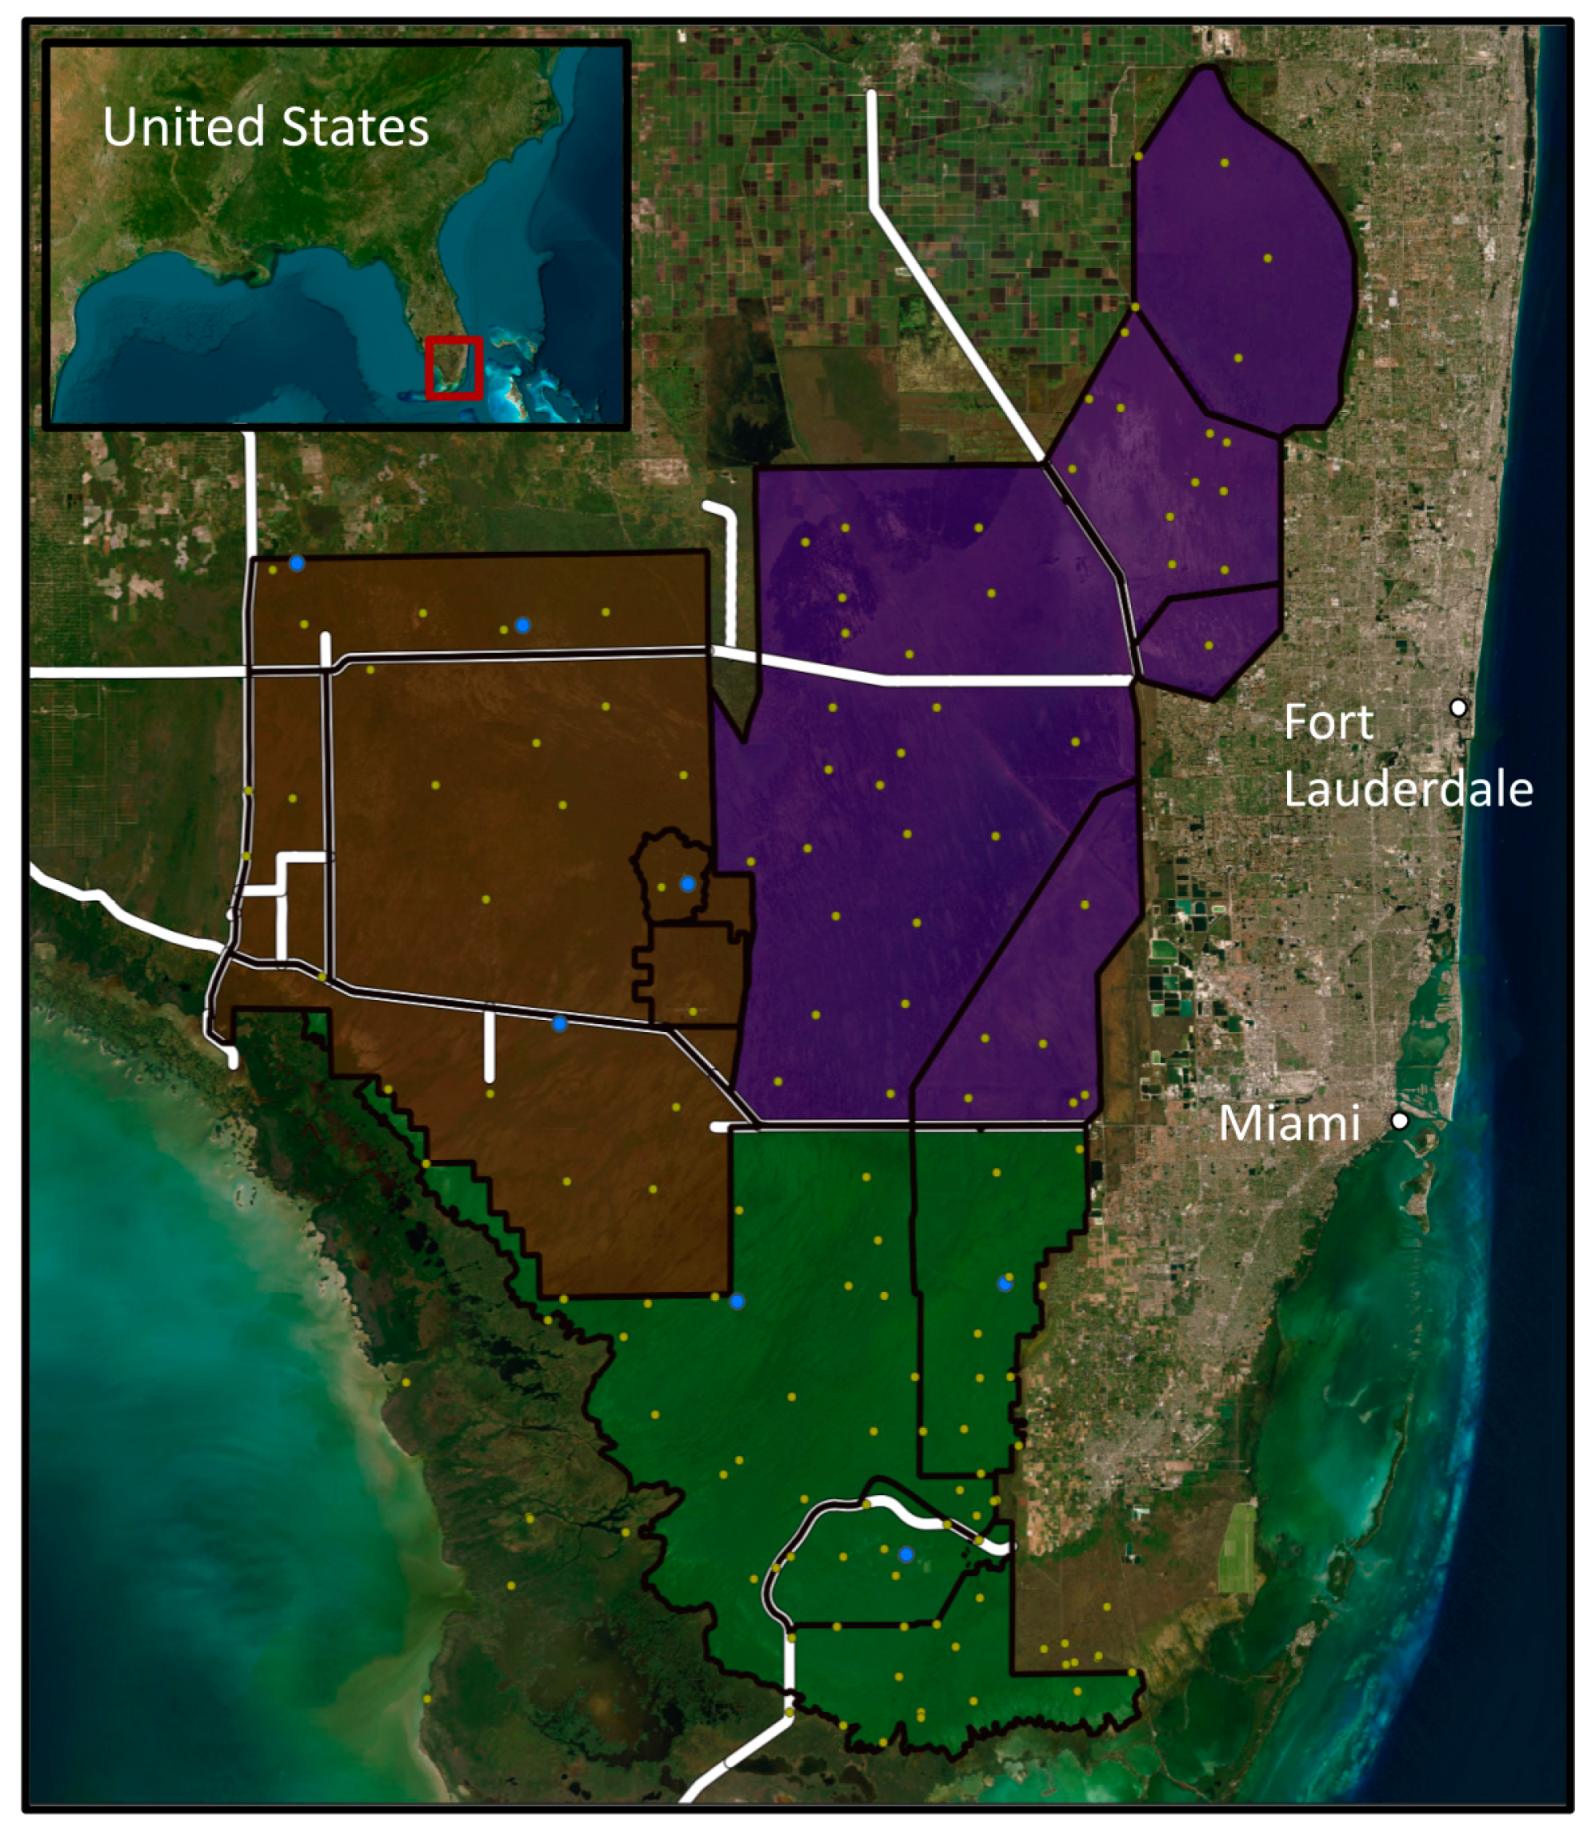
Figure 2.
(A) Photo series visualizing the quick regeneration of understory dominated by grasses and shrubs (Adapted with permission from [30]. 2008, U.S. Fish and Wildlife Service Southeast Region). Images show in descending order: pre-burn, immediately post-burn, 3 months post-burn, 6 months post-burn, 1 year post-burn, and 2 years post-burn. (B) Mean monthly precipitation and mean temperature for Everglades National Weather Station from 1980–2017 [31]. (C) Paired boxplot of the number of monthly wildfires and prescribed fires in BICY from 1980–2021. The average prescribed fire (RX) is ~1000 acres with ~100,000 acres burned annually; the average wildfire (WF) is ~3700 acres with an average of ~75,000 acres burned annually. (D) Global map highlighting other subregions with similar topography, vegetation, and climate regimes [32].
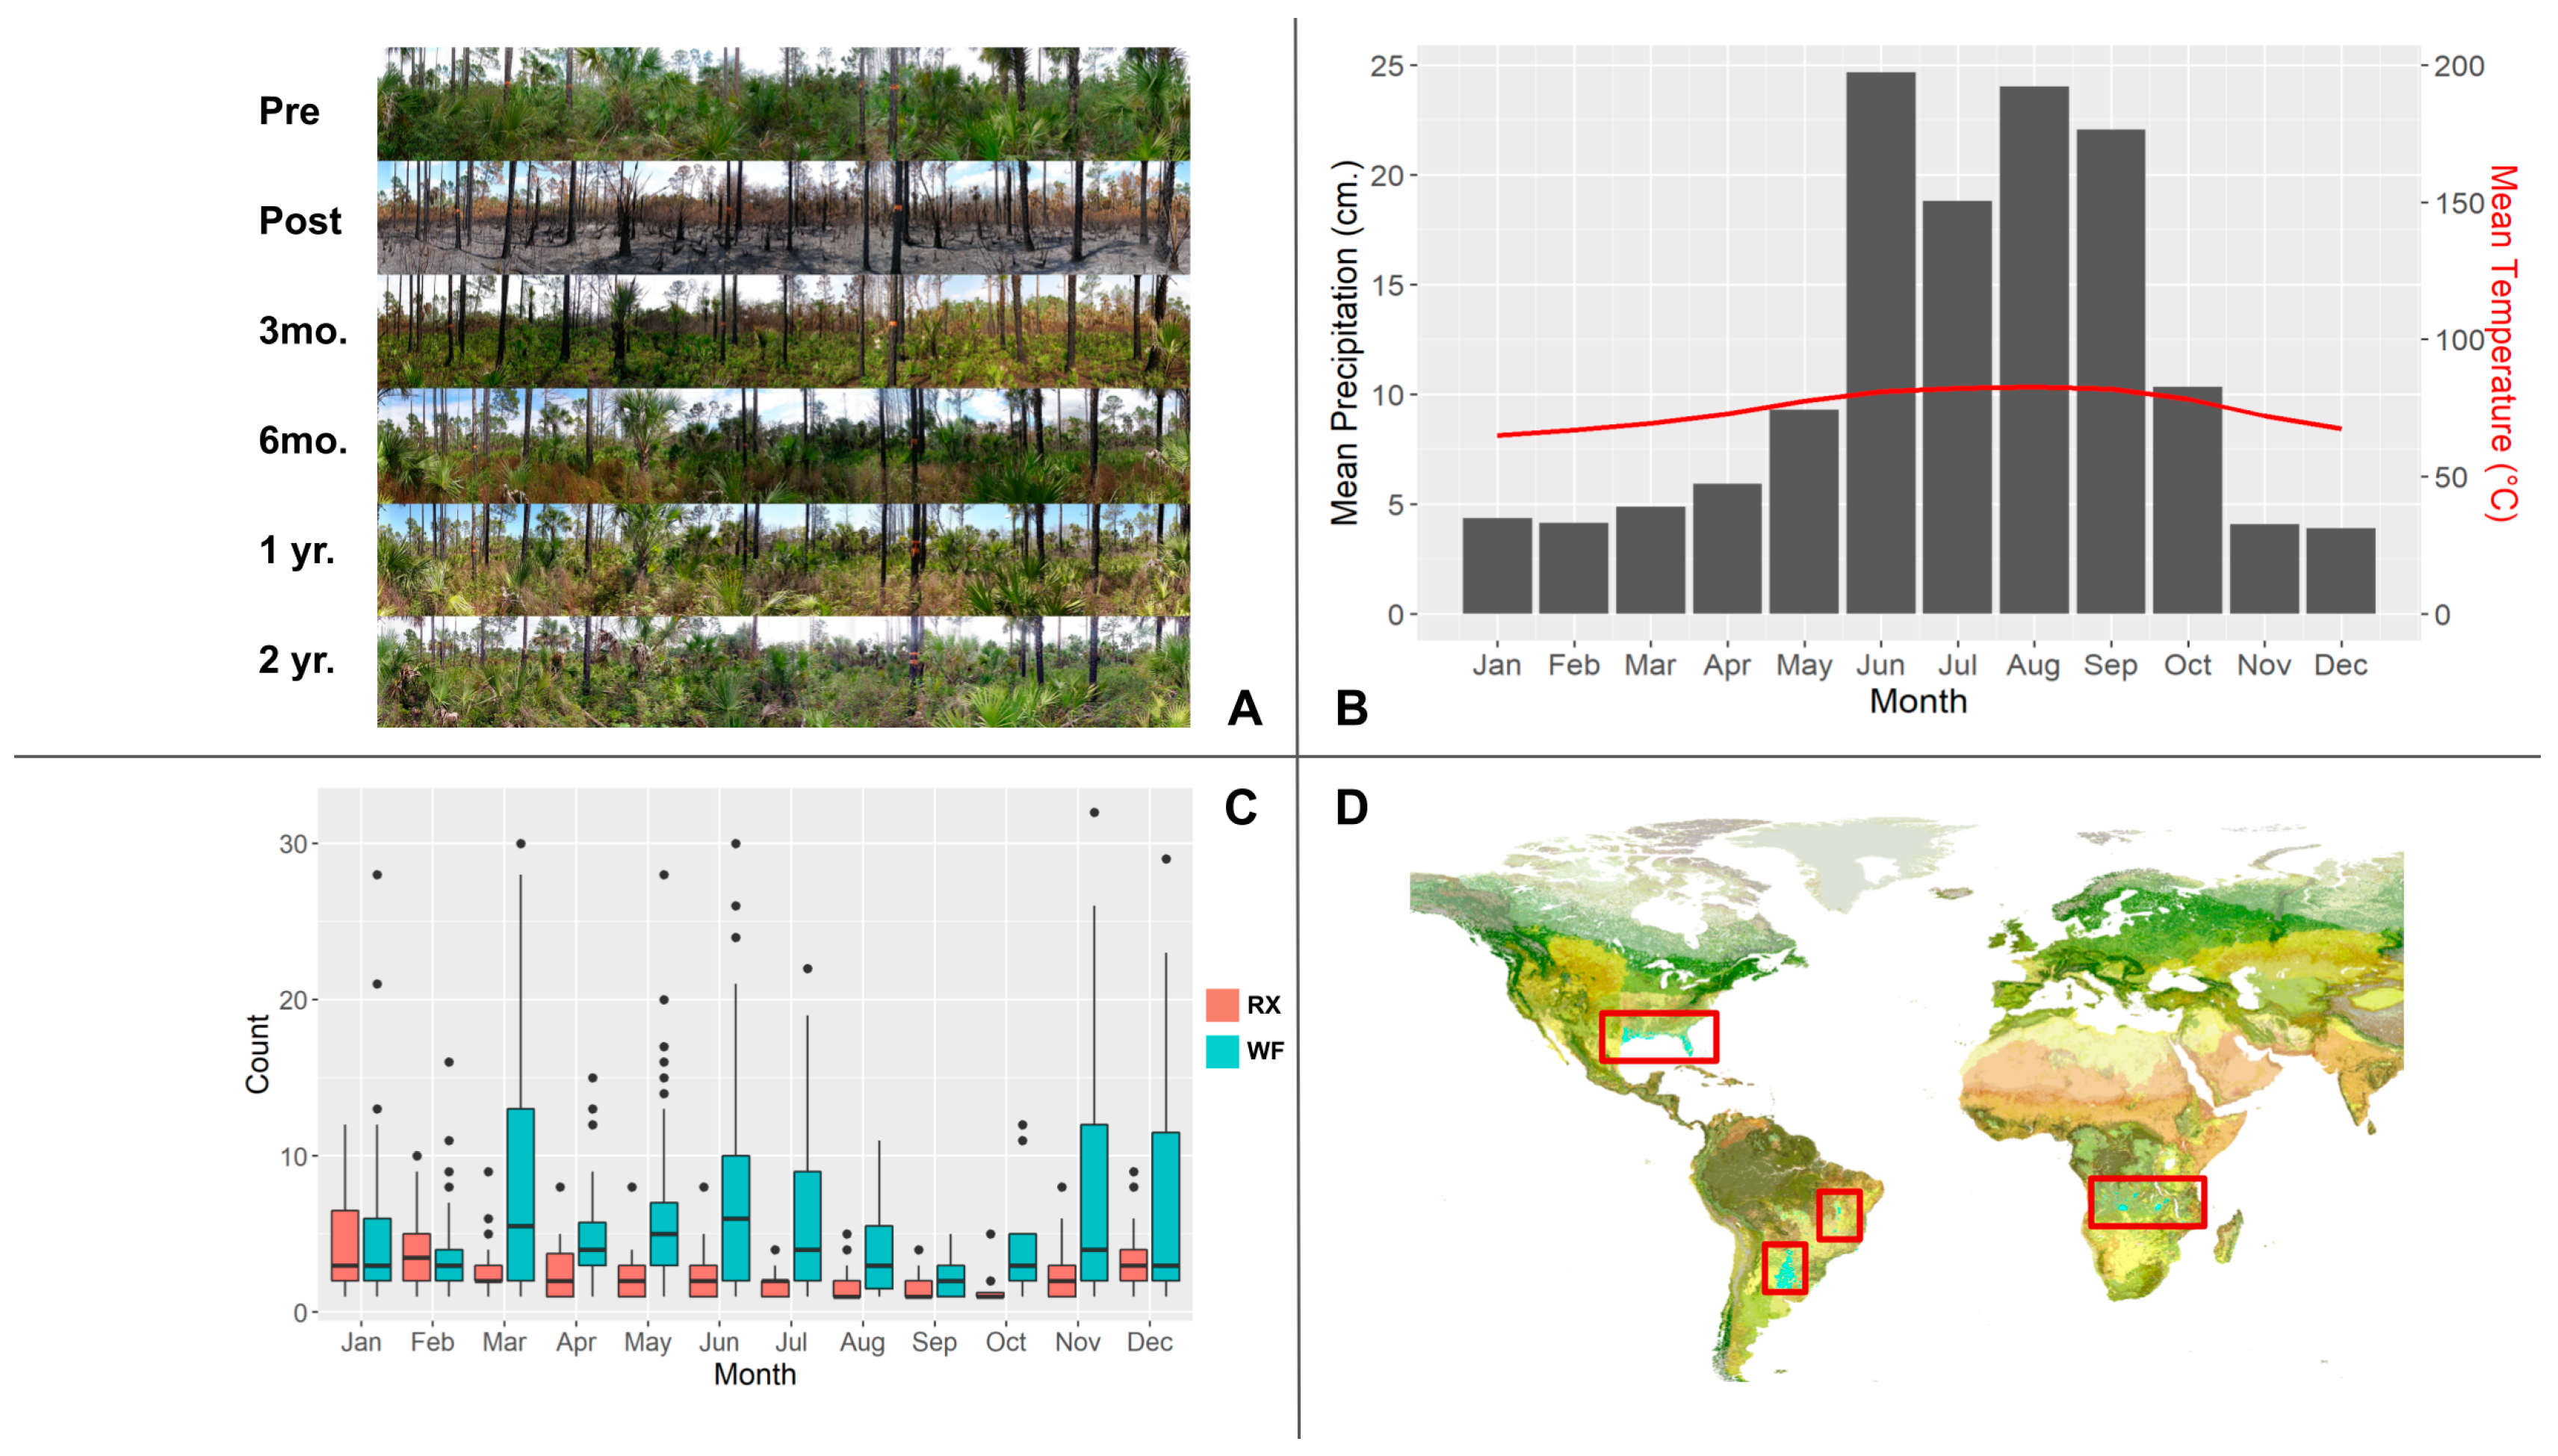
Figure 3.
FireHydro initiates an automated download of interpolated EDEN daily water surfaces and subtracts the DEM to yield daily water level (cm) (left). Each water level pixel is then assigned to one of the 115 fuel type and management units through a spatial intersection, where all gridded data products are aligned and resampled to match the 30 m vegetation data (center). We refer to mapped units as pixels, though, the final product is not strictly pixel-based. Mapped units can be smaller than the finest geospatial gridded product (30 m), as the output maps are spatial polygons where pixels may have been divided by management unit boundaries. Each pixel’s daily water level is then ranked as high, moderately high, moderate, moderately low, or low risk based on its water level relative to the defined percentiles (3/10/20/30) within the historic water level distribution (n = 520) for that fuel type and management unit (right).

Figure 4.
Water level distributions for two fuel types (SH6 and TL2) within three management units (North 75, South 41, Pinelands) spread north to south throughout Big Cypress and Everglades. The black vertical line (water level = 0) helps illustrate how often water levels are above (right of line) or below (left of line) the ground surface. These example fuel-management unit distributions indicate how risk classes differ between management units, even for the same fuel type. Distributions are colored based on the 03/10/20/30 water level risk percentiles.

Figure 5.
Three model outputs for 18 April 2019. We randomly selected an April day within the last five years because April often shows the landscape transition from moderate to higher fire risk. (A) Output risk map based solely on water level risk percentiles within each fuel type and management unit. (B) Risk assignments from map (A) with risk reductions in areas that experienced a wildfire or prescribed fire within the last three years. Purple boxes highlight sizable risk reductions due to historic fires. (C) ERC modified risk from map (A) due to a relatively high ERC (28) value.
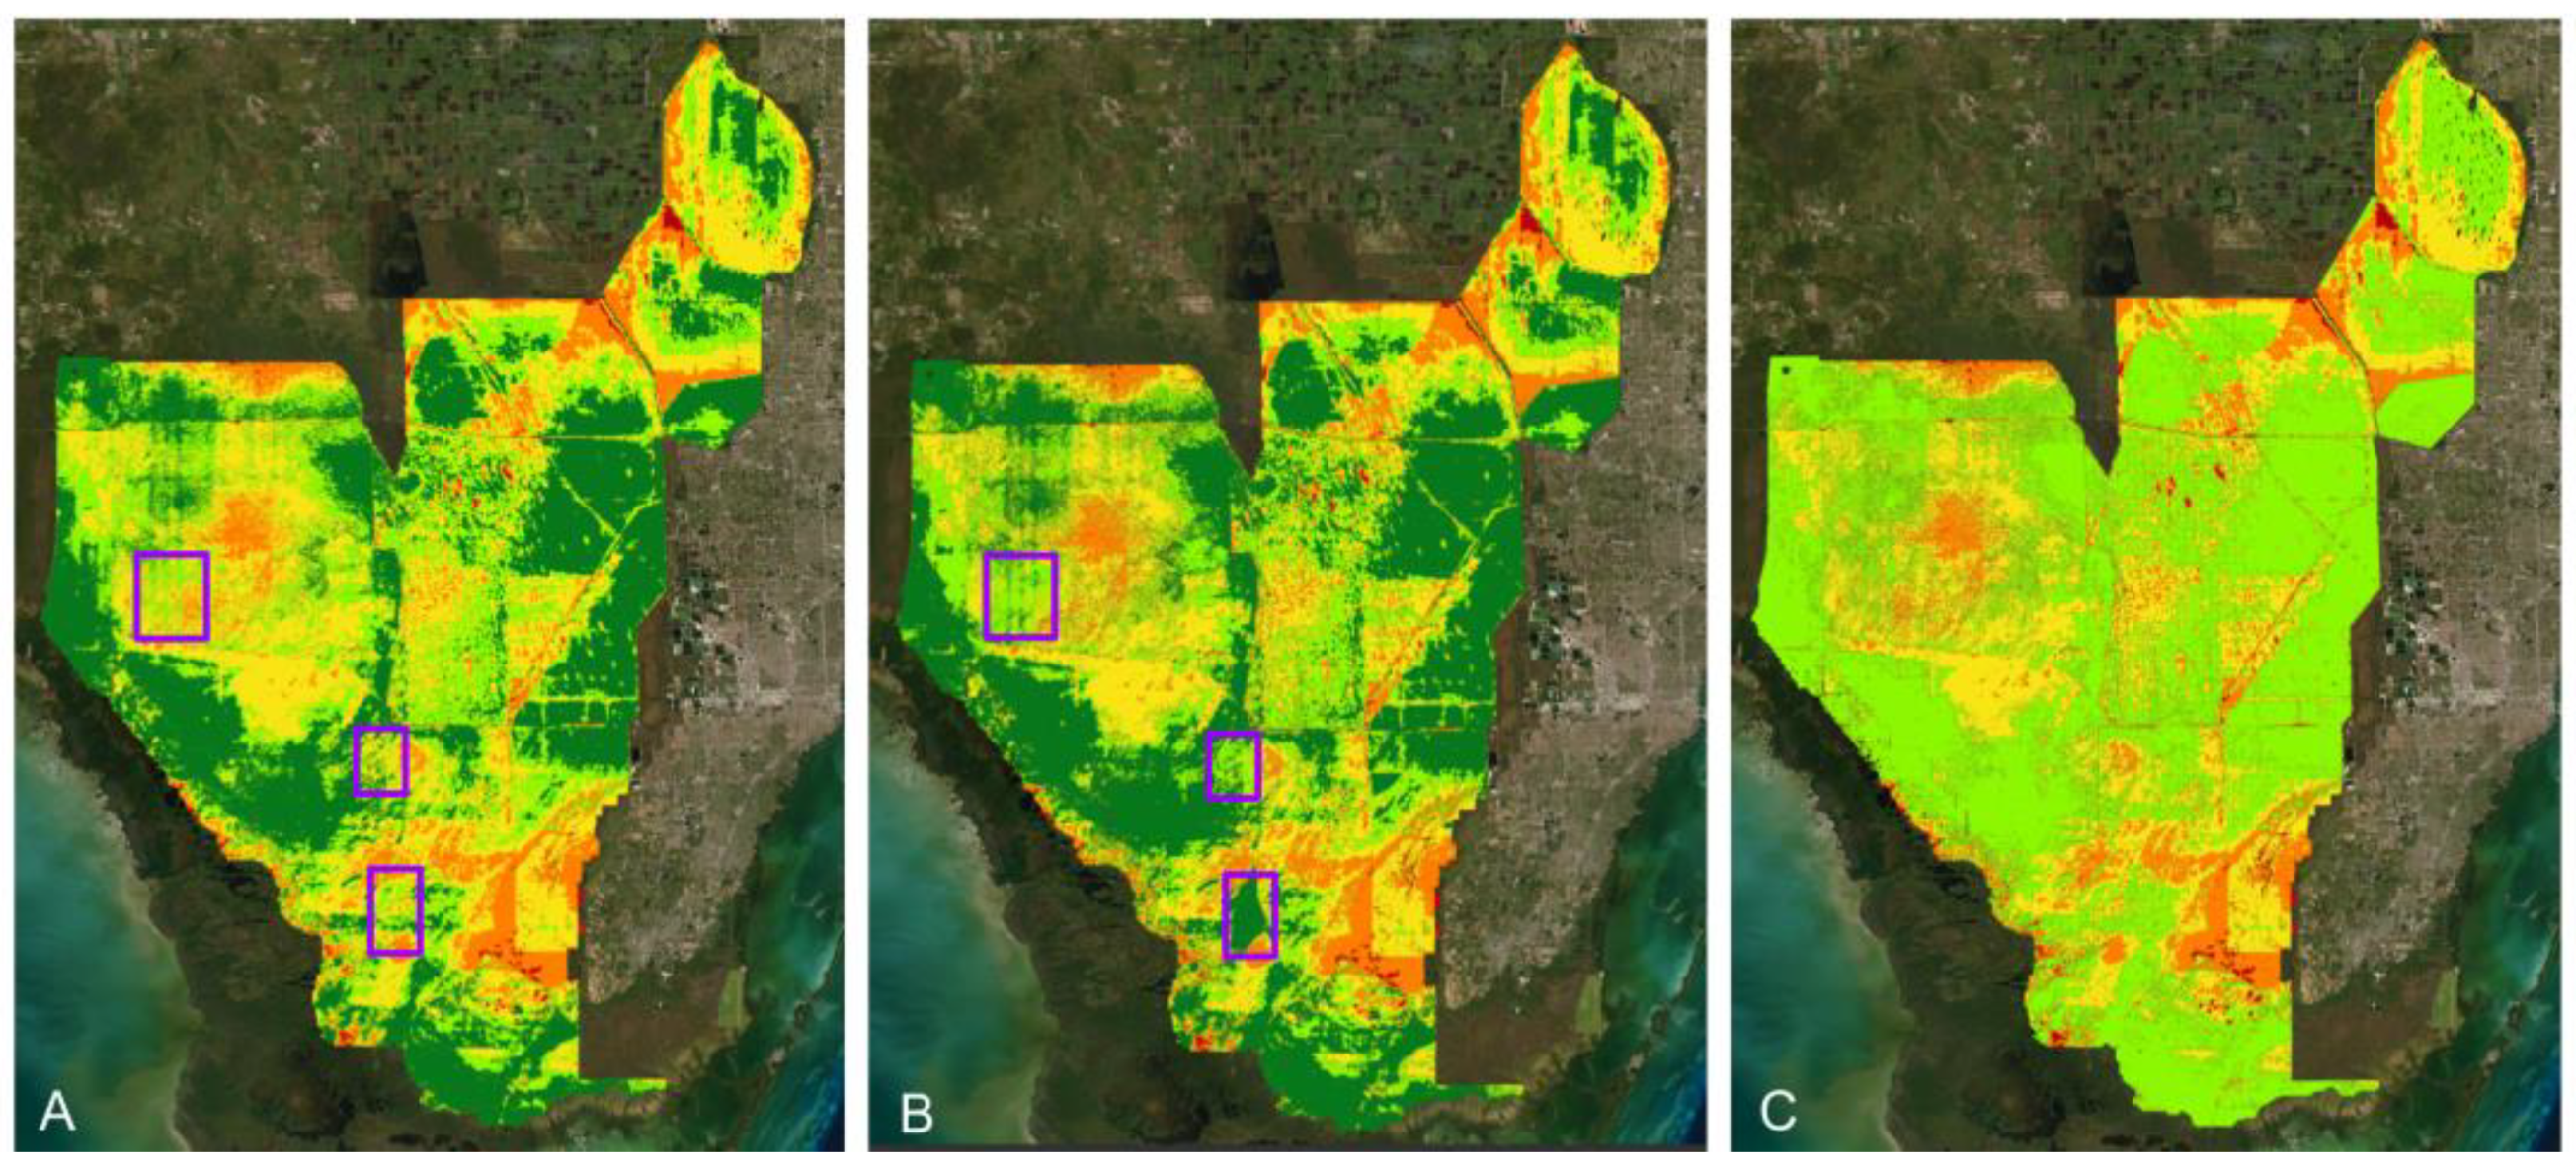
Figure 6.
Six years (2017–2022) of risk maps for the 15th of each month (January–July). January and February reliably support prescribed fire operations with limited precipitation and overall lower risk. March shows the transition from the prime months to conduct prescribed fires to April and May which mark the onset of wildfire season. June and July show decreased risk due to the return of more consistent rainfall that continues through late fall.
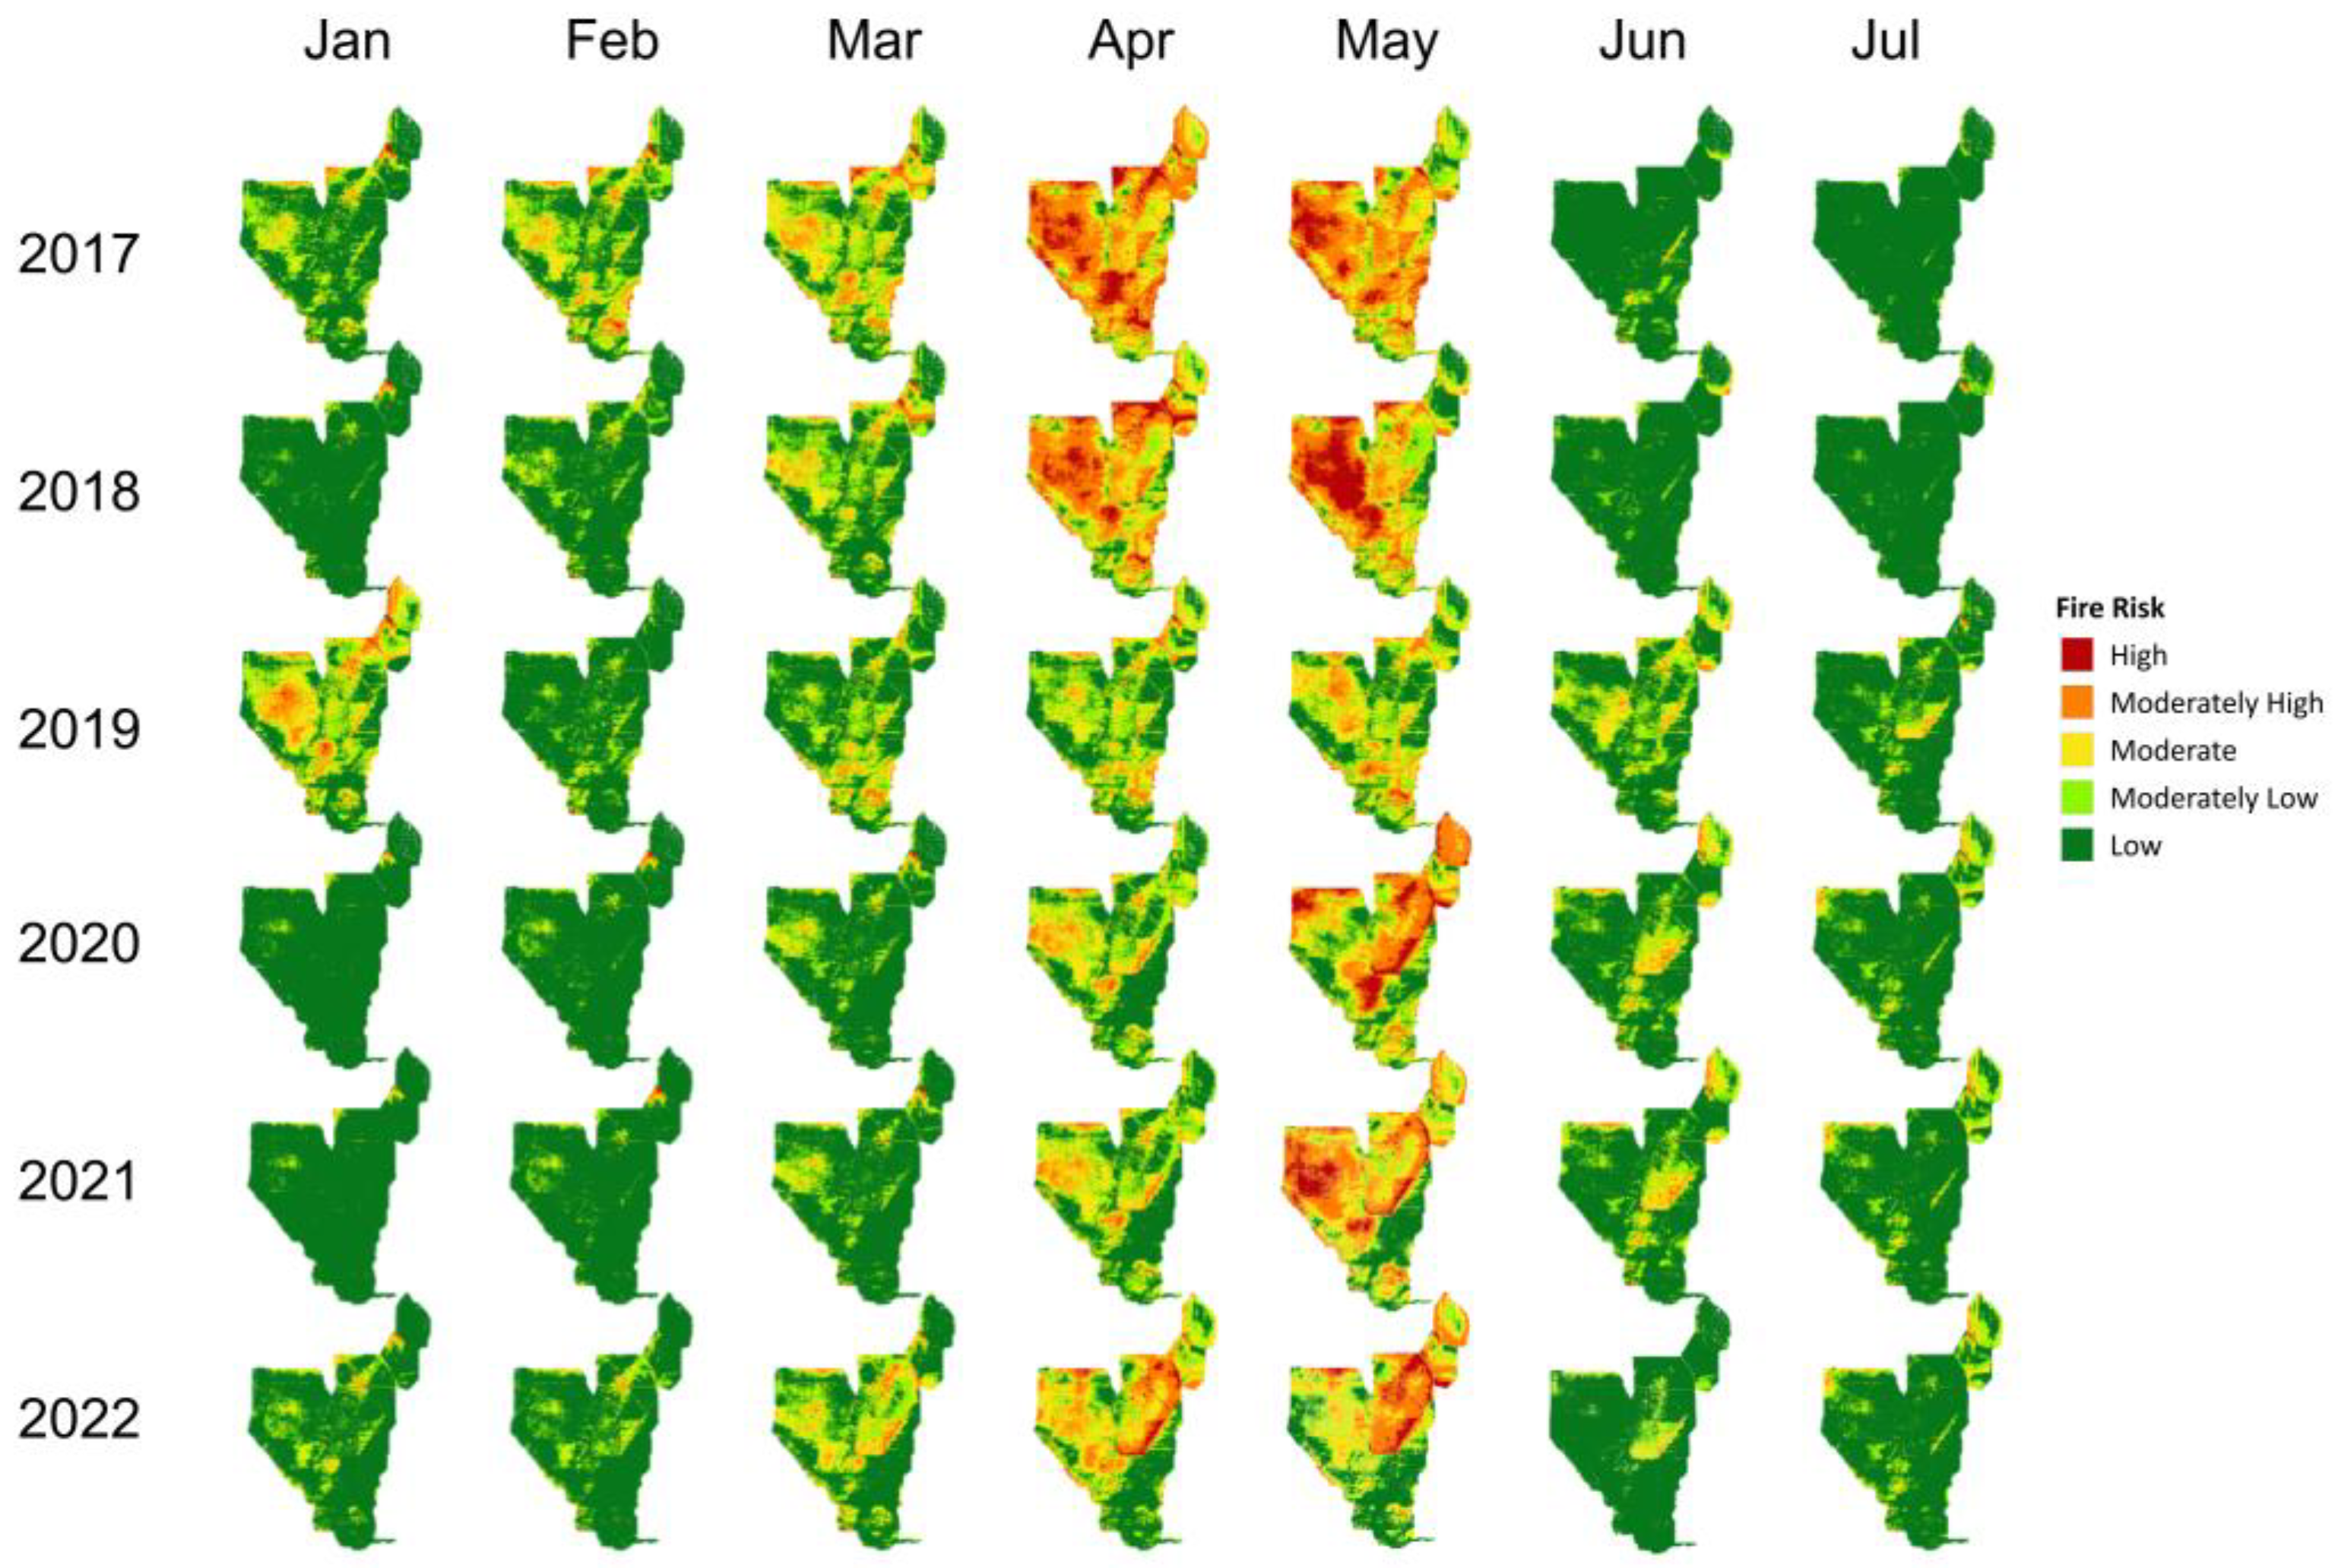
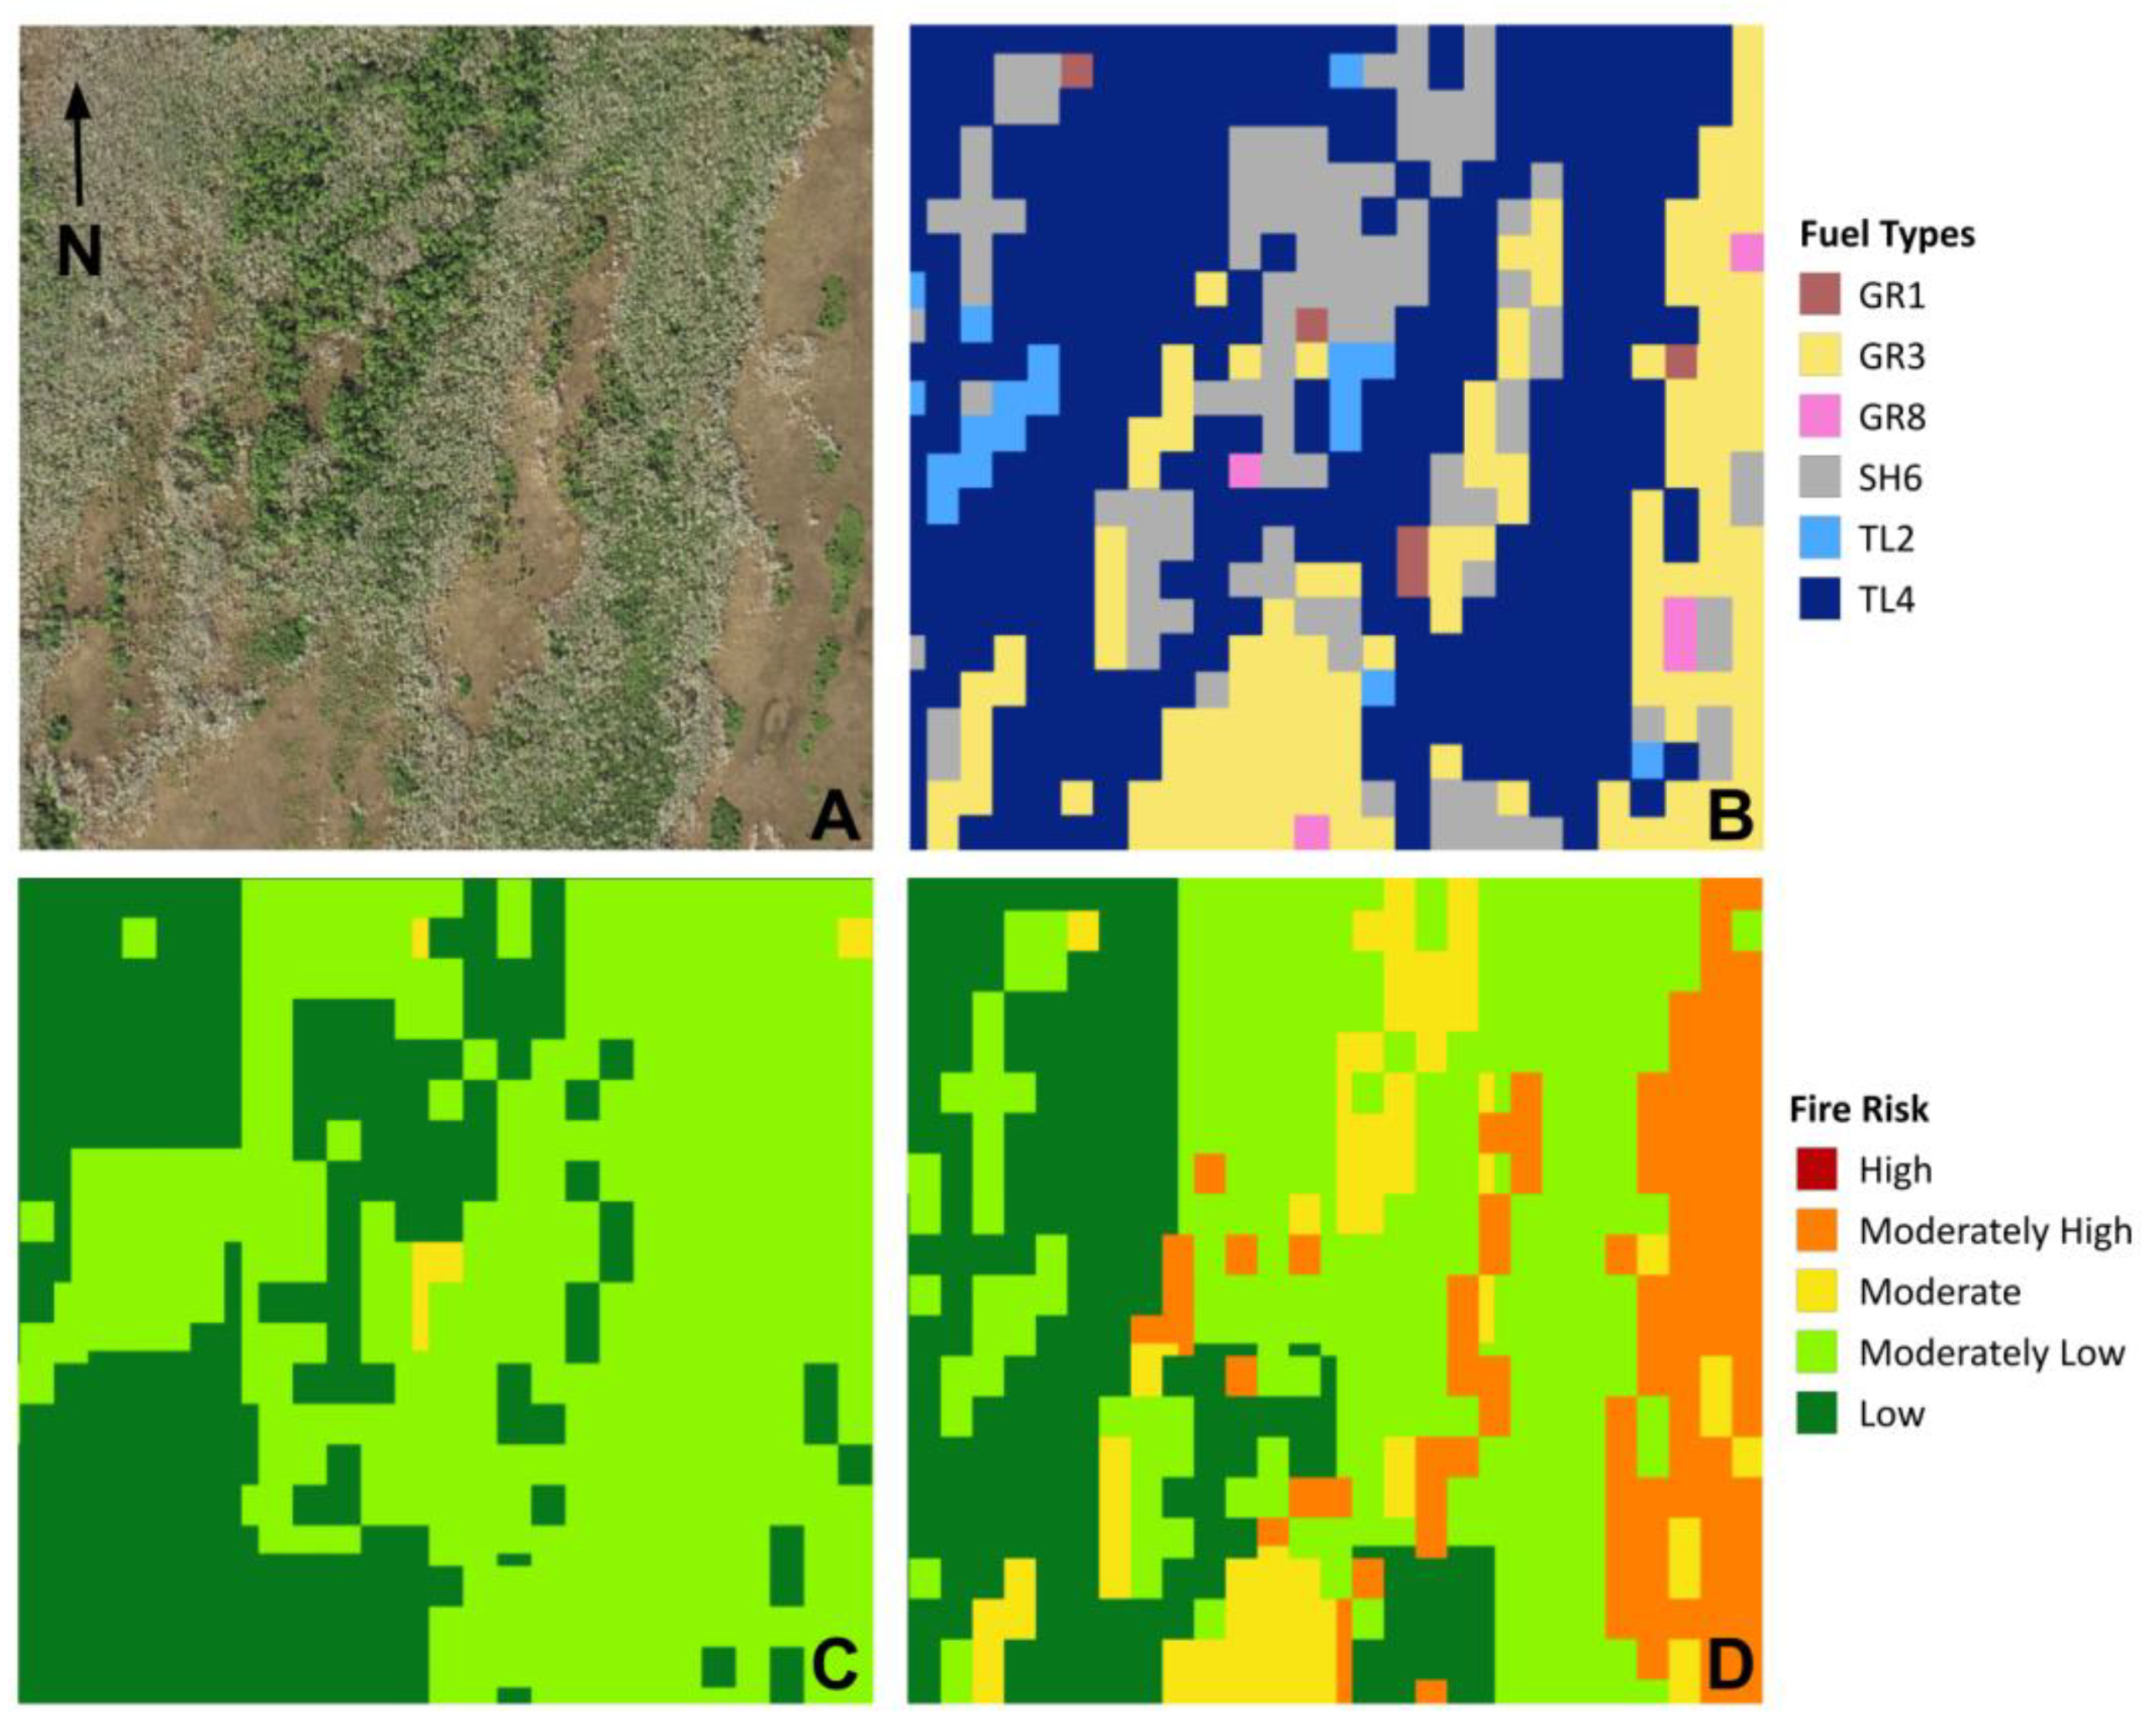
Figure 7.
(A) Aerial imagery capturing spring green-up within a cypress strand and surrounding vegetation in the Deep Lake management unit of Big Cypress National Preserve. (B) Subsequent panels show the same area; 30 m vegetation classification includes six different fuel types that are used to group different vegetation communities into fire behavior classes and evaluate historical water level risk. (C) Risk map created for 18 April 2019, using historical water levels and the standard risk percentiles for wildland fire management staffing (3/10/20/30). Map is dominated by low and moderately low risk, which may under-assign risk during this time of year when water levels are decreasing. (D) Modified risk map for 18 April 2019, using risk percentiles based on field validation of perceived risks from water levels in the six different fuel types. This map differs from map C in that moderately high-risk and moderate-risk areas pose a higher fire risk and correspond to the prairie (grassy fuel types) that dry out earlier and the pinelands that are on average drier than other fuel types.
Disclaimer/Publisher’s Note: The statements, opinions and data contained in all publications are solely those of the individual author(s) and contributor(s) and not of MDPI and/or the editor(s). MDPI and/or the editor(s) disclaim responsibility for any injury to people or property resulting from any ideas, methods, instructions or products referred to in the content. |
© 2023 by the authors. Licensee MDPI, Basel, Switzerland. This article is an open access article distributed under the terms and conditions of the Creative Commons Attribution (CC BY) license (https://creativecommons.org/licenses/by/4.0/).
Share and Cite
MDPI and ACS Style
Jones, K.; Vukomanovic, J. Mapping South Florida Daily Fire Risk for Decision Support Using Fuel Type, Water Levels, and Burn History. Fire 2023, 6, 236. https://doi.org/10.3390/fire6060236
AMA Style
Jones K, Vukomanovic J. Mapping South Florida Daily Fire Risk for Decision Support Using Fuel Type, Water Levels, and Burn History. Fire. 2023; 6(6):236. https://doi.org/10.3390/fire6060236
Chicago/Turabian StyleJones, Kate, and Jelena Vukomanovic. 2023. "Mapping South Florida Daily Fire Risk for Decision Support Using Fuel Type, Water Levels, and Burn History" Fire 6, no. 6: 236. https://doi.org/10.3390/fire6060236