Article

Influence of High Temperature on the Physical and Mechanical Properties of Porous Limestone from Baku (Azerbaijan)

1
Université de Strasbourg, Azerbaijan State Oil and Industry University, French Azerbaijani University, 183 Nizami Street, AZ1010 Baku, Azerbaijan
2
Université de Strasbourg, CNRS, Institut Terre et Environnement de Strasbourg, UMR 7063, 5 Rue René Descartes, F-67084 Strasbourg, France
3
Institut Universitaire de France (IUF), 1 Rue Descartes, F-75231 Paris, France
*
Authors to whom correspondence should be addressed.
Fire 2023, 6(7), 263; https://doi.org/10.3390/fire6070263
Submission received: 2 June 2023 / Revised: 22 June 2023 / Accepted: 30 June 2023 / Published: 2 July 2023

Abstract

:
Limestone is a popular building stone worldwide. In Baku in Azerbaijan, local limestones have been used in construction, including in the walled historic city centre (Old City, Icherisheher). Located in a seismically-active area, Baku is prone to post-earthquake fires that can damage buildings and monuments. Here, we test the fire resistance of local limestone by measuring its physical (connected porosity, permeability, P-wave velocity, thermal properties) and mechanical (uniaxial compressive strength, Young’s modulus) properties before and after thermal-stressing to temperatures up to 600 °C. Our results show that connected porosity and permeability increase and that P-wave velocity, thermal conductivity, thermal diffusivity, specific heat capacity, uniaxial compressive strength, and Young’s modulus decrease as a function of increasing temperature. Microstructural analyses show that these changes are the result of thermal microcracking. Samples heated to 800 °C disintegrated due to the formation of portlandite following decarbonation. The data presented herein will assist damage assessments of limestone buildings and monuments in Baku following the unfortunate event of fire.

1. Introduction

The use of limestone in construction is not only found all over the globe but it has also been used as a building material for more than four thousand years. Limestone has been used to construct ancient monuments and Wonders of the World, such as the Great Sphinx and Pyramids of Giza in Egypt [1,2], and modern monuments, such as the Arc de Triomphe in Paris (France) and the Lincoln Memorial in Washington (USA). As a result of this widespread use, in both space and time, understanding the susceptibility of limestone to damage is important for the conservation and preservation of many buildings and monuments worldwide.
Baku, the capital of Azerbaijan, is located on the southern coast of the Absheron Peninsula, a 30 km wide peninsula that extends into the Caspian Sea and represents the easternmost part of the Caucasus Mountains (Figure 1a). The abundance of limestone on the Absheron Peninsula has led to its wide use in the construction of buildings and monuments in the Baku area, including the walled historic city centre of Baku (Old City, Icherisheher; Figure 2; location shown in Figure 1b). Baku is located in a seismically-active region [3,4]. Alongside damage associated with earthquakes and aftershocks, post-earthquake fires in urbanised areas can also result in widespread damage to buildings and monuments [5]. Here, therefore, we present a study in which we investigated the influence of high temperature on the physical and mechanical properties of limestone used in construction in the Baku area.
Although no experimental studies exist for limestone from the Baku area, previous studies have sought to understand the influence of high temperature on the physical and mechanical properties of other limestones.
In terms of porosity, Zhang et al. [6] found that the connected porosity of low-porosity (porosity of 0.002) limestone from Longde (Ningxia Province, China) increased from ~0.002 to ~0.03 as the temperature was increased from 20 to 600 °C. Meng et al. [7] found that the porosity of a low-porosity (porosity of 0.0125) limestone from Xuzhuo (Jiangsu Province, China) increased from ~0.0125 to ~0.035 as the temperature was increased from 20 to 800 °C. Heap et al. [8] found that the connected porosity of two limestones from Sicily (Italy) increased from ~0.18 and ~0.25 to ~0.22 and ~0.58 following exposure to temperatures of 600 and 800 °C, respectively.
In terms of permeability, Lion et al. [9] found that the permeability of two samples of porous (porosity of 0.19) limestone from Bourgogne (France) increased from 4.45 × 10⁻¹⁶ to 4.65 × 10⁻¹⁶ m2 as the thermal-stressing temperature was increased from 25 to 150 °C, and increased from 4.40 × 10⁻¹⁶ to 4.80 × 10⁻¹⁶ m2 as the thermal-stressing temperature was increased from 25 to 250 °C. Homand-Etienne and Troalen [10] found that the permeability of two limestones with a porosity of ~10% and ~0% was increased by a factor of 1.5 and 4.4, respectively, following exposure to 700 °C.
In terms of P-wave velocity, Zhang et al. [6] found that the P-wave velocity of low-porosity (porosity of 0.002) limestone from Longde decreased from ~6.5 to ~1.5 km/s as the temperature was increased from 20 to 900 °C. Meng et al. [7] found that the P-wave velocity of low-porosity (porosity of 0.0125) limestone from Xuzhuo decreased from ~3.5 to ~1.25 km/s as the temperature was increased from 20 to 800 °C. Heap et al. [8] found that the P-wave velocity of two limestones from Sicily (Italy) decreased from ~4.5 to ~2 km/s as the temperature increased from 20 to 800 °C. Hu et al. [11] found that the P-wave velocity of limestone collected near the city of Shijiazhuang (China) decreased from ~5.2 km/s at 100 °C to ~2.9 km/s at 500 °C. The P-wave velocity of two limestones from Adana (Turkey) was reduced from ~5 km/s at 650 °C to ~2.5 km/s at 1050 °C [12]. Finally, Homand-Etienne and Troalen [10] found that the P-wave velocity of two limestones with a porosity of ~10% and ~0% was reduced by ~50% and ~80%, respectively, following exposure to 700 °C.
In terms of thermal properties, Zhang and Lv [13] showed that the thermal conductivity and specific heat capacity of limestone from Shandong Province (China) were reduced as a function of increasing temperature. For example, thermal conductivity was reduced from ~1.5 W/mK at 20 °C to ~0.9 W/mK at 600 °C [13]. The thermal conductivity of low-porosity (porosity of 0.006) limestone from Chenghe coal mine (Shaanxi Province, China) was found to decrease from ~3.0 to ~0.8 W/mK as the temperature was increased from 20 to 1000 °C [14]. These authors also showed that the exposure to high-temperature decreased and increased the thermal diffusivity and specific heat capacity, respectively, of the same limestone. Hu et al. [11] found that the thermal conductivity of limestone collected near the city of Shijiazhuang decreased from ~3.0 W/mK at 100 °C to ~1.9 W/mK at 500 °C.
In terms of rock mechanical properties, Zhang et al. [15] found that the uniaxial compressive strength and Young’s modulus of low-porosity (porosity of 0.002) limestone from Linyi (Shandong Province) decreased as a function of increasing temperature. These authors found, for example, that uniaxial compressive strength decreased from ~150 to ~75 MPa as the temperature was increased from 20 to 600 °C [15]. Mao et al. [16] found that the uniaxial compressive strength and Young’s modulus of limestone from Xuzhuo decreased as a function of increasing temperature and that the decrease in these properties was large above a temperature of 600 °C, above the temperature required for decarbonation. Similar results for limestone from Xuzhuo were found by Meng et al. [17]. Heap et al. [8] found that the uniaxial compressive strength of two limestones from Sicily decreased by ~35% and ~10%, respectively, at the maximum thermal stressing temperature (650 and 700 °C, respectively). Meng et al. [7] also showed that the rate of decrease in the strength of limestone from Xuzhuo as a function of increasing temperature did not appreciably change under confining pressures up to 30 MPa. Castagna et al. [18] found that temperature did not appreciably influence the compressive strength of Comiso limestone (Italy; porosity of ~0.09) at a confining pressure of 15 MPa at temperatures up to 450 °C, but that compressive strength was reduced from ~160 to ~130 MPa as the temperature was increased to 600 °C. At a confining pressure of 50 MPa, Comiso limestone transitioned from brittle to ductile behaviour at temperatures ≥ 400 °C [19]. The tensile strength of limestone from Shandong Province was reduced from ~7 MPa at 20 °C to ~3.5 MPa at 600 °C [13]. Hu et al. [11] found that the tensile strength of limestone collected near the city of Shijiazhuang decreased from ~6.5 MPa at 100 °C to ~4.3 W/mK at 500 °C.
The above-mentioned studies have shown that the porosity and permeability of limestone increase and that the P-wave velocity, thermal properties, uniaxial compressive strength, and Young’s modulus of limestone decrease, as a function of increasing temperature. Changes to the physical and mechanical properties of limestone as a function of temperature in these studies have generally been interpreted as a result of thermal microcracking at low temperatures (<600 °C) and decarbonation at high temperatures (>600 °C). However, not only have limestones commonly used in construction in and around Baku not been assessed in terms of their fire resistance, the majority of previous experimental studies have investigated the influence of high temperature on low-porosity limestones. By contrast, the limestones used in construction in the Baku area are often very porous and composed of small (<1 mm) shells (Figure 2). Here, therefore, we present the results of an experimental study designed to understand the influence of high temperature (up to 800 °C) on the physical and mechanical properties of limestone used in construction in and around Baku.

2. Materials and Methods

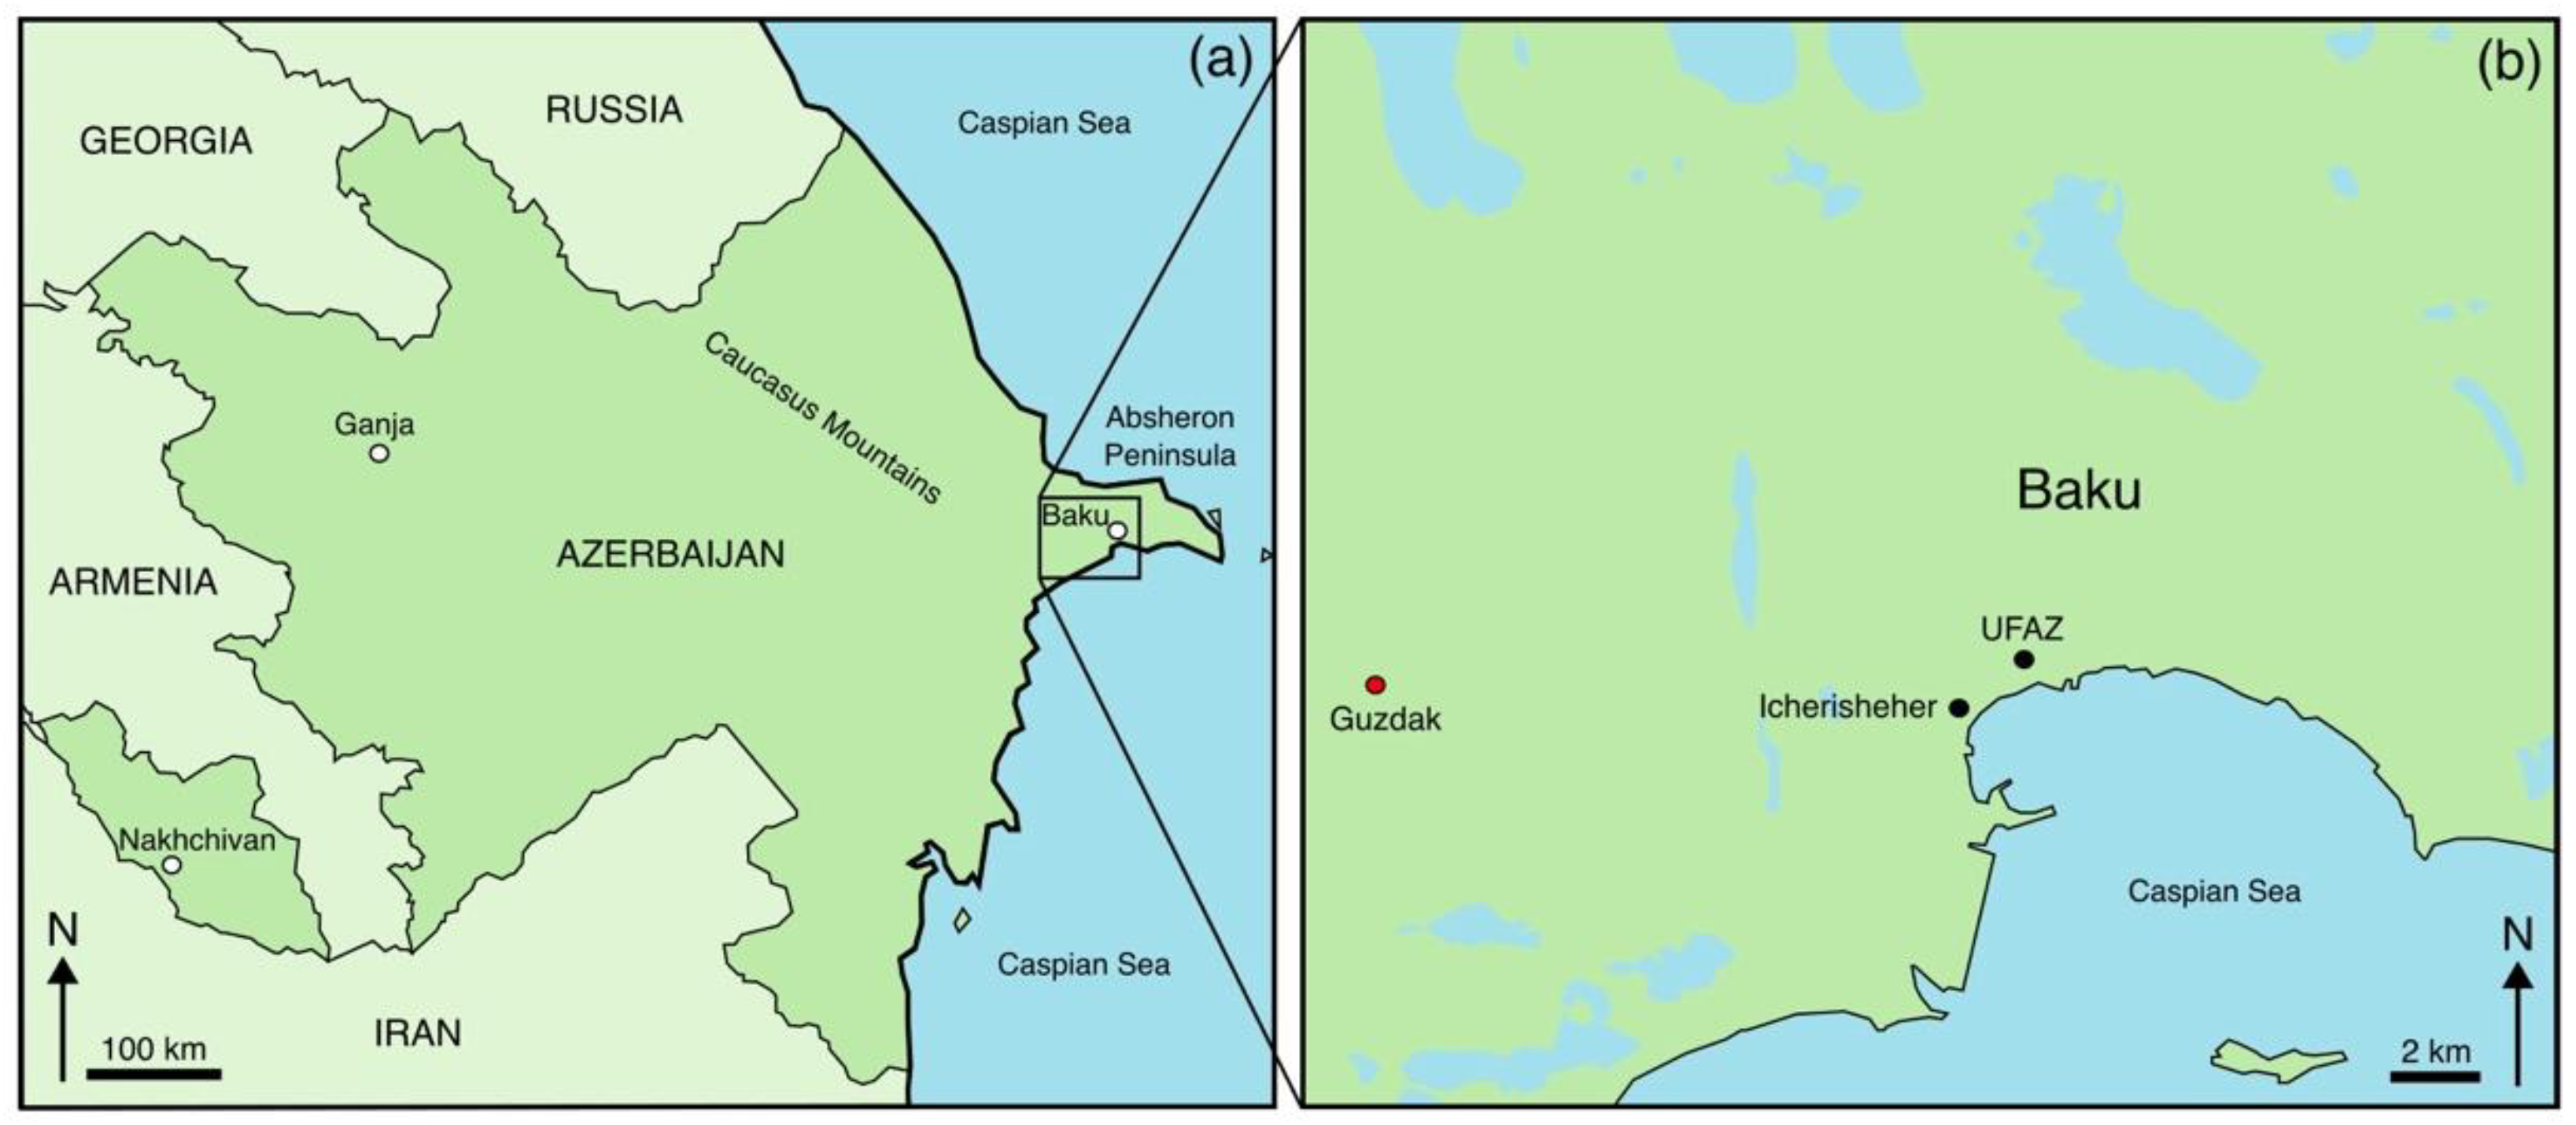
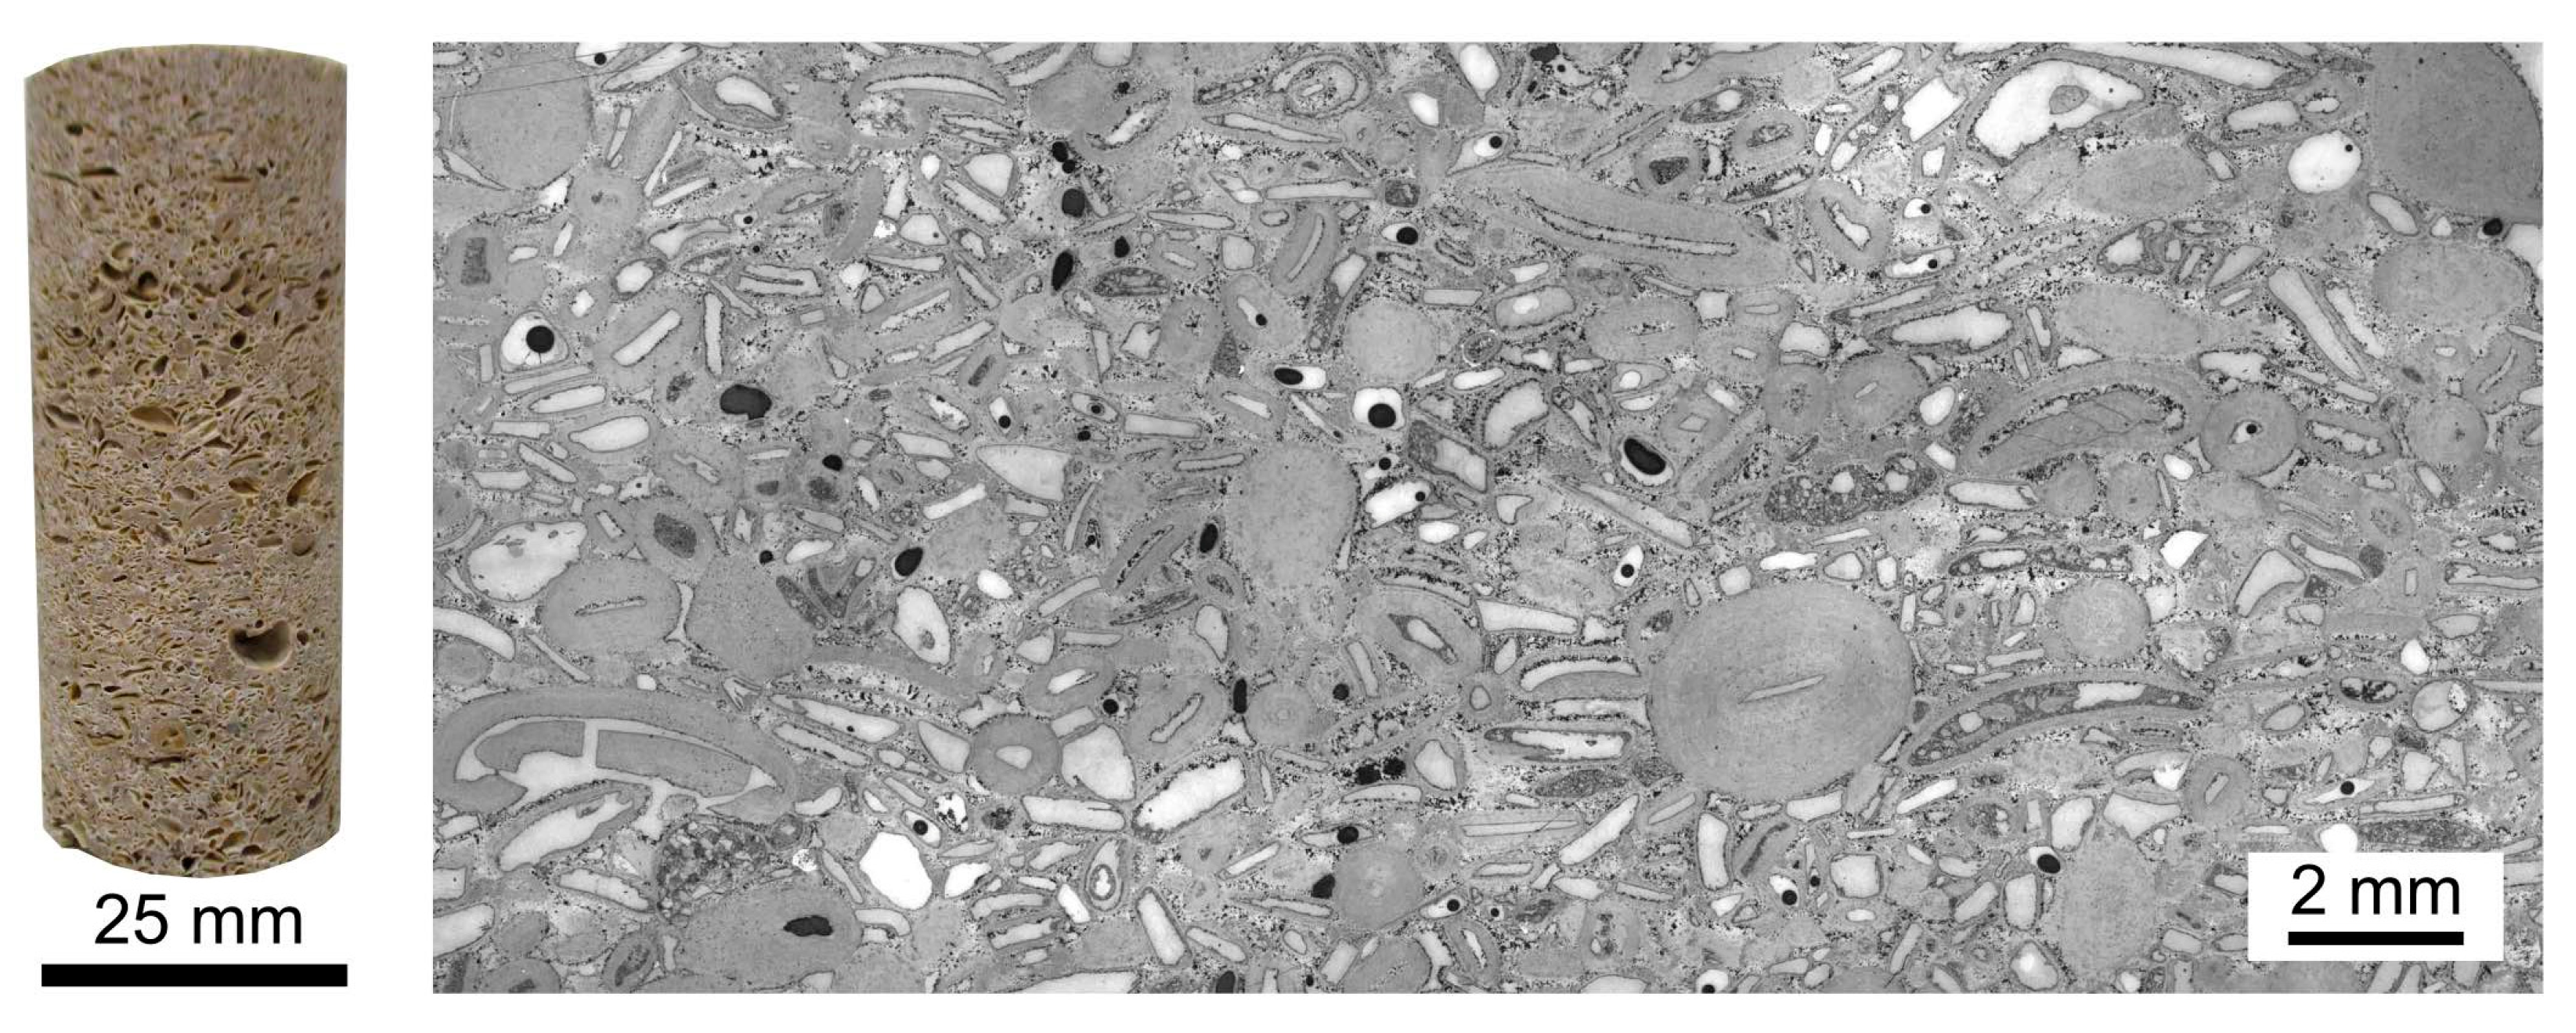
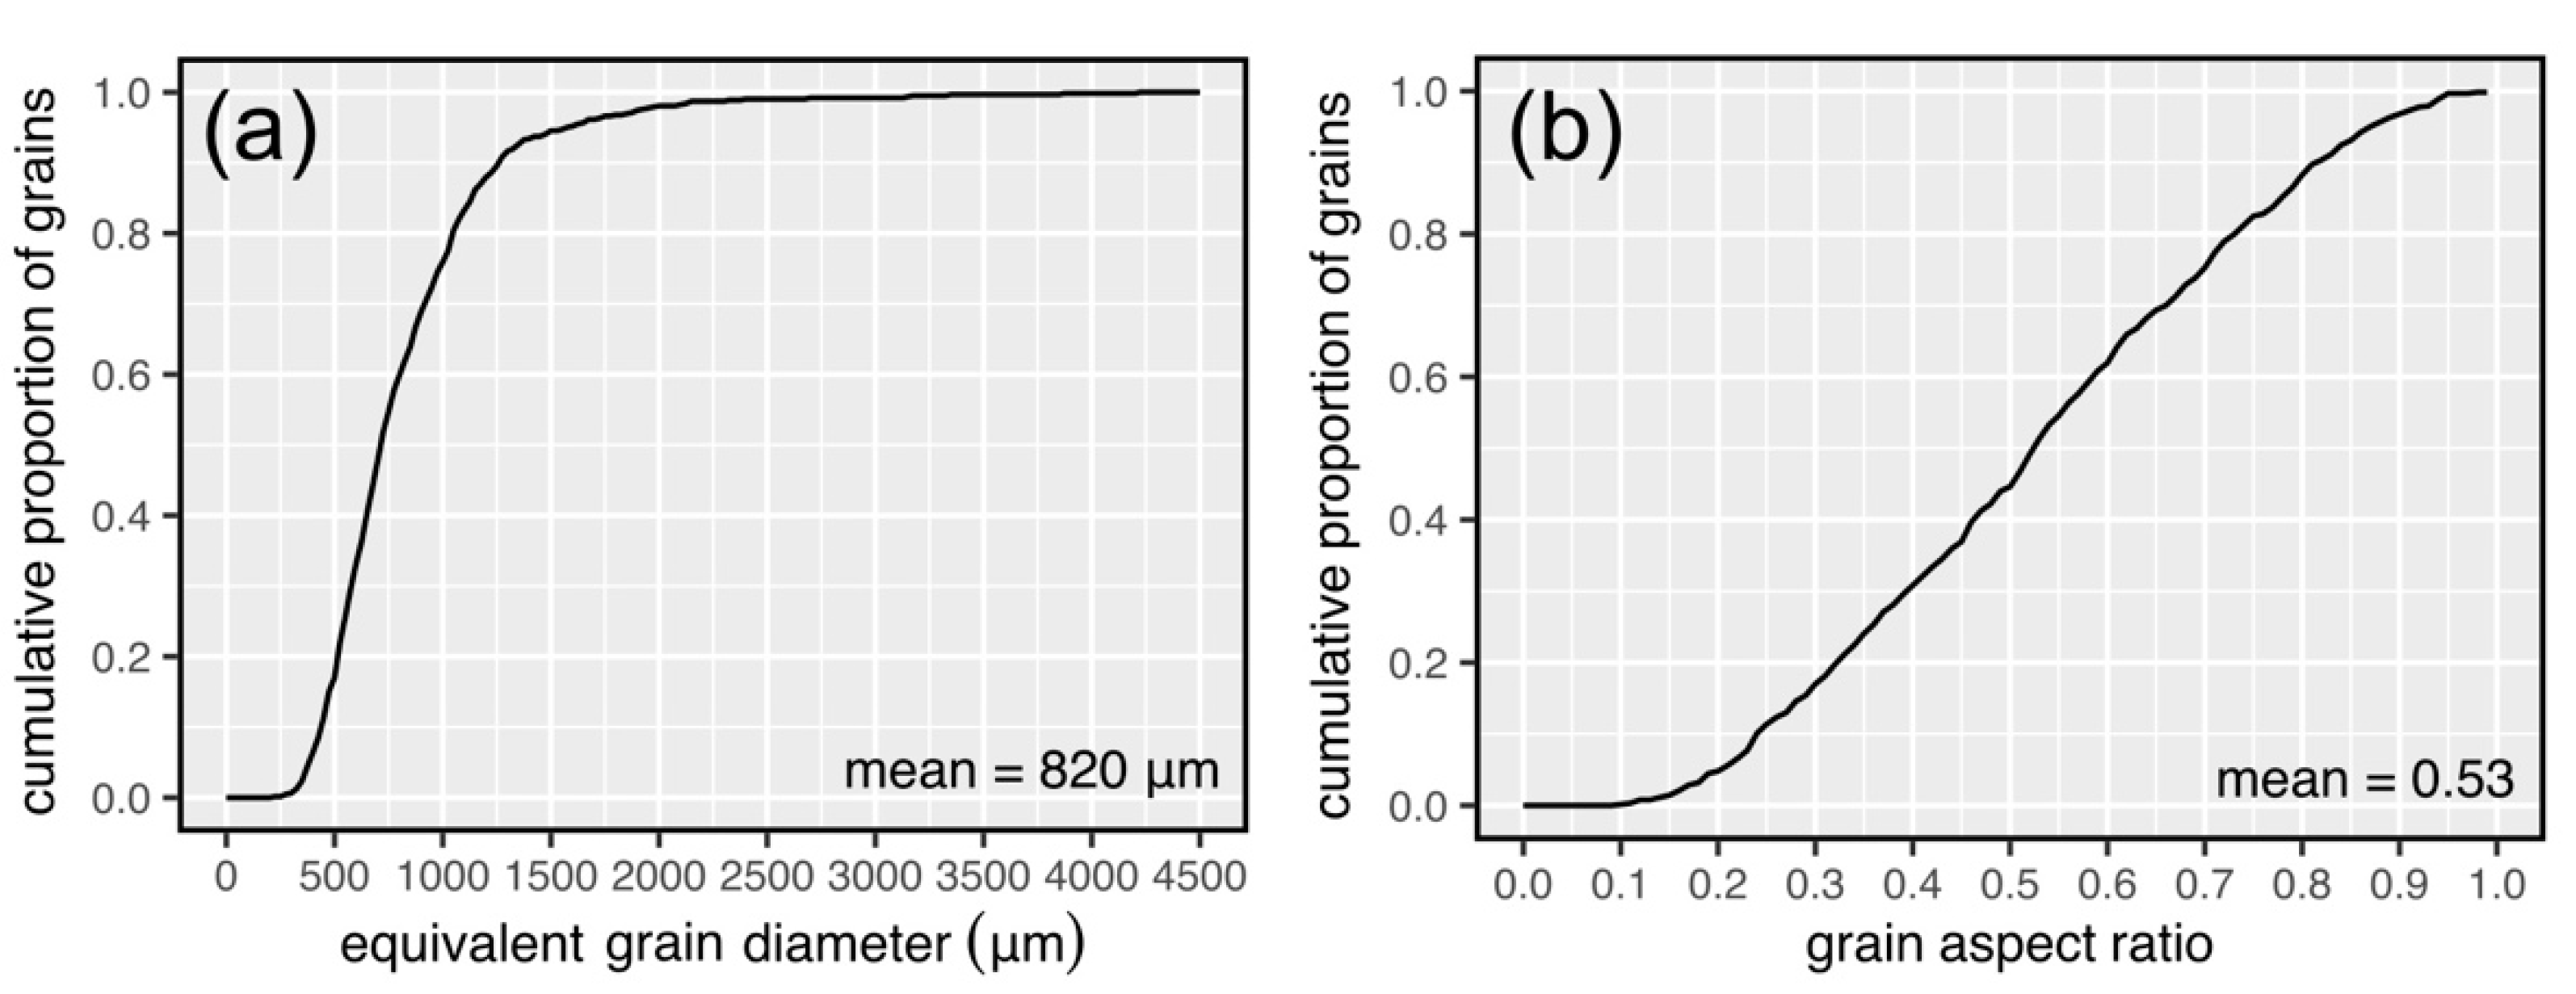
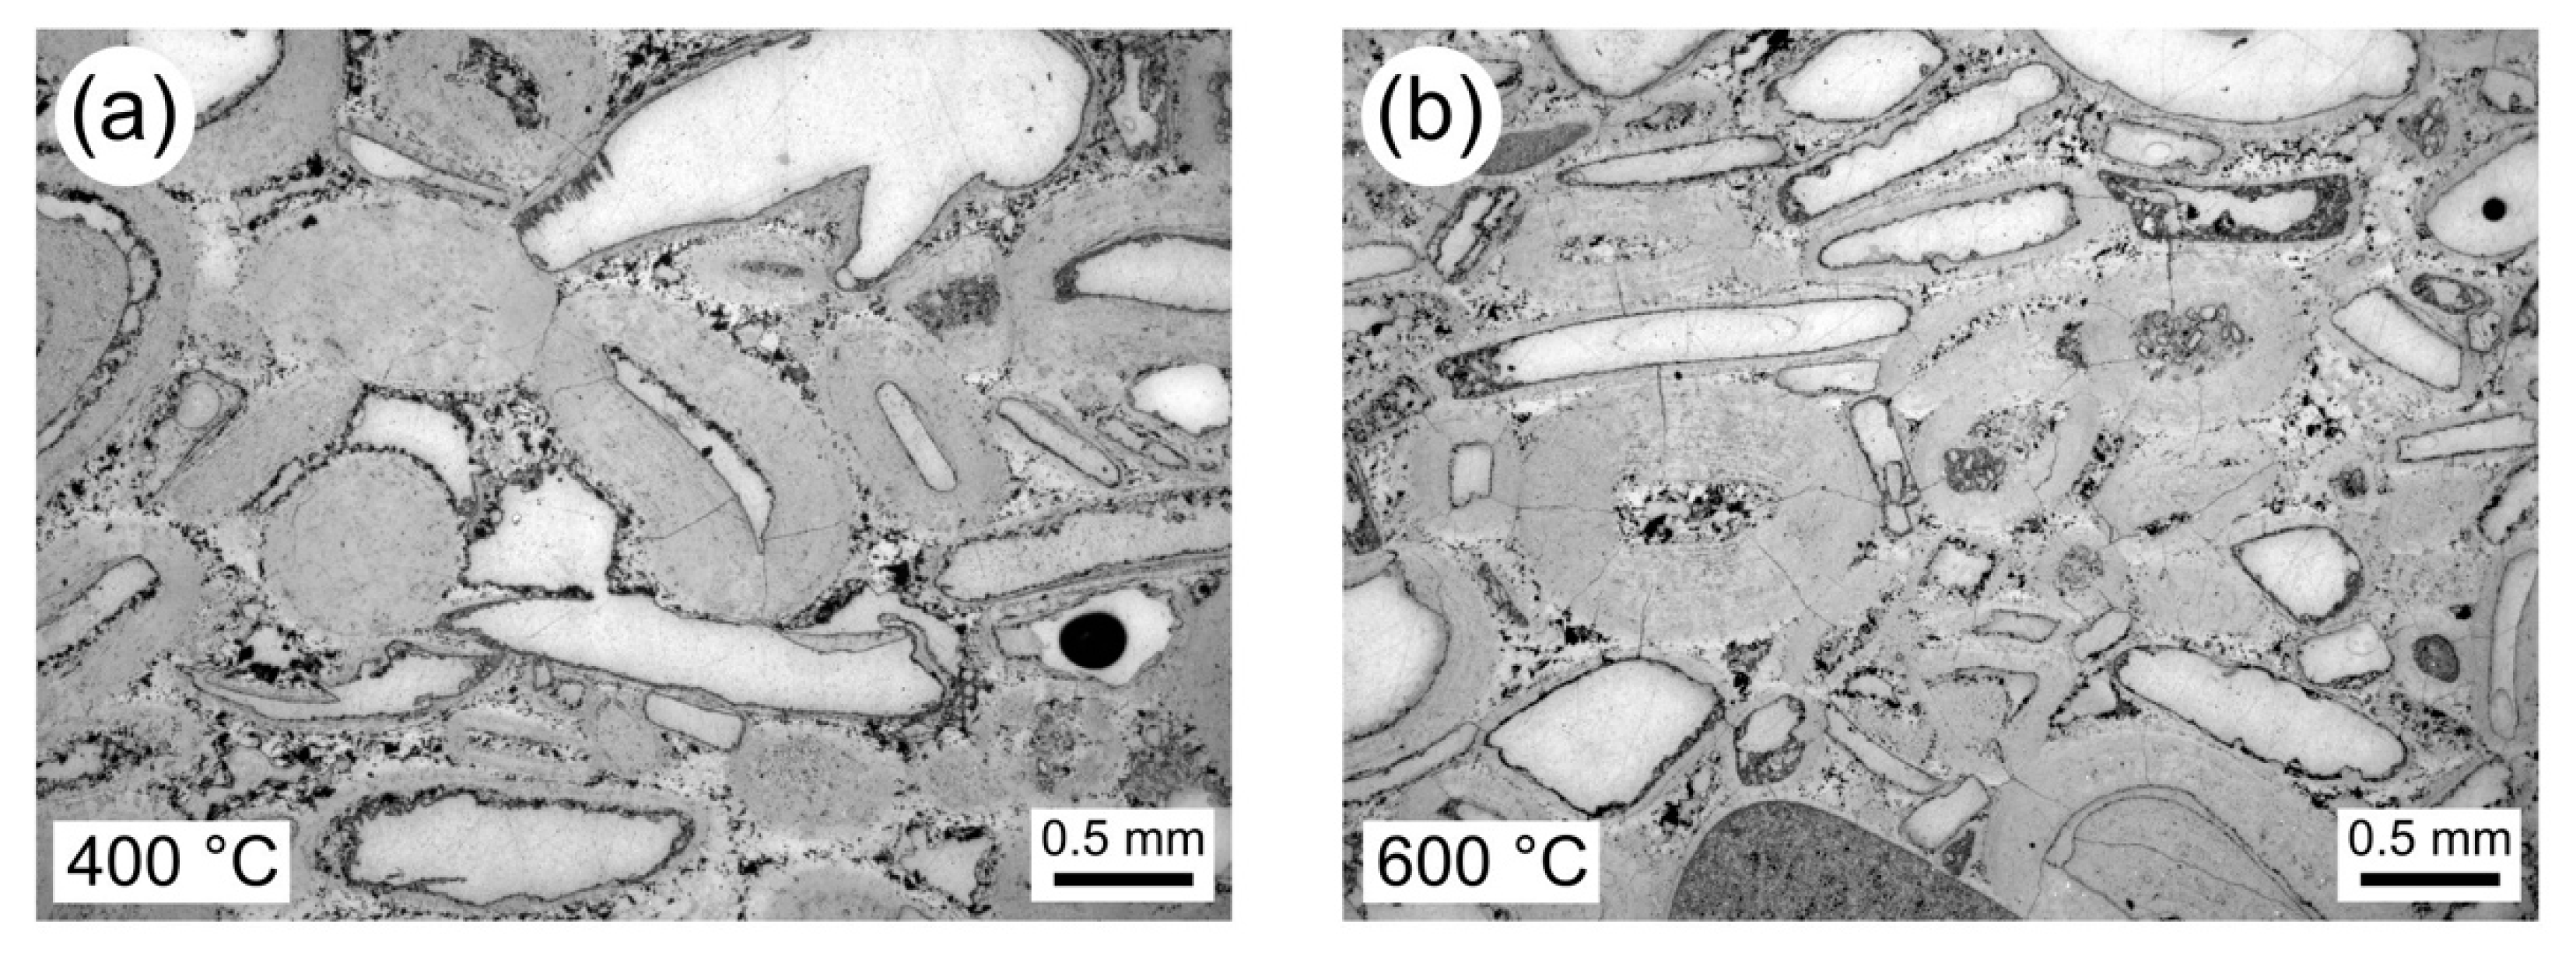
2.1. Sample Description and Microstructural Characterisation

The block of limestone used for this study was collected from a quarry in Guzdak, a village about 20 km west of Baku (Figure 1b). The limestone is a porous, shelly oolitic limestone (Figure 3). The ooids and shells within the limestone (typically <1 mm) are surrounded by sparry calcite cement (Figure 3). The ooids are typically round in shape, whereas the shells are characterised by low aspect ratios (minor grain axis divided by the major grain axis) (Figure 3).
To characterise the microstructural heterogeneity of the studied limestone, we provide here a grain size and shape analysis. To do so, we manually drew around all the grains within a selected optical microscope image using open-source vector graphics program Inkscape. We then analysed these grains using open-source image analysis software ImageJ. Using ImageJ, we determined the equivalent grain diameter and the grain aspect ratio of each grain (n = 623). The equivalent grain diameter, d , was calculated using d = 3 / 2 d F , where d F is the average Feret diameter. The aspect ratio of each grain was calculated as the minor grain axis divided by the major grain axis (an aspect ratio of unity therefore represents a perfect circle). The results of this microstructural characterisation are shown in Figure 4.
The data in Figure 4 show that the grains within the studied limestone are large (Figure 4a) and vary widely in terms of their shape (Figure 4b). Figure 4a shows that the majority of grains are between an equivalent diameter of ~250 to ~1250 μm, with a mean diameter of 820 μm. Some grains, however, are a couple of mm in diameter (Figure 4a). Figure 4b shows that the majority of grains have an aspect ratio between 0.2 and 0.9, with a mean aspect ratio of 0.53. The large variation in the aspect ratio seen in Figure 4b is the result of the circular or subcircular ooids and the elongated and flattened shells within the studied limestone (Figure 3).

2.2. Sample Preparation and Experimental Methods

Twelve cylindrical samples, 25 mm in diameter and nominally 60 mm in length, were prepared from the block collected. All samples were cored in the same direction. These samples were then washed with water and dried in a vacuum oven at 40 °C for at least 48 h. The experimental work was split into two parts. First, we measured the physical properties (bulk density, connected porosity, permeability, P-wave velocity, and thermal properties) of the intact samples. Second, we thermally stressed ten of the samples to different temperatures (two each at 100, 200, 400, 600, and 800 °C, keeping two samples intact to serve as a reference) in an electronic high-temperature furnace and remeasured their physical properties. Finally, we performed uniaxial compressive strength (UCS) tests on the samples (those thermally stressed and the two samples that were kept intact) to obtain Young’s modulus and UCS.

2.2.1. Bulk Density and Connected-Porosity Measurements

Dry bulk sample density, ρ b , was calculated using the dry mass (measured using an electric balance) and the dimensions (measured using digital calipers) of each sample. Connected porosity, ϕ c , was calculated using the sample volume, V b , measured using digital calipers, and the skeletal (connected) volume measured using a helium pycnometer (Mircomeritics AccuPyc II), V s , where ϕ c = 1 V s / V b . Total porosity, ϕ t , was also determined using the dry bulk sample density and the density of calcite, ρ c a l c i t e (taken as 2700 kg/m3), where ϕ t = 1 ρ b / ρ c a l c i t e . This latter method assumes that the rock is composed entirely of calcite and was used to determine the mineral content of the studied limestone.

2.2.2. Permeability Measurements

Permeability was measured using a benchtop gas (nitrogen) permeameter (see schematics in [20,21]) at ambient temperature and under a confining pressure of 1 MPa using either the steady-state method (for high-permeability samples) or the pulse-decay method (for low-permeability samples). For the steady-state experiments, steady-state volumetric flow rates were measured (using a gas flowmeter) for six different pore pressure differentials (measured using a pressure transducer). Pulse-decay measurements were performed by monitoring the decay of a pressure differential over time (measured using a pressure transducer). These data were used to calculate permeability using Darcy’s law. When necessary, the data were corrected using the Klinkenberg or Forchheimer corrections. For more details on the experimental procedure and the equations involved, see Heap et al. [22].

2.2.3. P-Wave Velocity Measurements

P-wave velocity was measured along the sample axis of dry samples at ambient pressure and temperature. The samples were held in a custom-built jig (see schematic in Heap et al. [23]) under an axial stress of 1 MPa to ensure a good contact between the sample and the endcaps containing the piezoelectric sensors. The frequency of the signal, generated using a waveform generator, was set at 700 Hz, and the travel time was measured using a digital oscilloscope.

2.2.4. Thermal Property Measurements

Thermal conductivity and thermal diffusivity were measured using a Hot Disk® TPS 500 Thermal Constants Analyser using the transient plane source (TPS) method [24,25,26]. For the thermal property measurements, the samples were grouped into pairs of similar porosity (or, following thermal stressing, samples that were thermally stressed to the same temperature). Thermal conductivity and thermal diffusivity were measured using a sensor sandwiched between the two samples, consisting of two 10 μm thick nickel foil spirals (radius of 3.189 mm) encased and insulated by 30 μm thick Kapton. The samples were held in place using a screw positioned at the top of the sample jig, which ensured good contact between the sensor and the surface of the samples. All measurements were made at ambient pressure and temperature. For more details on the experimental procedure, including schematics of the device, see Heap et al. [25,26].

2.2.5. Uniaxial Compressive Strength (UCS) and Young’s Modulus

Uniaxial compressive strength was measured using a uniaxial load frame (see schematic in Heap et al. [23]). Dry samples were deformed at ambient temperature at an axial strain rate of 10−5 s−1 until macroscopic failure. Axial displacement and axial force were measured during the experiment using a linear variable differential transducer and a load cell, respectively, and were converted to axial strain and axial stress using the sample dimensions. Static Young’s modulus was calculated using the stress-strain data from the elastic portion of the experiments (as per the method outlined in Heap et al. [25]).

3. Results

3.1. Physical Property Data for Intact Samples

The average connected porosity of the studied limestone was measured to be 0.28 (Table 1). The connected porosity of the ten samples did not vary greatly: the highest and lowest values of connected porosity were 0.27 and 0.29, respectively (Table 1). More sample-to-sample variability was observed for P-wave velocity, thermal conductivity, thermal diffusivity, and specific heat capacity (Table 1). P-wave velocity varied from 4.00 to 4.48 km/s (average of 4.20 km/s), thermal conductivity from 1.188 to 1.374 W/mK (average of 1.299 W/mK), thermal diffusivity from 0.670 to 1.094 mm2/s (average of 0.921 mm2/s), and specific heat capacity from 0.622 to 0.914 kJ/kgK (average of 0.739 kJ/kgK) (Table 1). A large sample-to-sample variability was observed for permeability, which varied from 1.83 × 10⁻¹⁸ to 8.83 × 10⁻¹⁶ m2 (average of 2.26 × 10⁻¹⁶ m2) (Table 1). We find that the total porosity, calculated using the density of calcite, is essentially the same as the connected porosity, suggesting that the studied limestone is composed of 100%, or close to 100%, calcite (as a result, we only show connected porosity in Table 1).

3.2. Thermal Stressing the Limestones

Photographs of an intact sample and samples thermally stressed to 100, 200, 400, and 600 °C are shown in Figure 5. The original cream colour of the limestone changed to red at 400 °C (Figure 5d) and grey at 600 °C (Figure 5e). The two samples thermally stressed to 800 °C turned white and, following several hours outside of the high-temperature furnace, expanded considerably and disintegrated. As a result, we do not report physical and mechanical property measurements for the samples thermally stressed to 800 °C in the following subsections.

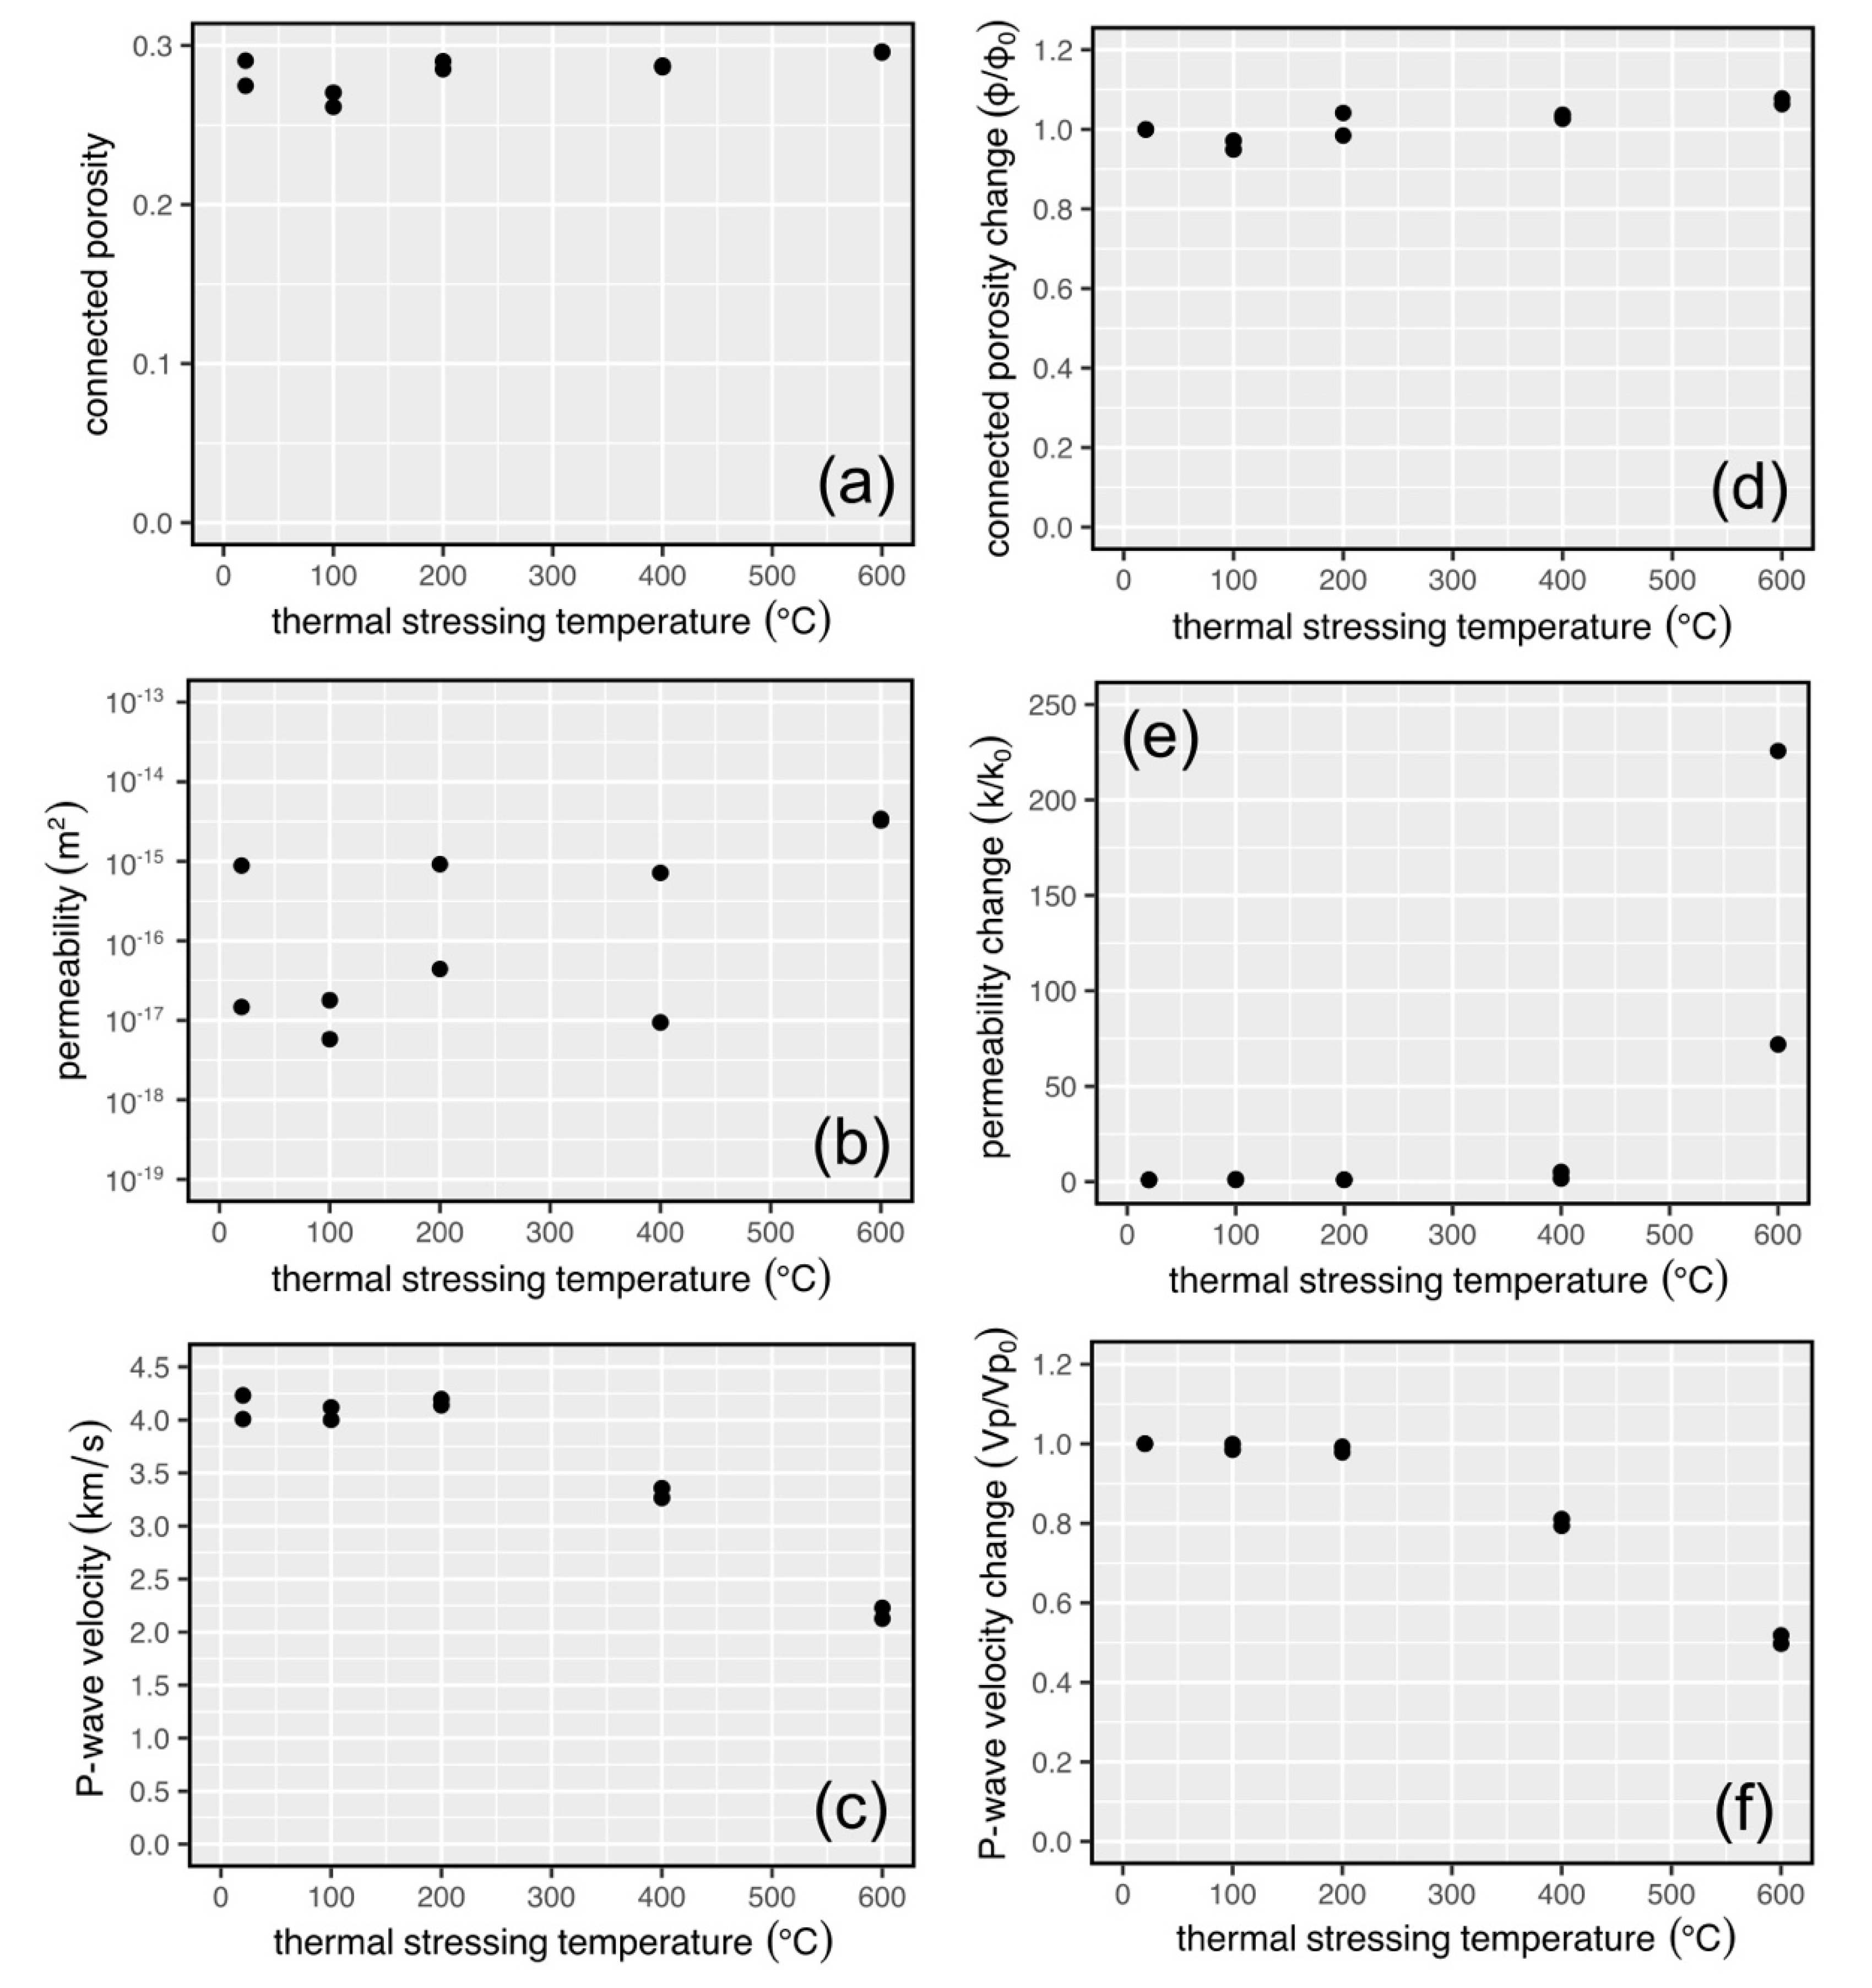
3.3. Physical Property Data for Thermally Stressed Samples

Connected porosity, permeability, and P-wave velocity are shown as a function of thermal stressing temperature in Figure 6. We plot in Figure 6 the absolute value of connected porosity (Figure 6a), permeability (Figure 6b), and P-wave velocity (Figure 6c) (data are also available in Table 2) but, because these physical properties varied for the intact samples (Table 1), we also provide the relative change of the three properties in Figure 6d, Figure 6e and Figure 6f, respectively. We find that the connected porosity of the samples increases, but not significantly, as a function of thermal stressing temperature (Figure 6a,d). For example, samples heated to 600 °C have increased in connected porosity by about 0.01 (Table 2). Despite this modest increase in connected porosity, permeability (Figure 6b,e) and P-wave velocity (Figure 6c,f) increased and decreased, respectively, as a function of thermal stressing temperature. Permeability increased by a factor of more than 200 (Figure 6e), and P-wave velocity decreased by a factor of 2 (Figure 6f). For both permeability and P-wave velocity, notable changes were observed following exposure to temperatures at or above 400 °C; at temperatures below 400 °C, changes were either small or insignificant.
Thermal conductivity, thermal diffusivity, and specific heat capacity are shown as a function of thermal stressing temperature in Figure 7. We plot in Figure 7 the absolute value of thermal conductivity (Figure 7a), thermal diffusivity (Figure 7b), and specific heat capacity (Figure 7c) (data are also available in Table 2) but, because these physical properties varied for the intact samples (Table 1), we also provide the relative change of the three properties in Figure 7d, Figure 7e and Figure 7f, respectively. We find that thermal conductivity, thermal diffusivity, and specific heat capacity all decrease as a function of increasing thermal stressing temperature (Figure 7; Table 2). For all three thermal properties, notable decreases were observed following exposure to temperatures at or above 400 °C; at temperatures below 400 °C, decreases were either small or insignificant.

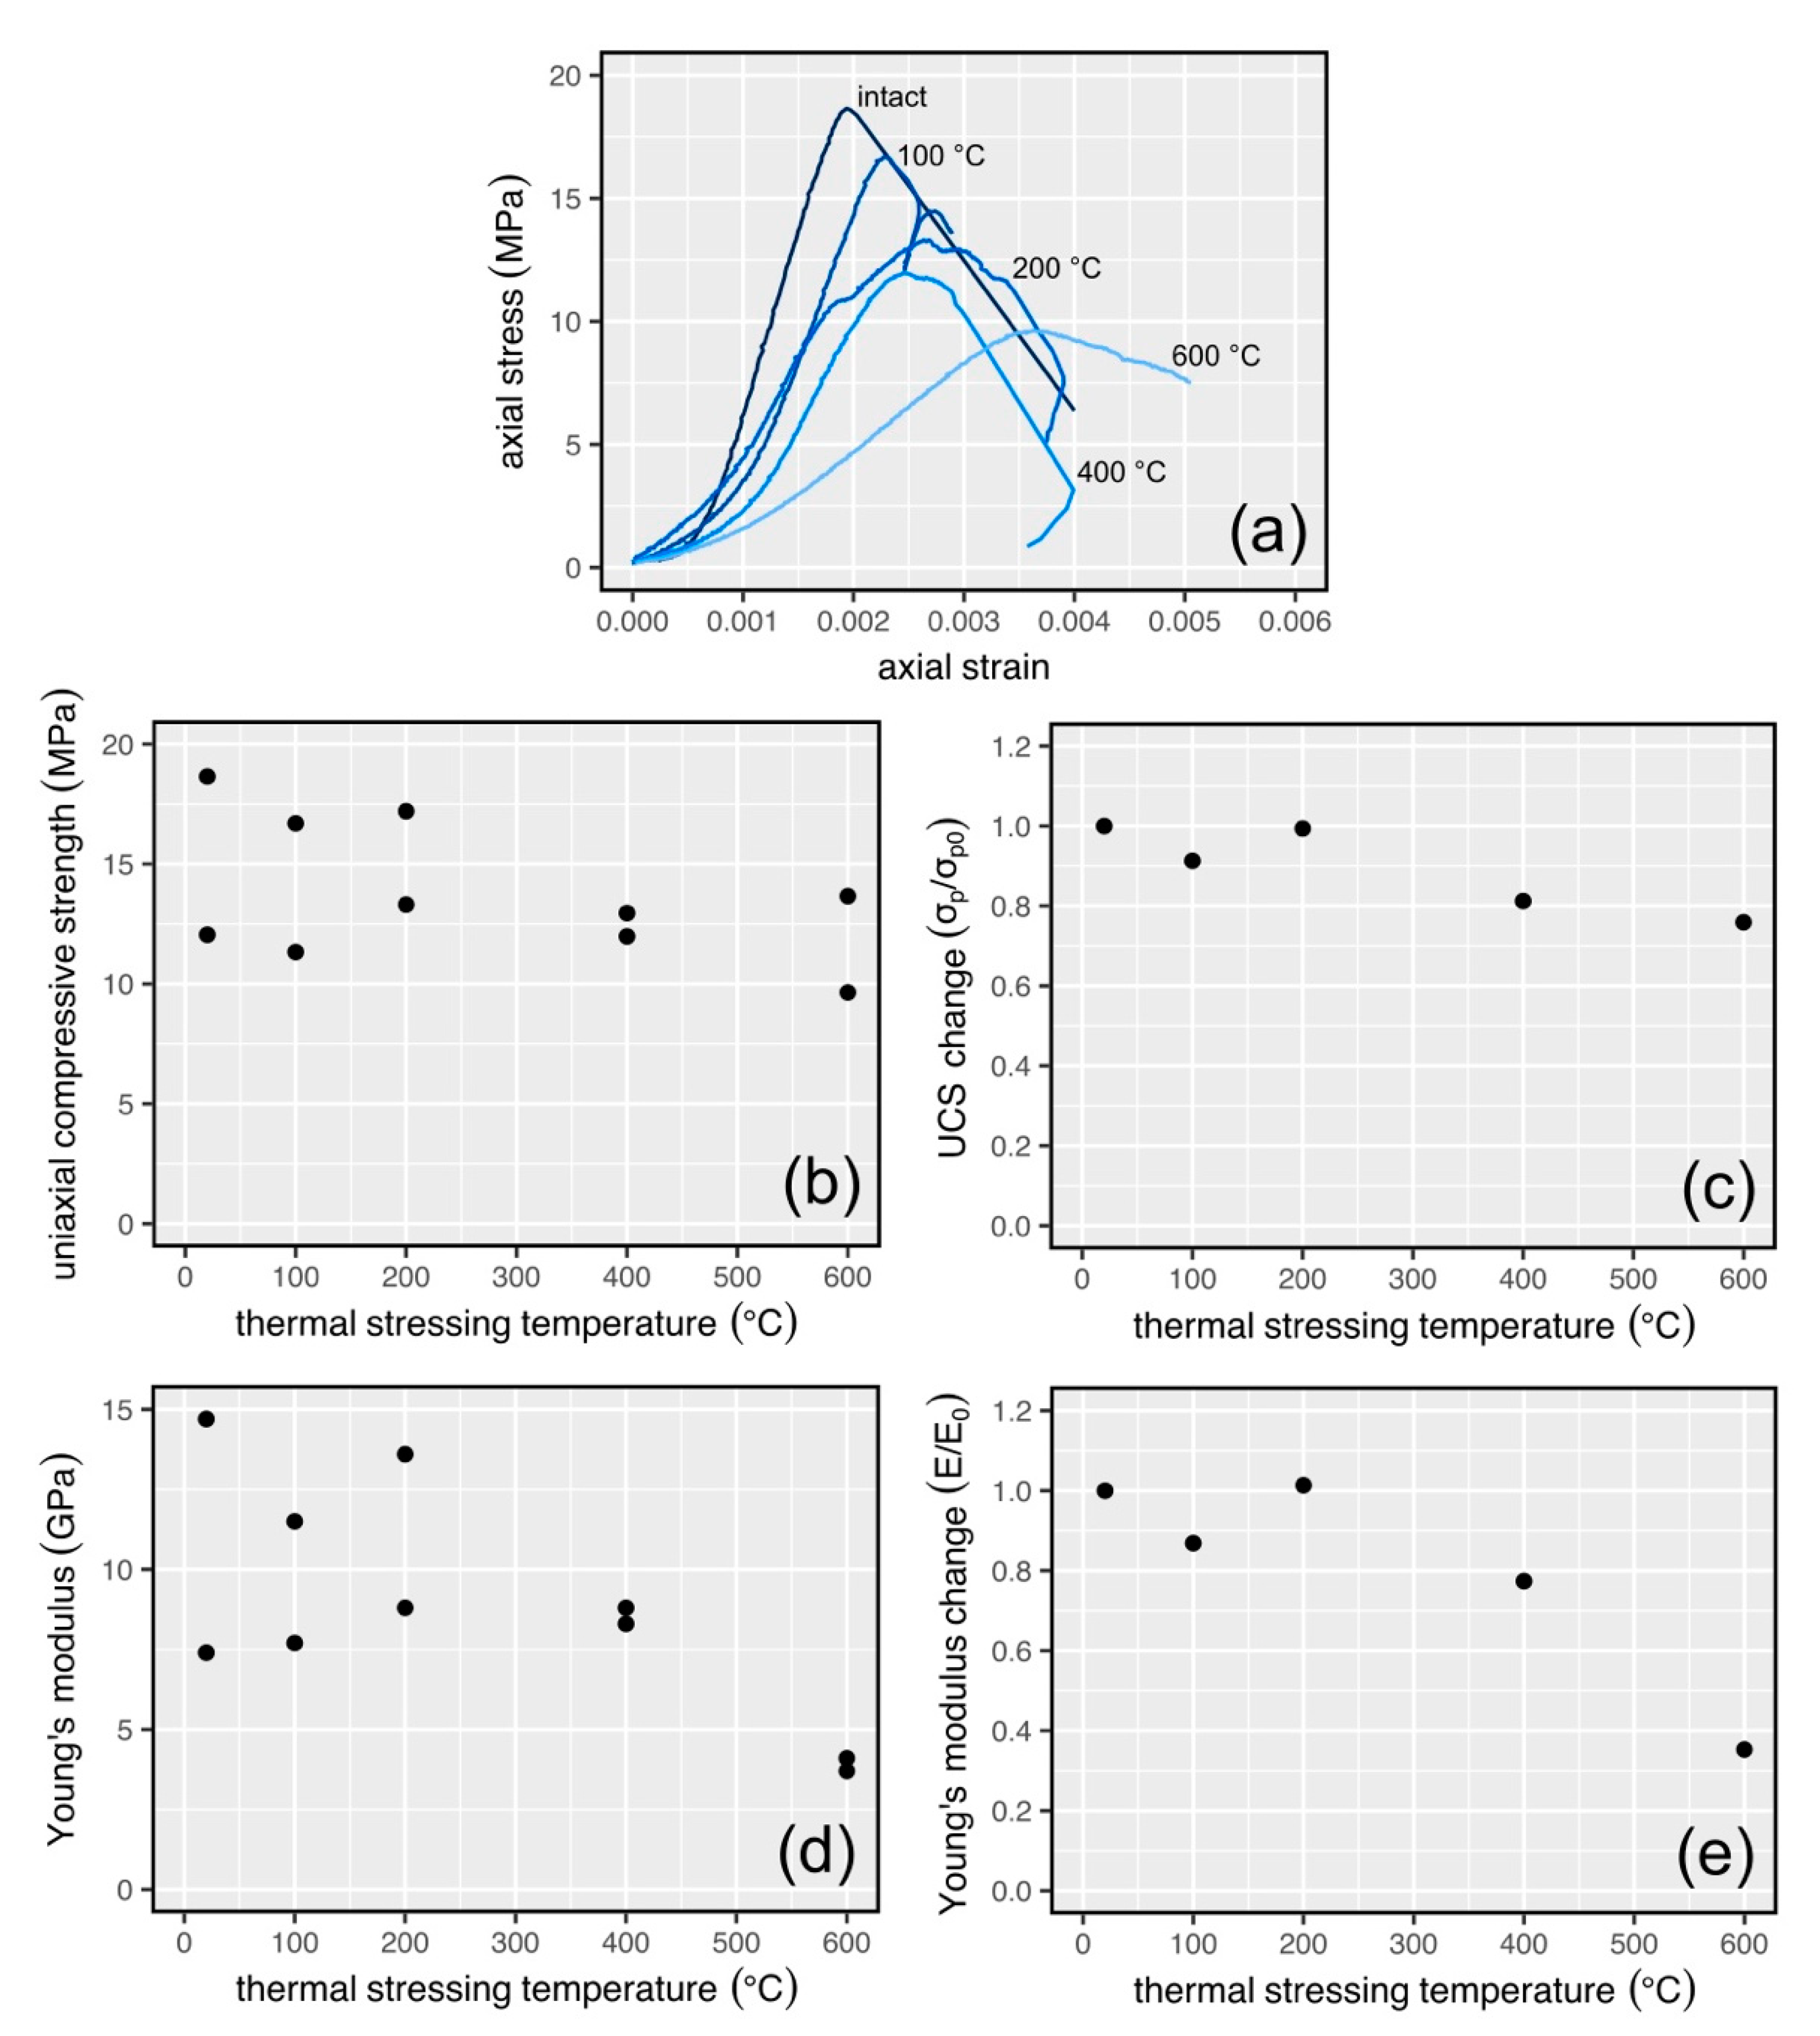
3.4. Mechanical Property Data for Thermally Stressed Samples

UCS and Young’s modulus are shown as a function of thermal stressing temperature in Figure 8. We plot in Figure 8 the absolute value of UCS (Figure 8b) and Young’s modulus (Figure 8d) (data are also available in Table 3). We also provide the relative change of UCS and Young’s modulus in Figure 8c,e (here, we used the average value of the two measurements for each thermal stressing temperature). We also provide representative uniaxial stress-strain curves for experiments performed on samples from each thermal stressing temperature in Figure 8a. We find that UCS (Figure 8b,c) and Young’s modulus (Figure 8d,e) decrease as a function of increasing thermal stressing temperature. For example, at the maximum thermal stressing temperature, UCS (Figure 8c) and Young’s modulus (Figure 8e) decreased by ~20% and ~60%, respectively.

4. Discussion

4.1. Interpretation of the Physical and Mechanical Property Data

Our data show that connected porosity and permeability increase and that P-wave velocity, thermal conductivity, thermal diffusivity, specific heat capacity, uniaxial compressive strength, and Young’s modulus decrease as a function of increasing temperature (Figure 6, Figure 7 and Figure 8). Typically, changes to the physical and mechanical properties of the limestone are more pronounced at temperatures of 400 °C and above (Figure 6, Figure 7 and Figure 8). To understand why these changes occurred, we prepared thin sections of samples thermally stressed to temperatures of 400 and 600 °C (Figure 9). The optical microscope images provided in Figure 9 show that the sample heated to 400 °C contains microcracks within the grains forming the rock (Figure 9a) and, at 600 °C, we observe more microcracks (Figure 9b). These microcracks formed due to the build-up of stress at the contacts between neighbouring grains resulting from their thermal expansion at high temperature [27]. The formation of microcracks following the thermal stressing of rock has previously been observed to increase permeability [28,29] and porosity and decrease P-wave velocity [29,30], thermal properties [31], uniaxial compressive strength [32,33], and Young’s modulus [33].
The samples heated to 800 °C turned white and, following several hours outside of the high-temperature furnace, expanded considerably and disintegrated. We note that 800 °C is above the temperature required for decarbonation, a process that converts calcium carbonate to calcium oxide and carbon dioxide gas [34,35]. The calcium oxide then reacts with atmospheric water to form portlandite (calcium hydroxide) [36]. The formation of portlandite is exothermic and results in a considerable volume increase. This volume increase resulted in the expansion and disintegration of the sample, as also observed by Heap et al. [8] for limestone samples heated above their decarbonation temperatures.

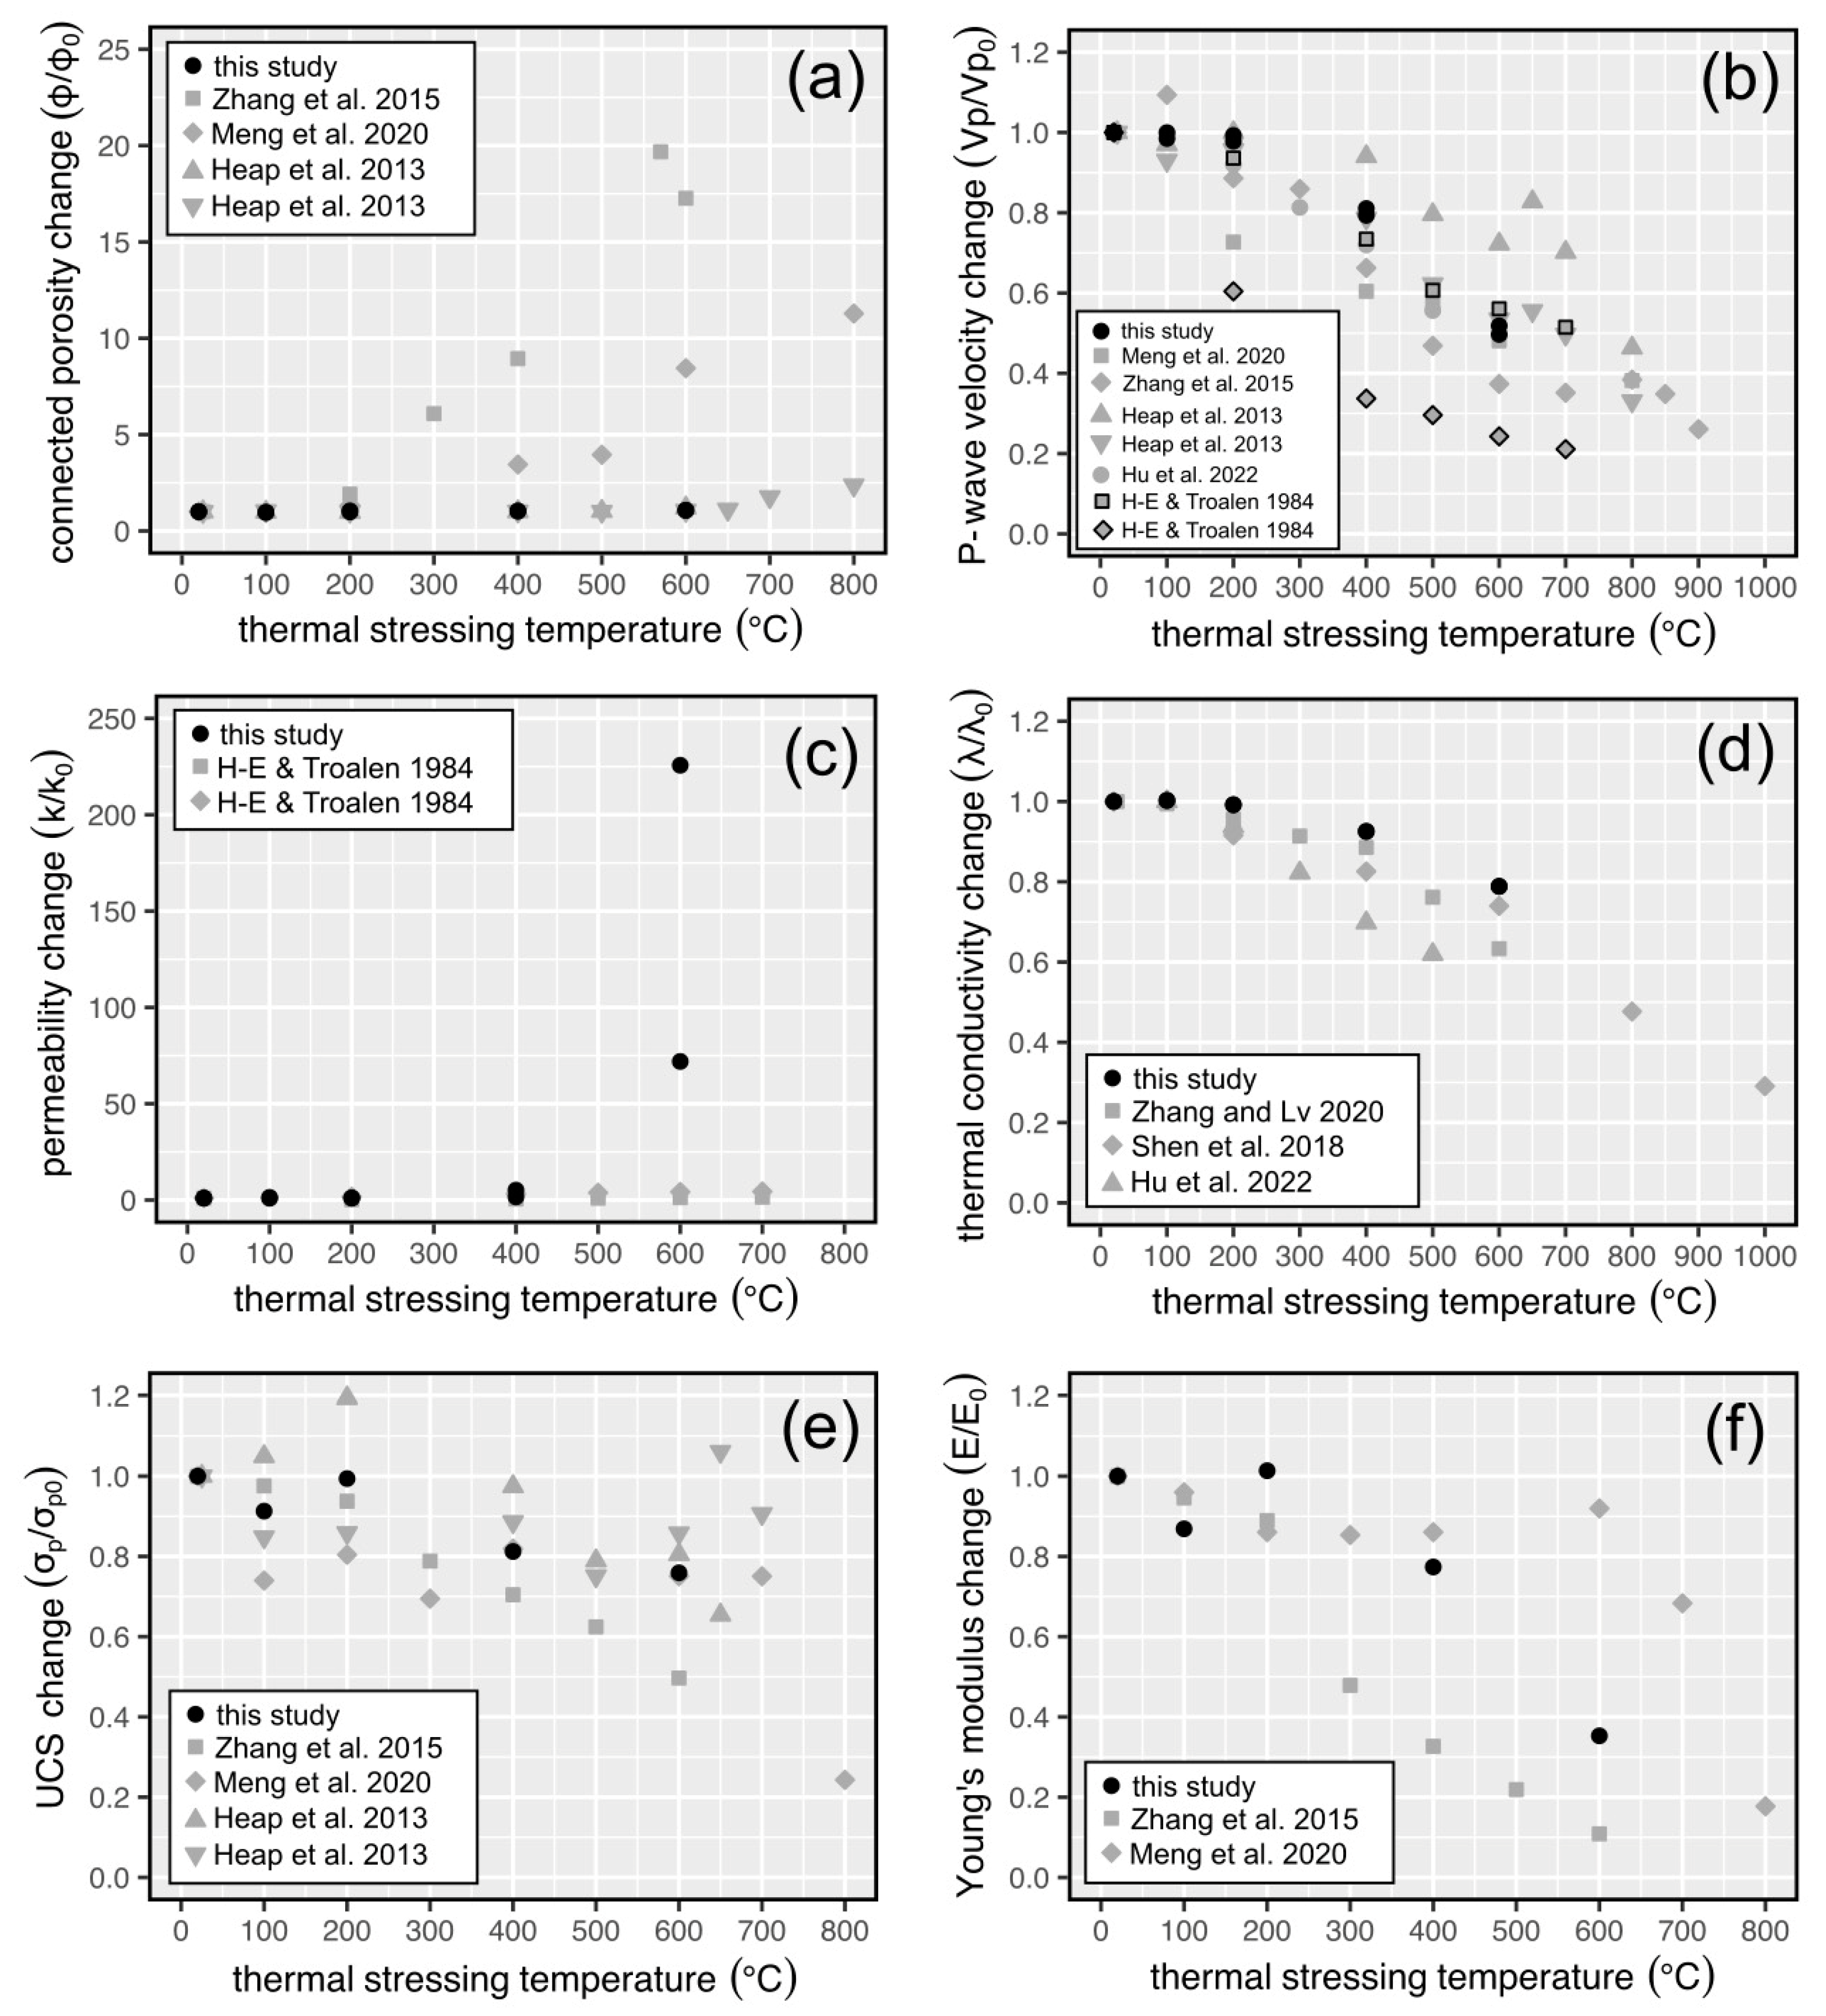
4.2. Comparisons with Previously Published Data

We compare our new data for limestone from Baku with those previously published in Figure 10. We find that the relative changes in P-wave velocity (Figure 10b), thermal conductivity (Figure 10d), uniaxial compressive strength (Figure 10e), and Young’s modulus (Figure 10e) of our limestone are very similar to those reported for limestone in the literature, despite their differences in porosity and microstructural parameters (such as, for example, grain size).
The relative change in connected porosity, however, appears to depend on the initial porosity of the limestone (Figure 10a). The relative change in the connected porosity of limestones with a low porosity (the porosity of the limestones studied in Zhang et al. [6] and Meng et al. [7] were 0.002 and 0.0125, respectively) increased significantly as a function of thermal stressing temperature, while the connected porosity change for high-porosity limestones (the porosity of the limestones studied in Heap et al. [8] were ~0.18 and ~0.25), including the limestone studied herein (porosity of ~0.28), increased by less than a factor of 2 (Figure 10a). This difference can be explained by the fact that if, for example, thermally stressing a rock to 600 °C increases the porosity by 0.01, the relative change in porosity for an initially low-porosity rock will be higher than that for an initially high-porosity rock. Therefore, the data shown in Figure 10a does not necessarily suggest that, following thermal stressing, the volume of microcracks that form in low-porosity limestones is higher than the volume of microcracks that form in high-porosity limestones. This assertion is supported by the fact that the evolution of the physical and mechanical properties of limestones with different porosities as a function of thermal stressing temperature is similar (Figure 10).
Finally, we highlight that the permeability of our limestone increases significantly following thermal stressing (by a factor of more than 200; Figure 10c), whereas the permeability of two other limestones only increased by a factor of ~1.5 and ~4.5, respectively (Figure 10c). This, however, cannot be explained by differences in their initial permeability because the two limestones measured by Homand-Etienne and Troalen [10] have initial porosities and permeabilities of ~0.1 and ~0 and 10−16 and 10−20 m2, respectively. We interpret this as the result of the poor initial connectivity of the porosity within the limestone from Baku. Compared to similarly porous limestones, the limestone measured here is characterised by a very low permeability. For example, the permeability of Leitha limestone (Austria), with a porosity of 0.3, is >10−12 m2 [37], whereas the limestone from Baku, with a porosity of ~0.28, has a permeability of ~10−16 m2 (Table 1). The low permeability of the limestone from Baku, despite its high porosity, highlights the poor connectivity of the pore space within the rock. We hypothesise that the microcracks that form as a result of exposure to high temperature (Figure 9) do not greatly increase the porosity (Figure 10a), but greatly increase the connectivity of the porosity. This increase in pore space connectivity, thanks to the thermal microcracks, results in a large increase in sample permeability, as shown in Figure 10c.

4.3. Implications for Building and Monument Restoration

Our petrophysical data (Figure 6, Figure 7, Figure 8 and Figure 10) suggest that, where and when possible, building and monument fires should be kept at temperatures below 400 °C. At temperatures below 400 °C, changes to the physical and mechanical properties of the limestone are modest (Figure 6, Figure 7, Figure 8 and Figure 10). Thermal stressing also induces colour changes of the limestone samples starting at 400 °C (Figure 5), which coincide with the notable change in both physical and mechanical properties (Figure 6, Figure 7, Figure 8 and Figure 10). This superficial evolution has been observed by other authors for limestones at the same temperature [38,39,40]. Tuff, a type of volcanic rock, is also known to change colour following exposure to high temperature [41,42]. Therefore, colour changes could be used to assess the structural integrity of buildings and monuments and could, as a result, be used as part of a preliminary damage investigation. Indeed, knowing which dimension stones are compromised following exposure to high temperature will help the rescue team know which part of the building is safe to enter, and knowing which stones need to be replaced will also help guide building restoration. Improved strategies for rescue teams and construction crews following fire damage could help save time, money, and lives.

5. Conclusions

Baku is located in a seismically-active region and is, therefore, at risk to post-earthquake fires that can result in widespread damage to buildings and monuments. Here, therefore, we assessed the fire resistance of a limestone commonly used in construction in Baku and the surrounding area. We found that the physical and mechanical properties of the limestone deteriorate following exposure to high temperature, and particularly at temperatures above 400 °C. Microstructural work shows that the physical and mechanical property changes at temperatures of 400 °C and above are the result of the formation of thermal microcracks. These thermal microcracks formed due to the build-up of stress at the contacts between neighbouring grains resulting from their thermal expansion at high temperature. We further note that the samples heated to 400 and 600 °C turned red and grey in colour, respectively. At a temperature of 800 °C, the decarbonation of the calcium carbonate in the limestone, followed by the reaction between calcium oxide and atmospheric water, resulted in a white-coloured sample that expanded significantly and disintegrated. Using the petrophysical data provided herein, changes in colour following exposure to high temperature could therefore be used as an indicator as to the severity of post-fire damage, which could help improve restoration strategies in limestone buildings and monuments in Baku and the surrounding area in the unfortunate event of fire.

Author Contributions

Conceptualization, C.J. and M.J.H.; formal analysis, C.J. and M.J.H.; investigation, C.J., M.J.H., K.B., G.A., S.R. and S.N.; resources, M.J.H.; writing—original draft preparation, C.J. and M.J.H.; writing—review and editing, C.J., M.J.H., K.B., G.A., S.R. and S.N.; visualization, C.J. and M.J.H.; supervision, C.J. and M.J.H.; project administration, C.J. and M.J.H.; funding acquisition, C.J. and M.J.H. All authors have read and agreed to the published version of the manuscript.

Funding

This research was funded by the French–Azerbaijani University (under the Azerbaijan State Oil and Industry University). M.J.H. also acknowledges support from the Institut Universitaire de France (IUF).

Data Availability Statement

The mechanical data collected for this study (stress-strain data) are openly available in FigShare at https://doi.org/10.6084/m9.figshare.23276420.v1, dataset posted on 1 June 2023. The remaining data are available in Table 1, Table 2 and Table 3.

Acknowledgments

We thank Bertrand Renaudie for preparing the experimental samples. We also thank Thierry Reuschlé for maintaining the uniaxial compression apparatus. We thank the reviewers for providing comments that helped us improve our manuscript.

Conflicts of Interest

The authors declare no conflict of interest. The funders had no role in the design of the study; in the collection, analyses, or interpretation of data; in the writing of the manuscript; or in the decision to publish the results.

References

  1. Gauri, K.L.; Chowdhury, A.N.; Kulshreshtha, N.P.; Punuru, A.R. Geologic Features and Durability of Limestones at the Sphinx. Environ. Geol. Water Sci. 1990, 16, 57–62. [Google Scholar] [CrossRef]
  2. Fitzner, B.; Heinrichs, K.; La Bouchardiere, D. Limestone Weathering of Historical Monuments in Cairo, Egypt. Geol. Soc. Spec. Publ. 2002, 205, 217–239. [Google Scholar] [CrossRef]
  3. Jackson, J.; Priestley, K.; Allen, M.; Berberian, M. Active Tectonics of the South Caspian Basin. Geophys. J. Int. 2002, 148, 214–245. [Google Scholar] [CrossRef] [Green Version]
  4. Babayev, G.; Ismail-Zadeh, A.; Le Moüel, J.L. Scenario-Based Earthquake Hazard and Risk Assessment for Baku (Azerbaijan). Nat. Hazards Earth Syst. Sci. 2010, 10, 2697–2712. [Google Scholar] [CrossRef] [Green Version]
  5. Scawthorn, C.; Eidinger, J.M.; Schiff, A.J. Fire Following Earthquake; Technical Council on Lifeline Earthquake Engineering Monograph, No. 26; American Society of Civil Engineers Press: Reston, VA, USA, 2005. [Google Scholar]
  6. Zhang, W.; Qian, H.; Sun, Q.; Chen, Y. Experimental Study of the Effect of High Temperature on Primary Wave Velocity and Microstructure of Limestone. Environ. Earth Sci. 2015, 74, 5739–5748. [Google Scholar] [CrossRef]
  7. Meng, Q.B.; Wang, C.K.; Liu, J.F.; Zhang, M.W.; Lu, M.M.; Wu, Y. Physical and Micro-Structural Characteristics of Limestone after High Temperature Exposure. Bull. Eng. Geol. Environ. 2020, 79, 1259–1274. [Google Scholar] [CrossRef]
  8. Heap, M.J.; Mollo, S.; Vinciguerra, S.; Lavallée, Y.; Hess, K.U.; Dingwell, D.B.; Baud, P.; Iezzi, G. Thermal Weakening of the Carbonate Basement under Mt. Etna Volcano (Italy): Implications for Volcano Instability. J. Volcanol. Geotherm. Res. 2013, 250, 42–60. [Google Scholar] [CrossRef] [Green Version]
  9. Lion, M.; Skoczylas, F.; Ledésert, B. Effects of Heating on the Hydraulic and Poroelastic Properties of Bourgogne Limestone. Int. J. Rock Mech. Min. Sci. 2005, 42, 508–520. [Google Scholar] [CrossRef]
  10. Homand-Etienne, F.; Troalen, J.P. Behaviour of Granites and Limestones Subjected to Slow and Homogeneous Temperature Changes. Eng. Geol. 1984, 20, 219–233. [Google Scholar] [CrossRef]
  11. Hu, J.; Xie, H.; Gao, M.; Li, C.; Sun, Q. Damage Mechanism and Heat Transfer Characteristics of Limestone after Thermal Shock Cycle Treatments Based on Geothermal Development. Int. J. Rock Mech. Min. Sci. 2022, 160, 105269. [Google Scholar] [CrossRef]
  12. Kılıç, Ö. The Influence of High Temperatures on Limestone P-Wave Velocity and Schmidt Hammer Strength. Int. J. Rock Mech. Min. Sci. 2006, 43, 980–986. [Google Scholar] [CrossRef]
  13. Zhang, W.; Lv, C. Effects of Mineral Content on Limestone Properties with Exposure to Different Temperatures. J. Pet. Sci. Eng. 2020, 188, 106941. [Google Scholar] [CrossRef]
  14. Shen, Y.; Yang, Y.; Yang, G.; Hou, X.; Ye, W.; You, Z.; Xi, J. Damage Characteristics and Thermo-Physical Properties Changes of Limestone and Sandstone during Thermal Treatment from −30 °C to 1000 °C. Heat Mass Transf. Stoffuebertragung 2018, 54, 3389–3407. [Google Scholar] [CrossRef]
  15. Zhang, W.; Sun, Q.; Zhu, S.; Wang, B. Experimental Study on Mechanical and Porous Characteristics of Limestone Affected by High Temperature. Appl. Therm. Eng. 2017, 110, 356–362. [Google Scholar] [CrossRef]
  16. Mao, X.B.; Zhang, L.Y.; Li, T.Z.; Liu, H.S. Properties of Failure Mode and Thermal Damage for Limestone at High Temperature. Min. Sci. Technol. 2009, 19, 290–294. [Google Scholar] [CrossRef]
  17. Meng, Q.; Zhang, M.; Han, L.; Pu, H.; Chen, Y. Experimental Research on the Influence of Loading Rate on the Mechanical Properties of Limestone in a High-Temperature State. Bull. Eng. Geol. Environ. 2019, 78, 3479–3492. [Google Scholar] [CrossRef]
  18. Castagna, A.; Ougier-Simonin, A.; Benson, P.M.; Browning, J.; Walker, R.J.; Fazio, M.; Vinciguerra, S. Thermal Damage and Pore Pressure Effects of the Brittle-Ductile Transition in Comiso Limestone. J. Geophys. Res. Solid Earth 2018, 123, 7644–7660. [Google Scholar] [CrossRef] [Green Version]
  19. Bakker, R.R.; Violay, M.E.S.; Benson, P.M.; Vinciguerra, S.C. Ductile Flow in Sub-Volcanic Carbonate Basement as the Main Control for Edifice Stability: New Experimental Insights. Earth Planet. Sci. Lett. 2015, 430, 533–541. [Google Scholar] [CrossRef] [Green Version]
  20. Farquharson, J.I.; Heap, M.J.; Lavallée, Y.; Varley, N.R.; Baud, P. Evidence for the Development of Permeability Anisotropy in Lava Domes and Volcanic Conduits. J. Volcanol. Geotherm. Res. 2016, 323, 163–185. [Google Scholar] [CrossRef]
  21. Heap, M.J.; Kennedy, B.M. Exploring the Scale-Dependent Permeability of Fractured Andesite. Earth Planet. Sci. Lett. 2016, 447, 139–150. [Google Scholar] [CrossRef]
  22. Heap, M.J.; Kushnir, A.R.L.; Gilg, H.A.; Wadsworth, F.B.; Reuschlé, T.; Baud, P. Microstructural and Petrophysical Properties of the Permo-Triassic Sandstones (Buntsandstein) from the Soultz-Sous-Forêts Geothermal Site (France). Geotherm. Energy 2017, 5, 26. [Google Scholar] [CrossRef] [Green Version]
  23. Heap, M.J.; Lavallée, Y.; Petrakova, L.; Baud, P.; Reuschlé, T.; Varley, N.R.; Dingwell, D.B. Microstructural Controls on the Physical and Mechanical Properties of Edifice-Forming Andesites at Volcán de Colima, Mexico M. J. Geophys. Res. Solid Earth 2014, 119, 2925–2963. [Google Scholar] [CrossRef]
  24. Gustafsson, S.E. Transient plane source techniques for thermal conductivity and thermal diffusivity measurements of solid materials. Rev. Sci. Instrum. 1991, 62, 797–804. [Google Scholar] [CrossRef]
  25. Heap, M.J.; Kushnir, A.R.L.; Vasseur, J.; Wadsworth, F.B.; Harlé, P.; Baud, P.; Kennedy, B.M.; Troll, V.R.; Deegan, F.M. The Thermal Properties of Porous Andesite. J. Volcanol. Geotherm. Res. 2020, 398, 106901. [Google Scholar] [CrossRef]
  26. Heap, M.J.; Jessop, D.E.; Wadsworth, F.B.; Rosas-Carbajal, M.; Komorowski, J.C.; Gilg, H.A.; Aron, N.; Buscetti, M.; Gential, L.; Goupil, M.; et al. The Thermal Properties of Hydrothermally Altered Andesites from La Soufrière de Guadeloupe (Eastern Caribbean). J. Volcanol. Geotherm. Res. 2022, 421, 107444. [Google Scholar] [CrossRef]
  27. Fredrich, J.T.; Wong, T. Micromechanics of Thermally Induced Cracking in Three Crustal Rocks. J. Geophys. Res. Solid Earth 1986, 91, 12743–12764. [Google Scholar] [CrossRef]
  28. Jones, C.; Keaney, G.; Meredith, P.G.; Murrell, S.A.F. Acoustic Emission and Fluid Permeability Measurements on Thermally Cracked Rocks. Phys. Chem. Earth 1997, 22, 13–17. [Google Scholar] [CrossRef]
  29. Nara, Y.; Meredith, P.G.; Yoneda, T.; Kaneko, K. Influence of Macro-Fractures and Micro-Fractures on Permeability and Elastic Wave Velocities in Basalt at Elevated Pressure. Tectonophysics 2011, 503, 52–59. [Google Scholar] [CrossRef] [Green Version]
  30. Vinciguerra, S.; Trovato, C.; Meredith, P.G.; Benson, P.M. Relating Seismic Velocities, Thermal Cracking and Permeability in Mt. Etna and Iceland Basalts. Int. J. Rock Mech. Min. Sci. 2005, 42, 900–910. [Google Scholar] [CrossRef] [Green Version]
  31. Kant, M.A.; Ammann, J.; Rossi, E.; Madonna, C.; Höser, D.; Rudolf von Rohr, P. Thermal Properties of Central Aare Granite for Temperatures up to 500 °C: Irreversible Changes Due to Thermal Crack Formation. Geophys. Res. Lett. 2017, 44, 771–776. [Google Scholar] [CrossRef]
  32. David, E.C.; Brantut, N.; Schubnel, A.; Zimmerman, R.W. Sliding Crack Model for Nonlinearity and Hysteresis in the Uniaxial Stress-Strain Curve of Rock. Int. J. Rock Mech. Min. Sci. 2012, 52, 9–17. [Google Scholar] [CrossRef]
  33. Griffiths, L.; Heap, M.J.; Baud, P.; Schmittbuhl, J. Quantification of Microcrack Characteristics and Implications for Stiffness and Strength of Granite. Int. J. Rock Mech. Min. Sci. 2017, 100, 138–150. [Google Scholar] [CrossRef]
  34. Samtani, M.; Dollimore, D.; Alexander, K.S. Comparison of Dolomite Decomposition Kinetics with Related Carbonates and the Effect of Procedural Variables on Its Kinetic Parameters. Thermochim. Acta 2002, 392–393, 135–145. [Google Scholar] [CrossRef]
  35. Mollo, S.; Vinciguerra, S.; Iezzi, G.; Iarocci, A.; Scarlato, P.; Heap, M.J.; Dingwell, D.B. Volcanic Edifice Weakening via Devolatilization Reactions. Geophys. J. Int. 2011, 186, 1073–1077. [Google Scholar] [CrossRef] [Green Version]
  36. Steiner, S.; Lothenbach, B.; Proske, T.; Borgschulte, A.; Winnefeld, F. Effect of Relative Humidity on the Carbonation Rate of Portlandite, Calcium Silicate Hydrates and Ettringite. Cem. Concr. Res. 2020, 135, 106116. [Google Scholar] [CrossRef]
  37. Baud, P.; Exner, U.; Lommatzsch, M.; Reuschlé, T.; Wong, T.F. Mechanical Behavior, Failure Mode, and Transport Properties in a Porous Carbonate. J. Geophys. Res. Solid Earth 2017, 122, 7363–7387. [Google Scholar] [CrossRef]
  38. Chakrabarti, B.; Yates, T.; Lewry, A. Effect of Fire Damage on Natural Stonework in Buildings. Constr. Build. Mater. 1996, 10, 539–544. [Google Scholar] [CrossRef]
  39. Ozguven, A.; Ozcelik, Y. Investigation of Some Property Changes of Natural Building Stones Exposed to Fire and High Heat. Constr. Build. Mater. 2013, 38, 813–821. [Google Scholar] [CrossRef]
  40. González-Gómez, W.S.; Quintana, P.; May-Pat, A.; Avilés, F.; May-Crespo, J.; Alvarado-Gil, J.J. Thermal Effects on the Physical Properties of Limestones from the Yucatan Peninsula. Int. J. Rock Mech. Min. Sci. 2015, 75, 182–189. [Google Scholar] [CrossRef]
  41. Heap, M.J.; Lavallée, Y.; Laumann, A.; Hess, K.U.; Meredith, P.G.; Dingwell, D.B. How tough is tuff in the event of fire? Geology 2012, 40, 311–314. [Google Scholar] [CrossRef]
  42. Heap, M.J.; Kushnir, A.; Griffiths, L.; Wadsworth, F.; Marmoni, G.M.; Fiorucci, M.; Martino, S.; Baud, P.; Gilg, H.A.; Reuschlé, T. Fire resistance of the Mt. Epomeo Green Tuff, a widely-used building stone on Ischia Island (Italy). Volcanica 2018, 1, 33–48. [Google Scholar] [CrossRef] [Green Version]
Figure 1. (a) Map of Azerbaijan showing neighbouring countries, and the location of the Absheron Peninsula, the Caucasus Mountains, and Baku (latitude and longitude of Baku: 40.4093° N, 49.8671° E). (b) Zoomed-in map of the Baku area showing the location of the quarry at Guzdak (red circle) and the Icherisheher.
Fire 06 00263 g001
Figure 2. Photographs of limestone building materials in Icherisheher in Baku (location shown in Figure 1b). (a) The Maiden Tower monument (16.5 metres in diameter at the base). (b) The wall of an inner street (pencil for scale; pencil is 15 cm long). (c) Zoom in on one of the building blocks of an inner house wall (metal hooks are 10 cm long).
Fire 06 00263 g002
Figure 3. Photograph of a 25 mm diameter core sample (left) and an optical microscope image of the studied limestone (right).
Fire 06 00263 g003
Figure 4. (a) The cumulative proportion of grains as a function of equivalent grain diameter. The mean grain size (820 μm) is also shown on the panel. (b) The cumulative proportion of grains as a function of grain aspect ratio (the minor grain axis divided by the major grain axis). The mean aspect ratio (0.53) is also shown on the panel. The total number of grains analysed = 623.
Fire 06 00263 g004
Figure 5. Photographs of an intact sample (a) and samples thermally stressed to 100 °C (b), 200 °C (c), 400 °C (d), and 600 °C (e).
Fire 06 00263 g005
Figure 6. (a) Connected porosity as a function of thermal stressing temperature. (b) Permeability as a function of thermal stressing temperature. (c) P-wave velocity as a function of thermal stressing temperature. Panels (df) show the relative change in connected porosity, permeability, and P-wave velocity, respectively.
Fire 06 00263 g006
Figure 7. (a) Thermal conductivity as a function of thermal stressing temperature. (b) Thermal diffusivity as a function of thermal stressing temperature. (c) Specific heat capacity as a function of thermal stressing temperature. Panels (df) show the relative change in thermal conductivity, thermal diffusivity, and specific heat capacity, respectively.
Fire 06 00263 g007
Figure 8. (a) Uniaxial stress-strain curves for intact limestone and limestones thermally stressed to temperatures of 100, 200, 400, and 600 °C. (b) Uniaxial compressive strength as a function of thermal stressing temperature. (c) The relative change of uniaxial compressive strength (UCS) as a function of thermal stressing temperature. (d) Young’s modulus as a function of thermal stressing temperature. (e) The relative change of Young’s modulus as a function of thermal stressing temperature.
Fire 06 00263 g008
Figure 9. Optical microscope images of samples, taken using reflected light, of the studied limestone exposed to 400 °C (a) and 600 °C (b).
Fire 06 00263 g009
Figure 10. Connected porosity change (a), P-wave velocity change (b), permeability change (c), thermal conductivity change (d), uniaxial compressive strength (UCS) change (e), and Young’s modulus change (f) as a function of thermal stressing temperature. The panels show data from this study (black circles) and data from previously published studies (grey symbols, [6,7,8,10,11,13,14]).
Fire 06 00263 g010
Table 1. Physical property measurements on intact (i.e., not thermally stressed) limestone (BL1 to BL12).
SampleBulk Sample Density (kg/m3)Connected PorosityPermeability (m2)P-Wave Velocity (km/s)Thermal Conductivity (W/mK)Thermal Diffusivity (mm2/s)Specific Heat Capacity (kJ/kgK)
BL11951.20.271.47 × 10−174.231.329 ± 0.0761.094 ± 0.0670.622 ± 0.068
BL21927.20.298.83 × 10−164.011.329 ± 0.0761.094 ± 0.0670.630 ± 0.068
BL31953.10.276.39 × 10−184.181.267 ± 0.1600.992 ± 0.1390.654 ± 0.173
BL41947.80.281.30 × 10−174.001.267 ± 0.1600.992 ± 0.1390.656 ± 0.173
BL51940.20.288.22 × 10−164.231.188 ± 0.1090.670 ± 0.1030.914 ± 0.060
BL61949.60.294.55 × 10−174.231.188 ± 0.1090.670 ± 0.1030.909 ± 0.060
BL71946.70.284.37 × 10−164.121.329 ± 0.0320.893 ± 0.0880.764 ± 0.073
BL81952.70.281.83 × 10−184.141.329 ± 0.0320.893 ± 0.0880.762 ± 0.073
BL91960.10.274.74 × 10−174.481.374 ± 0.0190.852 ± 0.0270.823 ± 0.016
BL101944.20.281.44 × 10−174.101.374 ± 0.0190.852 ± 0.0270.830 ± 0.016
BL111957.10.283.82 × 10−164.411.308 ± 0.0561.026 ± 0.0990.652 ± 0.080
BL121954.90.283.89 × 10−174.231.308 ± 0.0561.026 ± 0.0990.652 ± 0.080
Table 2. Physical property measurements on intact (i.e., not thermally stressed) limestone (BL1 and BL2) and limestone thermally stressed to 100 °C (BL3 and BL4), 200 °C (BL5 and BL6), 400 °C (BL7 and BL8), and 600 °C (BL9 and BL10). Samples heated to 800 °C (BL11 and BL12) disintegrated and could not be remeasured.
SampleBulk Sample Density (kg/m3)Connected PorosityPermeability (m2)P-Wave Velocity (km/s)Thermal Conductivity (W/mK)Thermal Diffusivity (mm2/s)Specific Heat Capacity (kJ/kgK)
BL11951.20.271.47 × 10−174.231.329 ± 0.0761.094 ± 0.0670.622 ± 0.068
BL21927.20.298.83 × 10−164.011.329 ± 0.0761.094 ± 0.0670.630 ± 0.068
BL3 (100 °C)1960.60.265.81 × 10−184.121.271 ± 0.1261.029 ± 0.1120.630 ± 0.110
BL4 (100 °C)1949.30.271.79 × 10−174.001.271 ± 0.1261.029 ± 0.1120.634 ± 0.110
BL5 (200 °C)1942.50.299.18 × 10−164.141.178 ± 0.1080.678 ± 0.1350.895 ± 0.101
BL6 (200 °C)1955.30.294.42 × 10−174.201.178 ± 0.1080.678 ± 0.1350.889 ± 0.101
BL7 (400 °C)1940.10.297.16 × 10−163.271.230 ± 0.0990.899 ± 0.0450.705 ± 0.073
BL8 (400 °C)1946.80.299.42 × 10−183.361.230 ± 0.0990.899 ± 0.0450.703 ± 0.073
BL9 (600 °C)1921.00.303.41 × 10−152.231.084 ± 0.0250.746 ± 0.0230.756 ± 0.028
BL10 (600 °C)1943.50.303.25 × 10−152.131.084 ± 0.0250.746 ± 0.0230.747 ± 0.028
Table 3. Mechanical property measurements on intact (i.e., not thermally stressed) limestone (BL1 and BL2) and limestone thermally stressed to 100 °C (BL3 and BL4), 200 °C (BL5 and BL6), 400 °C (BL7 and BL8), and 600 °C (BL9 and BL10). Samples heated to 800 °C (BL11 and BL12) disintegrated and could not be measured.
SampleYoung’s Modulus (GPa)Uniaxial Compressive Strength (MPa)
BL114.718.6
BL27.412.0
BL311.516.7
BL47.711.3
BL513.617.2
BL68.813.3
BL78.812.0
BL88.313.0
BL94.113.7
BL103.79.6
Disclaimer/Publisher’s Note: The statements, opinions and data contained in all publications are solely those of the individual author(s) and contributor(s) and not of MDPI and/or the editor(s). MDPI and/or the editor(s) disclaim responsibility for any injury to people or property resulting from any ideas, methods, instructions or products referred to in the content.

