Article

Assessment of Burned Areas during the Pantanal Fire Crisis in 2020 Using Sentinel-2 Images

by
Yosio Edemir Shimabukuro
1,*,
Gabriel de Oliveira
2,
Gabriel Pereira
3,4,
Egidio Arai
1,
Francielle Cardozo
5,
Andeise Cerqueira Dutra
1 and
Guilherme Mataveli
1
1
Earth Observation and Geoinformatics Division, National Institute for Space Research, São José dos Campos 12227-010, Brazil
2
Department of Earth Sciences, University of South Alabama, Mobile, AL 36688, USA
3
Department of Geosciences, Federal University of São João del-Rei, São João del-Rei 36307-352, Brazil
4
Department of Geography, University of São Paulo, São Paulo 05508-000, Brazil
5
Graduate Program in Geography, Federal University of São João del-Rei, São João del-Rei 36301-360, Brazil
*
Author to whom correspondence should be addressed.
Fire 2023, 6(7), 277; https://doi.org/10.3390/fire6070277
Submission received: 8 June 2023 / Revised: 6 July 2023 / Accepted: 17 July 2023 / Published: 19 July 2023
(This article belongs to the Special Issue Vegetation Fires in South America)

Abstract

:
The Pantanal biome—a tropical wetland area—has been suffering a prolonged drought that started in 2019 and peaked in 2020. This favored the occurrence of natural disasters and led to the 2020 Pantanal fire crisis. The purpose of this work was to map the burned area’s extent during this crisis in the Brazilian portion of the Pantanal biome using Sentinel-2 MSI images. The classification of the burned areas was performed using a machine learning algorithm (Random Forest) in the Google Earth Engine platform. Input variables in the algorithm were the percentiles 10, 25, 50, 75, and 90 of monthly (July to December) mosaics of the shade fraction, NDVI, and NBR images derived from Sentinel-2 MSI images. The results showed an overall accuracy of 95.9% and an estimate of 44,998 km2 burned in the Brazilian portion of the Pantanal, which resulted in severe ecosystem destruction and biodiversity loss in this biome. The burned area estimated in this work was higher than those estimated by the MCD64A1 (35,837 km2), Fire_cci (36,017 km2), GABAM (14,307 km2), and MapBiomas Fogo (23,372 km2) burned area products, which presented lower accuracies. These differences can be explained by the distinct datasets and methods used to obtain those estimates. The proposed approach based on Sentinel-2 images can potentially refine the burned area’s estimation at a regional scale and, consequently, improve the estimate of trace gases and aerosols associated with biomass burning, where global biomass burning inventories are widely known for having biases at a regional scale. Our study brings to light the necessity of developing approaches that aim to improve data and theory about the impacts of fire in regions critically sensitive to climate change, such as the Pantanal, in order to improve Earth systems models that forecast wetland–atmosphere interactions, and the role of these fires on current and future climate change over these regions.

1. Introduction

Located in the central portion of South America, the Pantanal is the largest tropical wetland in the world. With more than 84% of its territory currently preserved, the Pantanal is also the wetland with the largest area of natural vegetation in the world [1]. It is a seasonally flooded wetland, where the dry season usually ranges from July to October, composed of several interconnected ecosystems shaped by natural and anthropogenic factors. Wetlands, including the Pantanal, are biodiversity hotspots that offer unique ecosystem services necessary for human well-being. Despite wetlands playing a key role in global climate regulation, they are under increased threat due to their sensitivity to anthropogenic disturbances and climate change [2]. This raises the need for accurate and up-to-date information on the spatial and temporal variability of wetlands [3] and the climate and anthropogenic pressures that wetlands are facing. These are key information for their conservation and management.
Since 2019, the Pantanal, where rainfall patterns—modulated by the South America Summer Monsoon—play a significant role in the flood pulse, has been suffering a prolonged drought event that was exacerbated in 2020. The annual precipitation estimated in 2020 in the Brazilian portion of the Pantanal was the lowest since the 1980s, 26% lower than the 1982–2020 average [4]. This has contributed to creating a drier environment with available combustible material [5] and, therefore, greater potential for fires. Consequences of this significant drought in 2020 were: (i) Pantanal’s water surface area was 34% less than average, (ii) its burned area (BA) was 200% greater than the long-term average, and (iii) 35% of the BA occurred for the first time on record [6]. This drought event was triggered by the reduced transport of warm and humid summer air from Amazonia into the Pantanal, which led to a decrease in rainfall during the summers of 2019 and 2020 [7]. The event was also associated with climate change and the occurrence of intense marine heatwaves in the Northeast Pacific Ocean [8]. This and other severe and prolonged drought events are becoming more frequent in the Pantanal and surrounding areas such as the Cerrado and Amazonia, leading to the intensification of fire risk and the extension of the Pantanal’s fire-prone areas to historically flooded areas [8,9].
Such a scenario favors the occurrence of natural disasters in the Pantanal and led to the 2020 Pantanal fire crisis. Approximately 40,000 km2 of natural vegetation was impacted during this crisis [1], including conservation areas and Indigenous lands [4]. The estimated cost of post-fire restoration for areas burned in the Pantanal in 2020, with high and medium potential for natural regeneration, is around 123 million USD [10]. Moreover, 17 million vertebrates were directly killed by these fires [11]. However, the extent of the BA estimated from orbital remote sensing during this crisis varied widely depending on the BA product. Global BA products have been generated at coarser spatial resolution (250–500 m) using time series of Moderate Resolution Imaging Spectroradiometer (MODIS) sensor observations (e.g., MCD64A1 c6.0 and Fire_cci v5.1 products), but these have systematic inconsistencies at a regional scale [12]. The use of medium spatial resolution images, especially Landsat-derived images (30 m), to automatically map the BA (e.g., MapBiomas Fogo c1.0 and GABAM products) is able to overcome this issue but remains challenging due to the smaller number of observations available (up to two per month). Such difficulties raise the possibility of using the medium spatial resolution images derived from the MultiSpectral Instrument (MSI) sensor onboard the Sentinel-2 satellites to develop a more accurate BA product; this is because it combines a higher spatial resolution (20 m) when compared with Landsat- and MODIS-based products with a higher temporal resolution (up to six observations per month when using both Sentinel-2A and -2B) in comparison with Landsat-based products (16-day frequency). Sentinel-derived images were successfully used to estimate the BA more accurately in other wetlands [13,14] and in selected parts of the Pantanal [15], but there are no studies aimed at developing an approach applicable to the entire biome.
Considering the advantages of high computational cloud processing for remote sensing data provided by the Google Earth Engine (GEE) platform, an increasing number of studies have been using it for several applications including those on the fire field [16]. Studies using Sentinel-2 for BA mapping demonstrate improved accuracy and estimates compared with other datasets with lower spatial resolution (Landsat and MODIS) [16,17], but no applications or validation studies were applied in the entire Pantanal biome for comparison. Also, several remote-sensing-derived variables have been employed as predictors in classification models. For example, fraction images derived from spectral mixing models and indices such as the Normalized Difference Vegetation Index (NDVI) and the Normalized Burn Ratio (NBR) have been extensively used in the mapping and monitoring of burned areas [18,19,20]. Nevertheless, to the best of our knowledge, no previous studies have explored the potential of integrating these variables associated with advantages of the spatial and temporal characteristics of the MSI sensor to map the BA in the entire Pantanal biome.
The objective of our research was to (i) develop a more accurate biome-wide map of the BA’s extent during the Pantanal fire crisis in 2020 using Sentinel-2 images and three widely used variables (shade fraction, NDVI, and NBR) derived from them, and (ii) compare our results with operational BA products.

2. Materials and Methods
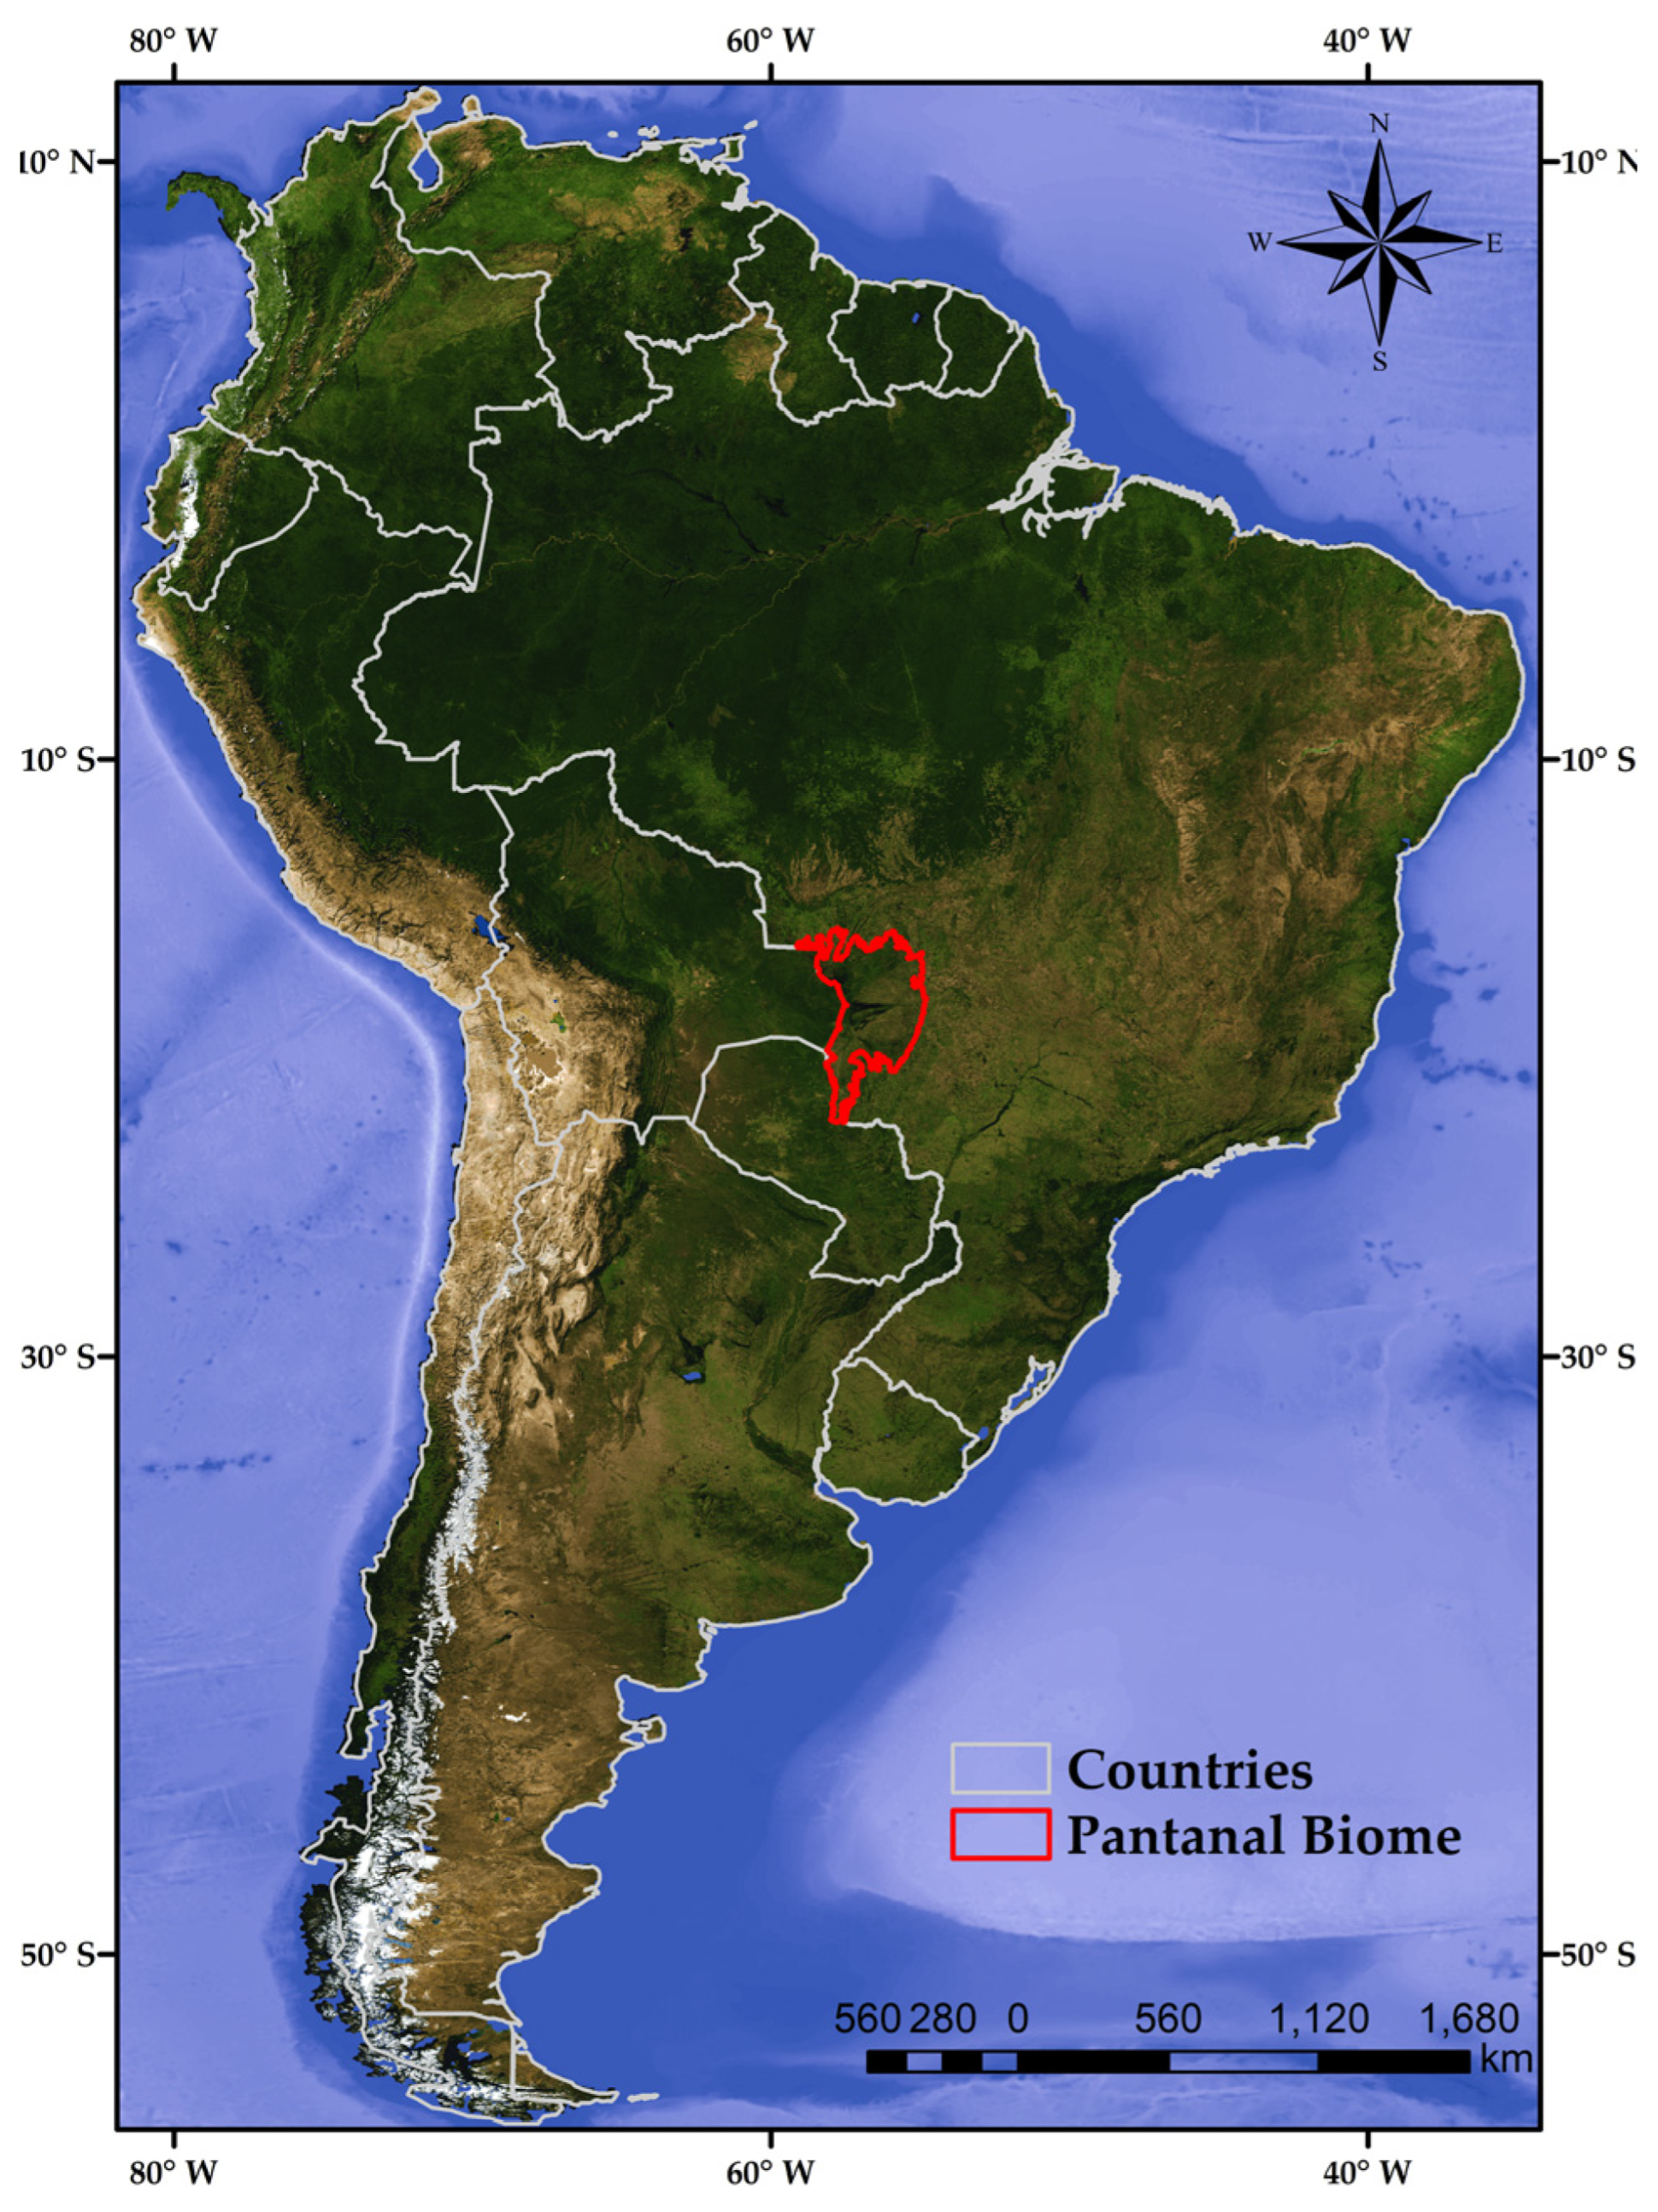
2.1. Study Area

The Pantanal (Figure 1) is a seasonally flooded sedimentary basin located within the Upper Paraguay Drainage River Basin (UPDRB) and covers 150,355 km2 of the Brazilian territory [21]. The dry season of the Pantanal occurs from April to September, while the rainy season extends from October to March. Flooding of the Paraguay River and its tributaries occurs during the rainy season of the Pantanal [21]. The flood pulse drives the vegetation dynamics [22], where savanna formations are the predominant vegetation type. These characteristic favors cattle ranching, one of the major economic activities of the Pantanal. In this context, the intensification of extensive cattle ranching during the past decades is the main driver of land use and land cover changes (LULCC) in the Pantanal [23]. Farmers initiate the land transformation process by deliberately setting the natural vegetation on fire to expand pastureland and take advantage of the extremely dry conditions at the end of the Pantanal’s dry season to achieve this. Therefore, both anthropogenic and unusually dry conditions, such as the 2020 drought, can lead to catastrophic wildfires in this unique wetland.

2.2. Sentinel-2 Images

The Copernicus Sentinel-2 mission comprises a constellation of two polar-orbiting satellites placed in the same sun-synchronous orbit phased at 180° to each other. It aims at monitoring changes in the land surface. The satellites’ wide swath width (290 km) combined with the high revisit time when compared with Landsat-derived images (10 days at the equator with one satellite or 5 days with 2 satellites under cloud-free conditions) effectively support the monitoring of the Earth’s surface and its changes. The launch of the first satellite, Sentinel-2A, occurred on 23 June 2015, while Sentinel-2B was launched on 7 March 2017. Both satellites carry an MSI sensor that samples 13 spectral bands: four bands at 10 m, six bands at 20 m, and three bands at 60 m of spatial resolution (Table 1). In this work, we have used MSI-derived images of the Pantanal from July/2020 to December/2020, made available in the GEE platform.

2.3. Estimate of Burned Area

The mapping of the BA in the Brazilian portion of the Pantanal during the 2020 fire crisis was carried out using images derived from the MSI sensor onboard the Sentinel-2 satellites. The MSI images were acquired from the GEE platform. The classification was based on the libraries and functions of a script developed for classifying Landsat-derived images [24] using the Random Forest machine learning algorithm on a cloud computing platform [25] with 115 visually collected BA samples from the MSI monthly mosaics from July to December used as training data (Supplementary Materials Figure S1). This script was adjusted to classify images derived from the MSI sensor. Adjustments included cloud filtering specific to Sentinel-2A/MSI images, spectral band selection, and new endmembers for the Linear Spectral Mixing Model (LSMM) [18] used in the classification model. The endmembers were defined as pure pixels representative of each fraction derived from the LSMM (soil, shade, and vegetation).
The BA classification was performed using monthly composites of MSI images from July/2020 to December/2020. These composites were generated in the GEE platform and defined as the monthly median values. The classification was based on the Level-2A (atmospherically corrected Surface Reflectance) product derived from MSI and three variables that highlight BA: the shade fraction derived from the LSMM [26], the NDVI index [27], and the NBR index [28]. The NDVI and NBR indices were related to burn severity by Hudak et al. [29], while fraction images have been used in several works [18,30,31,32,33].
When considering orbital remote sensing images, pixels are usually composed of several LULCs. This phenomenon, defined as spectral mixing, hinders an accurate estimate of BA. One viable approach to overcome this phenomenon is the LSMM technique, which decomposes the spectral mixing of a pixel from an image (the monthly mosaics in our case) into fractional images (vegetation, soil, and shade) [26]. The shade-fraction image highlights the BA and other image components, including shadows and water bodies, because of the low reflectance values through the spectral wavelength. This process was based on samples characterized as pure pixels for each one of the three fractions. We applied the LSMM to the monthly mosaics derived from the MSI bands B2, B3, B4, B8A, B11, and B12 (see Table 1). The NDVI monthly composites were estimated using the MSI bands B4 and B8A, while the estimates of the NBR monthly composites used the MSI bands B8A and B12.
The metrics used in the classification were the 10, 25, 50, 75, and 90 percentiles [34] of the three variables (shade fraction, NDVI, and NBR.). The monthly estimates of BA were then aggregated into an annual map that represents BA during the Pantanal 2020 fire crisis. We then used the flooded area map created by Pereira et al. [3] for 2020 to remove areas that were classified as BA but consisted of flooded areas. This final step was performed because both flooded areas (a frequent occurrence in the Pantanal) and BAs have spectral similarities and are often confused by classifiers [26]. This process removed 6% of the total area classified as BA in the Pantanal.

2.4. Remote-Sensing-Based Burned Area Products

Several open access BA products are made available nowadays [12]. Among them, we chose two BA products based on Landsat (MapBiomas Fogo c1.0 and GABAM) and two based on MODIS (MCD64A1 c6.0 and Fire_cci v5.1) images to compare with the BA estimate obtained using Sentinel-2 data (Table 2). While the MODIS-based and GABAM are global BA products, the recently released MapBiomas Fogo c1.0 is made available for the Brazilian territory. Aside from comparing our results with the four BA products, the temporal analysis proposed (2003–2020) aimed to show that, despite the distinct input data and methods used in these BA products, all of them had a very high estimated BA in the Pantanal biome in 2020. Therefore, this event must be assessed.
The processing of the aforementioned BA products consisted of: (i) downloading the products in the original format, (ii) summing the monthly BA estimates for each year analyzed (2003-2020) in order to create a file containing the annual estimate when applicable (for MCD64A1 and Fire_cci products specifically), (iii) converting the annual BA files to the Geospatial Tagged Image File (GeoTIFF) format, (iv) clipping the converted files to the delimitation of the Pantanal, and finally (v) calculating the annual BA.

2.5. Validation of Burned Area Estimates

A validation analysis was performed based on 194 independent samples identified via visual interpretation (a sample represents one pixel of 10 × 10 m, Figure 2) representing burned and non-burned sites (Supplementary Materials Figure S1). The sample size was calculated based on the approach proposed by Olofson et al. [39], considering a standard error of 0.05 in the expected overall accuracy and prioritizing burned samples to ensure an acceptable sample size. Then, the samples were randomly distributed and interpreted visually. Multiple sources were used as ancillary data to facilitate interpretation, including Sentinel-2A and Sentinel-2B RGB images, NDVI time series [19], and active fires detected by MODIS [40] and VIIRS [41] sensors made available from NASA’s Fire Information for Resource Management System (FIRMS). This allowed us to track the evolution of fires and provided reliable samples across the entire biome over 2020. It is important to mention that the seasonality of vegetation greenness and flood pulses (e.g., the presence of moist/dark soils at the end of the rainy season and the rapid regeneration of vegetation at the beginning of the rainy season) make the detection of fire scars more complex. Within this context, it was important to monitor the evolution of the fire and its context to ensure the reliability of the selected samples. Note that the validation data were not used in the training process and both samples are not overlayed to guarantee an acceptable assessment of the model’s performance on unseen data (see Supplementary Materials Figure S1).
The validation samples were used as reference data to calculate the overall accuracy (OA), producer accuracy (PA), user accuracy (UA) with a 95% confidence interval, precision and recall metrics of the produced BA classification (using Sentinel-2), and the four BA products (MapBiomas Fogo, MCD64A1, GABAM, and Fire_cci).

3. Results

3.1. Interannual Variability of Burned Area in the Pantanal

The interannual variation of the four BA products in the Pantanal is shown in Figure 3. Despite the differences among the BA products, which will be properly addressed in Section 4 Discussion, the year 2020 had the highest estimate of BA considering all products.

3.2. Estimate of Burned Area Based on Sentinel-2 Images

Following the abovementioned methodological procedures, we were able to automatically map the BA during the 2020 Pantanal fire crisis using the Sentinel-2 images (Figure 4 and Supplementary Materials Figure S2). Our results show that 44,998 km2 burned in the Brazilian portion of the Pantanal during the 2020 fire crisis.
The BA estimate derived from Sentinel-2 images for 2020 in the Brazilian portion of the Pantanal biome was higher than those derived from the original MODIS-based and Landsat-based burned area products. While the MCD64A1 product estimated 35,837 km2 and the Fire_cci product estimated 36,017 km2 burned in the Pantanal in 2020, the Landsat-based products MapBiomas Fogo and GABAM estimated, respectively, 23,372 km2 and 14,307 km2 burned. MCD64A1 and Fire_cci estimates were closer, but were also 20% lower than our results, while MapBiomas Fogo and GABAM estimates were, respectively, 48% and 68% lower than ours. Figure 4 shows the BA distribution in the Pantanal estimated by our method and the BA products analyzed. Visually, the maps present a similar spatial distribution pattern, but the Sentinel-derived estimate was able to detect a higher number of smaller fires than the other estimates, especially in the Eastern flank of the Pantanal.

3.3. Validation of Burned Area Estimates and Training Variables’ Importance Assessment

Table 3 presents the validation statistics for the BA classification using our method. The overall accuracy was estimated at 95.9% with a confidence interval from 92.0% to 98.2% (p-value < 0.05). Considering the estimated producer and user accuracies, the classification showed higher inclusion errors of non-BAs classified as BAs (user accuracy of 90.2%) than omission errors of BAs classified as non-BAs (producer accuracy of 93.9%), meaning that the classification tends to overestimate areas classified as burned.
Considering the same reference samples, GABAM, MapBiomas Fogo, MCD64A1, and Fire_cci products showed an overall accuracy of 54.6%, 65.9%, 70.6%, and 76.3%, respectively (Table 4). All these BA products showed lower producer accuracies of BAs classified as non-BAs (i.e., higher omission error), evidencing that these products tend to underestimate the BA (see confusion matrices in Tables S1–S4).
In Figure 5, boxplots indicate the relative importance of all predictive variables used in the trained RF models, based on the mean decrease impurity (Gini index). Variable importance measures allow a better comprehension of the underlying relationships between predictors and target variables by considering the relative contribution of each predictor to the model’s overall performance. In this manner, a lower decrease in impurity leads to a higher relative importance, which means that the 50th percentile of the shade fraction, the 10th percentile of the NBR, and the 10th percentile of the NDVI were the three predictors that contributed the most to the overall performance of our RF model.

4. Discussion

4.1. Challenges of Mapping Burned Area on Wetlands

In this manuscript, we have assessed the extent of the BA during the Pantanal 2020 fire crisis. Here, we basically focused on some well-known methodologies (shade fraction images derived from the LSMM and spectral indices) together with new remote sensing systems (MSI sensor, which offers different trade-offs than Landsat and MODIS sensors) to improve the accuracy of the BA estimate. Shade-fraction images derived from the LSMM, and also the NDVI and NBR indices, have been used extensively to map and monitor BA [18,19,20] and here we have explored the potential of integrating these variables associated with the advantages of the spatial and temporal characteristics of the MSI sensor. Our method generates fraction and spectral indices images that highlight the BA to facilitate the classification processing. Then, we compared our results with four existing BA products, two derived from Landsat (MapBiomas Fogo collection 1.0 and GABAM) and two derived from MODIS (MCD64A1 collection 6.0 and Fire_cci version 5.1) orbital images.
Comparing our results with those BA products, we found that while the spatial patterns were very similar, the BA estimates varied between 20% and 68% in area and the overall accuracy varied between 55% and 76%. The intra-annual variation in the BA estimated by these products is due to the data and methods used to generate them. While MapBiomas Fogo and GABAM use Landsat images (30 m) with a temporal resolution of 16 days, the MCD64A1 and Fire_cci products use MODIS images (250 m) with almost daily temporal resolution. Notably, for BA mapping it is necessary to have both adequate spatial and temporal resolutions to accurately identify this disturbance in the Pantanal. In that manner, the Sentinel-2-derived MSI images can fill this gap by having a better spatial resolution (20 m) compared with MODIS images and a better temporal resolution (5 days) compared with Landsat images.
Given the stated advantages of the MSI sensor compared with Landsat and MODIS sensors to map BA extent, our approach showed higher accuracy in detecting this disturbance. The spatial resolution of MSI enables the detection of smaller burn scars compared with the MODIS sensor and its temporal resolution increases the acquisition of smoke-free images after a fire event compared with Landsat. However, there is a trade-off between omission and inclusion errors. The validation showed that our approach produces lower omission errors (~6%) of BAs compared with the Fire_cci (~47%), MCD64A1 (~53%), MapBiomas Fogo (~57%), and GABAM (~64%) products. In contrast, our approach presented inclusion errors of around 10% for detecting BAs, which is lower than the inclusion errors observed in Fire_cci (~12%), equal to those in MCD64A1 (~10%), but higher than those in MapBiomas Fogo (~6%) and GABAM (~4%), which means that our approach results in BA overestimates. These errors were particularly observed at the boundaries of flooded areas and using a buffer in the flood mask [3] could reduce these uncertainties. Recent studies have found similar results (i) in comparisons between BAs estimated by Sentinel-2 and other global products, with Fire_cci omitting more than 30% of the BA [16], and (ii) in error estimates, with Landsat and Sentinel-2 leading to commission errors of around 10% and omission errors ranging between 27% and 35% [17]. Also, these previous studies demonstrate that the accuracy varied according to the LULC type or even the study area.
The difficulty of generating a new BA product is mainly related to the characteristics of the orbital sensor and the method for detecting a burn scar [12,18]. These differences incorporate limitations in each product, leading to underestimates or overestimates, particularly in regional analysis [12]. Considering the characteristics of the Pantanal biome, where the flooding process is dynamic over most of the year and the response of grasslands and savannas after fire events is accelerated, accurate detection of the BA could be challenging. These temporal and spatial characteristics result in a complex mixed spectral signal detected by remote sensors.
Considering the use of mixing models to detect burned areas, Cochrane [42] demonstrated their effectiveness in the Amazon rainforest with an overall accuracy of 84% using Landsat Thematic Mapper (TM), highlighting that the spectral signatures of the BA varied according to the timing of a post-fire event. Since shade fraction highlights low reflectance components in the pixel, this may include other sources of BA errors such as water bodies, tree-canopy shading, and moist soils. Then, the information provided by other spectral indices, such as the NDVI and NBR, increase the ability to separate burned and unburned areas, which was demonstrated in the relative importance values of all predictor variables in the RF models (Figure 5). This can be attributed to their discriminative capabilities and sensitivity to fire-induced changes in vegetation and surface properties and, therefore, their combination provides a comprehensive change detection in vegetation condition, shade distribution, and surface responses, resulting in improved accuracy of the BA classification using RF.
Most of the studies using mixing models to detect BA, however, have been conducted in rainforests or other forest types [21,22,23,24,25,26], and there is a lack of knowledge about the effects of burned areas on wetland ecosystems. For example, knowing the relationships of indicators such as fire severity and post-fire vegetation responses to the spectral responses retrieved using orbital remote sensing could support the identification of important predictor variables and improve the accuracy of classification models.

4.2. Impacts and Perspectives of Burned Area Estimates

The worst recorded fire episode in the history of the Pantanal occurred in 2020 [43], and, as a consequence, severe ecosystem destruction and biodiversity loss were linked to this unique event [4]. Assessing the extension of fires accurately is essential to understand how different wetland–climate–fire feedbacks may exacerbate the long-term expected devastating fire events in this region. However, the large estimation differences that we observed between BA products may reflect significant differences in carbon emission estimations [19], quantifications of the affected LULC, and impact the fire-management and decision-making processes. With the prospect of improving the accuracy of the current BA products, it could be mentioned the possibility of using BA classifications derived from Sentinel-2 as a reference for calibrating global BA products, for example, by (i) considering a regular grid cell of 500 m distributed over the Pantanal (spatial resolution of the MCD64A1 product); (ii) summing all BAs estimated using our method in 2020 to the cells of this grid; (iii) comparing the estimates to those of the MCD64A1 product within each grid cell; and (iv) correlating the values to define how underestimated the MCD64A1 product is in relation to our method. Therefore, the coefficient found could be applied to all the MCD64A1 estimates in the Pantanal. This calibration is of utmost importance because MODIS and Landsat images are made available for a longer time series (since 2000 and 1985, respectively); therefore, they are the only options for analyzing the years prior to 2015 and this might result in more accurate estimates of BAs in the long-term.

5. Conclusions

The proposed BA mapping approach based on Sentinel-2 images presents advantages over existing BA products available for the Pantanal, and, therefore, refines the BA estimates at the regional scale. This brings to light the necessity of developing approaches that aim to improve data and theory about the impacts of fire in regions critically sensitive to climate change, such as the Pantanal, in order to improve Earth systems models that forecast wetland–atmosphere interactions, and the role of these fires on current and future climate change over these regions. It is important to note that every method has its own set of strengths and limitations, and the choice of approach depends on the specific objectives and requirements of the study. It is crucial to minimize both types of errors—commission (overestimates) and omission (underestimates)—in the context of estimating BAs accurately. Our approach achieved an accuracy around 96% and, consequently, the results obtained here will help to improve the estimate of trace gasses and aerosols associated with biomass burning, where global biomass burning inventories are widely known for having biases at a regional scale.

Supplementary Materials

The following supporting information can be downloaded at: https://www.mdpi.com/article/10.3390/fire6070277/s1, Figure S1: Spatial distribution of training (black polygons) and validation samples from burned (red dots) and unburned (green dots) areas in 2020 across the Pantanal biome, Brazil. Training and validation samples are separate datasets, representing 115 and 194 samples, respectively, without any overlay. Note that the representation has been enlarged to enhance visualization; Figure S2: Spatial distribution of the burned area mapped in the Brazilian Pantanal biome during the 2020 fire crisis using MSI sensor images onboard the Sentinel-2 satellites; Table S1: Confusion matrix based on the validation samples (reference) and the MapBiomas Fogo BA classification for the year 2020 (prediction) showing the overall accuracy (OA), confidence interval (CI), producer accuracy (PA) and user accuracy (UA); Table S2: Confusion matrix based on the validation samples (reference) and the MCD64A1 BA classification for the year 2020 (prediction) showing the overall accuracy (OA), confidence interval (CI), producer accuracy (PA) and user accuracy (UA); Table S3: Confusion matrix based on the validation samples (reference) and the GABAM Fire BA classification for the year 2020 (prediction) showing the overall accuracy (OA), confidence interval (CI), producer accuracy (PA) and user accuracy (UA); Table S4: Confusion matrix based on the validation samples (reference) and the Fire_cci BA classification for the year 2020 (prediction) showing the overall accuracy (OA), confidence interval (CI), producer accuracy (PA) and user accuracy (UA).

Author Contributions

Conceptualization, Y.E.S., E.A., A.C.D. and G.M.; methodology, Y.E.S., E.A., A.C.D. and G.M.; writing—original draft preparation, Y.E.S., G.P., F.C., A.C.D. and G.M.; writing—review and editing, Y.E.S., A.C.D., G.M. and G.d.O. All authors have read and agreed to the published version of the manuscript.

Funding

G.M. thanks the São Paulo Research Foundation (FAPESP—grants 2019/25701-8, 2023/03206-0, 2016/02018-2, and 2020/15230-5) for funding. A.C.D. also thanks the FAPESP for funding (grants 2022/01746-5 and 2023/02386-5).

Institutional Review Board Statement

Not applicable.

Informed Consent Statement

Not applicable.

Data Availability Statement

All data and codes used in the current study are available on request from the corresponding author.

Conflicts of Interest

The authors declare no conflict of interest.

References

  1. Libonati, R.; DaCamara, C.C.; Peres, L.F.; Sander de Carvalho, L.A.; Garcia, L.C. Rescue Brazil’s burning Pantanal wetlands. Nature 2020, 588, 217–219. [Google Scholar] [CrossRef] [PubMed]
  2. Keddy, P.A.; Fraser, L.H.; Solomeshch, A.I.; Junk, W.J.; Campbell, D.R.; Arroyo, M.T.K.; Alho, C.J.R. Wet and Wonderful: The World’s Largest Wetlands Are Conservation Priorities. BioScience 2009, 59, 39–51. [Google Scholar] [CrossRef] [Green Version]
  3. Pereira, G.; Ramos, R.d.C.; Rocha, L.C.; Brunsell, N.A.; Merino, E.R.; Mataveli, G.A.V.; Cardozo, F.d.S. Rainfall patterns and geomorphological controls driving inundation frequency in tropical wetlands: How does the Pantanal flood? Prog. Phys. Geog. 2021, 45, 669–686. [Google Scholar] [CrossRef]
  4. Mataveli, G.A.V.; Pereira, G.; de Oliveira, G.; Seixas, H.T.; Cardozo, F.D.S.; Shimabukuro, Y.E.; Kawakubo, F.S.; Brunsell, N.A. 2020 Pantanal’s widespread fire: Short- and long-term implications for biodiversity and conservation. Biodivers. Conserv. 2021, 30, 3299–3303. [Google Scholar] [CrossRef]
  5. Marques, J.F.; Alves, M.B.; Silveira, C.F.; Amaral, E.S.A.; Silva, T.A.; Dos Santos, V.J.; Calijuri, M.L. Fires dynamics in the Pantanal: Impacts of anthropogenic activities and climate change. J. Environ. Manag. 2021, 299, 113586. [Google Scholar] [CrossRef]
  6. Ferreira Barbosa, M.L.; Haddad, I.; da Silva Nascimento, A.L.; Máximo da Silva, G.; Moura da Veiga, R.; Hoffmann, T.B.; Rosane de Souza, A.; Dalagnol, R.; Susin Streher, A.; Souza Pereira, F.R.; et al. Compound impact of land use and extreme climate on the 2020 fire record of the Brazilian Pantanal. Glob. Ecol. Biogeogr. 2022, 31, 1960–1975. [Google Scholar] [CrossRef]
  7. Marengo, J.A.; Ambrizzi, T.; Barreto, N.; Cunha, A.P.; Ramos, A.M.; Skansi, M.; Molina Carpio, J.; Salinas, R. The heat wave of October 2020 in central South America. Int. J. Climatol. 2021, 42, 2281–2298. [Google Scholar] [CrossRef]
  8. Thielen, D.; Ramoni-Perazzi, P.; Puche, M.L.; Márquez, M.; Quintero, J.I.; Rojas, W.; Soto-Werschitz, A.; Thielen, K.; Nunes, A.; Libonati, R. The Pantanal under Siege—On the Origin, Dynamics and Forecast of the Megadrought Severely Affecting the Largest Wetland in the World. Water 2021, 13, 3034. [Google Scholar] [CrossRef]
  9. Thielen, D.; Schuchmann, K.L.; Ramoni-Perazzi, P.; Marquez, M.; Rojas, W.; Quintero, J.I.; Marques, M.I. Quo vadis Pantanal? Expected precipitation extremes and drought dynamics from changing sea surface temperature. PLoS ONE 2020, 15, e0227437. [Google Scholar] [CrossRef] [Green Version]
  10. Martins, P.I.; Belém, L.B.C.; Szabo, J.K.; Libonati, R.; Garcia, L.C. Prioritising areas for wildfire prevention and post-fire restoration in the Brazilian Pantanal. Ecol. Eng. 2022, 176, 106517. [Google Scholar] [CrossRef]
  11. Tomas, W.M.; Berlinck, C.N.; Chiaravalloti, R.M.; Faggioni, G.P.; Strussmann, C.; Libonati, R.; Abrahao, C.R.; do Valle Alvarenga, G.; de Faria Bacellar, A.E.; de Queiroz Batista, F.R.; et al. Distance sampling surveys reveal 17 million vertebrates directly killed by the 2020’s wildfires in the Pantanal, Brazil. Sci. Rep. 2021, 11, 23547. [Google Scholar] [CrossRef] [PubMed]
  12. Pessôa, A.C.M.; Anderson, L.O.; Carvalho, N.S.; Campanharo, W.A.; Junior, C.H.L.S.; Rosan, T.M.; Reis, J.B.C.; Pereira, F.R.S.; Assis, M.; Jacon, A.D.; et al. Intercomparison of Burned Area Products and Its Implication for Carbon Emission Estimations in the Amazon. Remote Sens. 2020, 12, 3864. [Google Scholar] [CrossRef]
  13. Vanderhoof, M.K.; Hawbaker, T.J.; Teske, C.; Ku, A.; Noble, J.; Picotte, J. Mapping Wetland Burned Area from Sentinel-2 across the Southeastern United States and Its Contributions Relative to Landsat-8 (2016–2019). Fire 2021, 4, 52. [Google Scholar] [CrossRef]
  14. Arisanty, D.; Feindhi Ramadhan, M.; Angriani, P.; Muhaimin, M.; Nur Saputra, A.; Puji Hastuti, K.; Rosadi, D.; Mishra, R.K. Utilizing Sentinel-2 Data for Mapping Burned Areas in Banjarbaru Wetlands, South Kalimantan Province. Int. J. For. Res. 2022, 2022, 1–12. [Google Scholar] [CrossRef]
  15. Li, X.; Song, K.; Liu, G. Wetland Fire Scar Monitoring and Its Response to Changes of the Pantanal Wetland. Sensors 2020, 20, 4268. [Google Scholar] [CrossRef]
  16. Roteta, E.; Bastarrika, A.; Franquesa, M.; Chuvieco, E. Landsat and Sentinel-2 Based Burned Area Mapping Tools in Google Earth Engine. Remote Sens. 2021, 13, 816. [Google Scholar] [CrossRef]
  17. Roteta, E.; Bastarrika, A.; Ibisate, A.; Chuvieco, E. A Preliminary Global Automatic Burned-Area Algorithm at Medium Resolution in Google Earth Engine. Remote Sens. 2021, 13, 4298. [Google Scholar] [CrossRef]
  18. Shimabukuro, Y.E.; Dutra, A.C.; Arai, E.; Duarte, V.; Cassol, H.L.G.; Pereira, G.; Cardozo, F.d.S. Mapping Burned Areas of Mato Grosso State Brazilian Amazon Using Multisensor Datasets. Remote Sens. 2020, 12, 3827. [Google Scholar] [CrossRef]
  19. Hislop, S.; Jones, S.; Soto-Berelov, M.; Skidmore, A.; Haywood, A.; Nguyen, T. Using Landsat Spectral Indices in Time-Series to Assess Wildfire Disturbance and Recovery. Remote Sens. 2018, 10, 460. [Google Scholar] [CrossRef] [Green Version]
  20. Alcaras, E.; Costantino, D.; Guastaferro, F.; Parente, C.; Pepe, M. Normalized Burn Ratio Plus (NBR+): A New Index for Sentinel-2 Imagery. Remote Sens. 2022, 14, 1727. [Google Scholar] [CrossRef]
  21. Assine, M.L.; Merino, E.R.; Pupim, F.d.N.; Macedo, H.d.A.; Santos, M.G.M.d. The Quaternary alluvial systems tract of the Pantanal Basin, Brazil. Braz. J. Geol. 2015, 45, 475–489. [Google Scholar] [CrossRef] [Green Version]
  22. Ivory, S.J.; McGlue, M.M.; Spera, S.; Silva, A.; Bergier, I. Vegetation, rainfall, and pulsing hydrology in the Pantanal, the world’s largest tropical wetland. Environ. Res. Lett. 2019, 14, 124017. [Google Scholar] [CrossRef] [Green Version]
  23. Miranda, C.d.S.; Paranho Filho, A.C.; Pott, A. Changes in vegetation cover of the Pantanal wetland detected by Vegetation Index: A strategy for conservation. Biota Neotrop. 2018, 18, e20160297. [Google Scholar] [CrossRef] [Green Version]
  24. Teluguntla, P.; Thenkabail, P.S.; Oliphant, A.; Xiong, J.; Gumma, M.K.; Congalton, R.G.; Yadav, K.; Huete, A. A 30-m landsat-derived cropland extent product of Australia and China using random forest machine learning algorithm on Google Earth Engine cloud computing platform. ISPRS J. Photogramm. Remote Sens. 2018, 144, 325–340. [Google Scholar] [CrossRef]
  25. Breiman, L. Random Forests. Mach. Learn. 2001, 45, 5–32. [Google Scholar] [CrossRef] [Green Version]
  26. Shimabukuro, Y.E.; Smith, J.A. The least-squares mixing models to generate fraction images derived from remote sensing multispectral data. IEEE Trans. Geosci. Remote Sens. 1991, 29, 16–20. [Google Scholar] [CrossRef]
  27. Rouse, J.W.; Haas, R.H.; Schell, J.A.; Deering, D.W. Monitoring vegetation systems in the Great Plains with ERTS. In Proceedings of the Third Earth Resources Technology Satellite-1 Symposium, Washington, DC, USA, 10–14 December 1973. [Google Scholar]
  28. García, M.J.L.; Caselles, V. Mapping burns and natural reforestation using thematic Mapper data. Geocarto Int. 2008, 6, 31–37. [Google Scholar] [CrossRef]
  29. Hudak, A.T.; Morgan, P.; Bobbitt, M.J.; Smith, A.M.S.; Lewis, S.A.; Lentile, L.B.; Robichaud, P.R.; Clark, J.T.; McKinley, R.A. The Relationship of Multispectral Satellite Imagery to Immediate Fire Effects. Fire Ecol. 2007, 3, 64–90. [Google Scholar] [CrossRef]
  30. Quintano, C.; Shimabukuro, Y.E.; Fernández, A.; Delgado, J.A. A spectral unmixing approach for mapping burned areas in Mediterranean countries. Int. J. Remote Sens. 2007, 26, 1493–1498. [Google Scholar] [CrossRef]
  31. Fernández-Guisuraga, J.M.; Calvo, L.; Suárez-Seoane, S. Comparison of pixel unmixing models in the evaluation of post-fire forest resilience based on temporal series of satellite imagery at moderate and very high spatial resolution. ISPRS J. Photogramm. Remote Sens. 2020, 164, 217–228. [Google Scholar] [CrossRef]
  32. Lewis, S.A.; Hudak, A.T.; Robichaud, P.R.; Morgan, P.; Satterberg, K.L.; Strand, E.K.; Smith, A.M.S.; Zamudio, J.A.; Lentile, L.B. Indicators of burn severity at extended temporal scales: A decade of ecosystem response in mixed-conifer forests of western Montana. Int. J. Wildland Fire 2017, 26, 755–771. [Google Scholar] [CrossRef] [Green Version]
  33. Smith, A.M.S.; Drake, N.A.; Wooster, M.J.; Hudak, A.T.; Holden, Z.A.; Gibbons, C.J. Production of Landsat ETM+ reference imagery of burned areas within Southern African savannahs: Comparison of methods and application to MODIS. Int. J. Remote Sens. 2007, 28, 2753–2775. [Google Scholar] [CrossRef]
  34. Xie, S.; Liu, L.; Zhang, X.; Yang, J.; Chen, X.; Gao, Y. Automatic Land-Cover Mapping using Landsat Time-Series Data based on Google Earth Engine. Remote Sens. 2019, 11, 3023. [Google Scholar] [CrossRef] [Green Version]
  35. Alencar, A.A.C.; Arruda, V.L.S.; Silva, W.V.d.; Conciani, D.E.; Costa, D.P.; Crusco, N.; Duverger, S.G.; Ferreira, N.C.; Franca-Rocha, W.; Hasenack, H.; et al. Long-Term Landsat-Based Monthly Burned Area Dataset for the Brazilian Biomes Using Deep Learning. Remote Sens. 2022, 14, 2510. [Google Scholar] [CrossRef]
  36. Long, T.; Zhang, Z.; He, G.; Jiao, W.; Tang, C.; Wu, B.; Zhang, X.; Wang, G.; Yin, R. 30 m Resolution Global Annual Burned Area Mapping Based on Landsat Images and Google Earth Engine. Remote Sens. 2019, 11, 489. [Google Scholar] [CrossRef] [Green Version]
  37. Giglio, L.; Boschetti, L.; Roy, D.P.; Humber, M.L.; Justice, C.O. The Collection 6 MODIS burned area mapping algorithm and product. Remote Sens. Environ. 2018, 217, 72–85. [Google Scholar] [CrossRef]
  38. Chuvieco, E.; Lizundia-Loiola, J.; Pettinari, M.L.; Ramo, R.; Padilla, M.; Tansey, K.; Mouillot, F.; Laurent, P.; Storm, T.; Heil, A.; et al. Generation and analysis of a new global burned area product based on MODIS 250 m reflectance bands and thermal anomalies. Earth Syst. Sci. Data 2018, 10, 2015–2031. [Google Scholar] [CrossRef] [Green Version]
  39. Olofsson, P.; Foody, G.M.; Herold, M.; Stehman, S.V.; Woodcock, C.E.; Wulder, M.A. Good practices for estimating area and assessing accuracy of land change. Remote Sens. Environ. 2014, 148, 42–57. [Google Scholar] [CrossRef]
  40. Giglio, L.; Schroeder, W.; Justice, C.O. The collection 6 MODIS active fire detection algorithm and fire products. Remote Sens. Environ. 2016, 178, 31–41. [Google Scholar] [CrossRef] [Green Version]
  41. Schroeder, W.; Oliva, P.; Giglio, L.; Csiszar, I.A. The New VIIRS 375 m active fire detection data product: Algorithm description and initial assessment. Remote Sens. Environ. 2014, 143, 85–96. [Google Scholar] [CrossRef]
  42. Cochrane, M.A. Linear mixture model classification of burned forests in the Eastern Amazon. Int. J. Remote Sens. 2010, 19, 3433–3440. [Google Scholar] [CrossRef]
  43. de Magalhães Neto, N.; Evangelista, H. Human Activity Behind the Unprecedented 2020 Wildfire in Brazilian Wetlands (Pantanal). Front. Environ. Sci. 2022, 10, 888578. [Google Scholar] [CrossRef]
Figure 1. Location of the Pantanal biome in South America. Base map is a Moderate Resolution Imaging Spectroradiometer (MODIS) sensor product MOD09A1 color composite R6G2B1 for the year 2019.
Fire 06 00277 g001
Figure 2. Monthly RGB (B4-B3-B2) mosaics (Sentinel-2A and -B) before (July 2020) and after (August 2020 or November 2020) fires in two different areas, showing affected areas and representation of samples (red square).
Fire 06 00277 g002
Figure 3. Annual burned area in the Brazilian Pantanal biome from 2003 to 2020 estimated using the products MapBiomas Fogo c1.0, GABAM, MCD64A1 c6.0, and Fire_cci v5.1. The year 2020 had the highest estimate during this time series for all the burned area products.
Fire 06 00277 g003
Figure 4. Spatial distribution of the burned area mapped in the Brazilian Pantanal biome during the 2020 fire crisis using MSI sensor images onboard the Sentinel-2 satellites and the four burned area products analyzed in this study.
Fire 06 00277 g004
Figure 5. Boxplot of the relative importance values (mean decrease impurity) of all predictive variables in the Random Forest model generated from each monthly classification. The black ‘+’ indicates the mean, the black line indicates the median, and the white dots indicate the maximum and minimum values. On the x-axis variables names the letter P means percentile.
Fire 06 00277 g005
Table 1. Description of the spectral bands available from the MSI sensor.
BandBand NameCentral Wavelength (nm)Spatial Resolution (m)
B02Blue49010
B03Green56010
B04Red66510
B08Near Infrared84210
B05Red Edge 170520
B06Red Edge 274020
B07Red Edge 378320
B08BRed Edge 486520
B11Shortwave Infrared 1161020
B12Shortwave Infrared 2219020
B01Aerosol44360
B09Water Vapor94060
B10Cirrus137560
Table 2. Description of the BA products based on Landsat and MODIS sensors used to evaluate the interannual variability of BA in the Pantanal since 2003 and to compare with the results obtained when estimating BA from the Sentinel-2 images during the 2020 Pantanal fire crisis.
InventoryInput DataSpatial ResolutionReference
MapBiomas Fogo c1.0Landsat30 mAlencar et al. [35]
GABAM Landsat30 mLong et al. [36]
MCD64A1 c6.0MODIS250 mGiglio et al. [37]
Fire_cci v5.1MODIS250 mChuvieco et al. [38]
Table 3. Confusion matrix based on the reference samples and the burned area classification (Sentinel-2) showing the overall accuracy (OA), confidence interval (CI), producer accuracy (PA), and user accuracy (UA).
Prediction
Not BurnedBurnedTotalUA (%)
ReferenceNot Burned4655190.2
Burned314014397.9
Total49145194
PA (%)93.996.6
OA, 95% CI (%)95.9, 92.0–98.2 (p-value < 0.05)
Precision0.90
Recall0.93
Table 4. Summarized overall accuracy (OA, %) and the respective 95% confidence interval (%) of each burned area product.
InventoryOA (%)95% CI (%)
Sentinel-2 classification95.992.0–98.2
GABAM54.647.3–61.8
MapBiomas Fogo c1.065.958.8–72.6
MCD64A1 c6.070.663.7–76.9
Fire_cci v5.176.369.7–82.1
Disclaimer/Publisher’s Note: The statements, opinions and data contained in all publications are solely those of the individual author(s) and contributor(s) and not of MDPI and/or the editor(s). MDPI and/or the editor(s) disclaim responsibility for any injury to people or property resulting from any ideas, methods, instructions or products referred to in the content.

