
Study on the Temperature and Smoke Movement in the Event of a Fire in a Semiclosed Tunnel under Water Spray

School of Safety and Emergency Management Engineering, Taiyuan University of Technology, Taiyuan 030000, China
*
Author to whom correspondence should be addressed.
Fire 2023, 6(8), 324; https://doi.org/10.3390/fire6080324
Submission received: 21 June 2023
/
Revised: 14 August 2023
/
Accepted: 16 August 2023
/
Published: 20 August 2023
(This article belongs to the Special Issue Fire Prevention and Control in Urban Infrastructure and Underground Space)
Abstract
:Semiclosed tunnels are very common in engineering construction. They are not connected, so they easily accumulate heat. Once a fire breaks out in a semiclosed tunnel, the route for rescue workers to enter is limited, so it is tough to get close to the fire source. In this paper, taking a mine excavation roadway with local pressure ventilation as an example, the temperature field distribution and water spray fire prevention characteristics of the excavation roadway face were studied using numerical simulation and theoretical analysis. This paper provides an explanation of a dynamics-based smoke management method for water spraying in a semiclosed tunnel as well as the equilibrium relationship between droplet drag force and smoke buoyancy. A method was first developed to calculate the quantity of smoke blockage based on the thickness of the smoke congestion. The local ventilation and smoke movement created a circulating flow in the excavation face, which was discovered by investigating the velocity and temperature fields of the excavation face. The size of the high-temperature area and the pattern of temperature stratification varied due to this circulating flow. When local ventilation and sprinkler systems were operating simultaneously, when the volume of smoke was small, the smoke avoided the majority of the water spray effect with the circulation flow; however, when the volume of smoke was large, the effect of the circulation flow decreased and the smoke gathered close to the sprinkler head. At this time, the blocking effect of the water spray was significant. The mean square error analysis revealed that activating the sprinkler had the most significant cooling impact on the wall on one side of the air duct.
1. Introduction
1.1. Research Motivation
In the construction process of highway tunnels, subways, mine roadways, and so on, due to the actual demand of tunnel excavation, fire door closure, and mine roadway excavation, and so on, there is inevitably a semiclosed tunnel [1]. The gasoline and supporting equipment needed for construction will cause a greater fire risk. Once the fire occurs in the semiclosed tunnel, the route for rescue workers to enter the fire site is limited, so getting close to the fire source is very difficult. The high-temperature smoke will destroy the completed tunnel structure and cause casualties [2]. Therefore, it is necessary to explore the fire smoke development characteristics and develop means to prevent and control smoke in semiclosed tunnels. This paper takes a typical semiclosed tunnel mine driving roadway as an example to study the related problems [3].
The ventilation system in an excavation roadway is specially arranged, and the airflow at the exit of the press-in air duct belongs to the limited wall jet, which will feel the effects of the jet, reflux, eddy current, and so on [4]. The power of the airflow promotes smoke movement. When gas accumulates in the excavation face, the airflow will carry the gas to the fire to form an explosion. Fresh air provides oxygen for the fire, which may result in an open fire in the smoldering area and further worsen the disaster. When the fire is out of control, the high-temperature smoke will burn the air duct and destroy the ventilation system in the excavation roadway. A large amount of high-temperature toxic gas will flow to the main branch road that has been connected, enlarging the scope of the disaster [5].
The traditional calculation method of mine fires is unsuitable for treating excavation roadway fires [6,7]. The fire smoke movement analysis of the mine ventilation system can be called “network” fire analysis, which is mainly calculated based on the node balance law in the through state. Its primary purpose is to analyze the one-dimensional movement law of smoke in the roadway network. It can predict fluctuation of wind pressure in the network and help control fan regulation in advance to prevent enlarging the scope of disasters. The three-dimensional field of fire development in unconnected excavation roadways is poorly dealt with [8].
To sum up, fires in excavation roadways are very harmful. The fire development process is complex, and research on traditional mine fire prevention and control systems is relatively scarce. Pressure ventilation is mainly used in excavation faces in China, so it is necessary to explore their relevant characteristics with pressure ventilation during a fire.
1.2. Related Work
According to the research content of this paper, this paper mainly summarizes the literature in three parts: semiclosed or excavated tunnel fire, fire prevention and control of tunnel sprinkler facilities, and mine fire prevention and control.
YongZhen Yao [2] studied the fire characteristics in tunnel construction. A model-scale tunnel was built, and fire tests were carried out. The results showed that when a fire broke out at the closed end of the inclined traffic tunnel, the fire did not go out by itself, even when the ventilation rate was 0 m3/s. The corresponding smoke propagation speed was higher than in the horizontal main tunnel. The results of this study provide new experimental information, which will help to improve understanding of the characteristics of tunnel fires during construction and allow firefighters to make better decisions in the rescue process. Jinlong Zhao [9] discussed the influence of fire location and air volume on the development of tunnel fires. The distribution characteristics of the flow field in the longitudinal section of the excavation space were analyzed and divided into three regions: turbulent zone, turbulent transition zone, and steady flow zone. Changkun Chen [10] studied the influence of asymmetric sealing at tunnel entrances on tunnel fire behavior and temperature distribution through simplified experiments. The results showed that the intensity of fire combustion was related to the sealing ratio, and the lower the sealing ratio, the more intense the fire. Jiaqiang Han [11] used experimental and numerical methods to study a semiclosed tunnel’s downstream temperature distribution and smoke movement with different slopes. The results showed that when the fire occurred on the closed side of the horizontal tunnel, the smoke plume tended to be on the closed side; in addition, the inclination for the tunnel with a slope was more severe as the slope increased. Zihao Wang [12] studied the distribution characteristics of the maximum temperature of the tunnel roof under different closed conditions. The simulation took the wide blocking ratio and the high blocking ratio of a subway train as variables. The results showed that both the vertical and downstream temperatures decreased as the broad plugging ratio decreased. In contrast, the vertical temperature dropped and the downstream temperature increased as the high plugging ratio decreased.
Cooper [13] first explored the mechanism of smoke movement under the action of spray. Based on theoretical analysis, he established a mathematical model of smoke movement under the action of water spray. Sun jiayun [14] conducted a CFD simulation of small tunnel fire tests with longitudinal mechanical ventilation and an active sprinkler system (FDS 6.0.1). The influence of longitudinal mechanical ventilation was discussed based on the average flow and temperature fields. Near the fire source, the plume hindered the longitudinal ventilation flow, the airflow bent outward, hot smoke was brought to the side wall of the tunnel, and a temperature trough was formed before the air below the ceiling converged again in the center. Chen [15] conducted spray experiments using a tunnel with a model size of 1/5.5. The results showed that under the ventilation speed of 0.87 m/s, the back layer of smoke was 2 m when there was no water spray. However, with water spray, there was no back layer of smoke. Finally, the existence of spraying facilities could prevent the retrogression of smoke to a great extent. Jun Qin [16] studied the mechanism of water mist extinguishing an oil mist fire in a confined space. The results showed that the main reasons for the fire being extinguished were the decrease in flame temperature, thermal radiation, and oxygen concentration, and the fire extinguishing speed of the system was fast when the working pressure of the nozzle increased. By preheating the water mist and increasing the partial pressure of the water mist in the saturated wet air, the decrease in oxygen concentration led to incomplete combustion of soot, which adhered to the oil surface, hindered its volatilization, and achieved the fire extinguishing effect. E. Blanchard [17] used the FDS simulation program to study the interaction between water fog and heat flow in a longitudinal ventilation tunnel. Water had a solid thermal effect because the experiments showed about half of the heat released by a fire was absorbed by water droplets. Heat transfer from the gas phase to the droplets was the primary mechanism (73%). The remaining heat absorbed by droplets came from tunnel surface cooling (9%) and radiation attenuation (18%). Ciro Caliendo [18] used CFD to simulate a particulate water system’s fire-extinguishing effect on an emergency vehicle. The results showed that the particulate water system could significantly improve the environmental conditions of the escape path, which was related to changes in the temperature, radiant heat flux, and CO concentration.
Wang Kai [19] used a ventilation simulation software (VSS) to analyze various fire scenarios and their respective smoke flow. Different smoke flow control methods were simulated under different ventilation modes, and their effects were compared and analyzed. The best control method for smoke flow paths in various fire situations was determined. Chuan Gang Fan [20] used the Fire Dynamics Simulator to simulate a fire in a mine’s horizontal roadway and studied how the chimney effect affected smoke movement in the inclined road. The study showed that increasing the length or angle of the inclined roadway could help reduce the backflow length of the horizontal roadway, thus allowing more smoke to flow into the inclined roadway. Chang Liu [21] investigated the roof temperature distribution of fire smoke in the public node area of a tunnel that consisted of one straight lane and two curved lanes. The calculated results were consistent with the maximum roof temperature of the main tunnel’s measured values. The study analyzed the accumulation and diffusion of flue gas in front of the roadway entrance based on the measured temperature. It also discussed the effects of vertical wall height and roof height on the temperature attenuation trend of branch roadways.
1.3. Necessity of Research Based on Challenges in the Literature
After summarizing the above literature, combined with the engineering characteristics in the field of tunnel fire, the following conclusions are drawn:
- It is common to find semiclosed tunnels in engineering construction, but they pose a hidden fire risk. If a fire breaks out, there is only one rescue and escape route, which could lead to severe consequences. Previous studies on the fire characteristics of semiclosed tunnels have overlooked the ventilation system because these tunnels are not interconnected. A mine-driving roadway is an example of a semiclosed roadway that uses local press-in ventilation in the driving face. This type of ventilation produces a limited adherent jet airflow, which can mix smoke in the enclosed space and make the smoke migration more complex.
- As wet dedusting is usually carried out in the mine excavation face, it can be seen that it is feasible to add sprinkler facilities in the heading roadway. The research on spray fire prevention mainly focuses on highway tunnels and ground buildings, but there needs to be more research on spray fire prevention in semiclosed mine tunneling roadways.
- The research on traditional mine fires focuses on the movement of smoke in the air network. The laws of air volume and energy conservation are all aimed at the connected network, and they do not deal well with fire development in an independent tunneling system. Mine excavation roadway is a particular type of semiclosed boundary tunnel; its ventilation depends on the local fan but is also limited by the overall ventilation network of the mine. Mine excavation has more fire-hidden dangers than a ground tunnel, such as gas, rubber, diesel, and so on. The smoke generated by the fire can easily move along the ventilation network and enlarge the scope of the disaster.
1.4. Novelty and Main Contributions
This paper makes a preliminary study on fire development in heading roadways. The specific contributions made are as follows:
- In this paper, a dynamic model of smoke movement under the action of water spray in heading roadways is established, the balanced relationship between water spray drag force and smoke buoyancy is discussed, and the prevention and control mechanism of water spray on fire smoke in heading roadway face is presented.
- The influence of local ventilation on the velocity and temperature fields of the heading face is explored by numerical simulation. It is discovered that local ventilation and smoke movement create circulating flow in the excavation face.
- This paper analyzes the temperature characteristics in the excavation face when the spray facilities are opened, analyzes the cooling effects of the liquid droplets and circulating airflow on the fire, and compares the liquid droplets’ cooling effects on different longitudinal roadway positions.
- The mine excavation roadway fire studied in this paper is a typical semiclosed tunnel end fire. This paper provides ideas and meaningful conclusions for studying semiclosed tunnel end fires.
1.5. Research Methods
This study deals with the movement of fire smoke and the effect of water sprinklers in an excavation roadway with local ventilation. Due to various factors affecting the smoke migration process in the excavation face, such as local ventilation, water spraying, and thermal buoyancy, it is challenging to directly explore the smoke characteristics. The rest of the paper is divided into three modules: the first module focuses on the theoretical derivation of the smoke movement model under the influence of water spray in an excavation roadway without ventilation, the second module explores the impact of local ventilation on the velocity and temperature fields of the excavation face by numerical simulation with the sprinkler facilities turned off, and the third module analyzes the movement of fire smoke and the effect of the water sprinkler when both the local ventilation and sprinkler facilities are turned on. The logical relationship between the three modules is illustrated in Figure 1.
2. Introduction of Numerical Simulation
2.1. Model Structure
This study established the excavation face model shown in Figure 2. The width was 4 m, the height was 3 m, and the ventilation distance was 50 m. According to the effective distance Equation (1) of the local fan duct jet, the diameter of the air duct was 600 mm and the side length of the square section in the model was about 500 mm. The Coal Mine Safety regulations require that the air volume in the heading roadway should not be less than 0.15 m/s. The wind speed of the air duct was calculated to be 6.5 m/s, and the wind speed of the main road was selected as 2.5 m/s. The front section of the air duct was 12 m away from the entrance of the excavation roadway [22,23]. The distance between the tail of the wind tube and the heading face was 15 m.
In Equation (1), S is the cross-sectional area of the roadway, m2; L is the effective length of the air duct jet, m.
The wall of the tunnel was set to INERT. Any temperature change in the environment was not obvious, and the heat could be transferred from the ambient gas to the inert surface.
2.2. Fire Source Setting
The fire source setting was determined by referring to the international standard “Fire Safety Engineering Part 4: Setting Fire Scene and Setting Fire Selection” and “Technical Standard for Building Smoke Prevention and Exhaust System GB51251-2017 [24]”. The fire heat release rate of the office furniture was 1.5 Mw. Due to the narrow underground space and fewer combustibles, the fire heat release power was set to 1 Mw, and the combustibles were made of wood. It is known that a stacked wooden frame has a rapid fire potential, and the fire growth rate is 0.0469. Therefore, the fire development time was set as 146 s. The installation of the local fan must be suspended or cushioned, so the height from the ground must be more than 0.3 m and the air duct should be 2.8 m from the surface [25,26].
The heat release rate of the Burner surface was set to 1000 kw/m2, and the Burner surface was set on the vent. The specific coordinates were Z = 0.5 m, Xmax = 53 m, Xmin = 54 m, Ymin = 21.6 m, and Ymax = 22.6 m, and the area was 1 m2. The vent was set on a solid obstacle. The typical HRR of the fire source is shown in Figure 3.
2.3. Grid Sensitivity Analysis
The FDS simulation results are closely related to the mesh size. When the grid size is large, the error of the simulation result is significant. Smaller mesh sizes can obtain more accurate results, but the resulting high number of meshes means the process will be more and more time-consuming. When the mesh is fine enough, reducing the mesh size will not affect the calculation accuracy [27,28]. The study shows that when the characteristic diameter of the fire source is 4–16 times the grid size, the simulation results’ accuracy can meet the research needs. The calculation of the fire source diameter is shown in Equation (2).
In the equation, Q is the power of the fire source, kW; is the density of the incoming air, kg/m3; is the constant pressure specific heat capacity of the incoming air, J/(kgK), kg/m3; is the ambient temperature, K; and g is the gravitational acceleration, m/s2.
The calculated . The operating conditions were set to those shown in Table 1 to analyze the network sensitivity [29]. The selected measuring point was the measuring point directly above the fire source, as shown in Figure 4a.
As can be seen in Figure 4, when the grid was 0.11, the calculation results did not change significantly. Therefore, the grid size of 0.1 m × 0.1 m × 0.1 m3 was selected in this study.
2.4. Design of the Working Conditions
This study analyzed an excavation roadway without sprinkler facilities and the working conditions with sprinkler facilities. Three operating conditions were set, as shown in Table 2. The total simulation time was 400 s, and the program automatically set the simulation step according to the calculation conditions.
3. Dynamic Model of Smoke Movement under Spray
Applying a wet dust collector in the excavation face is more common [30,31]. It is easy to deduce that setting up sprinkler equipment in the excavation roadway is also feasible. This section discusses the development of fire smoke in the case of sprinkler equipment installed in the excavation roadway without local ventilation.
The main difference between the smoke movements in the excavation roadway and the connected roadway is that when the smoke capacity is saturated in the closed space on one side, the phenomenon of smoke movement to the exit will inevitably occur. After the spray area destroys the smoke stratification, the smoke will gradually fill the right space of the spray to slow down the speed of the smoke movement. There are three forces in the dynamic model of smoke movement in an excavation roadway: the wall jet of the local fan, the droplet drag force of the spray facilities, and the energy of smoke. There are two main functions of the spray system in the excavation roadway: one is to slow down the movement of smoke to the exit of the excavation roadway, and the other is to reduce the temperature. This section intends to explore these two angles. The spray facility destroys the relative relationship and stability of the temperature–smoke layer stratification in the smoke flow, so the integral ratio method built in FDS cannot be used to directly calculate the smoke layer thickness.
After the spray starts, the water beam ejects from the nozzle and hits the splashing plate, spraying many liquid droplets into the fire. The droplets will form a semispindle-shaped coverage area, and the fire smoke enters the spray cover area to interact with the droplets, showing the characteristics of cooling and sedimentation [32,33]. On the one hand, the droplet can reduce the temperature of the smoke layer through heat transfer; on the other hand, the droplet drag force can make the smoke layer unstable, leading to the occurrence of the “smoke congestion” phenomenon. The downward movement of the smoke will form a “congested jet”, which will greatly slow the smoke’s speed to the exit.
3.1. Drag Force of Liquid Droplets per Unit Area under Steady State
As shown in Figure 5, the thickness of the smoke layer is h, and the dark area in the picture is the spray–smoke interaction area. The microelement of the smoke column with a bottom region of is taken as the research object, and the intersection point between the top surface and the spray envelope is (xl, y1). If the smoke velocity is ignored, the vertical drag force produced by the droplet in the process of motion is related to the velocity in the X direction [34,35]:
In the equation, D(x) is the vertical drag force of the droplet at x, N; is the vertical velocity of the droplet, m/s; is the density of hot fume, kg/m3; is the drag coefficient, and when Re is 101–102, is approximately 0.6; and is the central cross-sectional area of the droplet, m2. According to Newton’s second law of motion, the vertical motion equation of the droplet can be expressed as follows:
In the equation, is the droplet mass, kg. For the integral of Equation (3), the expression of velocity can be expressed as follows:
The constant is related to the velocity boundary condition. According to the experimental results of D.T. Sheppard, the velocity of the spray droplet at the distance of 0.2 m from the spray virtual point source (the nozzle and the center of the splashing plate) is about 0.4–0.6 times the nozzle velocity [36]. For the spray droplets directly below the sprinkler head, the velocity direction is straight down, so the constant can be calculated according to the following equation:
In Equation (7), U is the velocity of the water beam ejected from the nozzle, m/s; is the x coordinate of the velocity, taking 0.2 m. According to the NFPA sprinkler product manual and the automatic sprinkler system design manual, the envelope of the sprinkler coverage area is parabolic [37,38].
As a result, the spray coverage area at x-height can be expressed as follows:
In Equation (9), is the spray coverage area, m2. The experimental results show that the radius of the spray cover area 3 m below the sprinkler is about 3 m, and the coefficient C is 3. Through an experiment, Chow found that the amount of water in the central area of the spray cover area is slightly more significant than that at the edge of the spray cover area [39]. To simplify the calculation, it is assumed that the amount of water is uniformly distributed on the cross section of any height of the spray cover area, and the number of liquid droplets per unit volume at x is as follows:
In the equation, is the total spray flow, kg/s, calculated according to the following equation:
In the equation, is the working pressure of the sprinkler head, MPa; is the water density, 1000 kg/m3; and K is taken as the discharge coefficient of the sprinkler. For the standard sprinkler with a nozzle diameter of 12.7 mm, K is 80 [37]. On any cross section, the vertical drag force per unit volume is the product of the number of droplets per unit volume and the drag force per droplet:
In this equation,
In Equation (13), dd is the droplet diameter, m. To simplify the calculation, for the spray droplet group whose CVF accords with the piecewise distribution of Rosin–Rammler and log-normal, the median diameter of the droplet group taken from its cumulative volume distribution is used to replace indicates that the sum of droplets with a diameter less than the fire equal to accounts for 50% of the total mass, which is calculated by the following equation.
In the equation, is a constant related to the diameter of the nozzle. It is worth pointing out that changing the spray volume and the working pressure of the sprinkler does not affect the size of . For a sprinkler with the diameter of 12.7 mm, the is 2.33. is the diameter of the nozzle, and is the Weber number, which is related to the surface tension of water and can be obtained from the following equation:
In the equation, is the surface tension of water. When the temperature is 20 °C, the value is 72.8 × 10⁻³ N/m, and the meaning of other variables is the same as before.
For the smoke column microelement in Figure 1, the total spray drag force per unit area can be expressed as follows:
By substituting Equations (9) and (13) into Equation (16) and replacing the droplet diameter with dm, the following results are obtained:
3.2. Total Buoyancy of Smoke per Unit Area in Steady State
At x-height, the smoke buoyancy B(x) per unit volume is related to the temperature, which can be calculated by the following equation:
In the equation, is the air density at the ambient temperature, kg/m3; T(x) is the flue gas temperature at the section, K; and is the ambient temperature, K. For a thin layer of smoke with a bottom area of as shown in Figure 5, the total buoyancy of smoke per unit area is as follows:
When the temperature rises slightly, the buoyancy per unit volume is approximately linear along the vertical direction. It can be obtained using the average temperature rise instead of (17), the temperature rise of smoke ():
3.3. Calculation of Blocking Smoke under the Action of Spray in Excavation Roadway
Water spraying can destroy the smoke layer and reduce the smoke migration to the excavation roadway’s exit. Its effect mainly comes from two points: one is the supplement of the surrounding smoke to the original position when the droplets drag the smoke to the lower part of the sprinkler head, and the other is the flexible barrier effect on the subsequent smoke when the droplets form a stable mixture with the smoke, as shown below.
In Figure 6a, the smoke stratifies before the sprinkler facility opens, creating a stable layer with a thickness of x1. It moves towards the exit along the roof. In Figure 6b, the droplets from the sprinkler cause the smoke layer to become unstable, leading to a downward movement that results in a “congestion jet” within the water mist envelope area. This area has a length of h. In Figure 6c, the water mist creates a flexible barrier with a height of h, and the smoke stratification thickness increases until it reaches h. This is the distance where the amount of blocked smoke increases from x1 to h.
When the droplet drag force is equal to the smoke buoyancy, it can be considered that the smoke congestion tends to be stable. The equation of a steady state of smoke congestion under the action of water spray in tunneling is established by combining the two equations:
The drag length h of the smoke can be calculated. The definite solution conditions are the initial temperature distribution and the initial smoke layer thickness. After the drag length h is obtained, the amount of blocked smoke can be obtained according to the distance between the sprinkler facility and the fire source. The amount of blocked smoke is as follows:
In the equation, is the amount of flue gas blocked by sprinkler facilities, kg; is the distance between the sprinkler facility and the fire source, m; and is the amount of flue gas per unit length, kg/m. The other variables are the same as before.
4. Numerical Simulation of the Influence of Local Ventilation on the Temperature Characteristics of Smoke in the Excavation Face
The excavation roadway in the mine is a semiclosed type, and the excavation face uses a local press-in ventilation system. The airflow is in the form of a limited adherent jet, which can mix smoke in the enclosed space, making the smoke migration more complex [40,41]. In this section, the effect of local ventilation on smoke movement and temperature characteristics in an excavation roadway in 150 s is analyzed. To focus on the function of smoke under the influence of local ventilation, the sprinkler equipment will be turned off in this part.
4.1. Characteristics of Three-Dimensional Velocity Field in the Heading Face
In the field of ventilation, there are two types of power that affect the movement of smoke. The first is the localized fan’s wall jet, while the second is the thermal dynamic effect of the fire smoke. When combined, these two forces cause the smoke to move in a certain pattern and produce a high-temperature effect along its trajectory. Therefore, in order to analyze the temperature characteristics of the smoke, it is necessary to first analyze the velocity field.
As shown in Figure 7a, when the local fan is closed, the smoke in the excavation face space shows a bifurcation phenomenon. At this time, the smoke moves along the roof towards the roadway exit with a smaller longitudinal centerline position velocity on the roof and faster speeds on both sides. Some scholars have analyzed the reasons for its formation [42].
As shown in Figure 7b, when the local fan is turned on, the phenomenon of smoke bifurcation is eliminated, and the velocity field in the excavation space becomes a cycle as a whole. The airflow in the air tube moves in the opposite direction to the smoke on one side. Under the influence of the smoke barrier, the airflow moves downwards and finally flows to the source of the fire. Due to thermal buoyancy and airflow, the smoke from the fire source moves vertically to the upper corner and then along the roof near the sidewall towards the exit of the roadway.
4.2. Analysis of Two-Dimensional Temperature Field Characteristics of a Specific Cross Section
The state of air flow in the space directly affects the movement of smoke, thus affecting the distribution of high temperature in the space. Using a three-dimensional velocity field analysis, this section examines the temperature field at the cross sections of Z = 2.8 m and Y = 22 m. The selected analysis location is shown in Figure 8.
Figure 9 shows that local ventilation greatly affects the temperature directly above the fire source. Without local ventilation, the high-temperature area is evenly distributed. However, with local ventilation, the temperature in the upper right corner of the temperature cloud image is the highest and gradually decreases towards the left along the upper edge. The temperature in the lower right corner of the cloud image is lower. This is due to the circulating flow formed in the excavation face, as seen in Figure 7. The airflow moves from the air tube towards the fire source and mixes with the resulting smoke in the upper corner of the excavation face.
Figure 10 shows two distinct phenomena. Firstly, the size of the high-temperature area (marked in red) varies. Secondly, the shape of temperature stratification differs. In the case of no ventilation, the part above the fire source in the section is a high temperature area, and the range of the high temperature area decreases when the local ventilation is turned on. This is because the smoke above the fire source deviates from the centerline position under the action of air flow. Without local ventilation, the temperature stratification is parallel to the X-axis from 50 to 40 m, whereas it is diagonal when local ventilation is turned on. This happens because circulating flow in the space affects the accumulation state of smoke. When local ventilation is activated, the amount of smoke reduces as the distance from the fire source increases. As a result, the power of circulating flow in the space has a greater impact on the deviation of smoke from the centerline.
It can be seen that the local ventilation forms the circulating flow in the excavation face and the smoke, which destroys the original stable velocity and temperature fields in the space. The calculation model of blocking flue gas under the action of water spray in Section 3.3 of this paper is not suitable for the excavation face model of local ventilation.
5. Analysis of the Influence of Spray on Temperature Field in the Excavation Roadway
Local ventilation and sprinkler equipment were turned on in the heading roadway. An industrial sprinkler equipment was selected, and it was turned on when the temperature reached 74°. The water flow rate was 80.13 L/min, the spray shape was conical, and the droplet velocity was 5 m/s. The outer angle of the cone was 75°, the inner angle was 60°, and the number of droplets per second was 5000. The spraying facility was located 5 m from the fire source, and the height was 2.9 m. To highlight the role of sprinkler facilities and reduce the influence of irrelevant factors, the firepower was set to a constant 1500 kw, similar to the grid sensitivity analysis of 2.3; the grid selection in this section was 0.15 m.
5.1. Distribution of Temperature Field around Spray
According to the calculation results, the sprinkler facility started 18 s after the fire. The temperature cloud image of the longitudinal section in the center of the driving roadway was analyzed and compared with that without sprinkler equipment. This section focuses on exploring the temperature field distribution in the area around the sprinkler facilities. The selected cross-sectional position was , , and . The selected analysis time was 20 and 150 s.
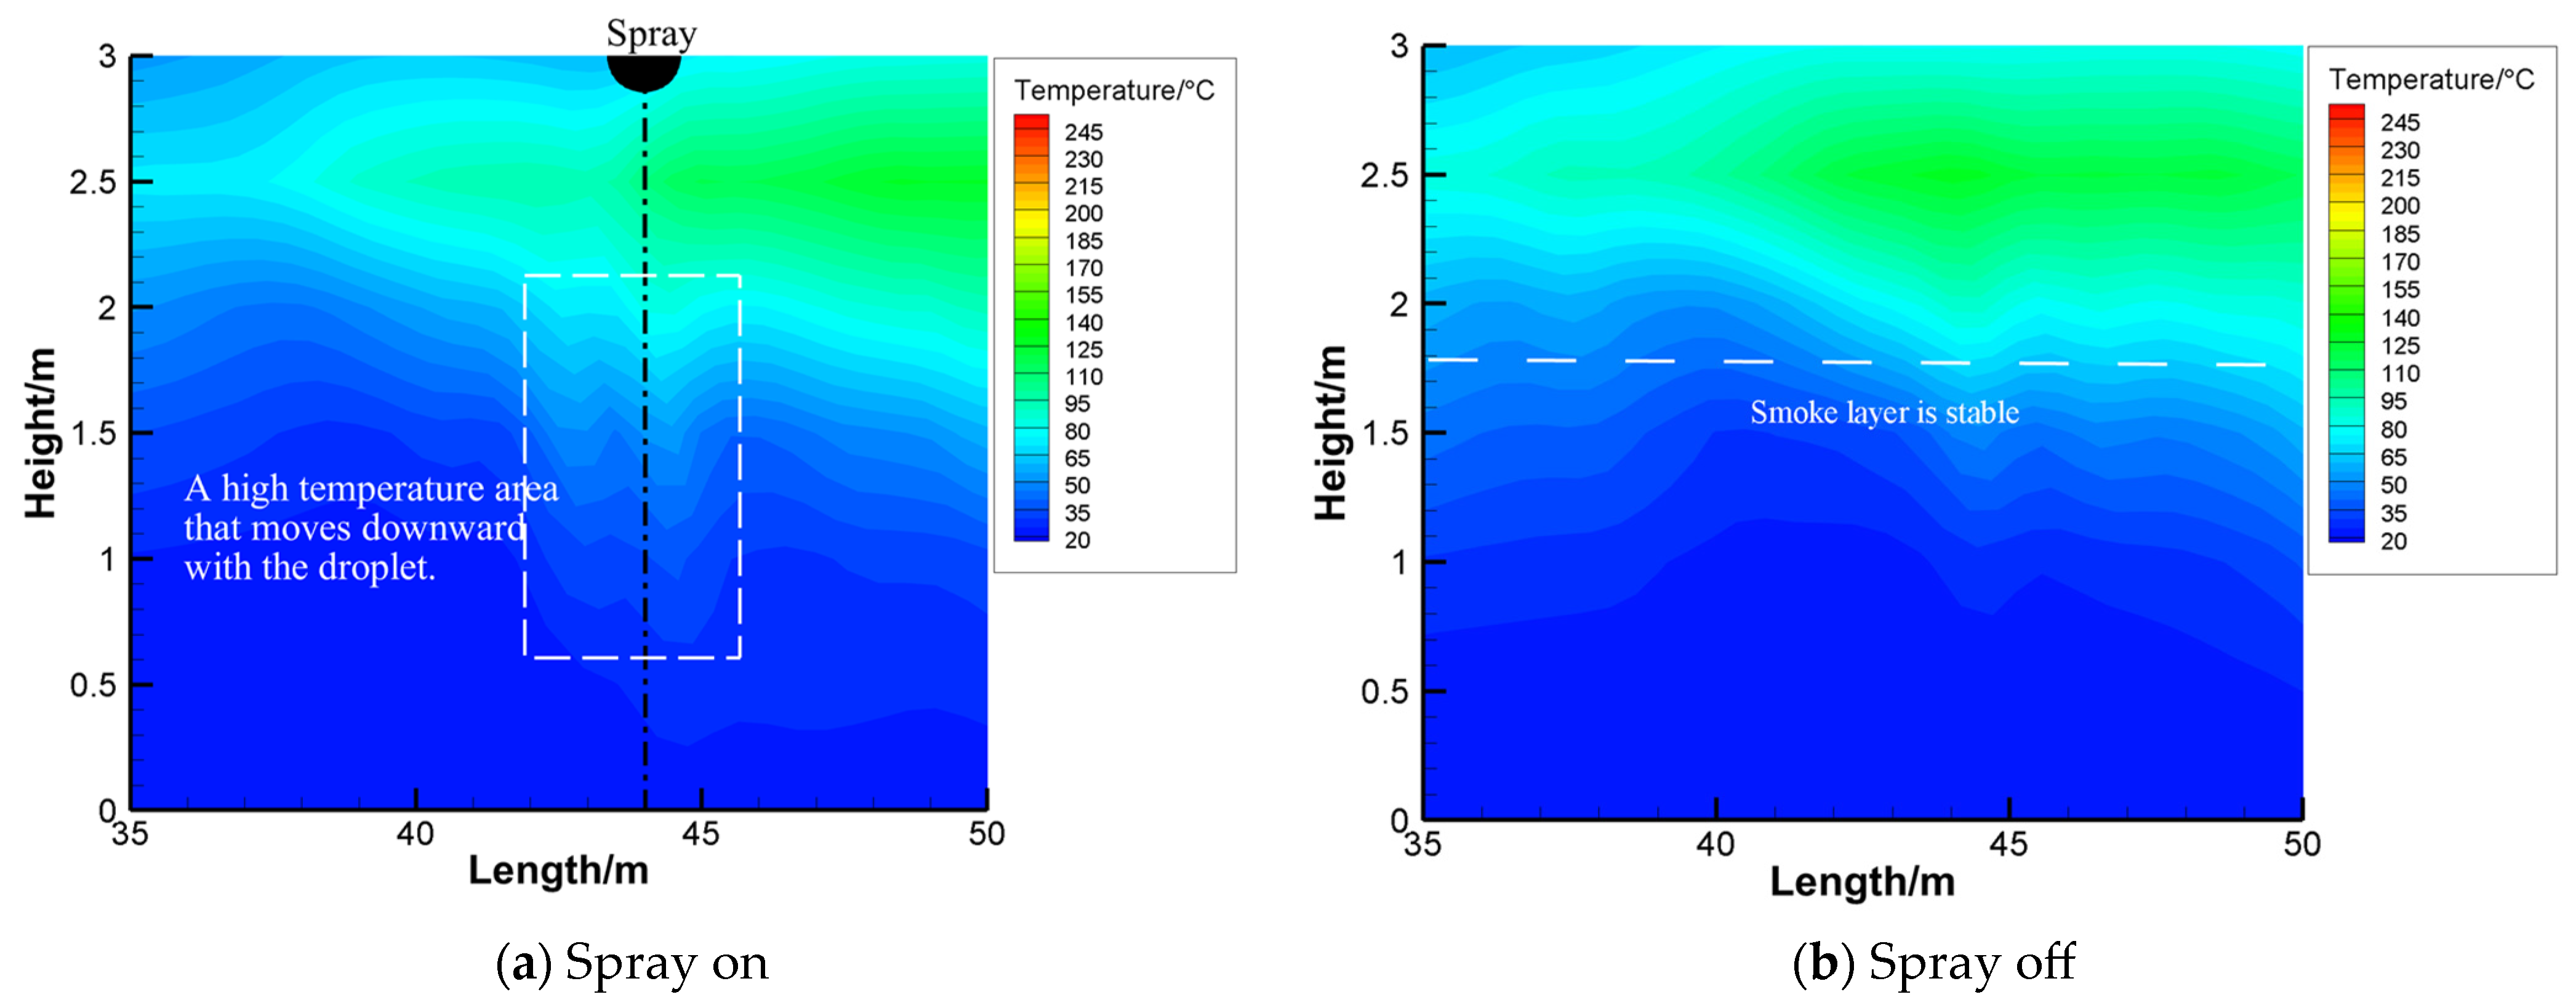
In Figure 11, two interesting phenomena are observed. Firstly, when the sprinkler facility was turned on, a high-temperature area appeared below it due to the dynamic effect of water fog. The smoke layer became unstable and moved downwards under the drag of water fog, causing congestion in the area covered by the fog. As a result, heat transfer between smoke and water molecules was incomplete, creating a high-temperature area. Secondly, as shown in Figure 11a,b, the near-source side and the smoke layer thickness of the sprinkler facilities were similar. The amount of smoke was relatively small in the early stages of fire development, and it moved along the circulating flow track formed by local ventilation, avoiding some of the water spray’s effects. Consequently, the smoke could not form an aggregation under the influence of water spray.
Figure 12 also shows two significant phenomena. Firstly, as shown in Figure 12a, there was a noticeable drop in temperature at the location of the sprinkler facility that was away from the source of the disaster. This resulted in a sudden contraction in the middle of the temperature cloud map. At this point, the cooling effect of the water fog was noticeable, and the flue gas was cooled through heat transfer. Secondly, as shown in Figure 12a, smoke accumulation occurred from the source of the disaster, and the thickness of the smoke layer was greater than that of the nonsprinkler facilities. The production of a large amount of smoke limited the effect of the circulating flow formed by local ventilation on the smoke, causing it to move in the centerline of the heading roadway. However, the flexible barrier created by spraying water mist hindered the movement of smoke, causing the smoke on the right side of the spraying facilities to gather and increase the thickness of the smoke layer. This is consistent with the theory of smoke blockage under the action of spraying, as described in Section 3.3 of the article.
It could be seen that the airflow created by local ventilation moved from one side of the roadway to the other, forming a circulating pattern. The most significant impact of spraying water was in the center of the roadway. When the amount of smoke was small in the initial stages of a fire, the smoke avoided most of the effects of water spraying due to the circulating flow, resulting in a lesser impact. However, in the later stages of fire development, the effect of the circulating flow decreased, and the smoke formed a blockage near the sprinkler, causing the water to have a significant impact at this point.
5.2. Temperature Distribution in the Excavation Roadway
In addition to the nearby sprinkler facilities, the cooling effect of water fog also extended to the entire excavation roadway. When the fire combustion was stable for 400 s, the temperature distribution in the excavation roadway was analyzed. Figure 13a shows the location of the measuring points. The A measuring point series was located close to the wall on the opposite side of the air duct with a total of 25 points and a height of 2.9 m. The B measuring point series was located in the center of the excavation roadway with a total of 25 points and a height of 2.9 m. The C measuring point series was close to the wall on the same side of the air duct with a total of 25 points and a height of 2.9 m.
As can be seen from Figure 13, the temperature of the measuring point in the roadway when the spray was opened was lower than when the spray was closed.
The temperature distribution of the C measuring point series was unique. When x < 4 m, the temperature of the roadway when the spray was opened was higher than when the spray was closed. This was because the smoke gathered above the fire source under the obstacle action of water fog and the jet action of the local fan. This phenomenon occurred because it was far from the water fog, so the temperature could not be cooled down and the temperature was higher than that of the nonspray roadway. The same effect also appeared in the front of the air duct (x = 16 m), and the smoke temperature increased, which was also related to the obstacle effect of water fog and the jet effect of the local fan.
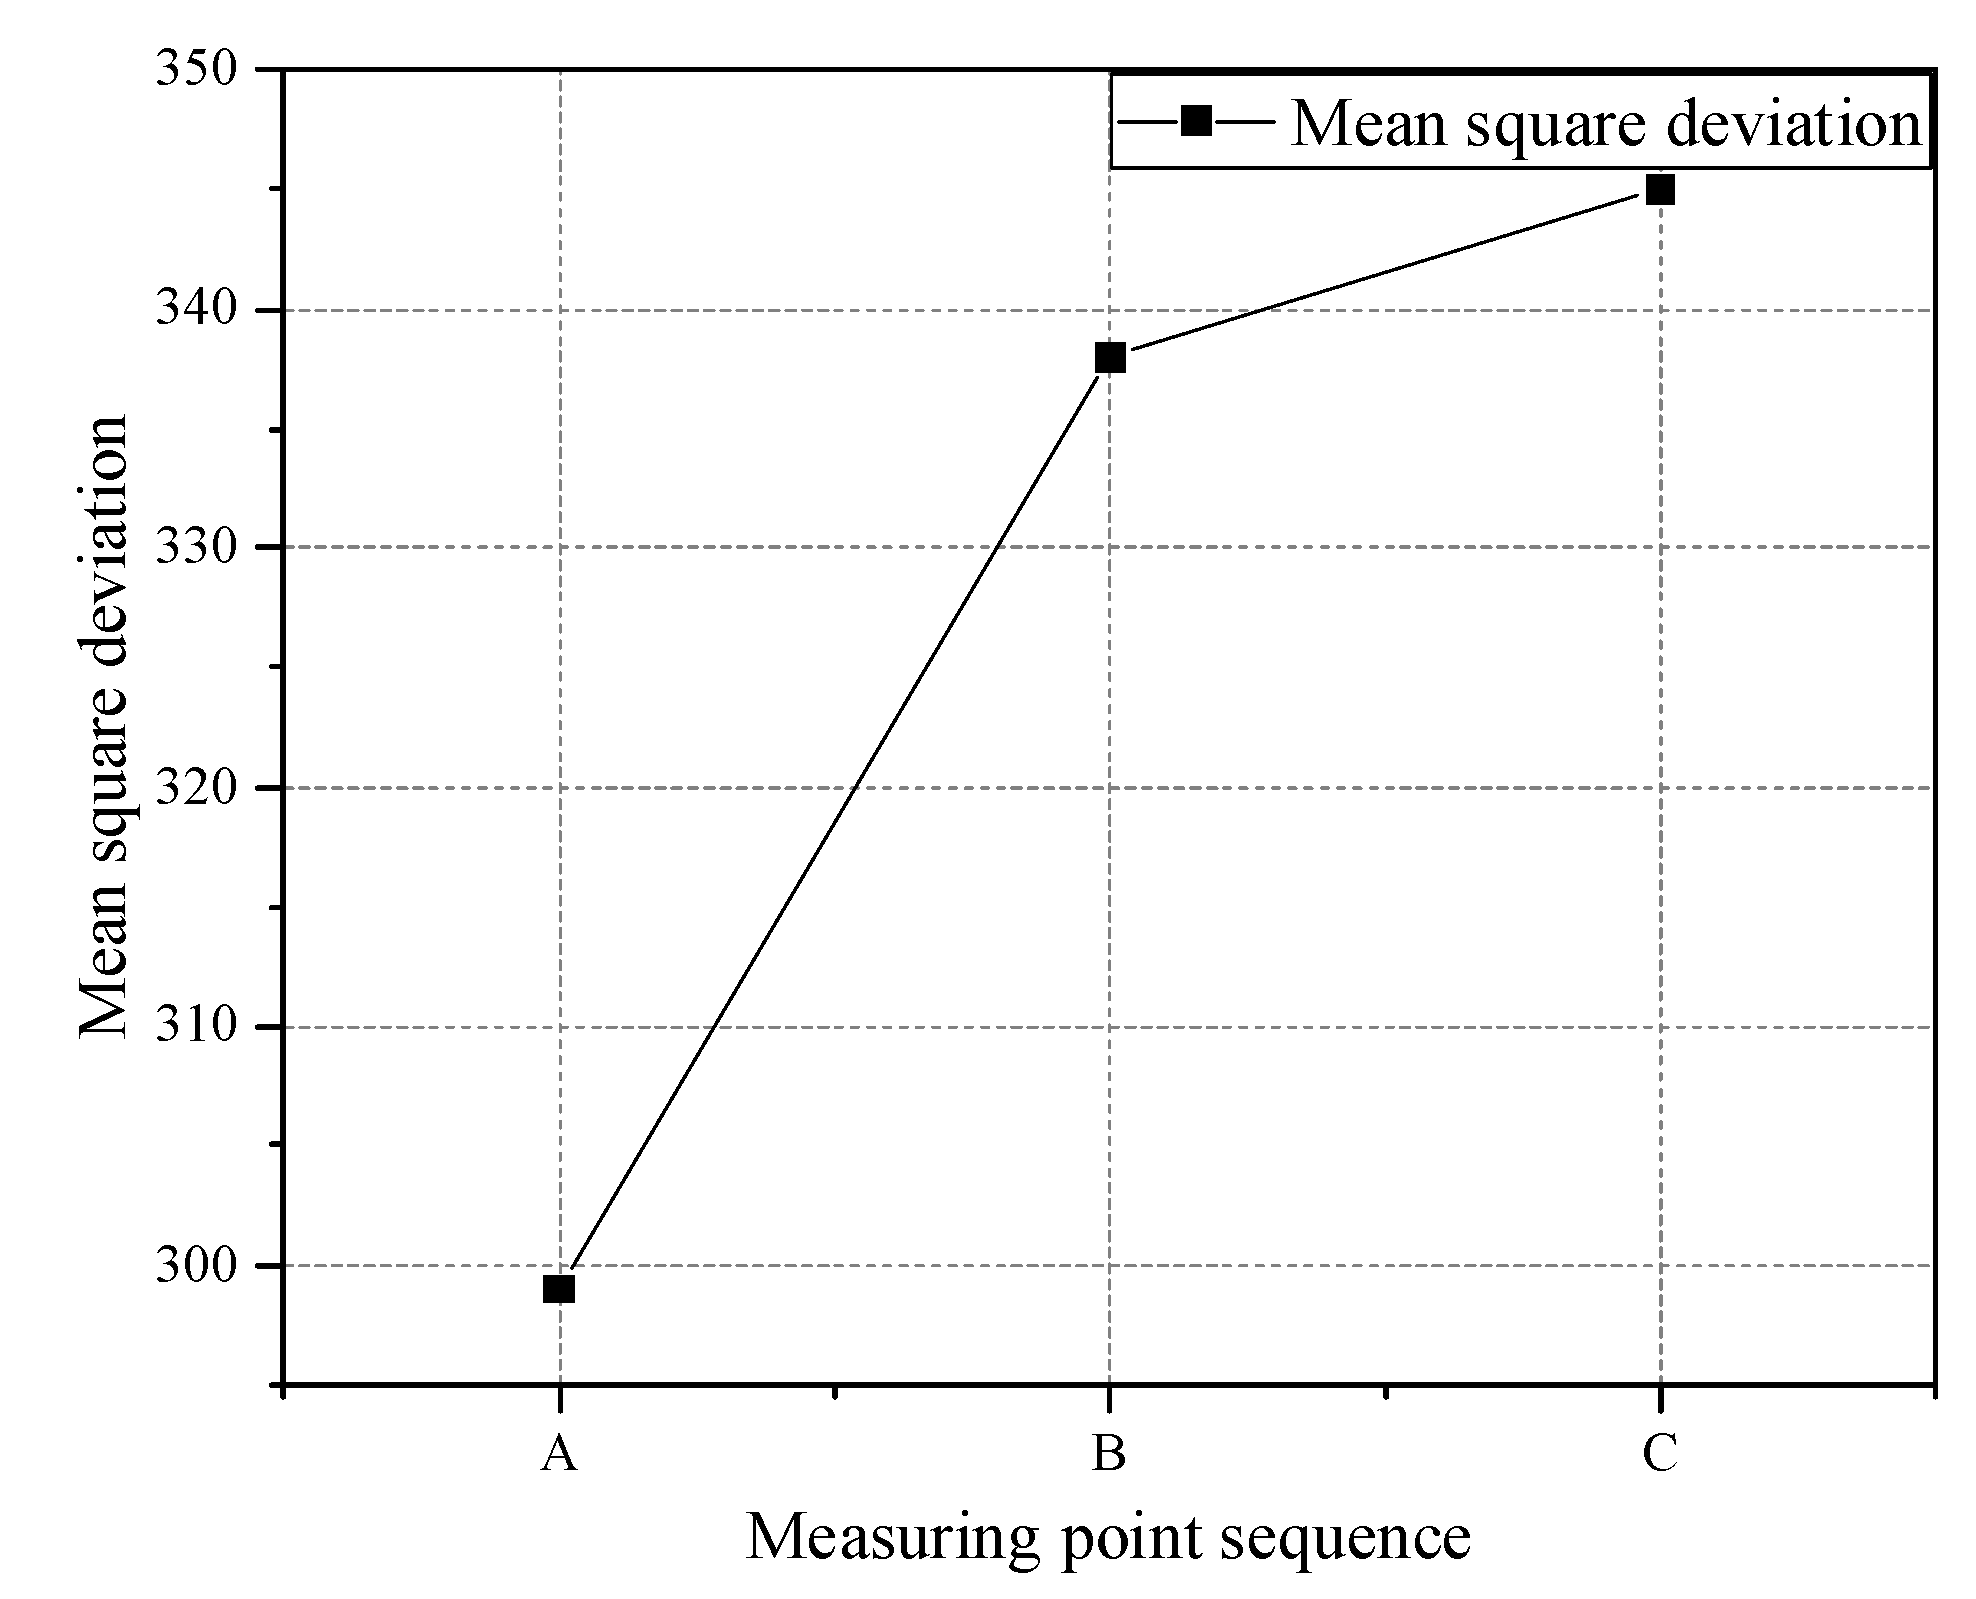
It could be seen that although the temperature of the measuring point in the sprinkler roadway was lower than that in the nonsprinkler roadway as a whole, the closeness between the two curves was different, which showed that the cooling effect of the sprinkler facilities on different longitudinal positions in the driving roadway was different. To quantitatively calculate this difference, the mean square deviation of the temperature of A, B, and C measuring points series with and without sprinkler equipment was calculated. It can be seen from Figure 14 that the mean square deviation of the C measuring points series was the highest, indicating that turning on the sprinkler had the best cooling effect on the longitudinal position on the same side of the wind tube.
6. Discussion
In reference [9], a numerical model of a driving roadway was established but with a different research focus. Their study concentrated on the flow field distribution of the longitudinal section and placed the fire source in the middle of the roadway. However, this paper focuses on the cross-sectional flow field distribution at Z = 2.8 m because fire smoke typically accumulates on the roof. The fire source location remains unchanged. In engineering practice, when a fire occurs in the middle of the roadway, the ventilation duct is usually destroyed first, so this is a critical issue to explore. Reference [35] analyzes the congestion effect of smoke under the action of spray, and this paper builds on that by exploring the obstacle effect of smoke on congestion. Reference [1] suggests that the maximum temperature along the tunnel roof in a semiclosed tunnel attenuates exponentially, which is similar to the simulation results in Section 5 of this paper. This paper’s focus is on the cooling effect of sprinkler facilities on different positions of the roof.
7. Conclusions
7.1. Conclusions and Contribution
This paper examined the effects of fire smoke transport and water spray characteristics at the end of a mine excavation roadway under semiclosed boundary conditions. Numerical simulation and theoretical analysis were used to study the excavation face and its ventilation system, which could be simplified into a local ventilation model in a semiclosed narrow space. The smoke dynamics model of the driving roadway and the calculation method of blocking smoke volume were suitable for studying smoke movement in the exit passage of water spraying. The results of the study on the velocity and temperature field of smoke movement under the action of local ventilation and spray provide a theoretical basis for fire prevention and firefighting in the excavation roadway. The specific conclusions of the article are as follows:
- From the point of view of dynamics, the equilibrium relationship between droplet drag force and smoke buoyancy is presented. The smoke control mechanism of water spraying in semiclosed tunnels is explained. According to the ratio of congestion thickness to initial thickness, the equation for calculating the blocking smoke volume of a semiclosed tunnel under the action of spray is presented.
- In the excavation face, local ventilation will provide a circulating airflow. The circulating airflow causes the temperature in the upper right corner of the temperature cloud image on the cross section of Z = 2.8 m to be the highest, while on the cross section of Y = 22 m, it causes a difference in the size of the high-temperature area and the shape of the temperature stratification. The smoke blocking model that operates under the influence of water spray on a moving roadway is inapplicable due to this type of circulating airflow.
- When the volume of the smoke is small, the circulation flow helps the smoke avoid the majority of the water spraying effect; however, when the volume of the smoke is large, the effect of the circulation flow is reduced and the smoke accumulates near the nozzle, so the blocking effect of the water spray is substantial. The mean square error analysis revealed that activating the sprinkler has the biggest cooling impact on the wall on one side of the air duct.
7.2. Limitations and Prospects of the Study
- This study only analyzed the temperature characteristics of a two-dimensional plane at a height of 2.8 m in the heading face. The entire three-dimensional space was not taken into consideration.
- The smoke movement model under the coupling of local ventilation and water spray was not derived in this study; it only derived the kinematic model without local ventilation. A follow-up study must conclusively support the mathematical simulation-based theoretical model.
- This paper used numerical simulation as the research method. In subsequent studies, similar experiments should be designed to verify and supplement the relevant conclusions.
Author Contributions
Conceptualization, B.L.; methodology, Y.L.; software, B.L.; validation, B.L.; formal analysis, W.Z.; investigation, B.L.; resources, W.Z.; data curation, B.L.; writing—original draft preparation, W.Z.; writing—review and editing, Y.L.; visualization, Z.Z.; supervision, J.D.; project administration, Y.C.; funding acquisition, Y.L. All authors have read and agreed to the published version of the manuscript.
Funding
This research received no external funding.
Institutional Review Board Statement
Not applicable.
Informed Consent Statement
Not applicable.
Data Availability Statement
Not applicable.
Conflicts of Interest
The authors declare no conflict of interest.
References
- Huang, Y.; Li, Y.; Dong, B.; Li, J.; Liang, Q. Numerical investigation on the maximum ceiling temperature and longitudinal decay in a sealing tunnel fire. Tunn. Undergr. Space Technol. 2018, 72, 120–130. [Google Scholar] [CrossRef]
- Yao, Y.; Li, Y.Z.; Lönnermark, A.; Ingason, H.; Cheng, X. Study of tunnel fires during construction using a model scale tunnel. Tunn. Undergr. Space Technol. 2019, 89, 50–67. [Google Scholar] [CrossRef]
- Zhang, H.; Zhao, Y. Study on Underground Utility Tunnel Fire Characteristics under Sealing and Ventilation Conditions. Adv. Civ. Eng. 2020, 2020, 9128704. [Google Scholar] [CrossRef]
- Liu, X.; Chang, P.; Wang, E.; Zhang, Z.; Yang, S. Numerical Study of the Respirable Coal Dust Removal Performance of a Vortex Ventilation System at an Excavation Face. Energies 2018, 11, 2449. [Google Scholar] [CrossRef]
- Cheng, L.H.; Ueng, T.H.; Liu, C.W. Simulation of ventilation and fire in the underground facilities. Fire Saf. J. 2001, 36, 597–619. [Google Scholar] [CrossRef]
- Yuan, L.; Zhou, L.; Smith, A.C. Modeling carbon monoxide spread in underground mine fires. Appl. Therm. Eng. 2016, 100, 1319–1326. [Google Scholar] [CrossRef]
- Tang, Z.; Gao, K.; Shan, Y.; Zhu, C.; Liu, Z.; Liu, Z. Study of the Fire Behavior of Multilayer Cables in a Mine Tunnel. Energies 2022, 15, 2059. [Google Scholar] [CrossRef]
- Pach, G.; Różański, Z.; Wrona, P.; Niewiadomski, A.; Zapletal, P.; Zubíček, V. Reversal Ventilation as a Method of Fire Hazard Mitigation in the Mines. Energies 2020, 13, 1755. [Google Scholar] [CrossRef]
- Zhao, J.; Wang, Z.; Hu, Z.; Cui, X.; Peng, X.; Zhang, J. Effects of Fire Location and Forced Air Volume on Fire Development for Single-Ended Tunnel Fire with Forced Ventilation. Fire 2023, 6, 111. [Google Scholar] [CrossRef]
- Chen, C.K.; Zhu, C.X.; Liu, X.Y.; Yu, N.H. Experimental investigation on the effect of asymmetrical sealing on tunnel fire behavior. Int. J. Heat Mass Transf. 2016, 92, 55–65. [Google Scholar] [CrossRef]
- Han, J.; Liu, F.; Wang, F.; Weng, M.; Wang, J. Study on the smoke movement and downstream temperature distribution in a sloping tunnel with one closed portal. Int. J. Therm. Sci. 2019, 149, 106165. [Google Scholar] [CrossRef]
- Wang, Z.; Han, J.; Wang, J.; Geng, P.; Weng, M.; Liu, F. Temperature distribution in a blocked tunnel with one closed portal under natural ventilation. Tunn. Undergr. Space Technol. 2021, 109, 103752. [Google Scholar] [CrossRef]
- Cooper, L.Y. The interaction of an isolated sprinkler spray and a two-layer compartment fire environment. Phenom. Model Simul. Fire Saf. J. 1995, 38, 679–690. [Google Scholar] [CrossRef]
- Chen, C.K.; Zhu, C.X.; Liu, X.Y.; Yu, N.H. Flow fields induced by longitudinal ventilation and water spray system in reduced-scale tunnel fires. Tunn. Undergr. Space Technol. 2020, 104, 103543. [Google Scholar]
- Chen, C.F.; Shu, C.M.; Ho, S.P.; Kung, H.C.; Chien, S.W. Effects of Ventilation and Water Spray in a Model-Scale Tunnel Fire. Fire Technol. 2018, 54, 75–96. [Google Scholar] [CrossRef]
- Qin, J.; Chow, W.K. Experimental data on water mist suppression. In Proceedings of the Asia-Oceania Symposium on Fire Science and Technology, Tsukuba, Japan, 5–7 October 2015. [Google Scholar]
- Blanchard, E.; Boulet, P.; Fromy, P.; Desanghere, S.; Carlotti, P.; Vantelon, J.P.; Garo, J.P. Experimental and Numerical Study of the Interaction Between Water Mist and Fire in an Intermediate Test Tunnel. Fire Technol. 2014, 50, 565–587. [Google Scholar] [CrossRef]
- Caliendo, C.; Genovese, G.; Russo, I. A Numerical Study for Assessing the Risk Reduction Using an Emergency Vehicle Equipped with a Micronized Water System for Contrasting the Fire Growth Phase in Road Tunnels. Appl. Sci. 2021, 11, 5248. [Google Scholar] [CrossRef]
- Wang, K.; Hao, H.; Jiang, S.; Wu, Z.; Cai, W.; Wang, Z. Study on fire smoke flow characteristics in the ventilation network and linkage control system in coal mines. Fire Mater. 2020, 44, 989–1003. [Google Scholar] [CrossRef]
- Fan, C.G.; Li, X.Y.; Mu, Y.; Guo, F.Y.; Ji, J. Smoke movement characteristics under stack effect in a mine laneway fire. Appl. Therm. Eng. 2017, 110, 70–79. [Google Scholar] [CrossRef]
- Liu, C.; Zhong, M.; Shi, C.; Zhang, P.; Tian, X. Temperature profile of fire-induced smoke in node area of a full-scale mine shaft tunnel under natural ventilation. Appl. Therm. Eng. 2017, 110, 382–389. [Google Scholar] [CrossRef]
- Lee, C.W.; Nguyen, V.D. A Study on the Optimal Installation of Ducted Fan Ventilation System in Long Mine Airways: Focused on the Wall Separation Distance and the Gap Length between Ducts. Tunn. Undergr. Spaces 2017, 27, 12–25. [Google Scholar] [CrossRef]
- Grekhneva, N.N.P.V. Adaptation of Main Mine Fan Aerodynamics to Vent Mode Changes. J. Min. Sci. 2013, 49, 779–784. [Google Scholar]
- GB51251-2017; Technical standard for smoke management systems in buildings. China Planning Press: Beijing, China, 2017.
- Ma, Q.; Chen, J.; Zhang, H. Heat release rate determination of pool fire at different pressure conditions. Fire Mater. 2018, 42, 620–626. [Google Scholar] [CrossRef]
- Li, J.; Prétrel, H.; Beji, T.; Merci, B. Influence of fire heat release rate (HRR) evolutions on fire-induced pressure variations in air-tight compartments. Fire Saf. J. 2021, 126, 103450. [Google Scholar] [CrossRef]
- Tang, F.; Cao, Z.; Palacios, A.; Wang, Q. A study on the maximum temperature of ceiling jet induced by rectangular source fires in a tunnel using ceiling smoke extraction. Int. J. Therm. Sci. 2018, 127, 329–334. [Google Scholar] [CrossRef]
- Lin, C.H.; Ferng, Y.M.; Hsu, W.S. Investigating the effect of computational grid sizes on the predicted characteristics of thermal radiation for a fire. Appl. Therm. Eng. 2009, 29, 2243–2250. [Google Scholar] [CrossRef]
- Carvel, R.; Beard, A.; Jowitt, P.; Drysdale, D. The Influence of Tunnel Geometry and Ventilation on the Heat Release Rate of a Fire. Fire Technol. 2004, 40, 5–26. [Google Scholar] [CrossRef]
- Arya, J. Development of a flooded-bed scrubber for removing coal dust at a longwall mining section. Saf. Sci. 2018, 110, 204–213. [Google Scholar] [CrossRef]
- Liu, Z.; Nie, W.; Peng, H.; Yang, S.; Chen, D.; Liu, Q. The effects of the spraying pressure and nozzle orifice diameter on the atomizing rules and dust suppression performances of an external spraying system in a fully-mechanized excavation face. Powder Technol. 2019, 350, 62–80. [Google Scholar] [CrossRef]
- Tianshui, L.; Mengjie, L.; Xinli, W.; Wei, Z. An Experimental Study on the Interaction of Water Mist with Vertical/Horizontal Spray Flame. Procedia Eng. 2014, 84, 543–552. [Google Scholar] [CrossRef]
- Link, E.; Myers, T.; Trouvé, A.; Marshall, A. Measurements of spray-plume interactions for model validation. Fire Saf. J. 2017, 91, 714–722. [Google Scholar] [CrossRef]
- Li, K.Y.; Sun, X.Q.; Huo, R.; Wang, P. A New Criterion for Stability of Smoke Layer under Sprinkler Spray. Univ. Canterb. Civ. Nat. Resour. Eng. 2007. [Google Scholar]
- Kai-Yuan, L.I.; Zhang, C.F.; Si-Cheng, L.I.; Ran, H.; Xiao-Qian, S.; Yu-Hang, Y. Criterion for Stability of Smoke Layer Under Sprinkler Spray and Experimental Validation. J. Combust. Sci. Technol. 2008, 14, 6. [Google Scholar]
- Sheppard, D.T. Spray Characteristics of Fire Sprinklers; Northwestern University: Evanston, IL, USA, 2002. [Google Scholar]
- Editor, C.D. Automatic Sprinkler Systems Handbook; National Fire Protection Association: Quincy, MA, USA, 2002. [Google Scholar]
- Xiaojia, H.; Wenyuan, J. Design Manual of Automatic Sprinkler System; China Construction Industry Press: Beijing, China, 2002. [Google Scholar]
- Chow, W.K.; Shek, L.C. Physical properties of a sprinkler water spray. Fire Mater. 2010, 17, 279–292. [Google Scholar] [CrossRef]
- Xi, Y.; Dong, X.; Chow, W. Numerical simulation on temperature in wood crib fires. Therm. Sci. 2020, 25, 2621–2636. [Google Scholar] [CrossRef]
- Lee, Y.P.; Tsai, K. Effect of vehicular blockage on critical ventilation velocity and tunnel fire behavior in longitudinally ventilated tunnels. Fire Saf. J. 2012, 53, 35–42. [Google Scholar] [CrossRef]
- Zhong, W.; Lv, J.; Li, Z.; Liang, T. A study of bifurcation flow of fire smoke in tunnel with longitudinal ventilation. Int. J. Heat Mass Transf. 2013, 67, 829–835. [Google Scholar] [CrossRef]
Figure 1.
Flow chart of the research methods.
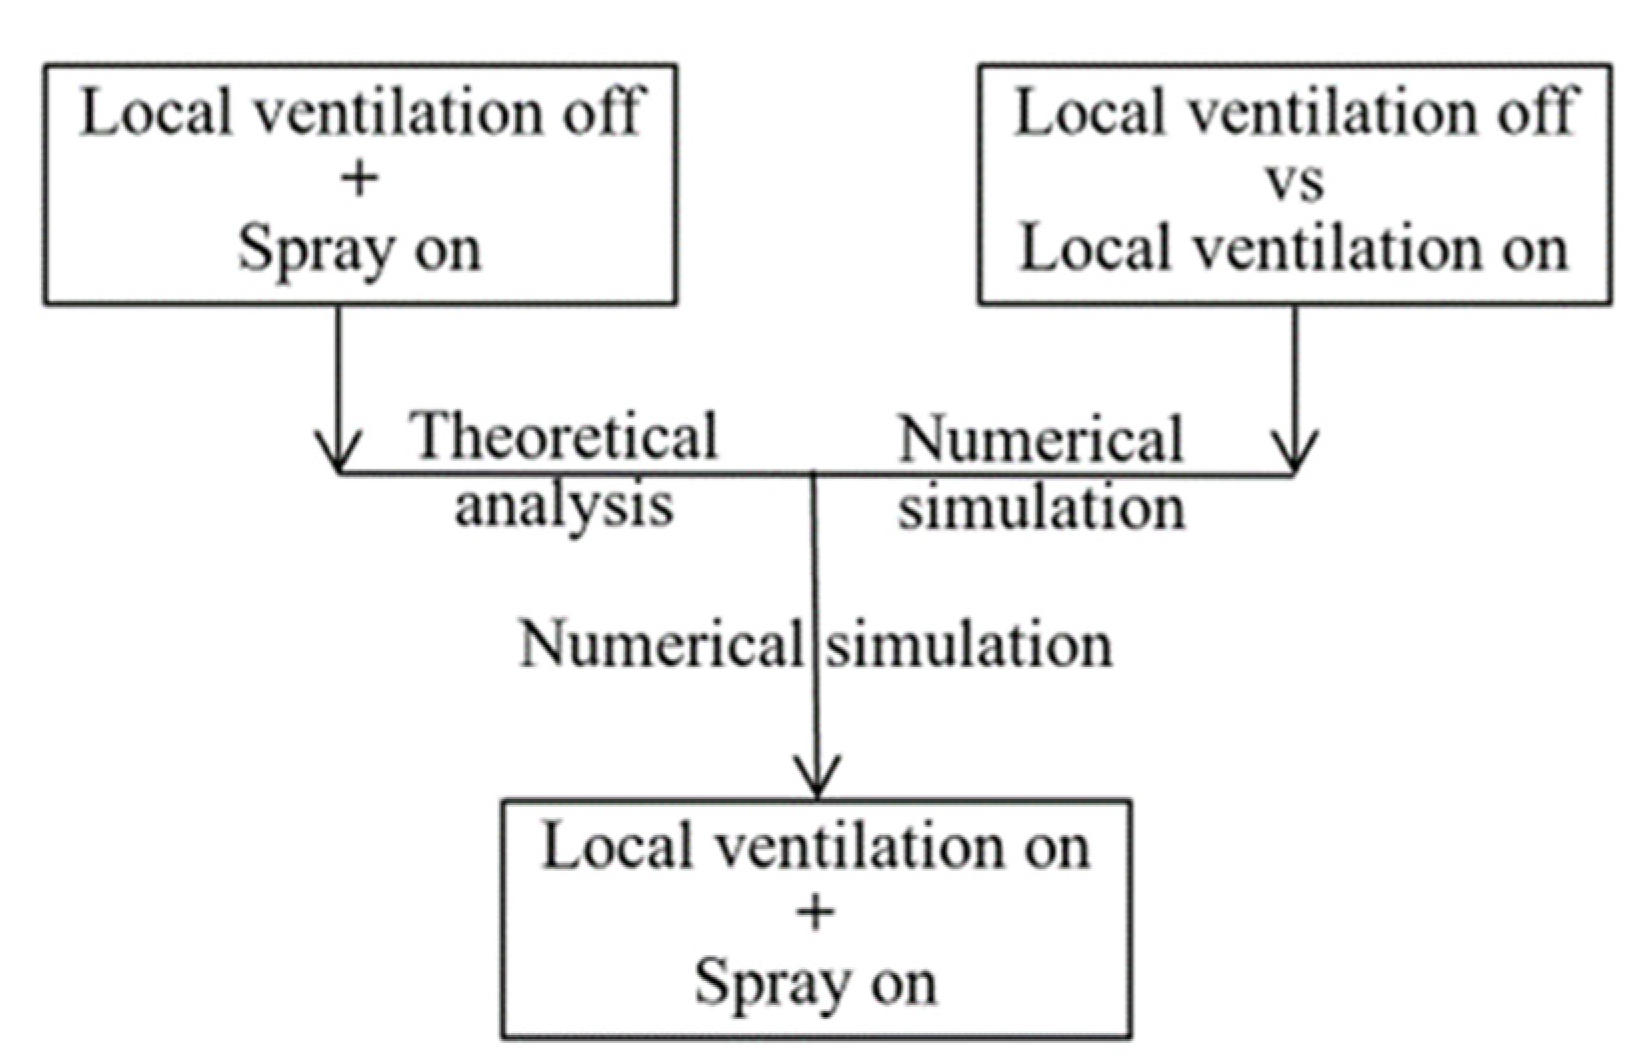
Figure 2.
Structure setting diagram of a heading roadway.

Figure 3.
Typical HRR curve with time.
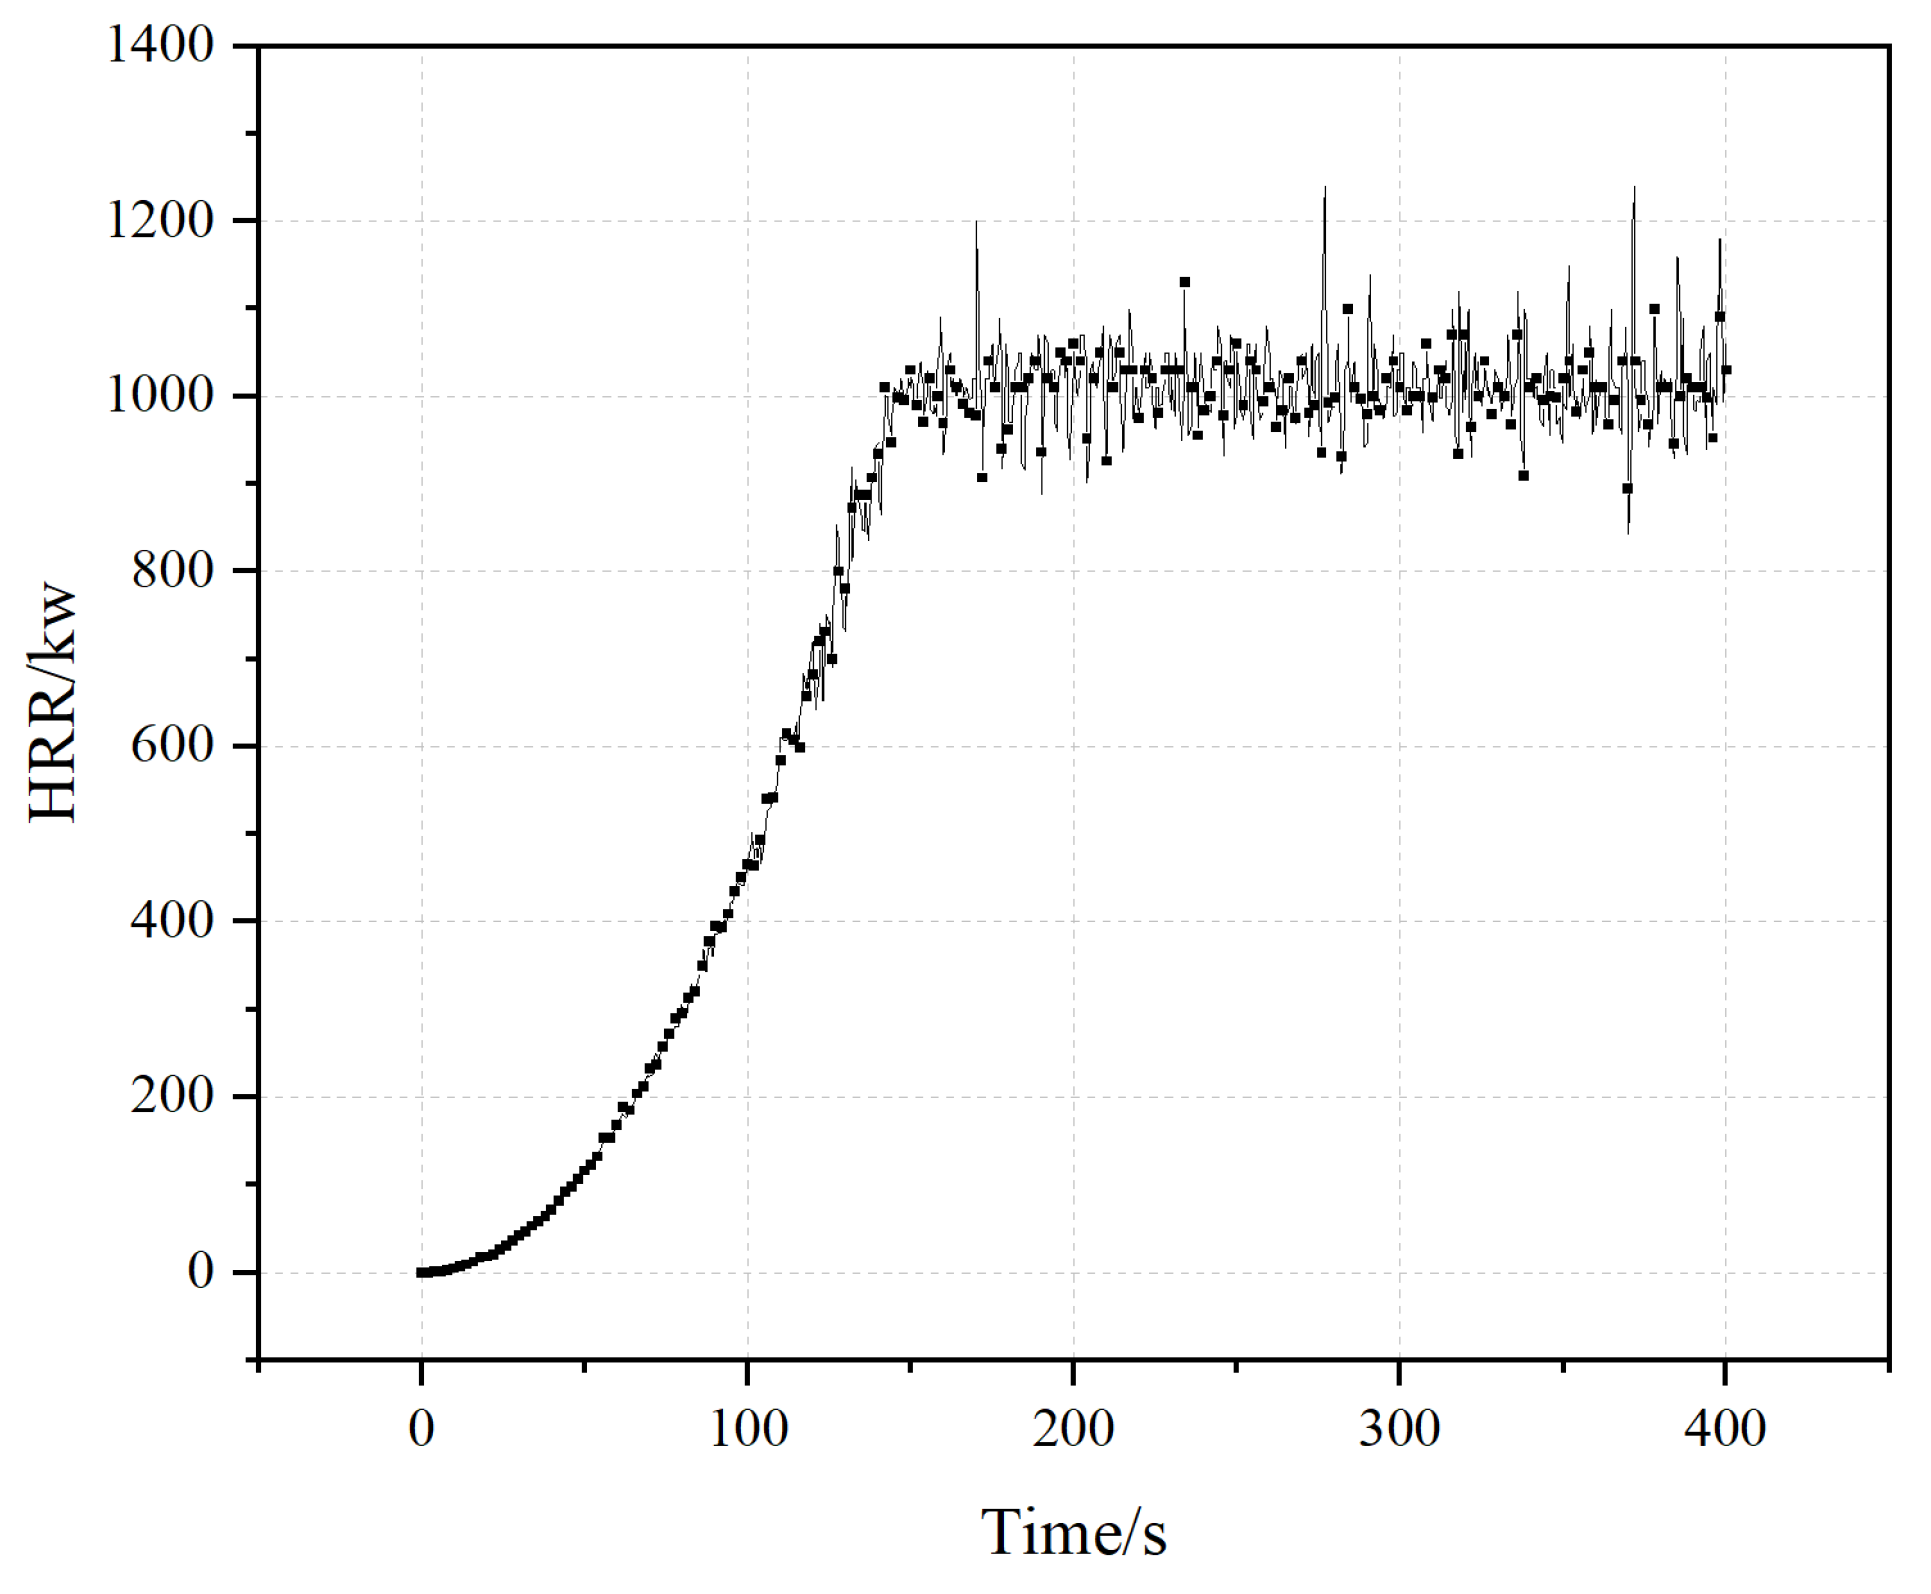
Figure 4.
Results of grid sensitivity analysis.
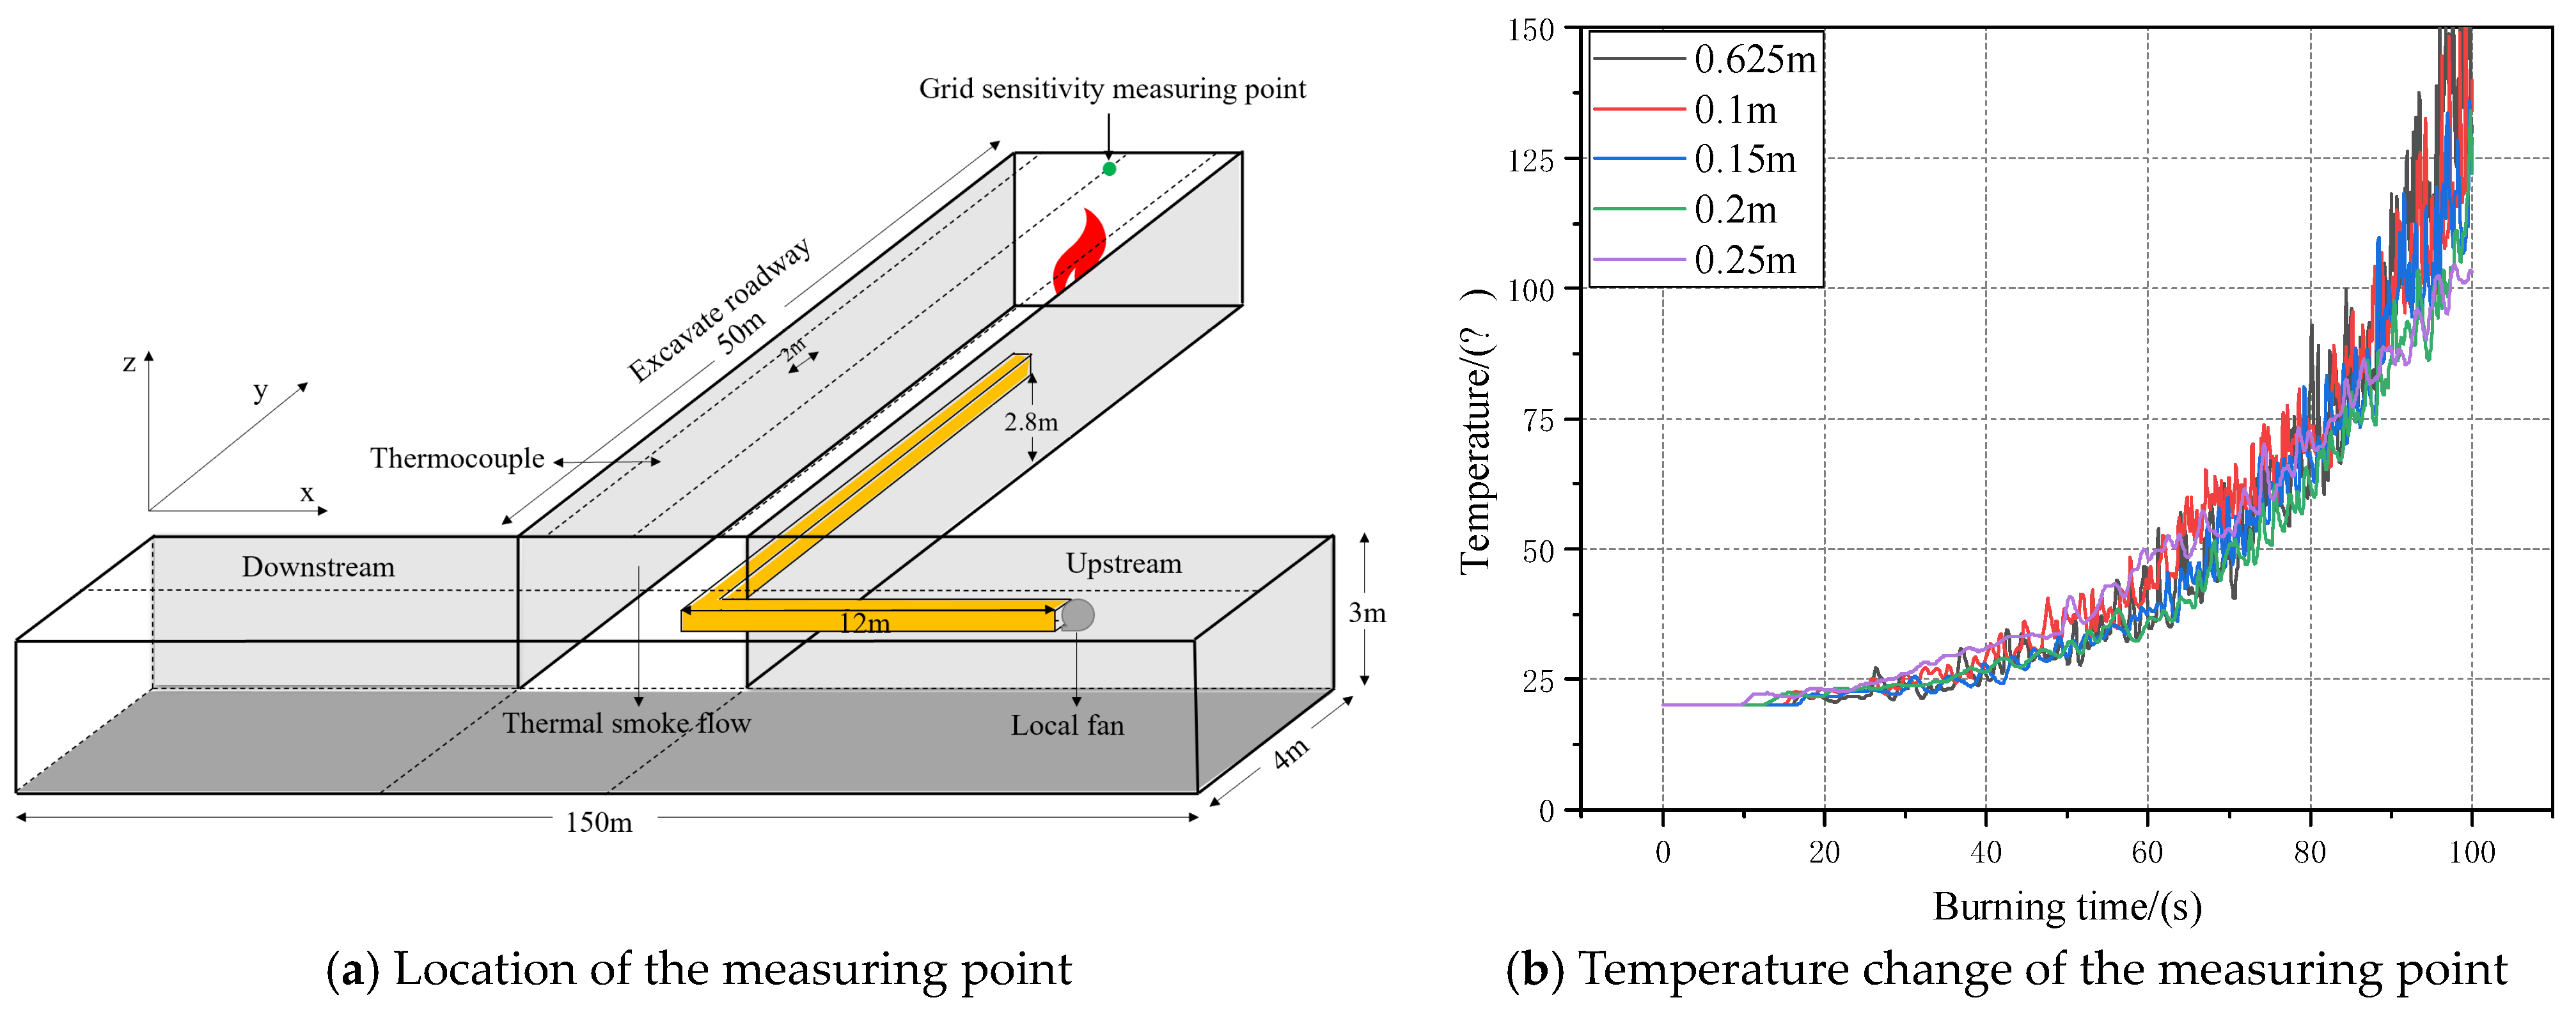
Figure 5.
Schematic diagram of spray action.
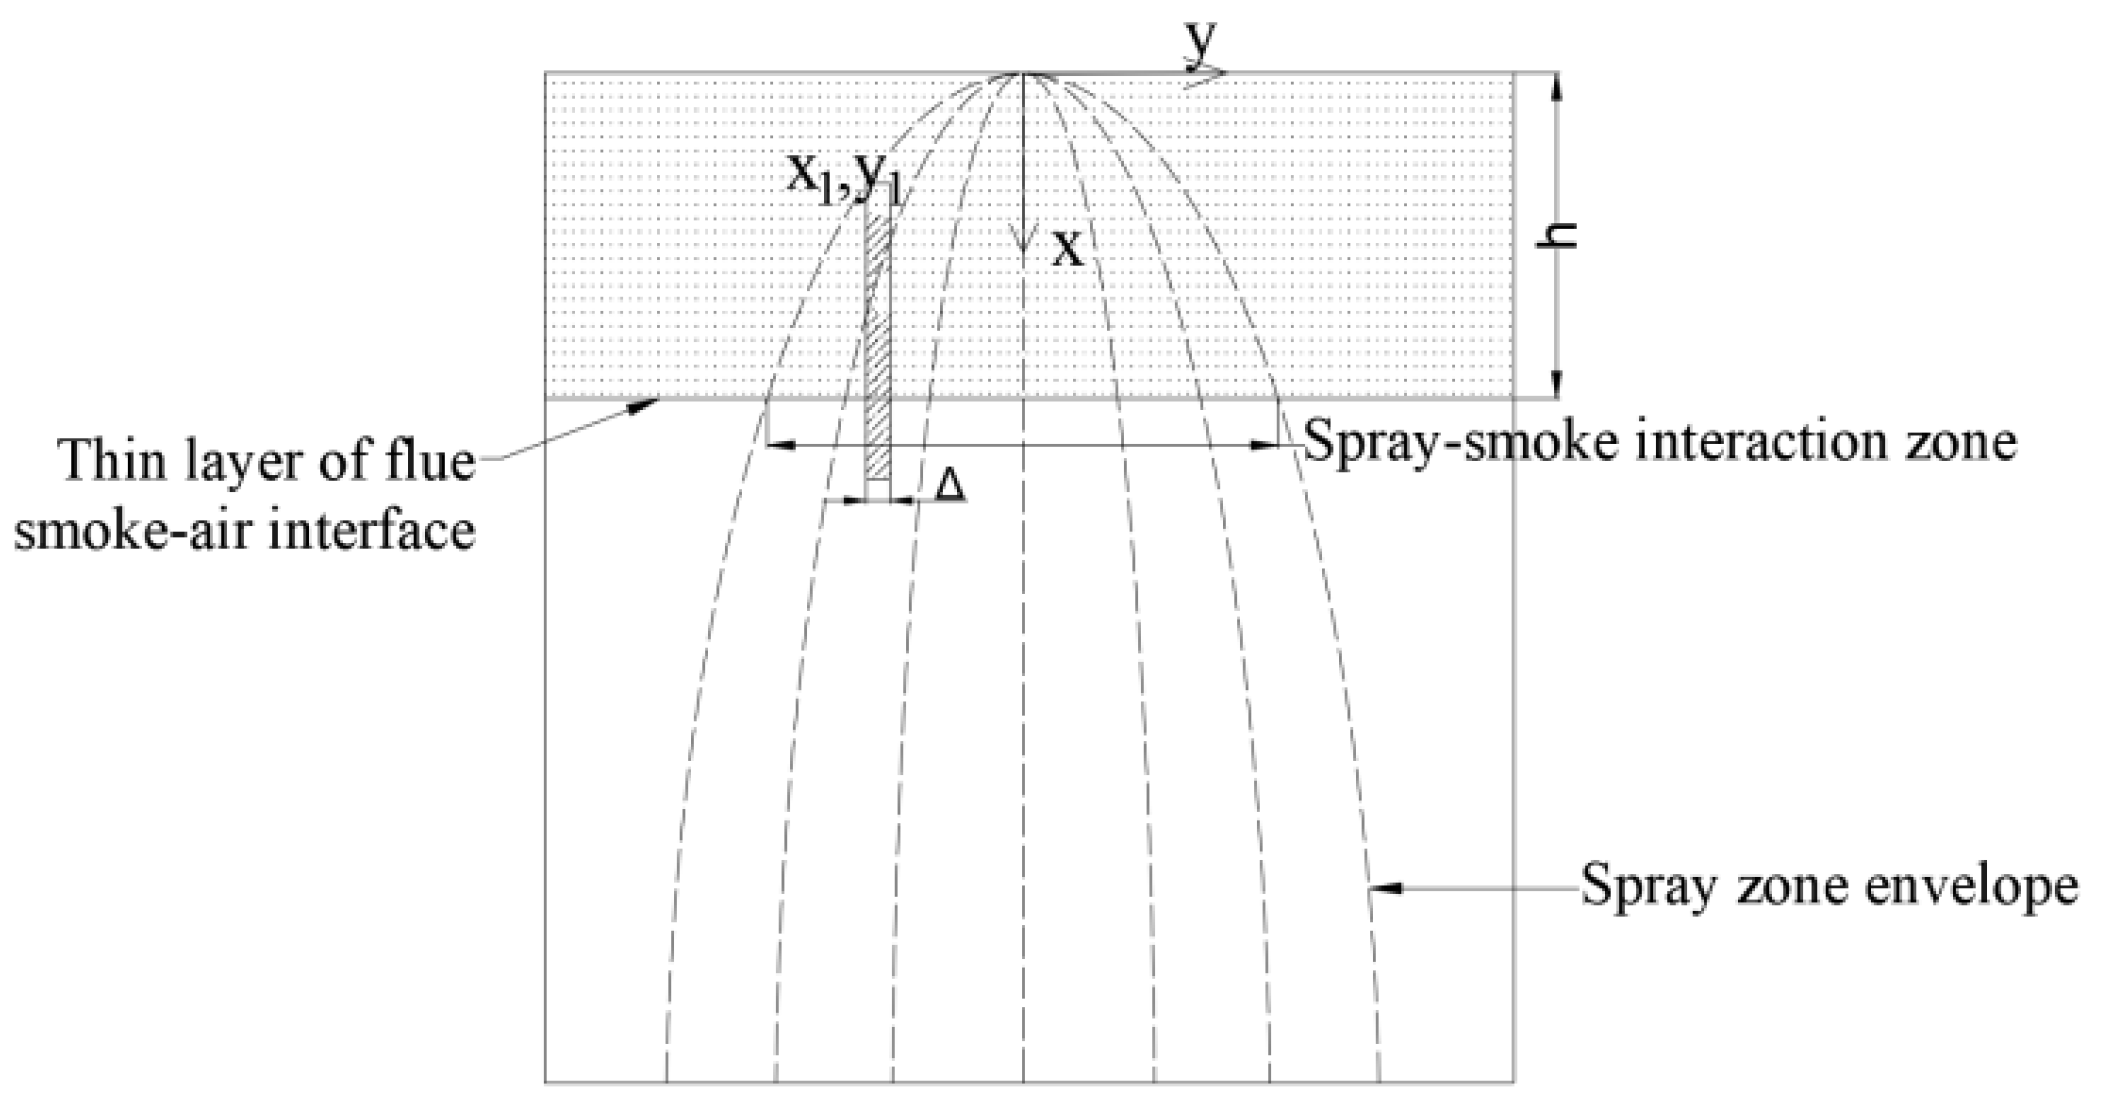
Figure 6.
Schematic diagram of the blocking effect of spray on smoke.

Figure 7.
Schematic diagram of the three-dimensional velocity field in the excavation face.
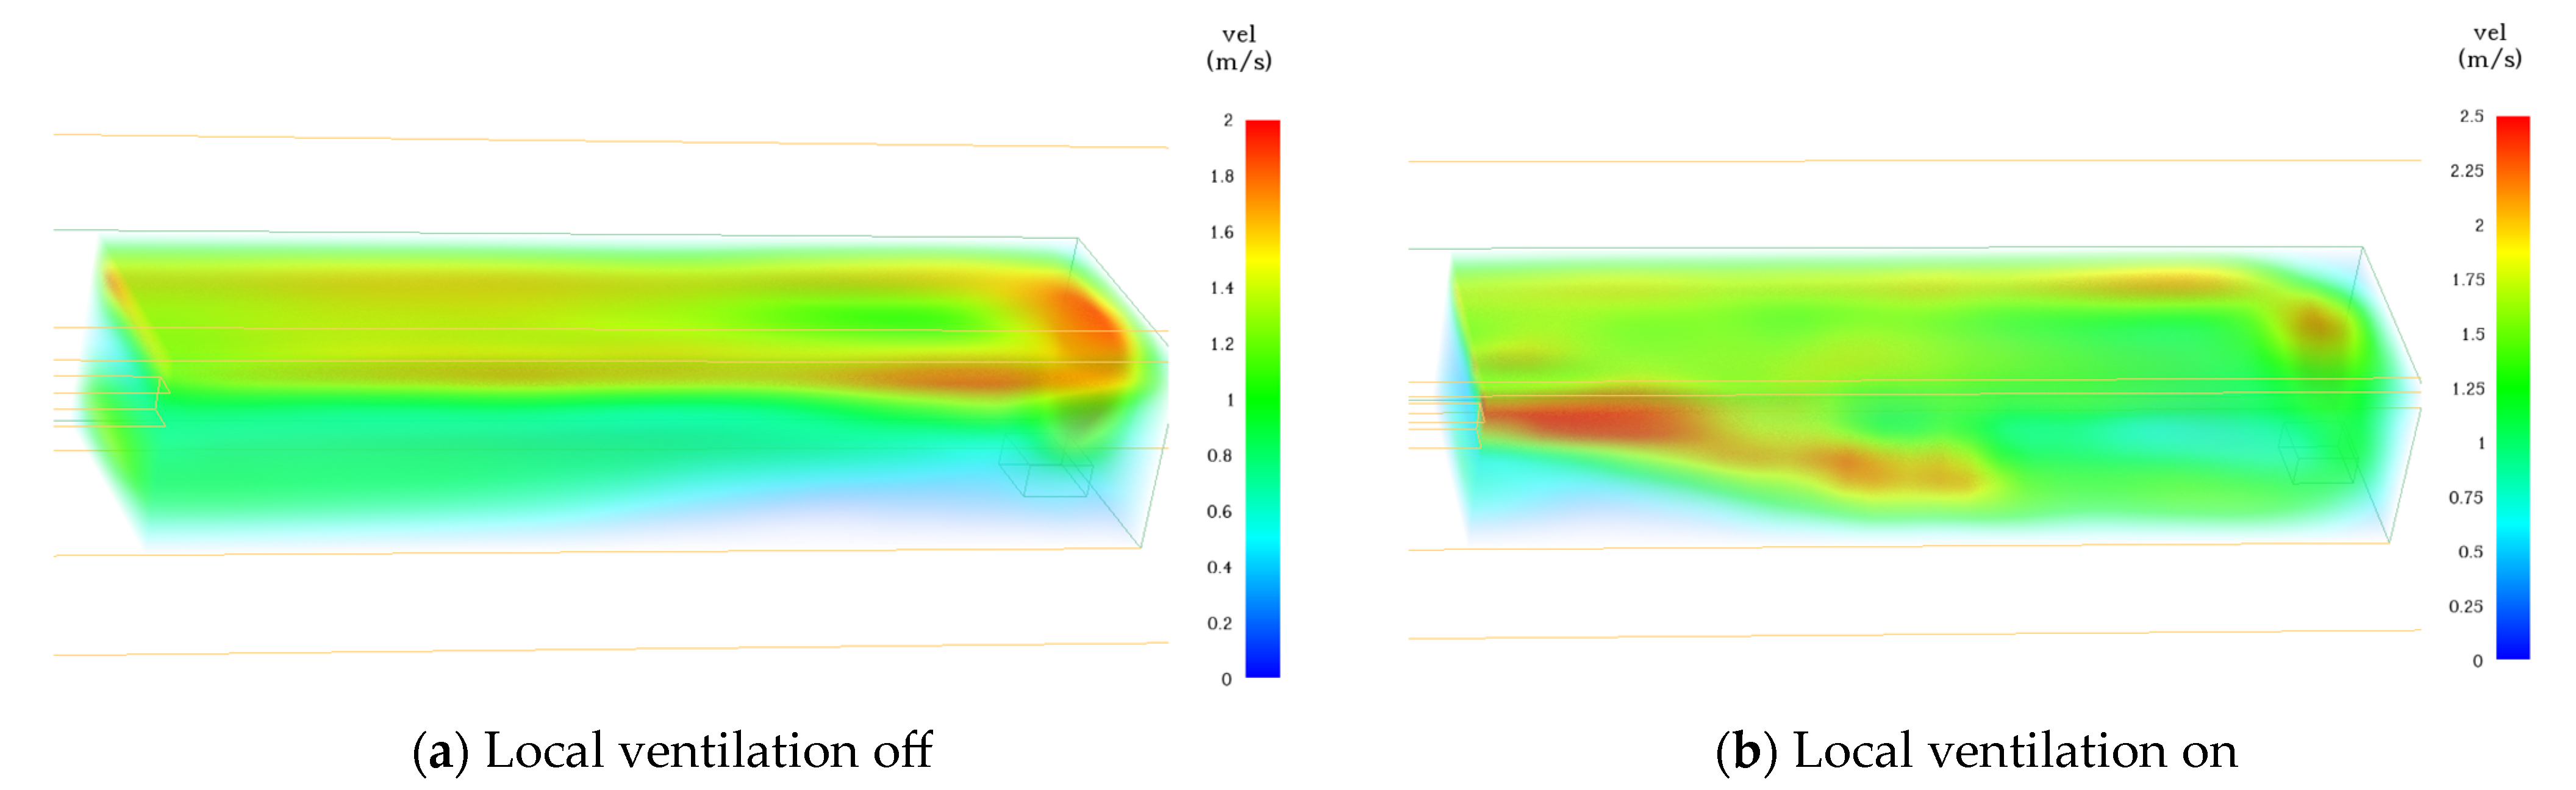
Figure 8.
Temperature field location map.

Figure 9.
Analysis of the temperature field at the cross section of Z = 2.8 m.

Figure 10.
Analysis of the temperature field at the cross section of Y = 22 m.
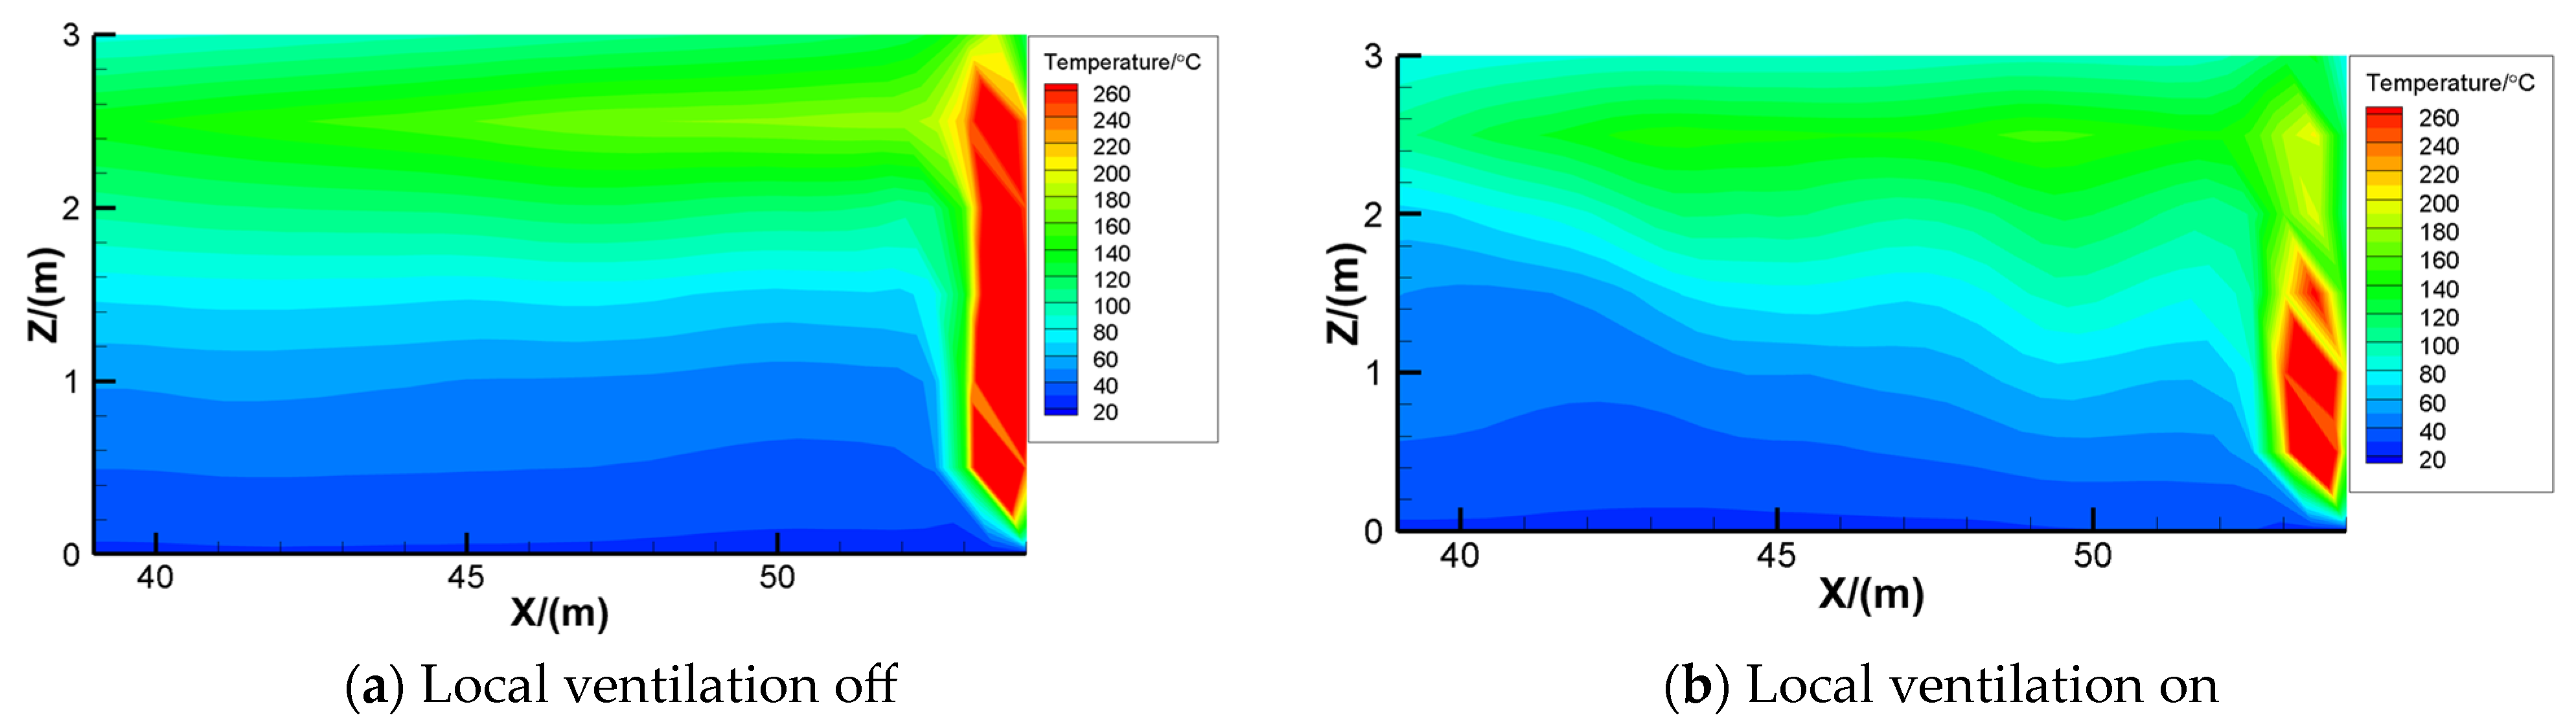
Figure 11.
The 20 s temperature cloud map of the central longitudinal section of the heading roadway.
Figure 11.
The 20 s temperature cloud map of the central longitudinal section of the heading roadway.

Figure 12.
The 120 s temperature cloud map of the central longitudinal section of the heading roadway.
Figure 12.
The 120 s temperature cloud map of the central longitudinal section of the heading roadway.

Figure 13.
Temperature change diagram of the excavation roadway. (a) Position of the measuring point series; (b) temperature variation curve of the A measuring point series with distance; (c) temperature variation curve of the B measuring point series with distance; (d) temperature variation curve of the C measuring point series with distance.
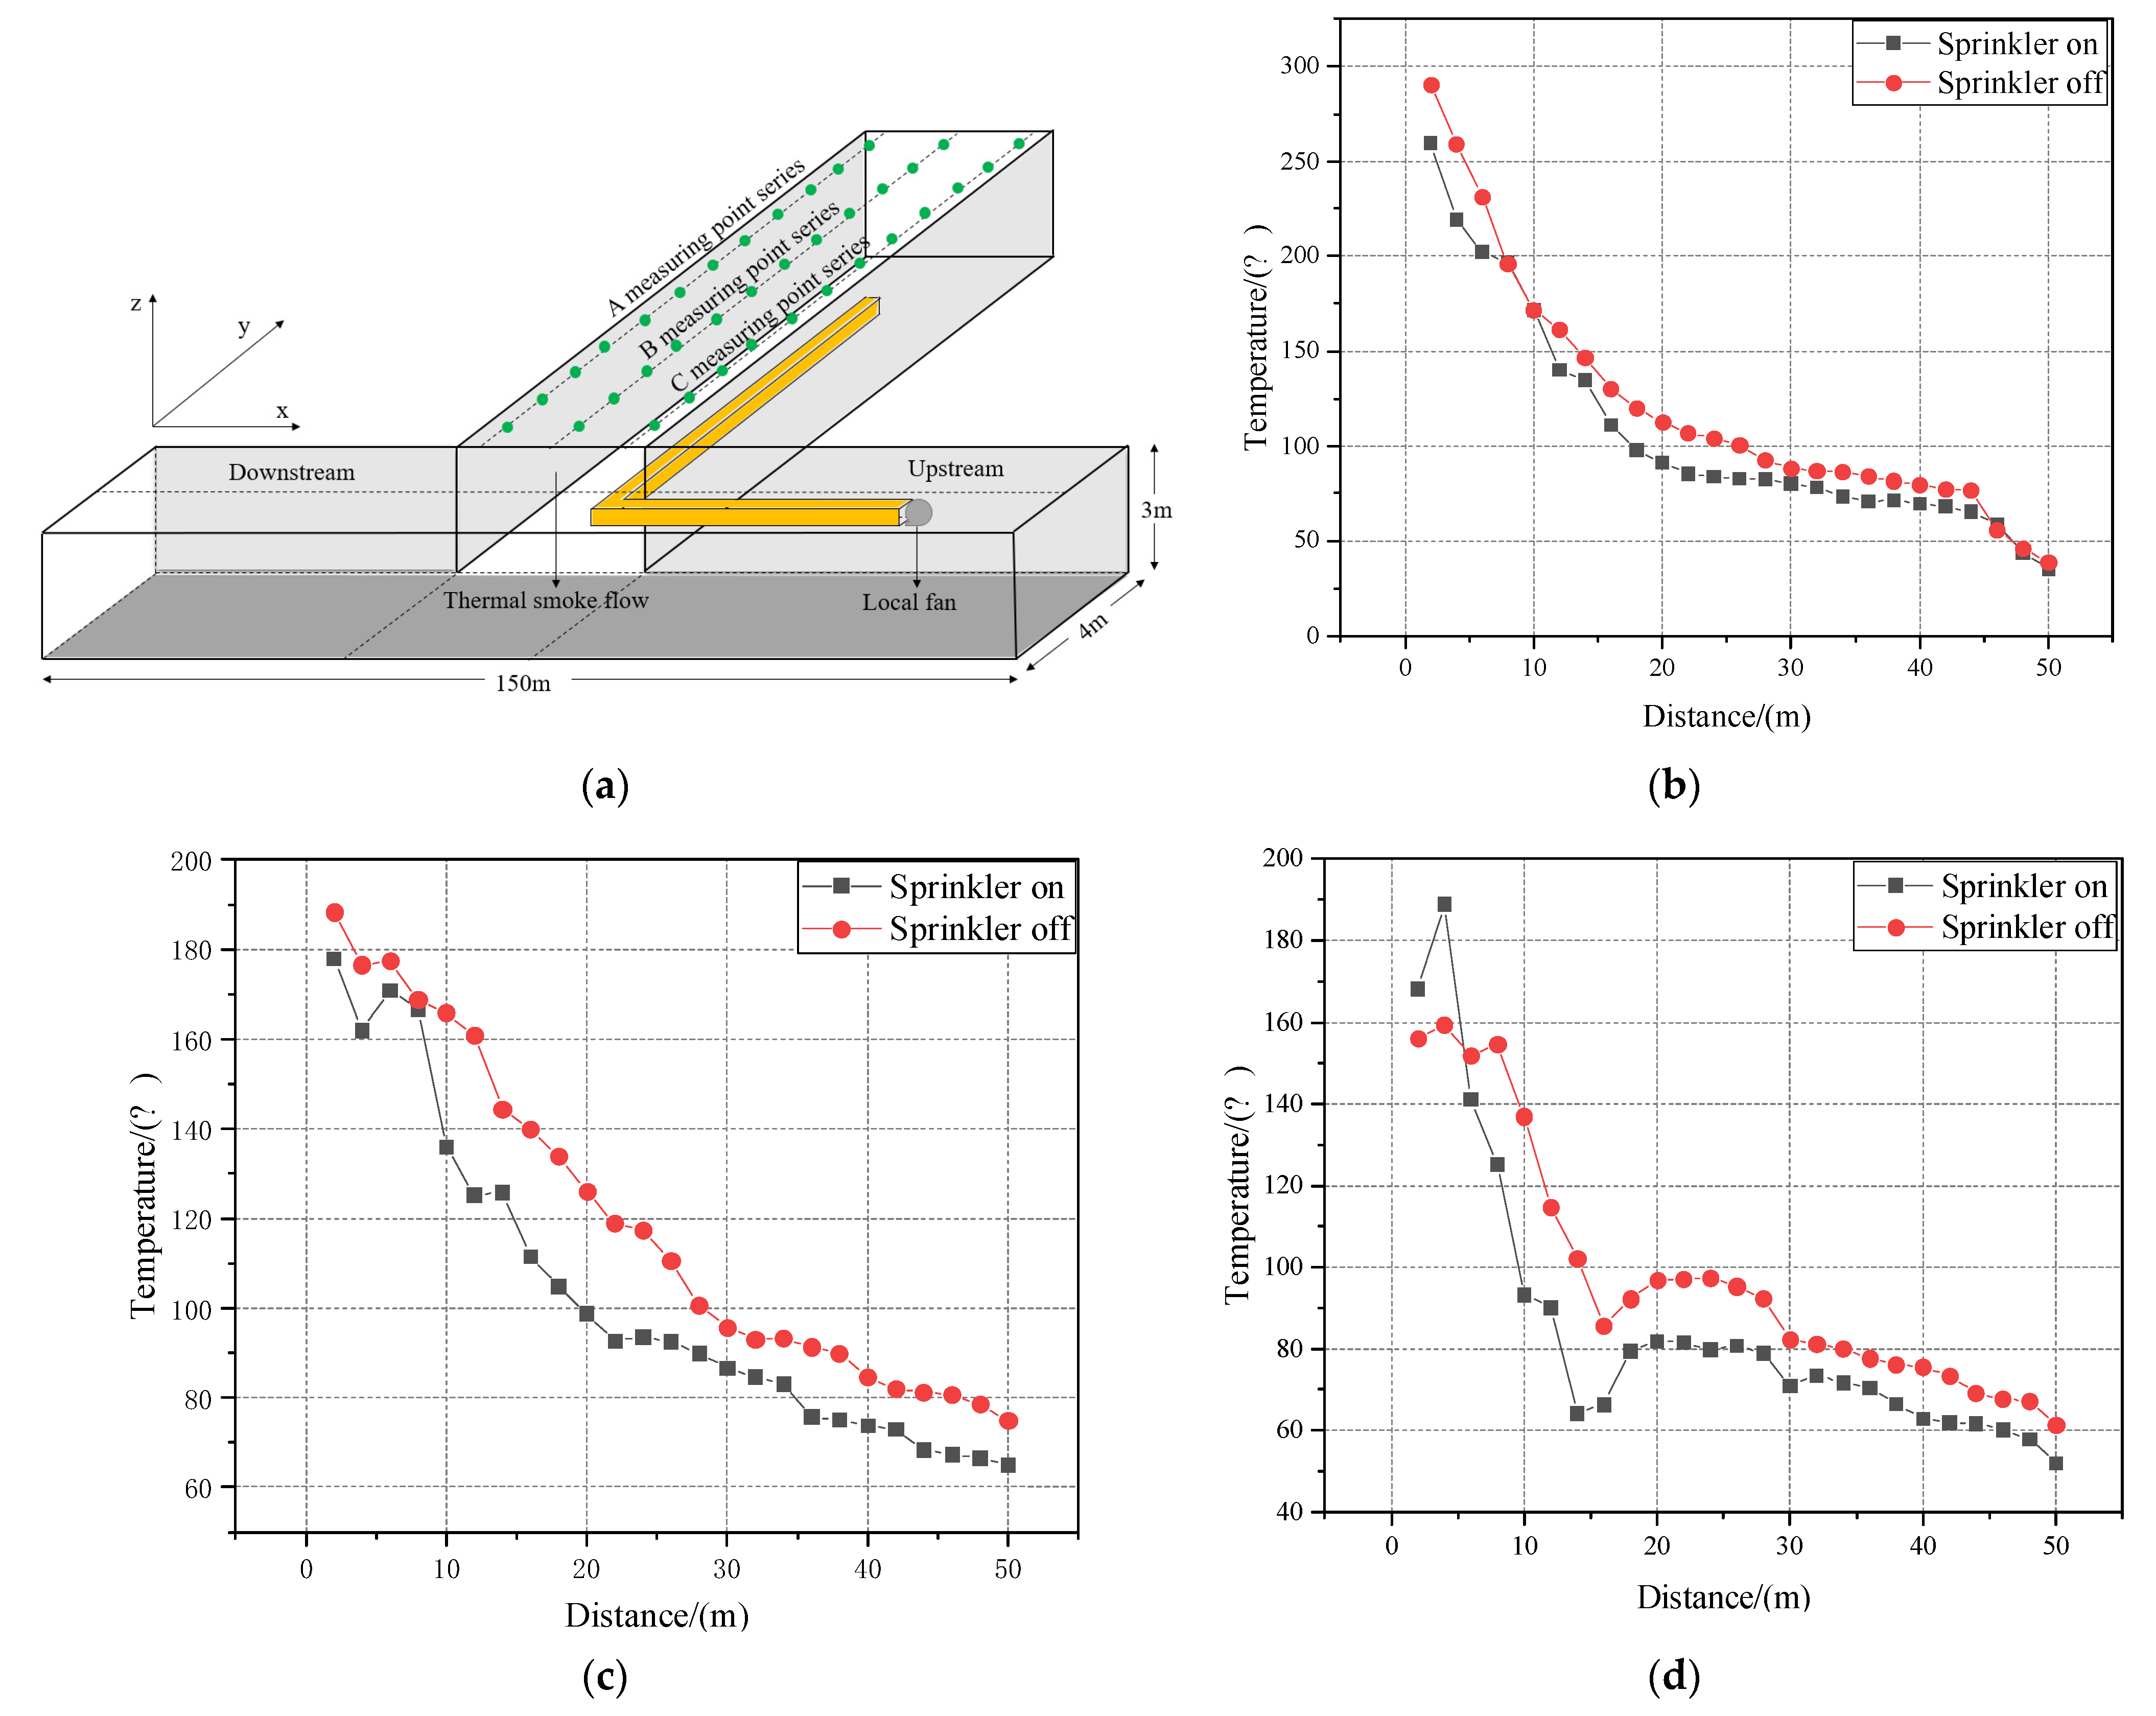
Figure 14.
Calculation chart of mean square deviation.

Table 1.
Grid sensitivity analysis test condition.
| HRR | Characteristic Diameter of Fire Source | Mesh Diameter | Mesh Size |
|---|---|---|---|
| 1 MW | 0.94 m | 0.25 m | |
| 0.2 m | |||
| 0.15 m | |||
| 0.1 m | |||
| 0.0625 |
Table 2.
Settings of the operating conditions.
| No. | Comparison of Working Conditions | Heat Release Rate/kw | Fire Growth Law | Ventilation Condition | Spray Equipment | Wind/(m/s) |
|---|---|---|---|---|---|---|
| 1 | Local ventilation | 1000 | t2 | On | Off | 6.5 |
| 2 | 1000 | t2 | Off | Off | 0 | |
| 3 | Sprinkler | 1500 | Constant | On | Off | 6.5 |
| 4 | 1500 | Constant | On | On | 6.5 |
Disclaimer/Publisher’s Note: The statements, opinions and data contained in all publications are solely those of the individual author(s) and contributor(s) and not of MDPI and/or the editor(s). MDPI and/or the editor(s) disclaim responsibility for any injury to people or property resulting from any ideas, methods, instructions or products referred to in the content. |
© 2023 by the authors. Licensee MDPI, Basel, Switzerland. This article is an open access article distributed under the terms and conditions of the Creative Commons Attribution (CC BY) license (https://creativecommons.org/licenses/by/4.0/).
Share and Cite
MDPI and ACS Style
Li, B.; Zhang, W.; Li, Y.; Zhang, Z.; Dong, J.; Cui, Y. Study on the Temperature and Smoke Movement in the Event of a Fire in a Semiclosed Tunnel under Water Spray. Fire 2023, 6, 324. https://doi.org/10.3390/fire6080324
AMA Style
Li B, Zhang W, Li Y, Zhang Z, Dong J, Cui Y. Study on the Temperature and Smoke Movement in the Event of a Fire in a Semiclosed Tunnel under Water Spray. Fire. 2023; 6(8):324. https://doi.org/10.3390/fire6080324
Chicago/Turabian StyleLi, Bolun, Wei Zhang, Yucheng Li, Zhitao Zhang, Jinyang Dong, and Yunan Cui. 2023. "Study on the Temperature and Smoke Movement in the Event of a Fire in a Semiclosed Tunnel under Water Spray" Fire 6, no. 8: 324. https://doi.org/10.3390/fire6080324