Article

Thermal Decomposition Process of Fireproof Sealant Measured with Thermogravimetric and Fourier Transform Infrared Spectroscopy Analysis and Estimated Using Shuffled Complex Evolution

1
Faculty of Engineering, China University of Geosciences, Wuhan 430074, China
2
Anhui Province Key Laboratory for Electric Fire and Safety Protection, State Grid Anhui Electric Power Research Institute, Hefei 230601, China
3
Wuhuan Engineering Co., Ltd., Wuhan 430223, China
*
Author to whom correspondence should be addressed.
Submission received: 10 November 2023 / Revised: 29 December 2023 / Accepted: 10 January 2024 / Published: 12 January 2024
(This article belongs to the Special Issue Fire Numerical Simulation)

Abstract

:
Fireproof sealing technology is widely used in industrial, commercial, and other public buildings, so the performance of fireproof sealing materials in high temperatures or fire environments must be taken into account as an important factor. Fireproof sealant is considered to be a highly effective adhesive for sealing and fireproofing purposes. To explore its thermal decomposition mechanism and estimate its pyrolysis behaviors, a series of thermogravimetric experiments from 10 K/min to 60 K/min coupled with Fourier transform infrared spectroscopy analysis technology were performed. The results indicated that the thermal decomposition of the fireproof sealant could be divided into three reactions: the degradation of ammonium polyphosphate, melamine, and acrylic acid. In addition, the pyrolysis behavior of the fireproof sealant was compared under two kinds of atmosphere (nitrogen and air). Furthermore, the initial kinetic parameters in the nitrogen atmosphere were calculated based on model-free methods including the Friedman, KAS, and Starink methods. The average activation energy of three reactions obtained by the three methods was 108.32 kJ/mol, 200.46 kJ/mol, and 177.10 kJ/mol, respectively, while these obtained parameters were hard to regenerate, the thermogravimetric curves were accurately based on the established pyrolysis reaction scheme, with the existence of clear deviations. Therefore, a global heuristic optimization algorithm, Shuffled Complex Evolution (SCE), was selected to optimize 14 parameters (including activation energies and the pre-exponential factors) and the optimized pyrolysis results agreed well with the experimental data, even at the extra heating rate, with the correlation coefficient for the mass loss and mass loss rate being reaching up to 0.9943 and 0.9019, respectively. The study indicated that the SCE algorithm showed an appropriate potential to estimate the pyrolysis behavior of an unknown thermogravimetric experiment group.

1. Introduction

Implementing fire prevention measures is crucial work to provide smoke resistance, heat insulation, and sealing functions [1]. Fireproof sealant, with excellent performance, low hardness, favorable viscosity, and exceptional resistance to high temperatures [2], is mainly utilized to seal gaps between building components and holes in building structures [3]. Nevertheless, low performing fireproof sealant may have the following disadvantages: low fire protection effect due to its inherent flammability [4]; poor sealing performance because of aging [5]; harmfulness to human health and environmental protection due to the toxic gases and fumes released [6,7]. As we know, pyrolysis is the first step in all thermochemical processes [8], including our current fire protection applications. However, the current emphasis on the material’s ratio and modification in fireproof sealant research overlooks the significance of thermal decomposition when the fireproof sealant is subjected to high temperatures [9,10,11]. Consequently, it is imperative to explore the pyrolysis behavior and fire prevention mechanisms of fireproof sealant.
Thermogravimetric analysis (TGA) is a versatile technique that has been extensively employed in the examination of the thermal properties of polymers, biomass, sediments, and diverse solid materials [12,13,14]. Dubdub [15] mentioned that TGA was used to obtain information on polypropylene pyrolysis kinetics and calculate the kinetic parameters. Jakić et al. [16] pointed out that the degradation of PVC/PEO blends could be revealed by TGA, showing that pure PVC and blends degraded through two main stages, which was different from the single-stage degradation of PEO. TGA was helpful in making the reaction between each composition easy to recognize from the mixture. Giżyński et al. [17] showed that carbon-fiber-reinforced thermoplastic polymers were decomposed under high temperatures and determined the degradation step and constituent content through TGA. Furthermore, to explore the products of pyrolysis, the thermogravimetric and Fourier transform infrared spectroscopy (TG–FTIR) coupled analysis can be a valuable approach in elucidating the decomposition reaction and gas products throughout the experimental procedure [18,19,20,21]. The TG–FTIR technique has the characteristics of fast analysis, no damage to the sample, less sample dosage, simple operation, high sensitivity, wide application range, and so on. For example, Ding et al. [22] discovered the pyrolysis gas components in a no-charring material through a TG–FTIR experiment and used the products as input values for the prediction and simulation of combustion. Malgorzata et al. [23] used the TG–FTIR method to compare the gas products of pyrolysis and combustion, confirming that the pyrolysis process was divided into four stages, compared to the five stages of combustion. Norbert et al. [24] explored the thermal decomposition behavior of sewage sludge using TG–FTIR experiments. Zhang et al. [25] focused on an organic fireproof plugging material and studied the complex pyrolysis characteristics and gas evolution through TG–FTIR analysis, proposing that pyrolysis in nitrogen might be divided into four stages.
To obtain more pyrolysis kinetics information, the conventional model-free methods were utilized to calculate the typical kinetic parameters. The model-free method adopted in isothermal or non-isothermal kinetics can prevent errors which are generated from the selection of the reaction model, allowing for the dependence of the activation energy on the extent of conversion [26]. However, the initial kinetic parameters we obtained were insufficient in reproducing the pyrolysis curve at the corresponding heating rate [27]. To solve this problem, multiple optimization algorithms, such as Shuffled Complex Evolution (SCE) algorithm [28], were used to adjust the kinetic parameters to reproduce the pyrolysis process better. Liu et al. [29] conducted a study on biomass pyrolysis kinetics using the SCE algorithm in the realms of the environment and energy, and the optimization results we obtained showed promising potential in evaluating the biomass waste from pyrolysis. Zhang et al. [30] studied extruded polystyrene materials through thermogravimetric analysis and obtained the reaction order n using a variety of methods (master plots, model-free, SCE, and model reconstruction), indicating that the accuracy of the SCE method was the highest. As such, the SCE algorithm was applied here to evaluate its ability in the prediction of the thermal decomposition of fireproof sealant.
In the current study, TG and TG–FTIR experiments are conducted to analyze and understand the pyrolysis reaction process in fireproof sealant. A three-component parallel reaction model is deemed to be suitable for describing the pyrolysis process. The initial kinetic parameters are obtained using the model-free methods. Furthermore, these kinetic parameters are optimized using the SCE algorithm so as to reproduce the pyrolysis curves, and even estimate more pyrolysis curves at other heating rates. This research explores the flame-retardant mechanism of fireproof sealant and fills the gap in the study of fireproof sealant’s pyrolysis characteristics, and also proves the feasibility of using the SCE algorithm to estimate the pyrolysis process. In the future, we will further carry out experimental studies on changes in the combustion characteristics of fireproof sealant on a larger scale to reveal the combustion behaviors of real fires more effectively.

2. Materials and Methods

2.1. Sample Preparation

The DJ-A2-CD03 type fireproof sealant was produced by Hebei Langfang Wangju New Building Materials Co., LTD, Langfang, China. According to the product description, the main components of the fireproof sealant include ammonium polyphosphate, melamine, and acrylic acid-based matrix resin materials. After full solidification, the sample was ground into powder, then it was placed in a drying oven at 100 °C for 24 h to eliminate the effects of moisture.

2.2. TG–FTIR Experiment

Thermogravimetric experiments were carried out using a Perkin Elmer TGA 4000 thermal analyzer. At five heating rates of 10, 20, 30, 40, and 60 K/min, the temperature gradually increased from 400 K to 1200 K. Throughout the experimental process, the powdered sample was evenly placed in an alumina cup without a lid and surrounded by nitrogen flow.
Furthermore, Spectrum Two was connected to the thermal analyzer for a TG–FTIR coupled experiment at 10 K/min. The spectral scanning frequency was 20 times per minute, and the spectral region was 600 cm−1 to 4000 cm−1.
Similarly, in order to identify the difference in thermal degradation behavior caused by different atmospheric conditions, a TG–FTIR experiment was also conducted in an air atmosphere, taking 10 K/min as an example.

2.3. Kinetic Method

Thermogravimetric analysis is a crucial channel used to explore the relationship between temperature and mass change, which can provide a scientific basis for quantitatively studying the kinetics of the pyrolysis reaction, judging the thermal characteristics of materials, and inferring the mechanism [31]. The kinetic equation for the solid pyrolysis reaction can be translated as Equation (1).
d α d t = k ( T ) f ( α )
In Equation (1), α represents the conversion rate, which is the proportion of the solid reactant to the product at the reaction time t. α can be calculated according to the thermogravimetric data, and it is described by Equation (2). /dt stands for the reaction rate. T is the temperature. k(T) is the reaction rate constant, which can be expressed as Equation (3). f(α) means the mechanism function, which is determined by the specific reaction type.
α = m 0 m t m 0 m
k ( T ) = A exp ( E a R T )
In Equations (2) and (3), m0, mt, and m refer to the mass of the reactant at the initial moment, the instantaneous moment, and the end moment, respectively (mg). A is the pre-exponential factor (s−1). Ea represents the activation energy (kJ/mol). R is the universal gas constant, and R = 8.314 J/(mol·K). T represents the experimental temperature (K).
When the thermogravimetric experiment is carried out under the linear temperature program, the heating rate β is a constant, which is explained using Equation (4).
β = d T d t
Based on Equation (4), dt = dT/β can be obtained. By combining Equations (2) and (3), Equation (1) can be rewritten as Equation (5).
d α d T = A β f ( α ) exp ( E a R T )
On the basis of the above equations, the kinetic parameters, including Ea, lnA, and the mechanism function f(α), are called the kinetic trifactor.
Model-free methods are common and popular in solving the kinetic parameters of thermal decomposition, and are recommended by The CTAC Kinetics Committee [32]. The calculation of activation energy by model-free method is a helpful way to reduce the error caused by the assumed model. The activation energy is calculated by combining the same conversion with the corresponding temperature at multiple heating rates. In this work, the activation energies are obtained from three typical model-free methods, including the Friedman method, the Kissinger–Akahira–Sunose (KAS) method, and the Starink method.
The Friedman method is evolved from Equations (1) and (3) and obtained by applying logarithm at both sides, then the equation for the Friedman method can be expressed as Equation (6).
l n ( β d α d T ) = l n ( A f ( α ) ) E a R T
The plot of ln(βdα/dT) vs. 1/T gives a straight line whose slope can be used to determine Ea.
The Equation for the KAS method can be expressed as Equation (7).
l n β T 2 = l n ( A E a R g ( α ) ) E a R T
The plot of ln(β/T2) vs. 1/T gives a straight line whose slope can be used to determine Ea.
The Starink method is similar to KAS and modified on the basis of KAS. The corresponding equation can be written as Equation (8).
l n β T 1.92 = l n ( A E a R g ( α ) ) 0.312 1.0008 ( E a R T )
The plot of ln(β/T1.92) vs. 1/T gives a straight line whose slope can be used to determine Ea. For solid pyrolysis studies, the first-order chemical reaction is usually assumed to be adopted continually [33]. The value of Ea and lnA can be obtained from the slope and intercept of the related fitted line in the plot, respectively.

2.4. Shuffled Complex Evolution

The Shuffled Complex Evolution (SCE) algorithm is specifically designed to address continuity problems encountered in global optimization algorithms with multiple local minima. SCE is featured in the evolution of the competitive complex, the controlled random search, the implicit clustering, and the complex shuffling. Initially employed in the realm of hydrogeology, SCE has garnered significant acclaim for its application in parameter estimation studies on hydrological models [34]. A comprehensive introduction can be accessed through previous argumentation and elaboration [35,36,37,38]. The algorithm demonstrates its efficacy in optimizing nonlinear and multimodal problems, showcasing remarkable capabilities in global search and convergence speed [39,40]. In the SCE algorithm, the objective function reflects the difference between the experimental and estimated values of the sample mass loss (ml) and mass loss rate (mlr) [41]. The objective function can be expressed as Equation (9).
φ = φ m l + φ m l r = j = 1 N [ k = 1 n ( m m 0 mod , k m m 0 exp , k ) 2 k = 1 n ( m m 0 mod , k 1 n p = 1 n m m 0 exp , p ) 2 + k = 1 n ( d ( m / m 0 ) d T mod , k d ( m / m 0 ) d T e x p , k ) 2 k = 1 n ( d ( m / m 0 ) d T exp , k 1 n p = 1 n d ( m / m 0 ) d T e x p , p ) 2 ]
where φml and φmlr are the objective functions for mass loss (m/m0) and mass loss rate (d(m/m0)/dT), respectively. N is the number of experiments, and n is the number of experimental data points for each experiment. The subscripts mod and exp refer to the modeled values and experimental data, respectively. The minimum value of the objective function can be searched within the prescribed parameter search range, which means that the optimal optimization results can be obtained.

3. Results and Discussion

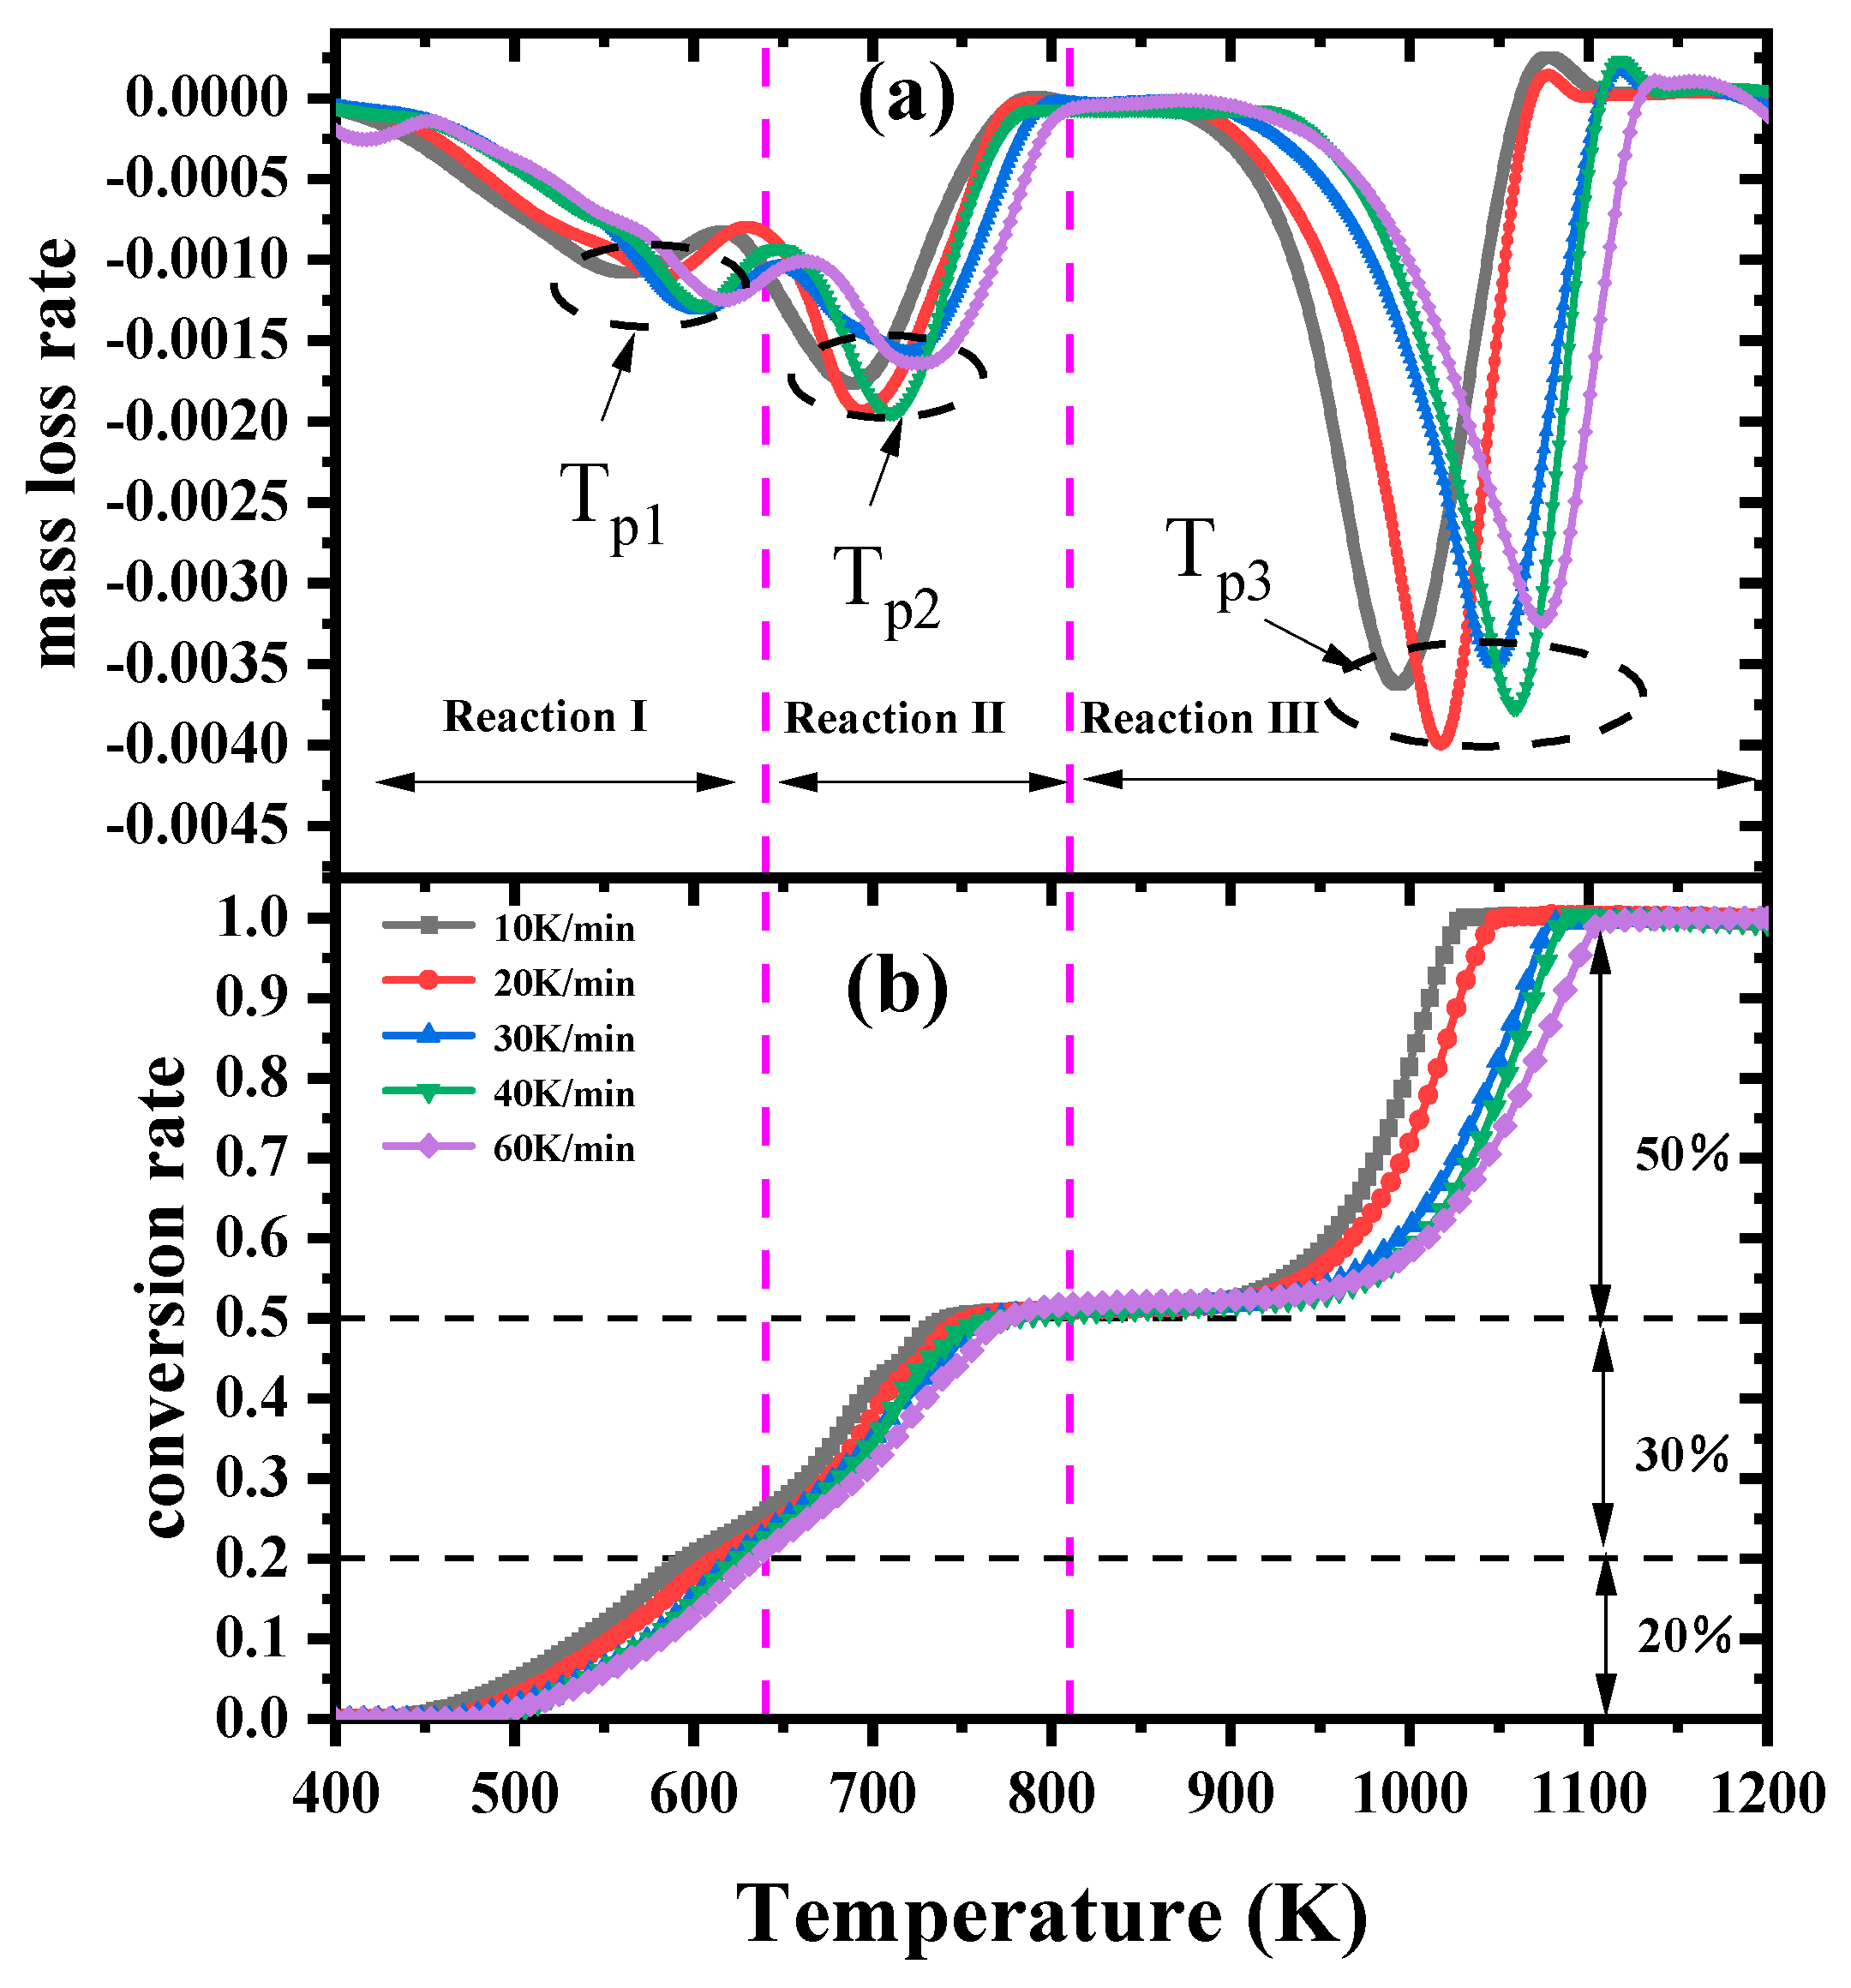
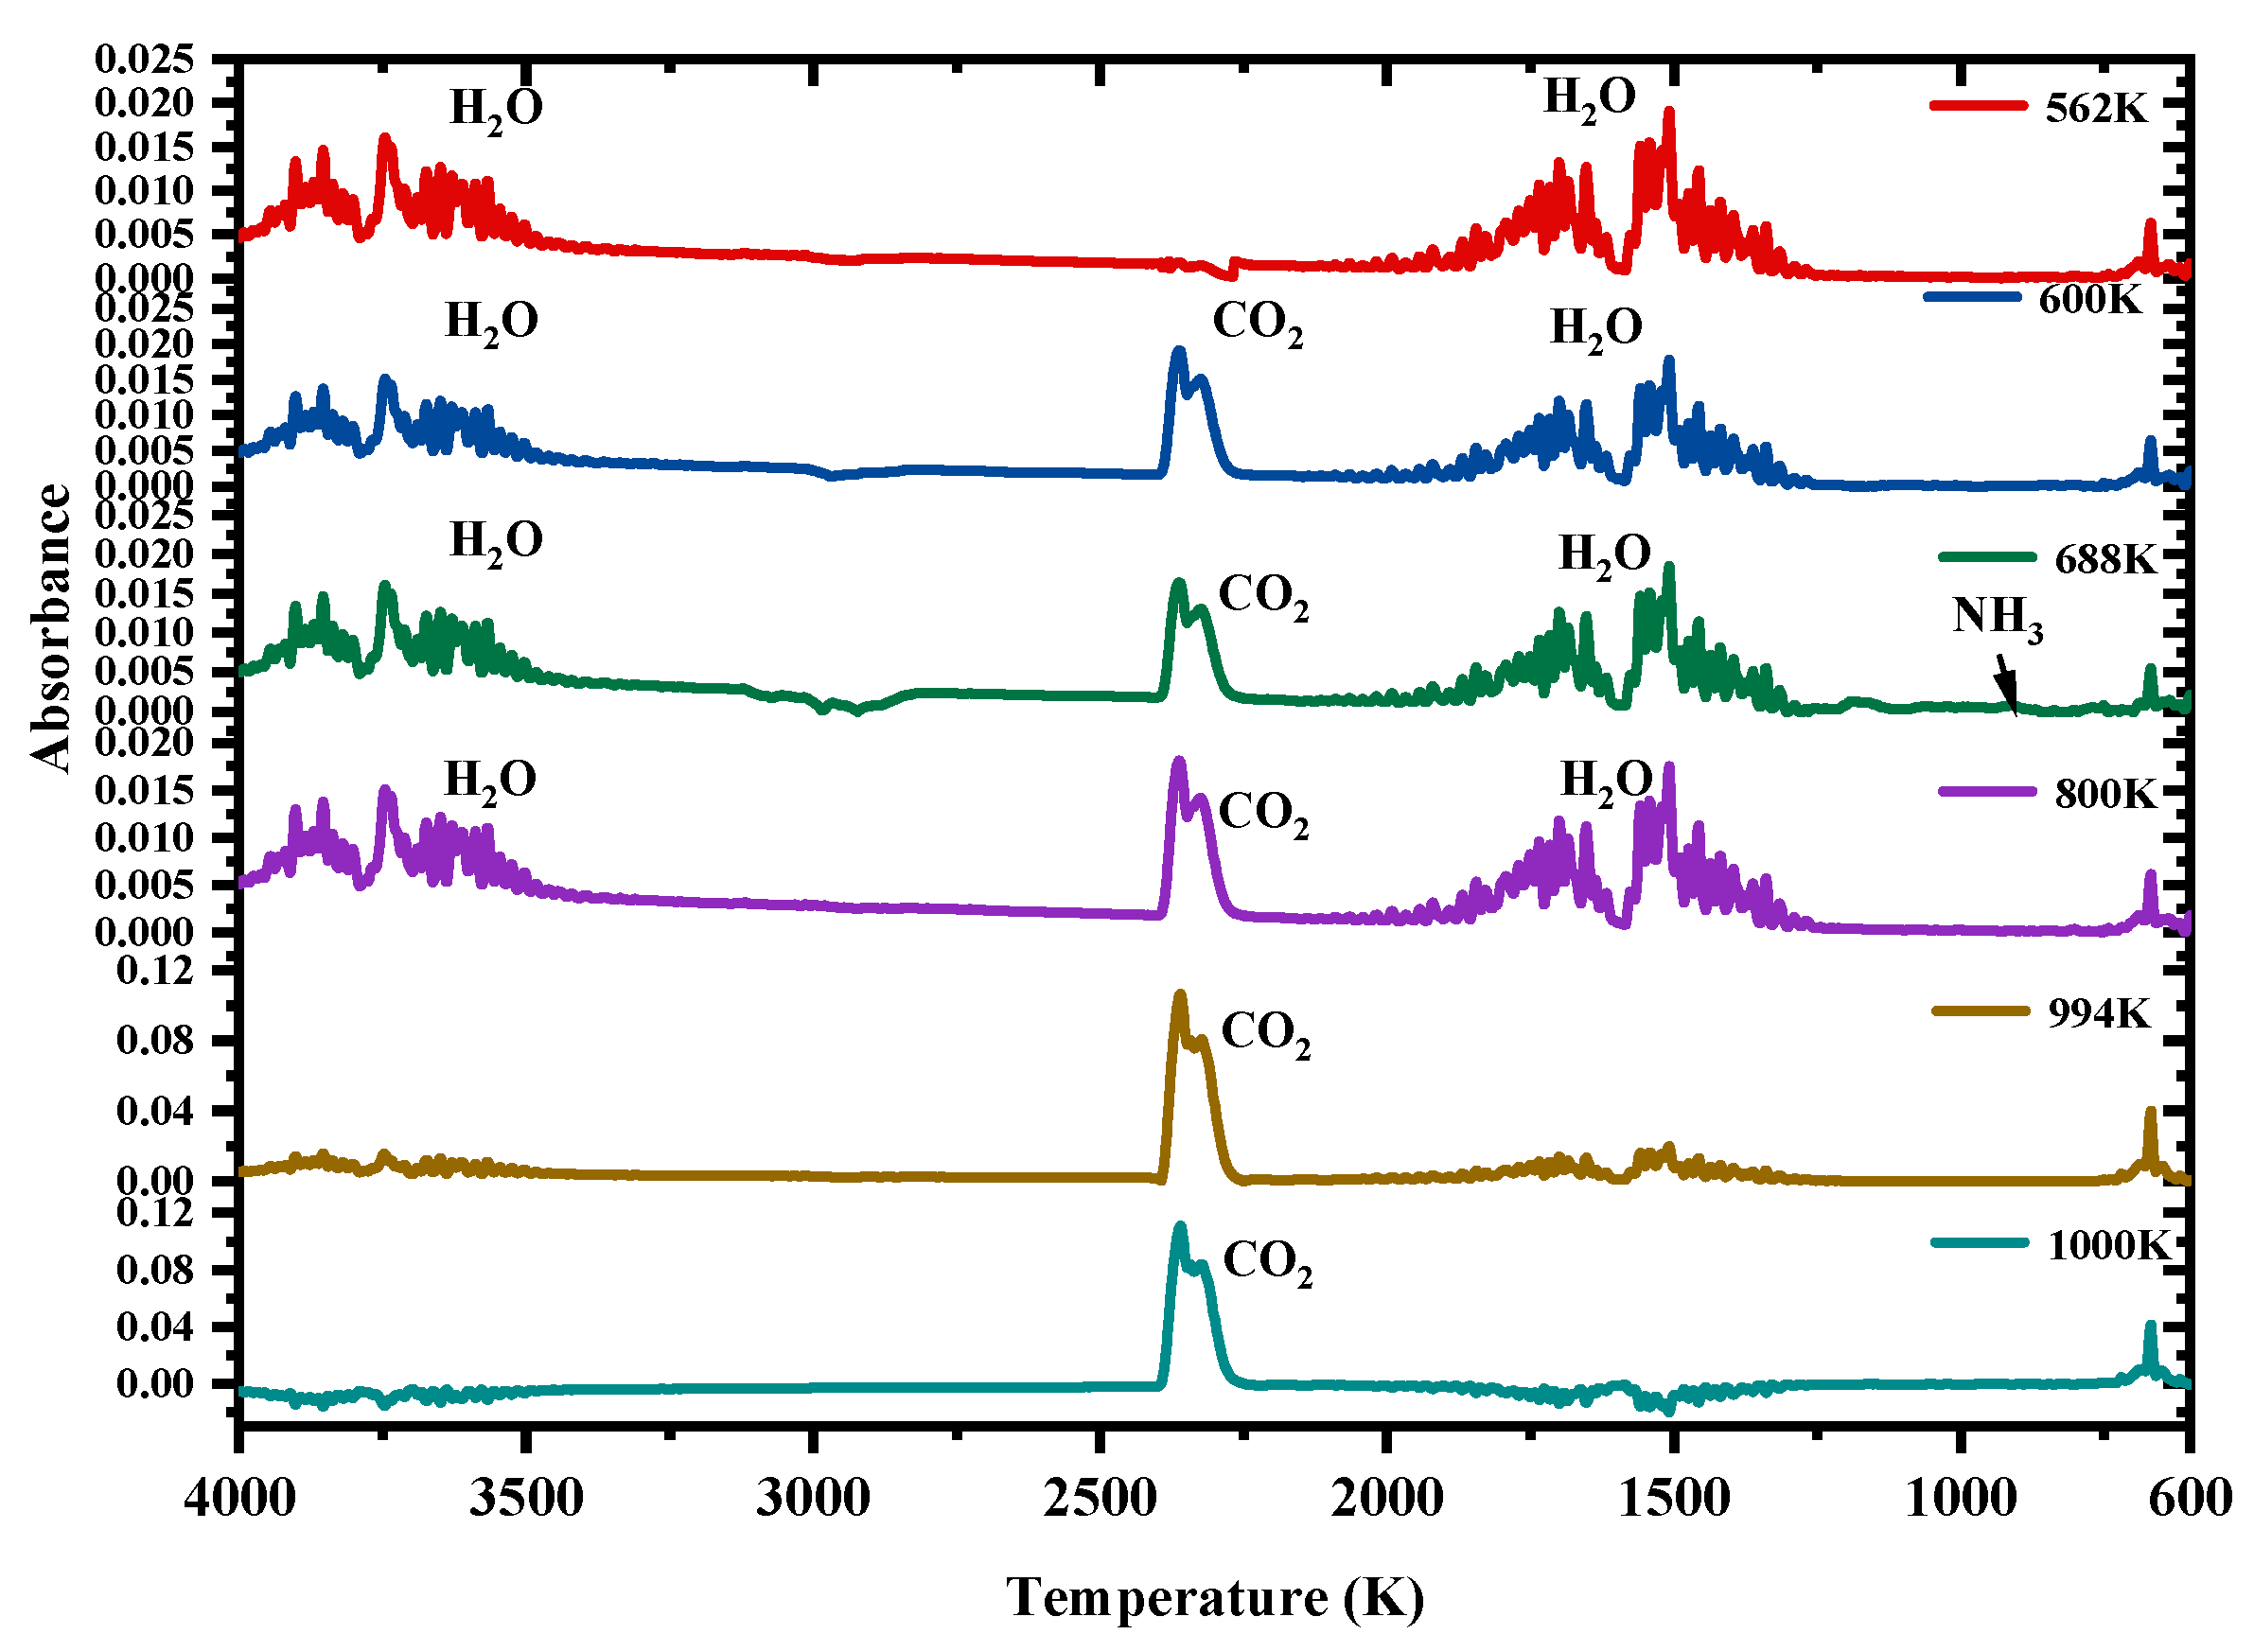
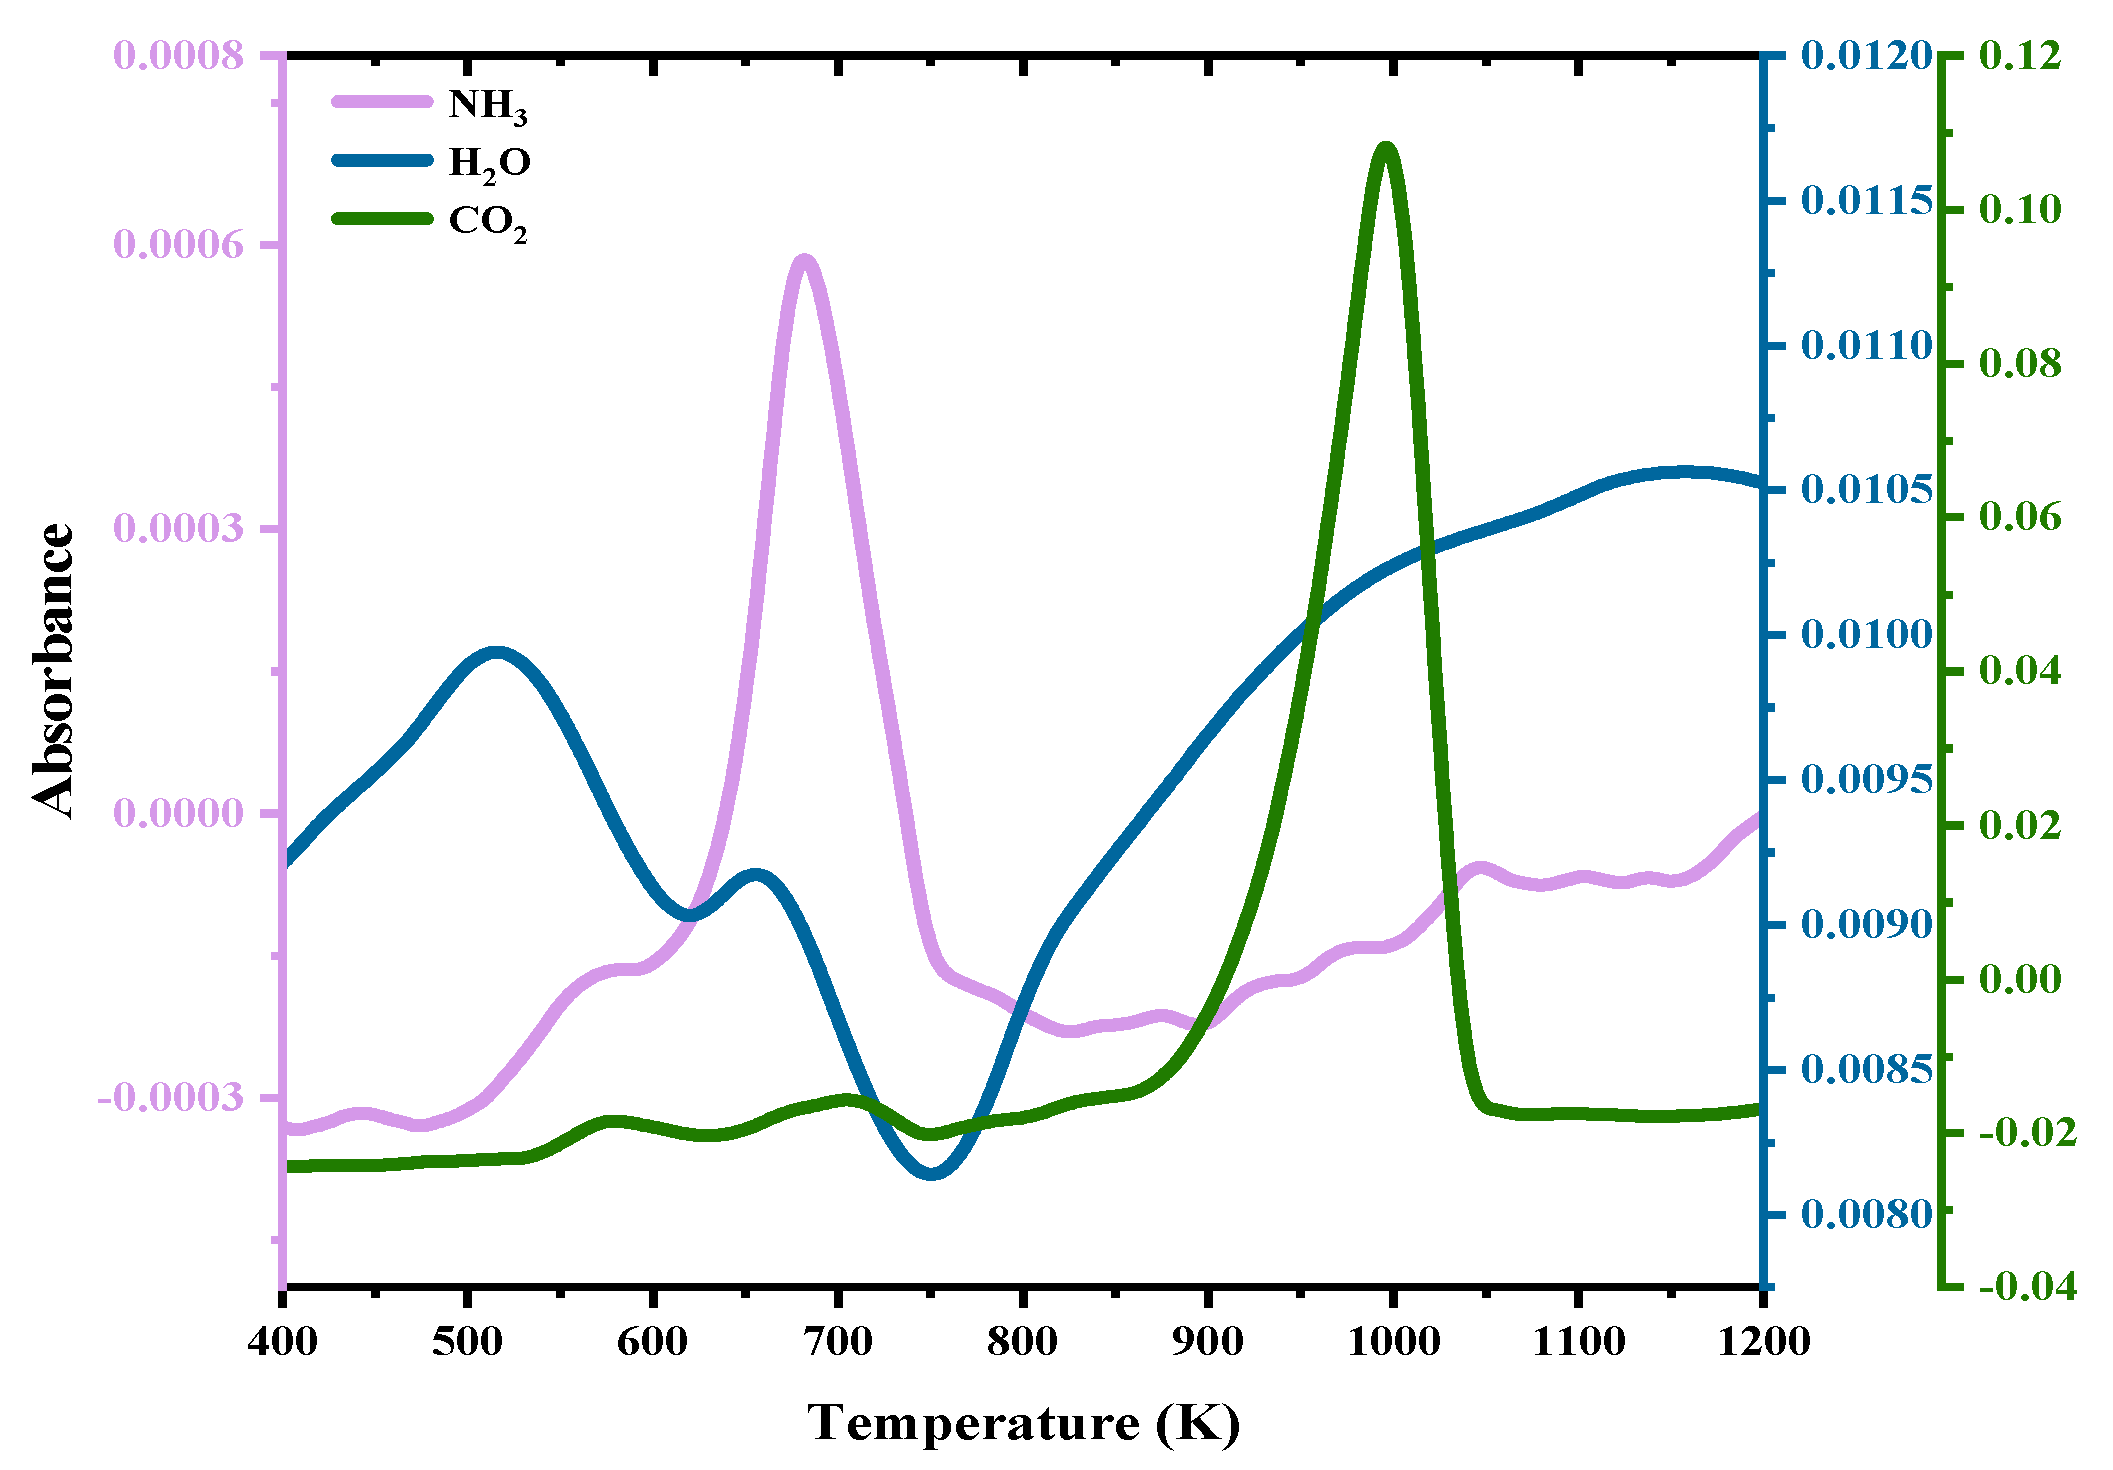
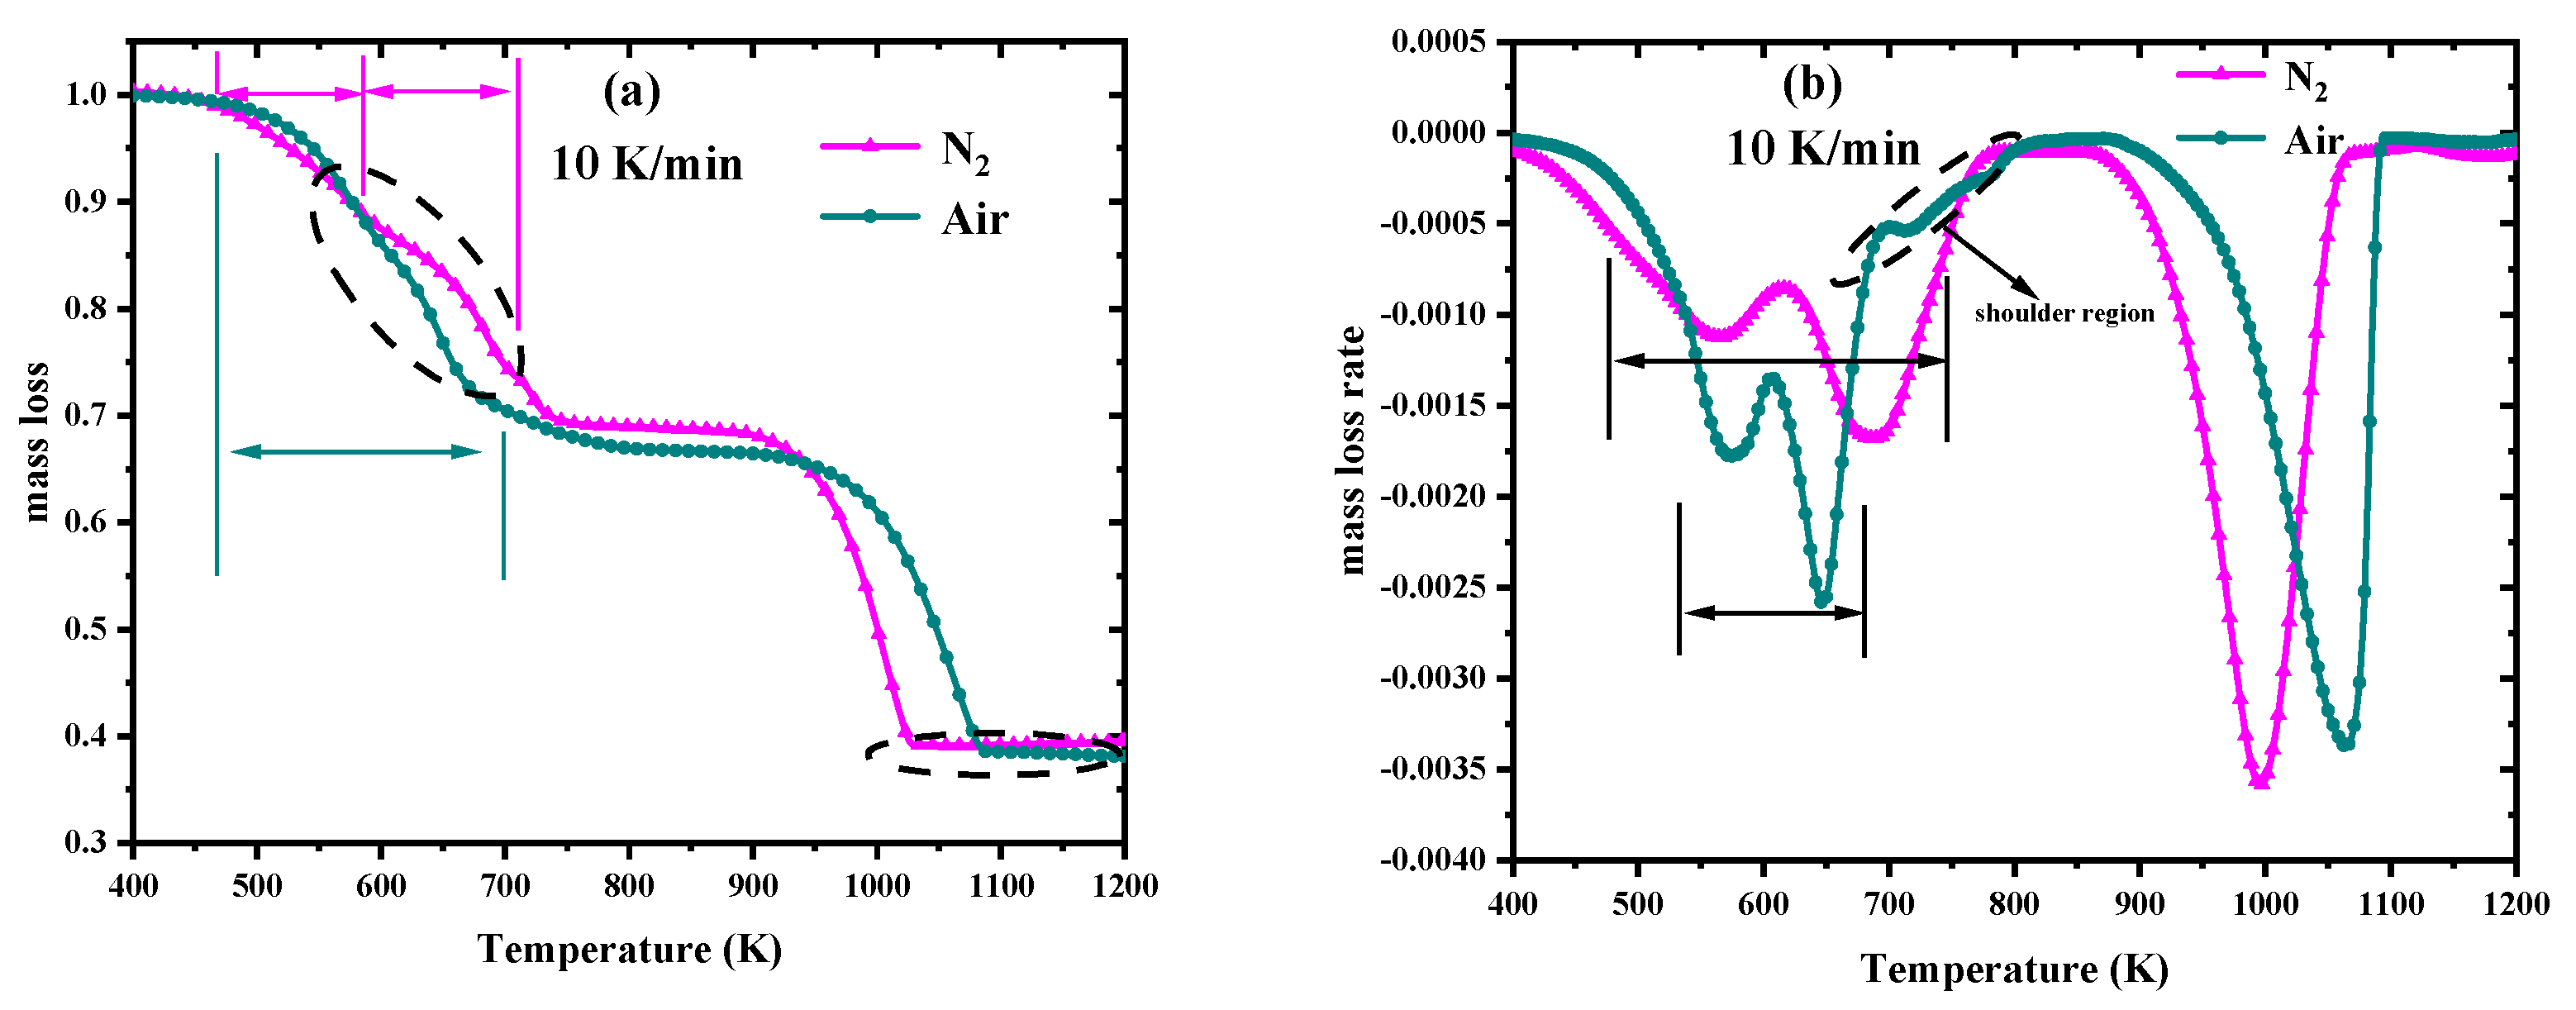
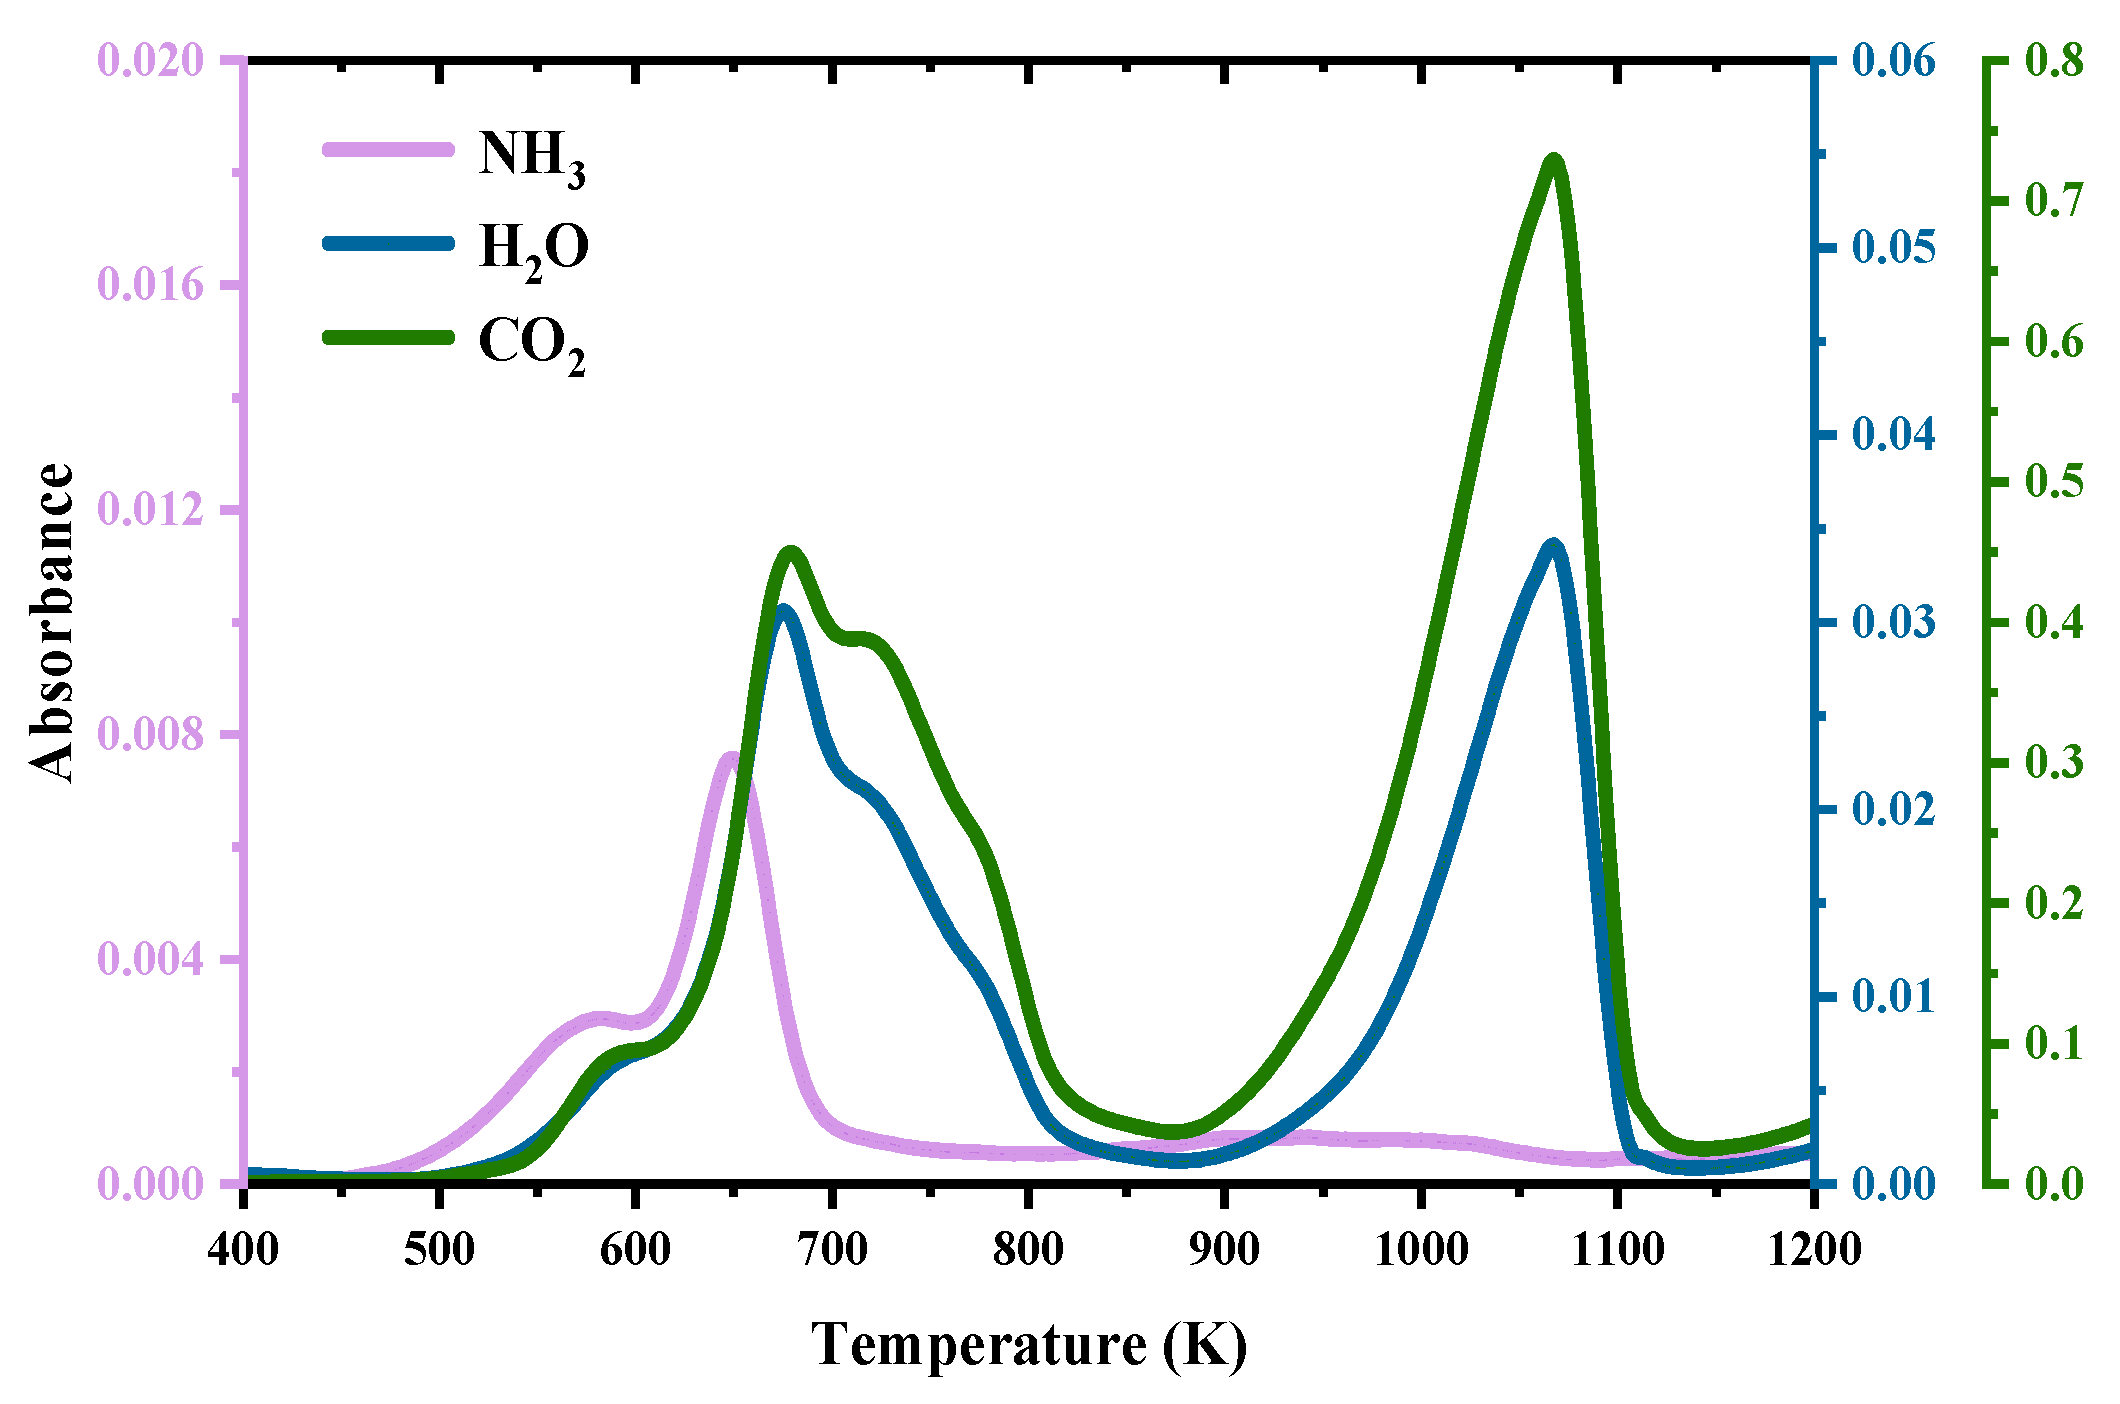
3.1. TG–FTIR Analysis

Figure 1 depicts the mass loss rate curves and conversion rate curves of the fireproof sealant sample at five different heating rates in the nitrogen atmosphere. The mass loss rate curves exhibit three distinct peak partitions, indicating the occurrence of three main reactions. The local peaks in the mass loss rate curves are approximately located at 550 K, 700 K, and 1000 K, marked as Tp1, Tp2, and Tp3, corresponding to a conversion rate of about 0.2, 0.5, and 0.8, respectively. It shows that the trends in the mass loss rate curves and the conversion rate curves of the fireproof sealant pyrolysis have not been strongly altered.
To further estimate the possible reactions during the whole pyrolysis process, the TG–FTIR spectrum at the heating rate of 10 K/min is depicted in Figure 2. The identification of gas products is based on their distinct absorbance patterns. The presence of carbon dioxide is clearly evident within the spectral range of 2400–2260 cm−1 and 680–660 cm−1. The existence of water vapor can be inferred from the spectral range of 3500–4000 cm−1, which arises from the stretching and vibration of the hydrogen–oxygen bond. Ammonia is also detected within the spectral range of 800–1000 cm−1, albeit with less presentation. Therefore, the main gases produced by the pyrolysis of the fireproof sealant predominantly comprise carbon dioxide, water vapor, and ammonia. The process of generating these three gaseous products is illustrated in Figure 3.
Initially, ammonium polyphosphate, functioning as a dehydrating carbonizing agent, undergoes decomposition when subjected to elevated temperatures, resulting in the generation of ammonia, water vapor, and phosphoric acid [42,43,44]. Phosphoric acid undergoes additional dehydration and polycondensation with the formation of a carbon layer [45,46]. Moreover, melamine is regarded as a blowing agent due to its ability to generate gas, which is still the main component of fireproof sealant. The pyrolysis products of melamine include ammonia, water vapor, and carbon dioxide. It facilitates the formation of an expanded carbon layer and porous foam structure. This porous structure effectively diminishes the rate of heat transfer, thereby delaying the temperature increase inside the solid. Furthermore, with the increase in temperature, the acrylic acid starts to decompose and produces a significant quantity of carbon dioxide [47]. The main chemical reactions involved in the pyrolysis process of the fireproof sealant can be expressed by the following three-component parallel reactions.
Reaction I: Ammonium polyphosphate → Residue + H2O + NH3;
Reaction II: Melamine → Residue + NH3 + CO2 + H2O;
Reaction III: Acrylic acid → Residue + CO2.
The application of different atmospheric conditions may lead to differences in thermal degradation behavior. Figure 4 shows the differences in fireproof sealant pyrolysis in nitrogen and air atmospheres, taking the heating rate at 10 K/min as an example. From the mass loss rate curve, the existence of oxygen promotes the first two reactions [48], the peak value in air is much larger than that in nitrogen. However, for the third reaction, a delay occurs and its reaction peak is located at a higher temperature, and the peak value is slightly smaller than that in the nitrogen atmosphere. Meanwhile, an additional small shoulder region appears in the mass loss rate curve in the air atmosphere near 700–800 K, which may be the oxidative decomposition of intermediate products.
Figure 5 displays the evolution of the three main gases (carbon dioxide, water vapor, and ammonia) by FTIR at 10 K/min under the air atmosphere. Compared with the results for the nitrogen atmosphere, the biggest difference is the trend in carbon dioxide, which was also produced in the range of 600–800 K. Meanwhile, the amount of carbon dioxide produced during oxidative pyrolysis is significantly higher than that produced during pure nitrogen pyrolysis.

3.2. Kinetic Analysis Based on the Model-Free Methods

To explore the pyrolysis process in more detail, the thermal decomposition behaviors of the fireproof sealant in the nitrogen atmosphere are further studied and the kinetic parameters are computed. Activation energy means the minimum amount of energy that a compound must provide for a chemical reaction to occur, and the three model-free methods (Friedman, KAS, and Starink method) are adopted to calculate the Ea corresponding to different conversion rates. The Ea and lnA values for fireproof sealant pyrolysis, based on three model-free methods, are listed in Table 1.
According to the values calculated by the Friedman, KAS, and Starink methods, there is not much difference between them. The average activation energy in the conversion rate ranges from 0.1 to 0.2 (Reaction I) and its average values corresponding to the three methods are 124.84 kJ/mol, 99.91 kJ/mol, and 100.21 kJ/mol, respectively, and then the final average activation energy was computed to be 108.32 kJ/mol. When the conversion rate is between 0.3 and 0.5 (Reaction II), the activation energy remains relatively stable, and its average values corresponding to the three methods are 196.03 kJ/mol, 202.52 kJ/mol, and 202.83 kJ/mol, respectively, and then the final average activation energy is 200.46 kJ/mol. When the conversion rate is between 0.6 and 0.9 (Reaction III), the activation energy shows a slight decline. The values corresponding to the three methods are 171.54 kJ/mol, 179.63 kJ/mol and 180.15 kJ/mol, respectively, and then its final average value is 177.10 kJ/mol.
Similarly, the related lnA can be obtained as: 12.47, 24.35, and 11.69 s−1 for the three reactions. The final computed values of Ea and lnA are selected as the initial values in the next SCE optimization.

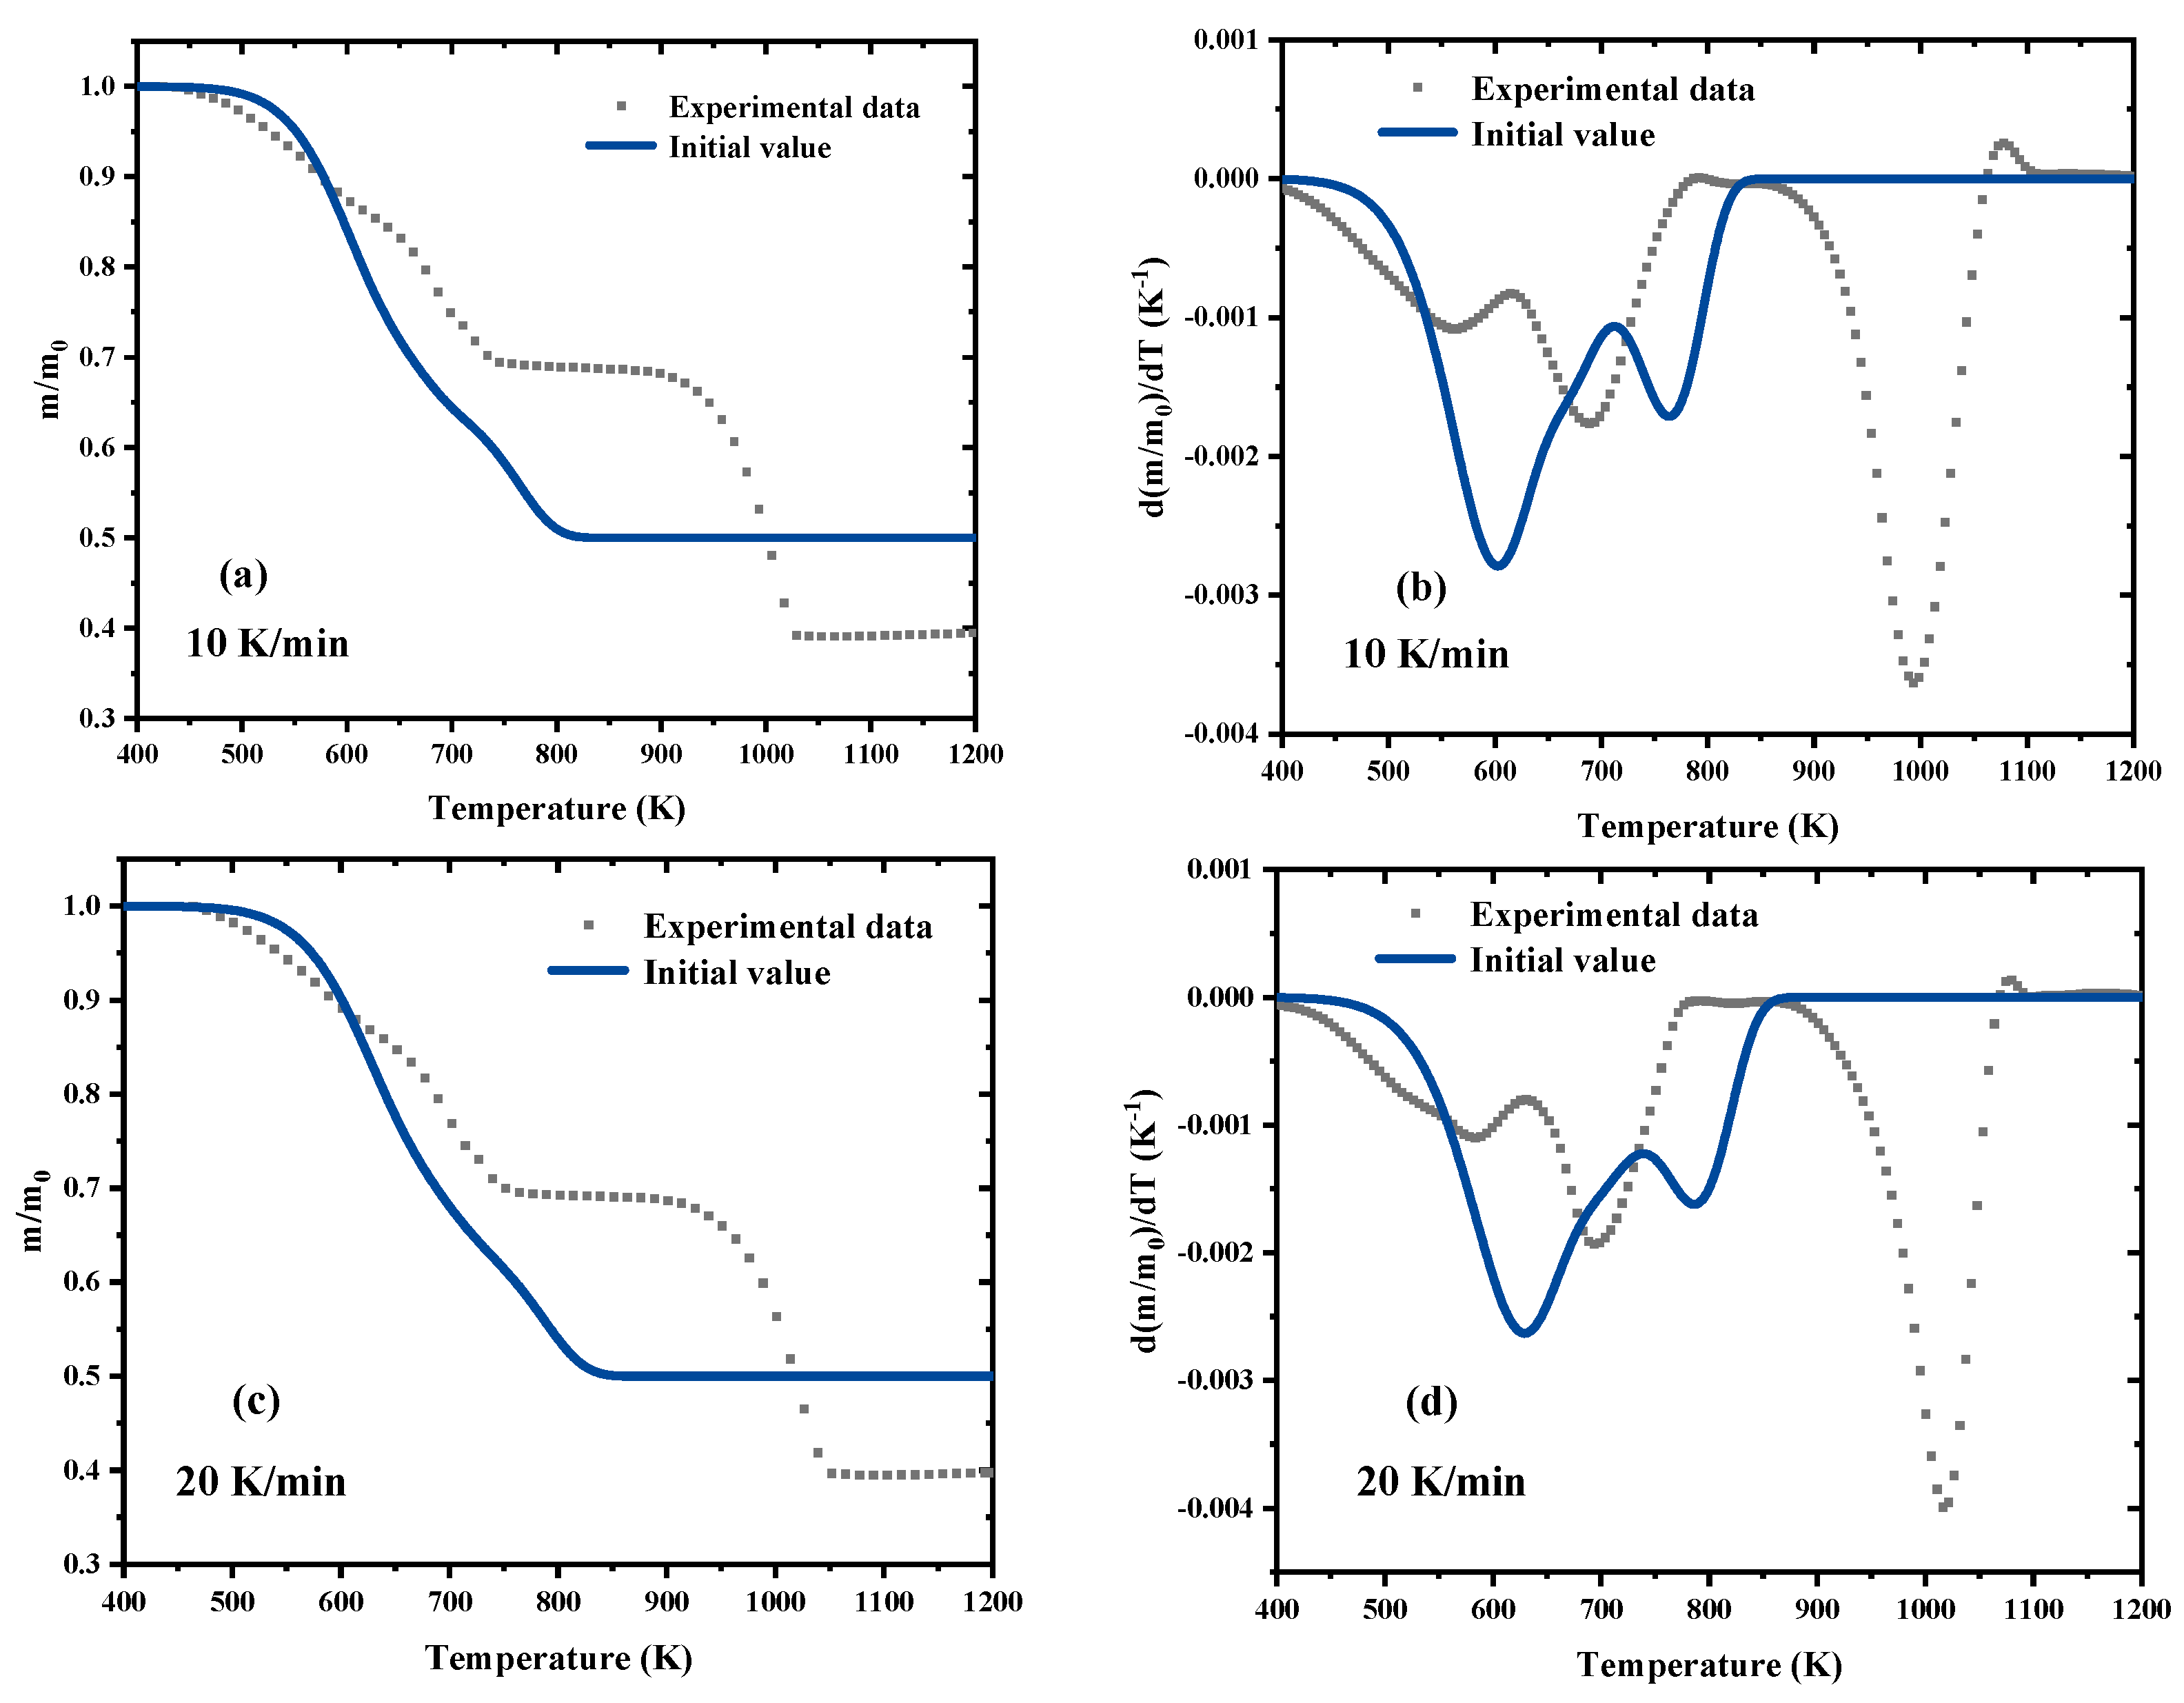
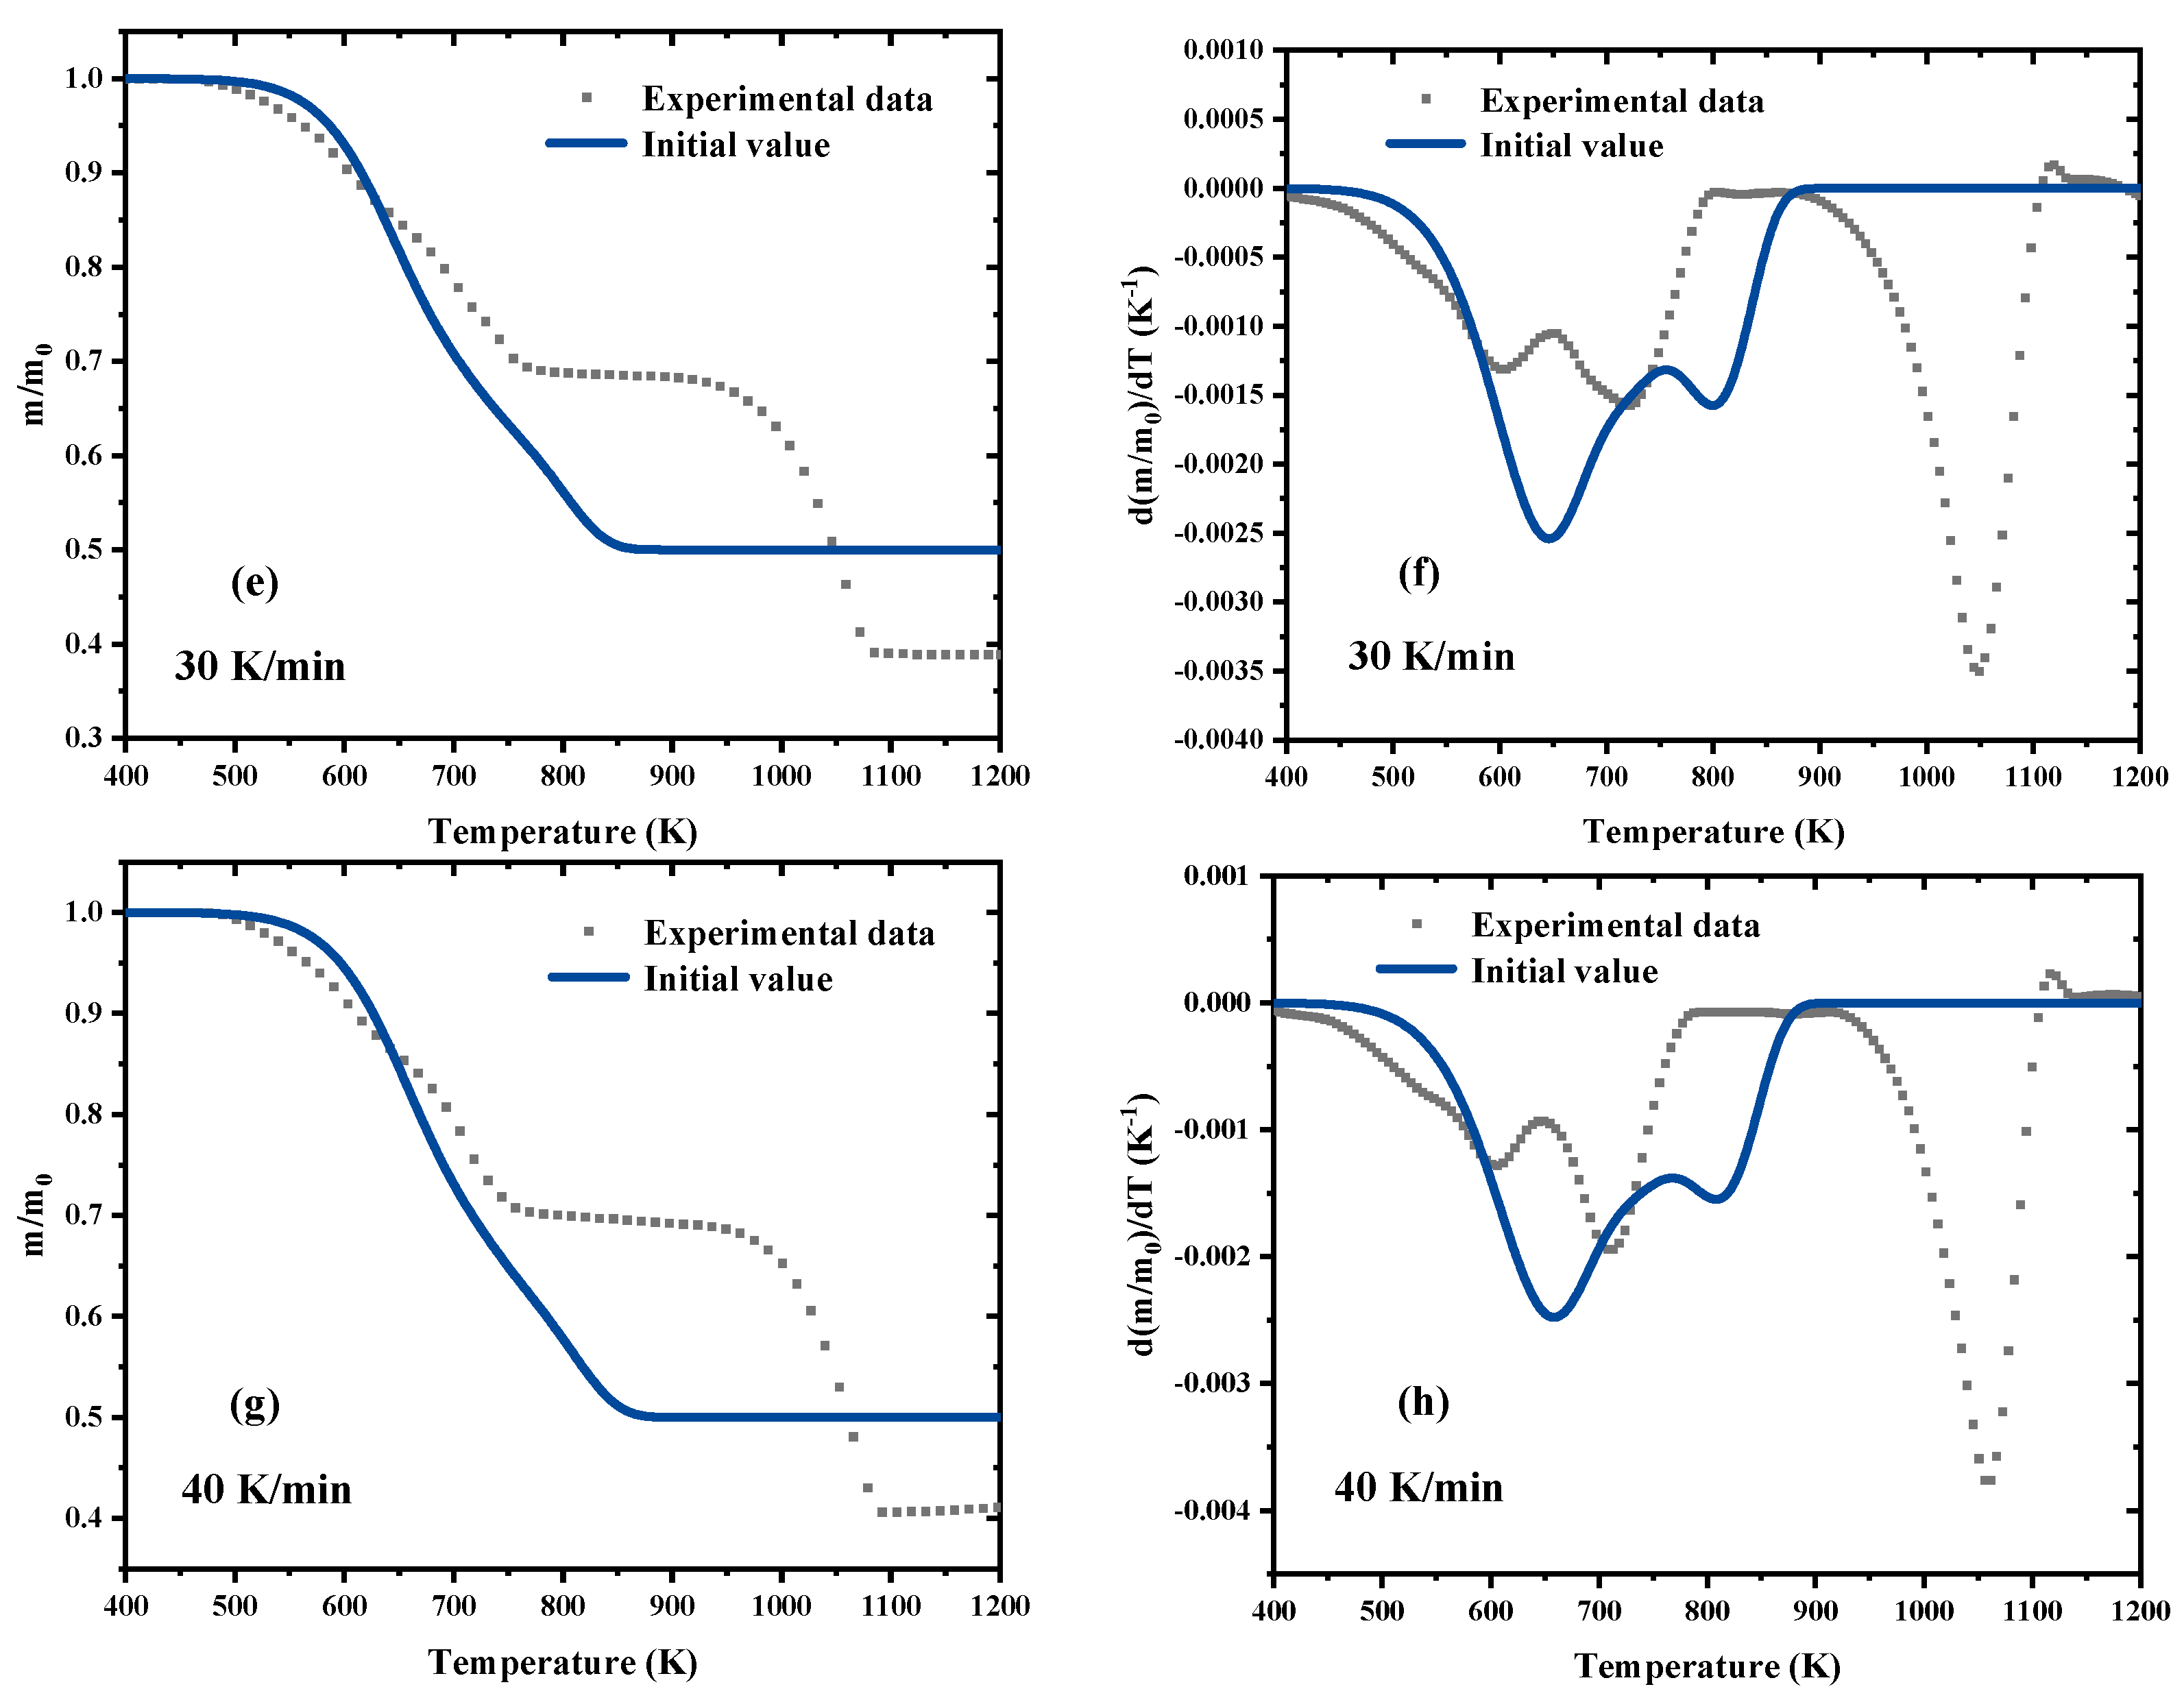
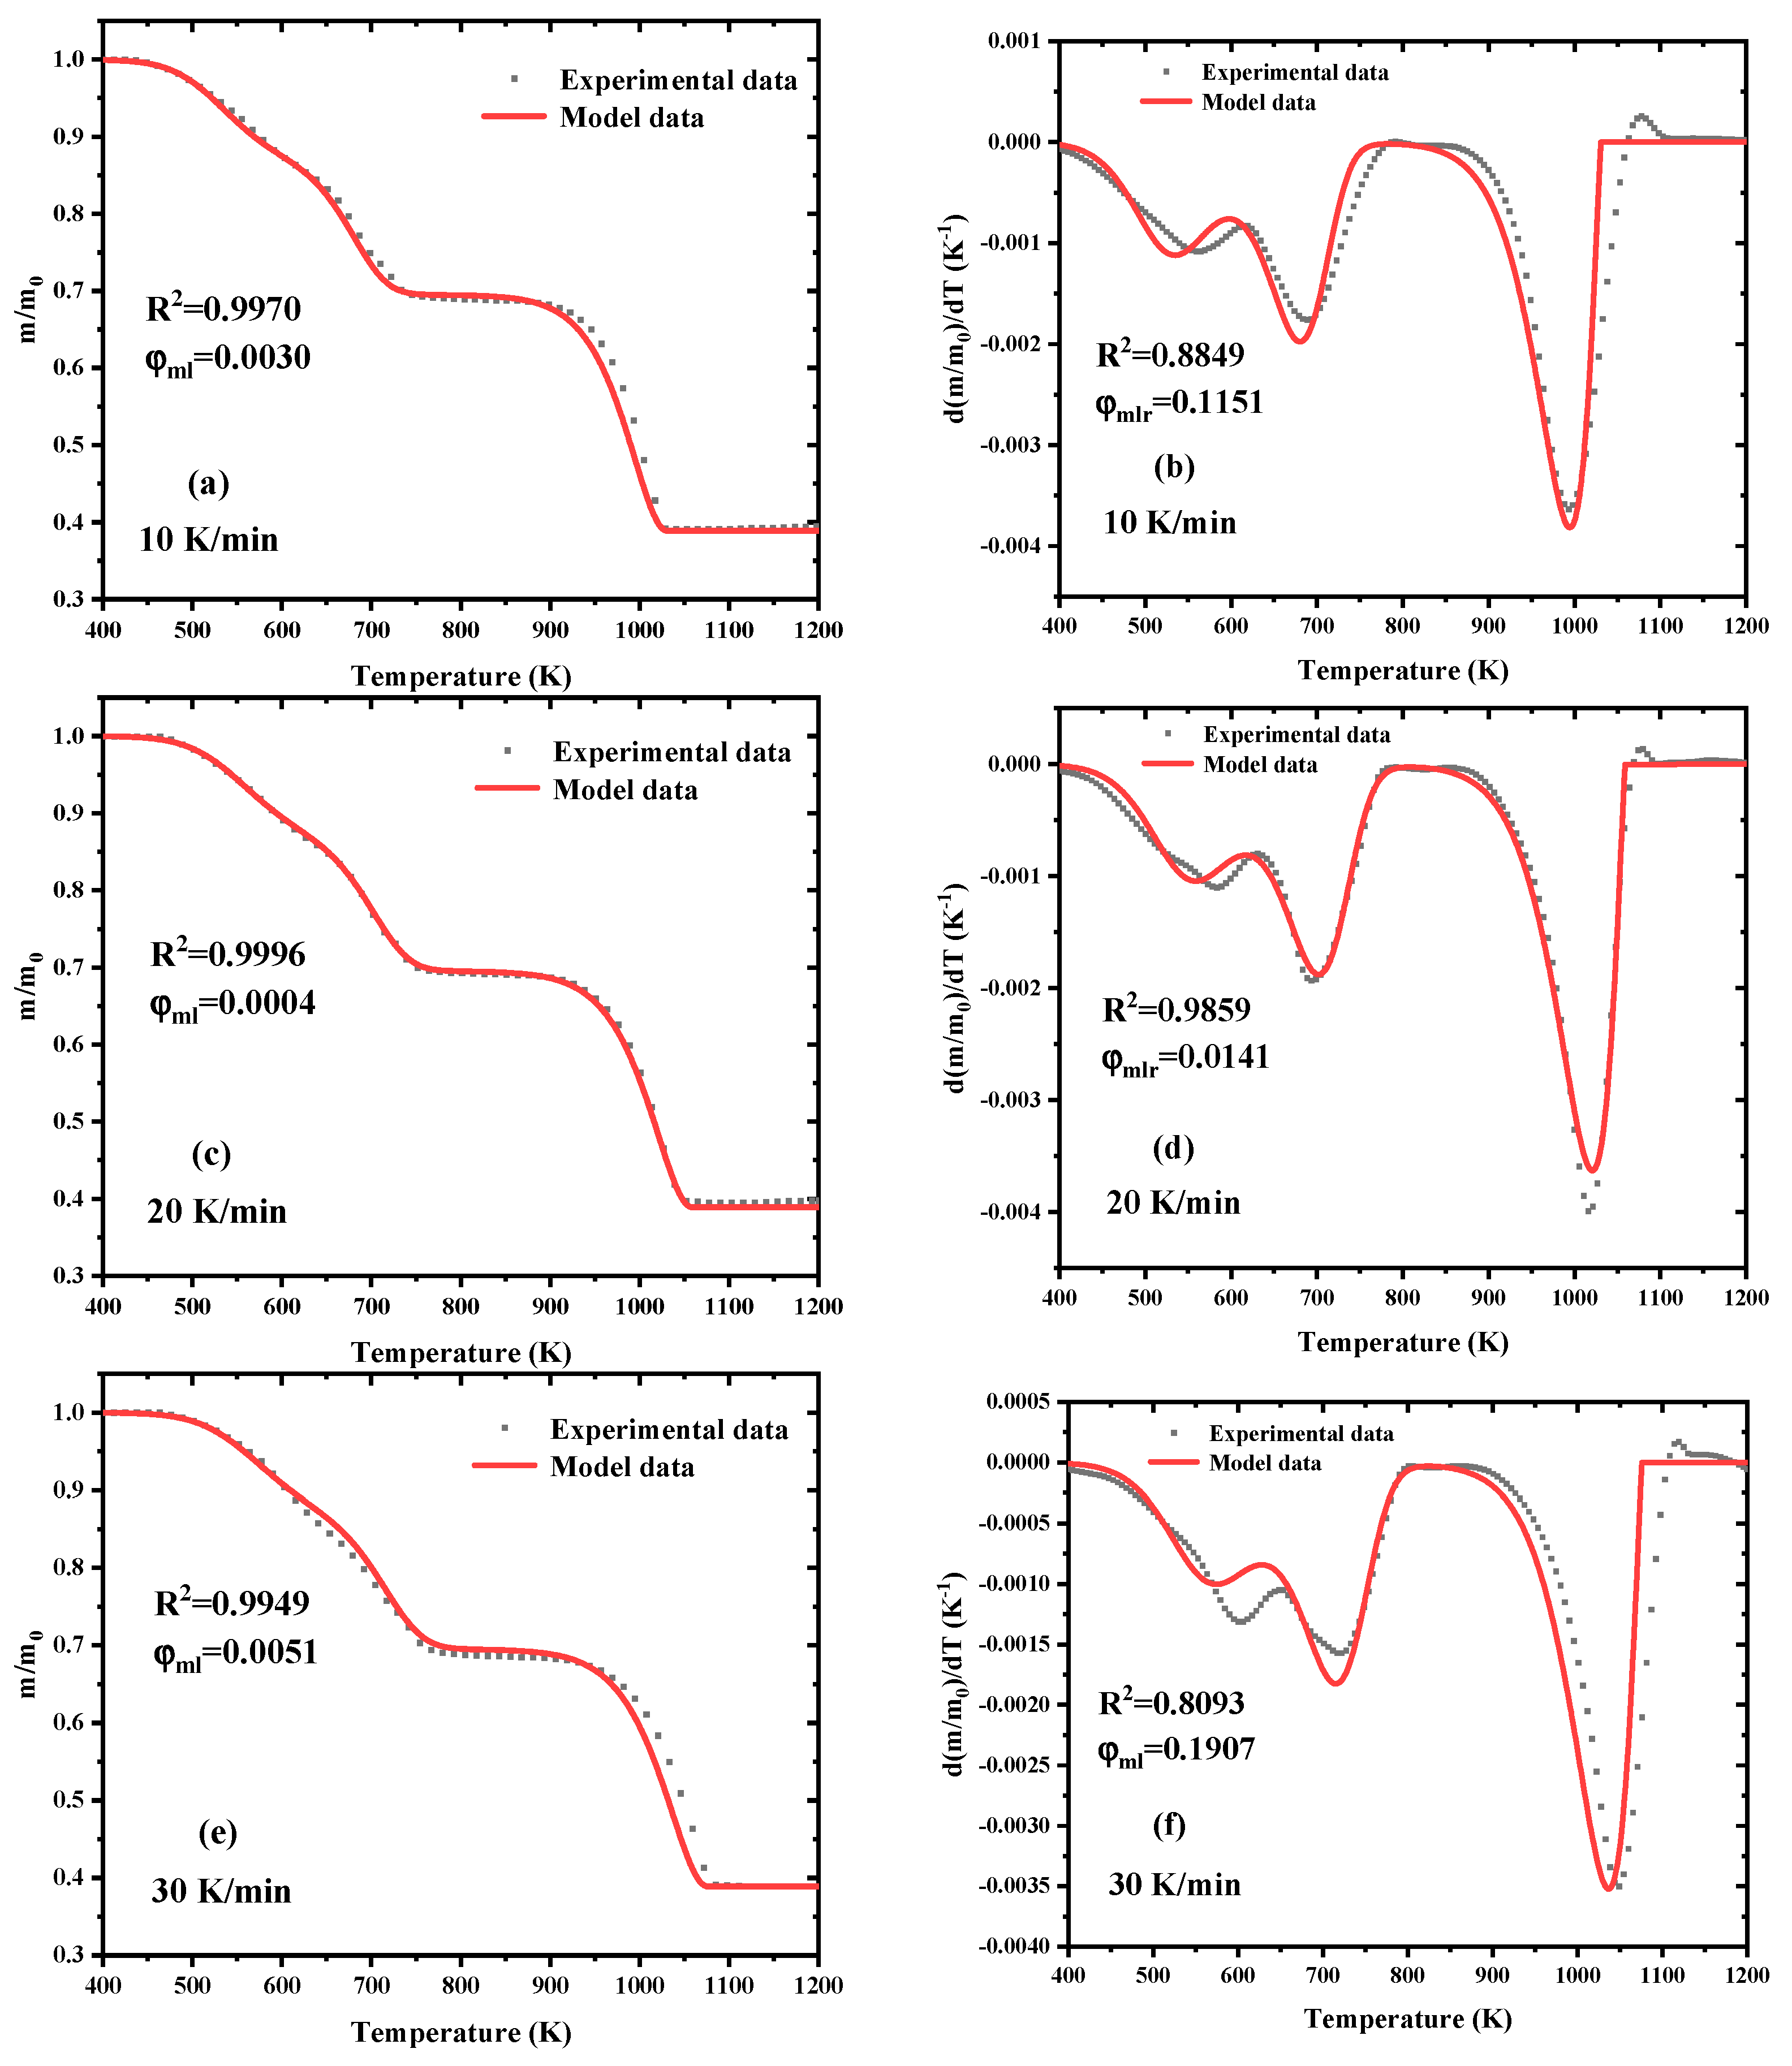
3.3. Parameters Optimization Process by SCE

According to the above analysis of the three-component parallel reactions, the kinetic scheme can be written as:
Ammonium polyphosphate → νAPP Residue + (1 − νAPP) Volatiles;
Melamine → νMEL Residue + (1 − νMEL) Volatiles;
Acrylic acid → νAA Residue + (1 − νAA) Volatiles.
The subscripts APP, MEL, and AA represent ammonium polyphosphate, melamine, and acrylic acid, respectively. As mentioned in the Introduction, the estimation results based on the reaction kinetic parameters computed by the model-free methods have a large deviation from the experiment data, as shown in Figure 6. Wherein, the reaction is assumed to follow an n-order reaction order model, and n is set as 1.00. Considering that the final experiment residue is 0.4, the residue yield ν for all the three reactions is temporarily set to 0.40.
It is no wonder that the estimated results based on the initial kinetic parameters fail to accurately reflect the experimental mass loss process (left column) and capture the peak locations in the mass loss rate (right column), resulting in significant deviation. Consequently, the SCE algorithm is employed to optimize the initial kinetic parameters in order to address this deviation. The search range for Ea and lnA is set as 20% to 200% of the initial values, the reaction order n is set to 0–5.00, and the residual yield ν is set to 0–1.00 [36]. Consequently, a total of 14 parameters are required to be simultaneous optimization, as presented in Table 2.
Four heating rates (10, 20, 30, and 40 K/min) are chosen for optimization, and the particularly high heating rate 60 K/min is used for the next validation. The SCE optimization results are plotted in Figure 7. The final activation energies for the three reactions are 113.47, 206.35, and 65.68 kJ/mol, the pre-exponential factors are 14.70, 19.52, and 9.36 s−1, and the reaction orders are 1.09, 0.62, and 1.88, respectively.
In comparison to the non-optimized scenario, the results based on the optimized values exhibit a precise reproduction of the pyrolysis process. Curve fluctuations and peak locations can be well-targeted and captured clearly. The correlation coefficients R2 between the estimated results and experimental data of mass loss are 0.9970, 0.9996, 0.9949, and 0.9908, respectively, while the correlation coefficients are still up to 0.8849, 0.9859, 0.8093, and 0.8559, respectively.

3.4. Estimated Results at Extra Heating Rate

The significance of the optimized pyrolysis kinetic parameter values lies in their ability to accurately estimate the pyrolysis behavior at multiple heating rates. To further validate the applicability of these optimized parameters, an extra heating rate of 60 K/min, which is not used in the optimization process, is chosen to evaluate the current estimation ability.
As depicted in Figure 8, the results based on the optimized kinetic parameters at 60 K/min are compared with experiment data. It can be seen that the results of the model using the optimized parameter values agree well with the experimental data. The correlation coefficients between the estimated results and experimental data for the mass loss and mass loss rate at 60 K/min reach up to 0.9943 and 0.9019, respectively, indicating the good extension of the optimized kinetic parameters to the estimation of the pyrolysis behavior of fireproof sealant. Moreover, Figure 8 also provides further insight into the variation in the three main components we separated out (ammonium polyphosphate, melamine, and acrylic acid) throughout the entire pyrolysis process.

4. Conclusions

The pyrolysis behavior of the fireproof sealant is investigated through a series of TG and TG–FTIR experiments. A three-component parallel reaction and the corresponding main gas products (ammonia, water vapor, and carbon dioxide) are established. There is a slight difference between the pure pyrolysis and the oxidative pyrolysis of fireproof sealant. Based on the reaction scheme in the nitrogen atmosphere, three typical model-free methods, including the Friedman, KAS, and Starink methods, are used to calculate the initial pyrolysis kinetic parameters, and then the SCE algorithm is applied to optimize them. The final activation energies Ea we obtained are 113.47, 206.35, 65.68 kJ/mol, and the pre-exponential factors lnA are 14.70, 19.52, 9.36 s−1, respectively. The estimated results of mass loss and mass loss rate agree well with experimental data, and even reproduce the data at the extra heating rate, indicating that the SCE algorithm can serve as an effective approach for estimating the pyrolysis behavior of fireproof sealant. In the future, besides pyrolysis mechanisms based on micro-scale experiments, more bench-scale experiments should be conducted to study the combustion characteristics of the fireproof sealant.

Author Contributions

Writing–original draft, W.L.; Writing–review and editing, X.X. and J.Z.; Investigation, Methodology, Y.Z. and X.L.; Writing–review and editing, Validation, Supervision, Funding acquisition, Y.D. All authors have read and agreed to the published version of the manuscript.

Funding

This research was funded by the National Natural Science Foundation of China, grant number 52376132; and the Science and Technology Research Program of the Department of Education in Hubei Province, China, grant number B2021001.

Institutional Review Board Statement

Not applicable.

Informed Consent Statement

Not applicable.

Data Availability Statement

Data will be made available on request.

Conflicts of Interest

Author Xiang Li’s affiliation is company Wuhuan Engineering Co., Ltd., Wuhan 430223, China. The author declares that the research was carried out without any commercial or financial relationships that could be construed as a potential conflict of interest. Wuhuan Engineering Co., Ltd. holds no role in the design of the study; in the collection, analyses, or interpretation of data; in the writing of the manuscript, or in the decision to publish the results. The authors have confirmed and signed Disclosure of Potential Conflict of Interest.

References

  1. Higgins, E.; Taylor, M.; Francis, H. A Systemic Approach to Fire Prevention Support. Syst. Pract. Action Res. 2012, 25, 393–406. [Google Scholar] [CrossRef]
  2. Luo, W.Q.; Li, Z.; Luo, H.; Liu, Y.; Xia, G.; Zhu, H.; Zhou, J.; Yu, D.; Zhang, J.; Song, J.; et al. Preparation of Room Temperature Vulcanized Silicone Rubber Foam with Excellent Flame Retardancy. Scanning 2021, 2021, 8. [Google Scholar] [CrossRef] [PubMed]
  3. Sun, Z.E.; Zhou, Y. Discussion on fire-proof sealing technology and product. In Proceedings of the 2015 International Conference on Performance-Based Fire and Fire Protection Engineering (ICPFFPE 2015), Guangzhou, China, 5–6 December 2015; pp. 644–648. [Google Scholar]
  4. Klingler, W.W.; Bifulco, A.; Polisi, C.; Huang, Z.Y.; Gaan, S. Recyclable inherently flame-retardant thermosets: Chemistry, properties and applications. Compos. Part B Eng. 2023, 258, 24. [Google Scholar] [CrossRef]
  5. de Buyl, F. Silicone sealants and structural adhesives. Int. J. Adhes. Adhes. 2001, 21, 411–422. [Google Scholar] [CrossRef]
  6. Zhao, G.; Chen, W.; Zhao, D.; Li, K. Mechanical Properties of Prefabricated Cold-Formed Steel Stud Wall Panels Sheathed with Fireproof Phenolic Boards under Out-of-Plane Loading. Buildings 2022, 12, 897. [Google Scholar] [CrossRef]
  7. Janeczek, K.; Kosyl, M.; Araźna, A.; Czaiński, M.; Lipiec, K.; Stęplewski, W.; Kościelski, M. Investigation of Thermal behaviour of Swelling Anti-Fire Composite Materials Identified with RFID Technology. Adv. Mater. Lett. 2022, 13, 1692–2202. [Google Scholar] [CrossRef]
  8. Zhong, Y.; Ding, Y.M.; Jiang, G.H.; Lu, K.H.; Li, C.H. Comparison of Artificial Neural Networks and kinetic inverse modeling to predict biomass pyrolysis behavior. J. Anal. Appl. Pyrolysis 2023, 169, 10. [Google Scholar] [CrossRef]
  9. Liu, H.Y.; Wang, Y.S.; Yan, H.; Fan, W.Y.; Song, F.; Yuan, I.V.; He, L. Research of the effect of compactness of fireproof mud plugging and proportion of backing material on fireproof performance. Case Stud. Therm. Eng. 2023, 41, 10. [Google Scholar] [CrossRef]
  10. Shen, J.J.; Ren, B.H.; Liu, W.T.; Gao, C.P.; Hu, Y.Y.; Cao, Q. Optimization of Exothermic, Foaming, and Mechanical Properties of Modified Polyurethane as Filling Material for Goaf Sealing Wall. Adv. Mater. Sci. Eng. 2020, 2020, 15. [Google Scholar] [CrossRef]
  11. Kao, S.F.; Wu, Y.S.; Huang, C.J. Combined Fireproof and Stuffing Materials Applied to Through-Floor Pipes. In Proceedings of the International Conference on Advances in Materials and Manufacturing Processes, Shenzhen, China, 6–8 November 2010; p. 1547. [Google Scholar]
  12. Font, R.; Fullana, A.; Caballero, J.A.; Candela, J.; García, A. Pyrolysis study of polyurethane. J. Anal. Appl. Pyrolysis 2001, 58, 63–77. [Google Scholar] [CrossRef]
  13. Krutof, A.; Hawboldt, K.A. Upgrading of biomass sourced pyrolysis oil review: Focus on co-pyrolysis and vapour upgrading during pyrolysis. Biomass Convers. Biorefin. 2018, 8, 775–787. [Google Scholar] [CrossRef]
  14. Rumphorst, M.P.; Ringel, H.D. Pyrolysis of Sewage-Sludge and Use of Pyrolysis Coke. J. Anal. Appl. Pyrolysis 1994, 28, 137–155. [Google Scholar] [CrossRef]
  15. Dubdub, I. Kinetics Study of Polypropylene Pyrolysis by Non-Isothermal Thermogravimetric Analysis. Materials 2023, 16, 584. [Google Scholar] [CrossRef] [PubMed]
  16. Jakic, M.; Vrandecic, N.S.; Klaric, I. Thermal degradation of poly(vinyl chloride)/poly(ethylene oxide) blends: Thermogravimetric analysis. Polym. Degrad. Stabil. 2013, 98, 1738–1743. [Google Scholar] [CrossRef]
  17. Gizynski, M.; Romelczyk-Baishya, B. Investigation of carbon fiber-reinforced thermoplastic polymers using thermogravimetric analysis. J. Thermoplast. Compos. Mater. 2021, 34, 126–140. [Google Scholar] [CrossRef]
  18. Mocanu, A.M.; Odochian, L.; Apostolescu, N.; Moldoveanu, C. TG–FTIR study on thermal degradation in air of some new diazoaminoderivatives. J. Therm. Anal. Calorim. 2010, 100, 615–622. [Google Scholar] [CrossRef]
  19. Souza, B.S.; Moreira, A.P.D.; Teixeira, A. TG–FTIR coupling to monitor the pyrolysis products from agricultural residues. J. Therm. Anal. Calorim. 2009, 97, 637–642. [Google Scholar] [CrossRef]
  20. Singh, R.K.; Ruj, B.; Sadhukhan, A.K.; Gupta, P. A TG–FTIR investigation on the co-pyrolysis of the waste HDPE, PP, PS and PET under high heating conditions. J. Energy Inst. 2020, 93, 1020–1035. [Google Scholar] [CrossRef]
  21. Xu, F.F.; Wang, B.; Yang, D.; Hao, J.H.; Qiao, Y.Y.; Tian, Y.Y. Thermal degradation of typical plastics under high heating rate conditions by TG–FTIR: Pyrolysis behaviors and kinetic analysis. Energy Conv. Manag. 2018, 171, 1106–1115. [Google Scholar] [CrossRef]
  22. Ding, Y.M.; Jiang, G.H.; Fukumoto, K.; Zhao, M.Q.; Zhang, X.T.; Wang, C.J.; Li, C.H. Experimental and numerical simulation of multi-component combustion of typical no-charring material. Energy 2023, 262, 9. [Google Scholar] [CrossRef]
  23. Kajda-Szczesniak, M.; Czop, M. Comparison of Pyrolysis and Combustion Processes of Vinyl Floor Panels Using Thermogravimetric Analysis (TG–FTIR) in Terms of the Circular Economy. Energies 2022, 15, 1516. [Google Scholar] [CrossRef]
  24. Miskolczi, N.; Tomasek, S. Investigation of Pyrolysis Behavior of Sewage Sludge by Thermogravimetric Analysis Coupled with Fourier Transform Infrared Spectrometry Using Different Heating Rates. Energies 2022, 15, 5116. [Google Scholar] [CrossRef]
  25. Zhang, J.Q.; Shang, F.J.; Huang, Y.B.; Zhang, J.; Guo, Y.; He, L.X.; Wang, L.F.; Zhu, T.Y.; Liu, R.; Liu, P.; et al. Pyrolysis characteristics, reaction mechanisms and gas emission of organic fireproof plugging materials by TG–FTIR-MS. J. Therm. Anal. Calorim. 2023, 148, 12751–12760. [Google Scholar] [CrossRef]
  26. Vyazovkin, S.; Wight, C.A. Isothermal and non-isothermal kinetics of thermally stimulated reactions of solids. Int. Rev. Phys. Chem. 1998, 17, 407–433. [Google Scholar] [CrossRef]
  27. Ding, Y.M.; Wang, C.J.; Chaos, M.; Chen, R.Y.; Lu, S.X. Estimation of beech pyrolysis kinetic parameters by Shuffled Complex Evolution. Bioresour. Technol. 2016, 200, 658–665. [Google Scholar] [CrossRef] [PubMed]
  28. Mariani, V.C.; Luvizotto, L.G.J.; Guerra, F.A.; Coelho, L.D. A hybrid shuffled complex evolution approach based on differential evolution for unconstrained optimization. Appl. Math. Comput. 2011, 217, 5822–5829. [Google Scholar] [CrossRef]
  29. Liu, H.R.; Chen, B.; Wang, C.J. Pyrolysis kinetics study of biomass waste using Shuffled Complex Evolution algorithm. Fuel Process. Technol. 2020, 208, 8. [Google Scholar] [CrossRef]
  30. Zhang, W.L.; Zhang, J.; Ding, Y.M.; Zhou, R.; Mao, S.H. The accuracy of multiple methods for estimating the reaction order of representative thermoplastic polymers waste for energy utilization. Energy 2022, 239, 8. [Google Scholar] [CrossRef]
  31. Zhang, X.D.; Xu, M.; Sun, R.F.; Sun, L. Study on biomass pyrolysis kinetics. In Proceedings of the 50th ASME Turbo-Expo 2005, Reno, NV, USA, 6–9 June 2005; pp. 401–405. [Google Scholar]
  32. Vyazovkin, S.; Burnham, A.K.; Criado, J.M.; Pérez-Maqueda, L.A.; Popescu, C.; Sbirrazzuoli, N. ICTAC Kinetics Committee recommendations for performing kinetic computations on thermal analysis data. Thermochim. Acta 2011, 520, 1–19. [Google Scholar] [CrossRef]
  33. Gil, M.V.; Casal, D.; Pevida, C.; Pis, J.J.; Rubiera, F. Thermal behaviour and kinetics of coal/biomass blends during co-combustion. Bioresour. Technol. 2010, 101, 5601–5608. [Google Scholar] [CrossRef] [PubMed]
  34. Duan, Q.Y.; Sorooshian, S.; Gupta, V.K. Optimal Use of the SCE-UA Global Optimization Method for Calibrating Watershed Models. J. Hydrol. 1994, 158, 265–284. [Google Scholar] [CrossRef]
  35. Duan, Q.Y.; Gupta, V.K.; Sorooshian, S. Shuffled Complex Evolution Approach for Effective and Efficient Global Minimization. J. Optim. Theory Appl. 1993, 76, 501–521. [Google Scholar] [CrossRef]
  36. Chaos, M.; Khan, M.; Krishnamoorthy, N.; de Ris, J.; Dorofeev, S. FPA bench-scale flammability tests and extraction of solid fuel properties for fire models. In Proceedings of the 6th International Seminar on Fire and Explosion Hazards (ISFEH6), Leeds, UK, 11–16 April 2011; pp. 995–1007. [Google Scholar]
  37. Chaos, M.; Khan, M.; Krishnamoorthy, N.; De Ris, J.; Dorofeev, S. Bench-scale flammability experiments: Determination of material properties using pyrolysis models for use in CFD fire simulations. In Proceedings of the 12th International Fire Science and Engineering Conference, Interflam2010, Nottingham, UK, 5–7 July 2010; pp. 697–708. [Google Scholar]
  38. Chaos, M.; Khan, M.M.; Krishnamoorthy, N.; de Ris, J.L.; Dorofeev, S.B. Evaluation of optimization schemes and determination of solid fuel properties for CFD fire models using bench-scale pyrolysis tests. Proc. Combust. Inst. 2011, 33, 2599–2606. [Google Scholar] [CrossRef]
  39. Gopalakrishnan, K.; Kim, S. Global Optimization of Pavement Structural Parameters during Back-Calculation Using Hybrid Shuffled Complex Evolution Algorithm. J. Comput. Civil. Eng. 2010, 24, 441–451. [Google Scholar] [CrossRef]
  40. Gomes, R.C.M.; Vitorino, M.A.; Corrêa, M.B.D.; Fernandes, D.A.; Wang, R.X. Shuffled Complex Evolution on Photovoltaic Parameter Extraction: A Comparative Analysis. IEEE Trans. Sustain. Energy 2017, 8, 805–815. [Google Scholar] [CrossRef]
  41. Ding, Y.M.; Fukumoto, K.; Ezekoye, O.A.; Lu, S.X.; Wang, C.J.; Li, C.H. Experimental and numerical simulation of multi-component combustion of typical charring material. Combust. Flame 2020, 211, 417–429. [Google Scholar] [CrossRef]
  42. Luo, F.B.; Wu, K.; Lu, M.G.; Nie, S.B.; Li, X.Y.; Guan, X.X. Thermal degradation and flame retardancy of microencapsulated ammonium polyphosphate in rigid polyurethane foam. J. Therm. Anal. Calorim. 2015, 120, 1327–1335. [Google Scholar] [CrossRef]
  43. Yi, D.Q.; Yang, R.J. Ammonium Polyphosphate/Montmorillonite Nanocompounds in Polypropylene. J. Appl. Polym. Sci. 2010, 118, 834–840. [Google Scholar] [CrossRef]
  44. Huang, Z.; Ruan, B.; Wu, J.; Ma, N.; Jiang, T.; Tsai, F.C. High-efficiency ammonium polyphosphate intumescent encapsulated polypropylene flame retardant. J. Appl. Polym. Sci. 2021, 138, 11. [Google Scholar] [CrossRef]
  45. Samyn, F.; Bourbigot, S.; Duquesne, S.; Delobel, R. Effect of zinc borate on the thermal degradation of ammonium polyphosphate. Thermochim. Acta 2007, 456, 134–144. [Google Scholar] [CrossRef]
  46. Yu, S.W.; Xiao, S.J.; Zhao, Z.W.; Huo, X.W.; Wei, J.F. Microencapsulated ammonium polyphosphate by polyurethane with segment of dipentaerythritol and its application in flame retardant polypropylene. Chin. J. Chem. Eng. 2019, 27, 1735–1743. [Google Scholar] [CrossRef]
  47. Drevelle, C.; Duquesne, S.; Le Bras, M.; Lefebvre, J.; Delobel, R.; Castrovinci, A.; Magniez, C.; Vouters, M. Influence of ammonium polyphosphate on the mechanism of thermal degradation of an acrylic binder resin. J. Appl. Polym. Sci. 2004, 94, 717–729. [Google Scholar] [CrossRef]
  48. He, J.J.; Jiang, L.; Sun, J.H.; Lo, S.M. Thermal degradation study of pure rigid polyurethane in oxidative and non-oxidative atmospheres. J. Anal. Appl. Pyrolysis 2016, 120, 269–283. [Google Scholar] [CrossRef]
Figure 1. Mass loss rate and conversion rate of fireproof sealant at various heating rates: (a) mass loss rate; (b) conversion rate.
Fire 07 00025 g001
Figure 2. Absorption spectra at different temperatures at 10 K/min.
Fire 07 00025 g002
Figure 3. The evolution of main gaseous products at 10 K/min in nitrogen atmosphere.
Fire 07 00025 g003
Figure 4. Comparison of mass loss and mass loss rate of fireproof sealant at 10 K/min in nitrogen and air atmosphere: (a) mass loss; (b) mass loss rate.
Fire 07 00025 g004
Figure 5. The evolution of main gaseous products at 10 K/min in air atmosphere.
Fire 07 00025 g005
Figure 6. Experimental data (symbols) compared to estimated results (lines) based on the initial parameters values: (a) mass loss at 10 K/min; (b) mass loss rate at 10 K/min; (c) mass loss at 20 K/min; (d) mass loss rate at 20 K/min; (e) mass loss at 30 K/min; (f) mass loss rate at 30 K/min; (g) mass loss at 40 K/min; (h) mass loss rate at 40 K/min.
Fire 07 00025 g006aFire 07 00025 g006b
Figure 7. Estimated mass loss and mass loss rate based on the optimized parameters (lines) compared with experimental data (symbols): (a) mass loss at 10 K/min; (b) mass loss rate at 10 K/min; (c) mass loss at 20 K/min; (d) mass loss rate at 20 K/min; (e) mass loss at 30 K/min; (f) mass loss rate at 30 K/min; (g) mass loss at 40 K/min; (h) mass loss rate at 40 K/min.
Fire 07 00025 g007aFire 07 00025 g007b
Figure 8. Estimated mass loss and mass loss rate based on the optimized parameters at 60 K/min: (a) mass loss; (b) mass loss rate.
Fire 07 00025 g008
Table 1. The Ea and lnA values of fireproof sealant based on three model-free methods.
ReactionConversion RateFriedmanKASStarink
EaR2lnAEaR2lnAEaR2lnA
I0.189.640.9718.2173.450.931.7773.760.932.66
0.2160.050.9229.69126.360.9510.80126.660.9511.70
Average124.84 23.9599.91 6.29100.21 7.18
II0.3235.620.9540.29240.700.9228.61240.950.9229.52
0.4188.280.7430.16183.120.9617.26183.440.9618.18
0.5164.210.7923.07183.750.9815.59184.100.9816.51
Average196.03 31.17202.52 20.49202.83 21.40
III0.6177.690.9019.44187.750.919.18188.250.9110.12
0.7171.250.8918.52181.820.918.06182.350.919.00
0.8165.180.8617.57176.650.907.34177.190.908.29
0.9172.010.8917.99172.280.896.90172.840.897.84
Average171.54 18.38179.63 7.87180.15 8.81
Table 2. Parameters optimized by SCE algorithm at multiple heating rates.
ParametersInitial ValuesSearch RangeOptimized Values
YAPP,00.30[0.00, 0.40]0.19
ln(ZAPP)12.47[2.49, 24.94]14.70
Ea,APP108.32[21.64, 216.64]113.47
nAPP1.00[0.00, 5.00]1.09
νAPP0.50[0.00, 1.00]0.11
YMEL,00.30[0.00, 0.40]0.39
ln(ZMEL)24.35[4.87, 48.70]19.52
Ea,MEL200.46[40.09, 400.92]206.35
nMEL1.00[0.00, 5.00]0.62
νMEL0.50[0.00, 1.00]0.23
ln(ZAA)11.69[2.34, 23.38]9.36
Ea,AA171.54[34.31, 343.08]65.68
nAA1.00[0.00, 5.00]1.88
νAA0.50[0.00, 1.00]0.67
Disclaimer/Publisher’s Note: The statements, opinions and data contained in all publications are solely those of the individual author(s) and contributor(s) and not of MDPI and/or the editor(s). MDPI and/or the editor(s) disclaim responsibility for any injury to people or property resulting from any ideas, methods, instructions or products referred to in the content.

