
Quantitative Assessment of the Effect of Agency-Led Prescribed Burns and Cultural Burns on Soil Properties in Southeastern Australia


 ,
,
Abstract
:1. Introduction
2. Material and Methods
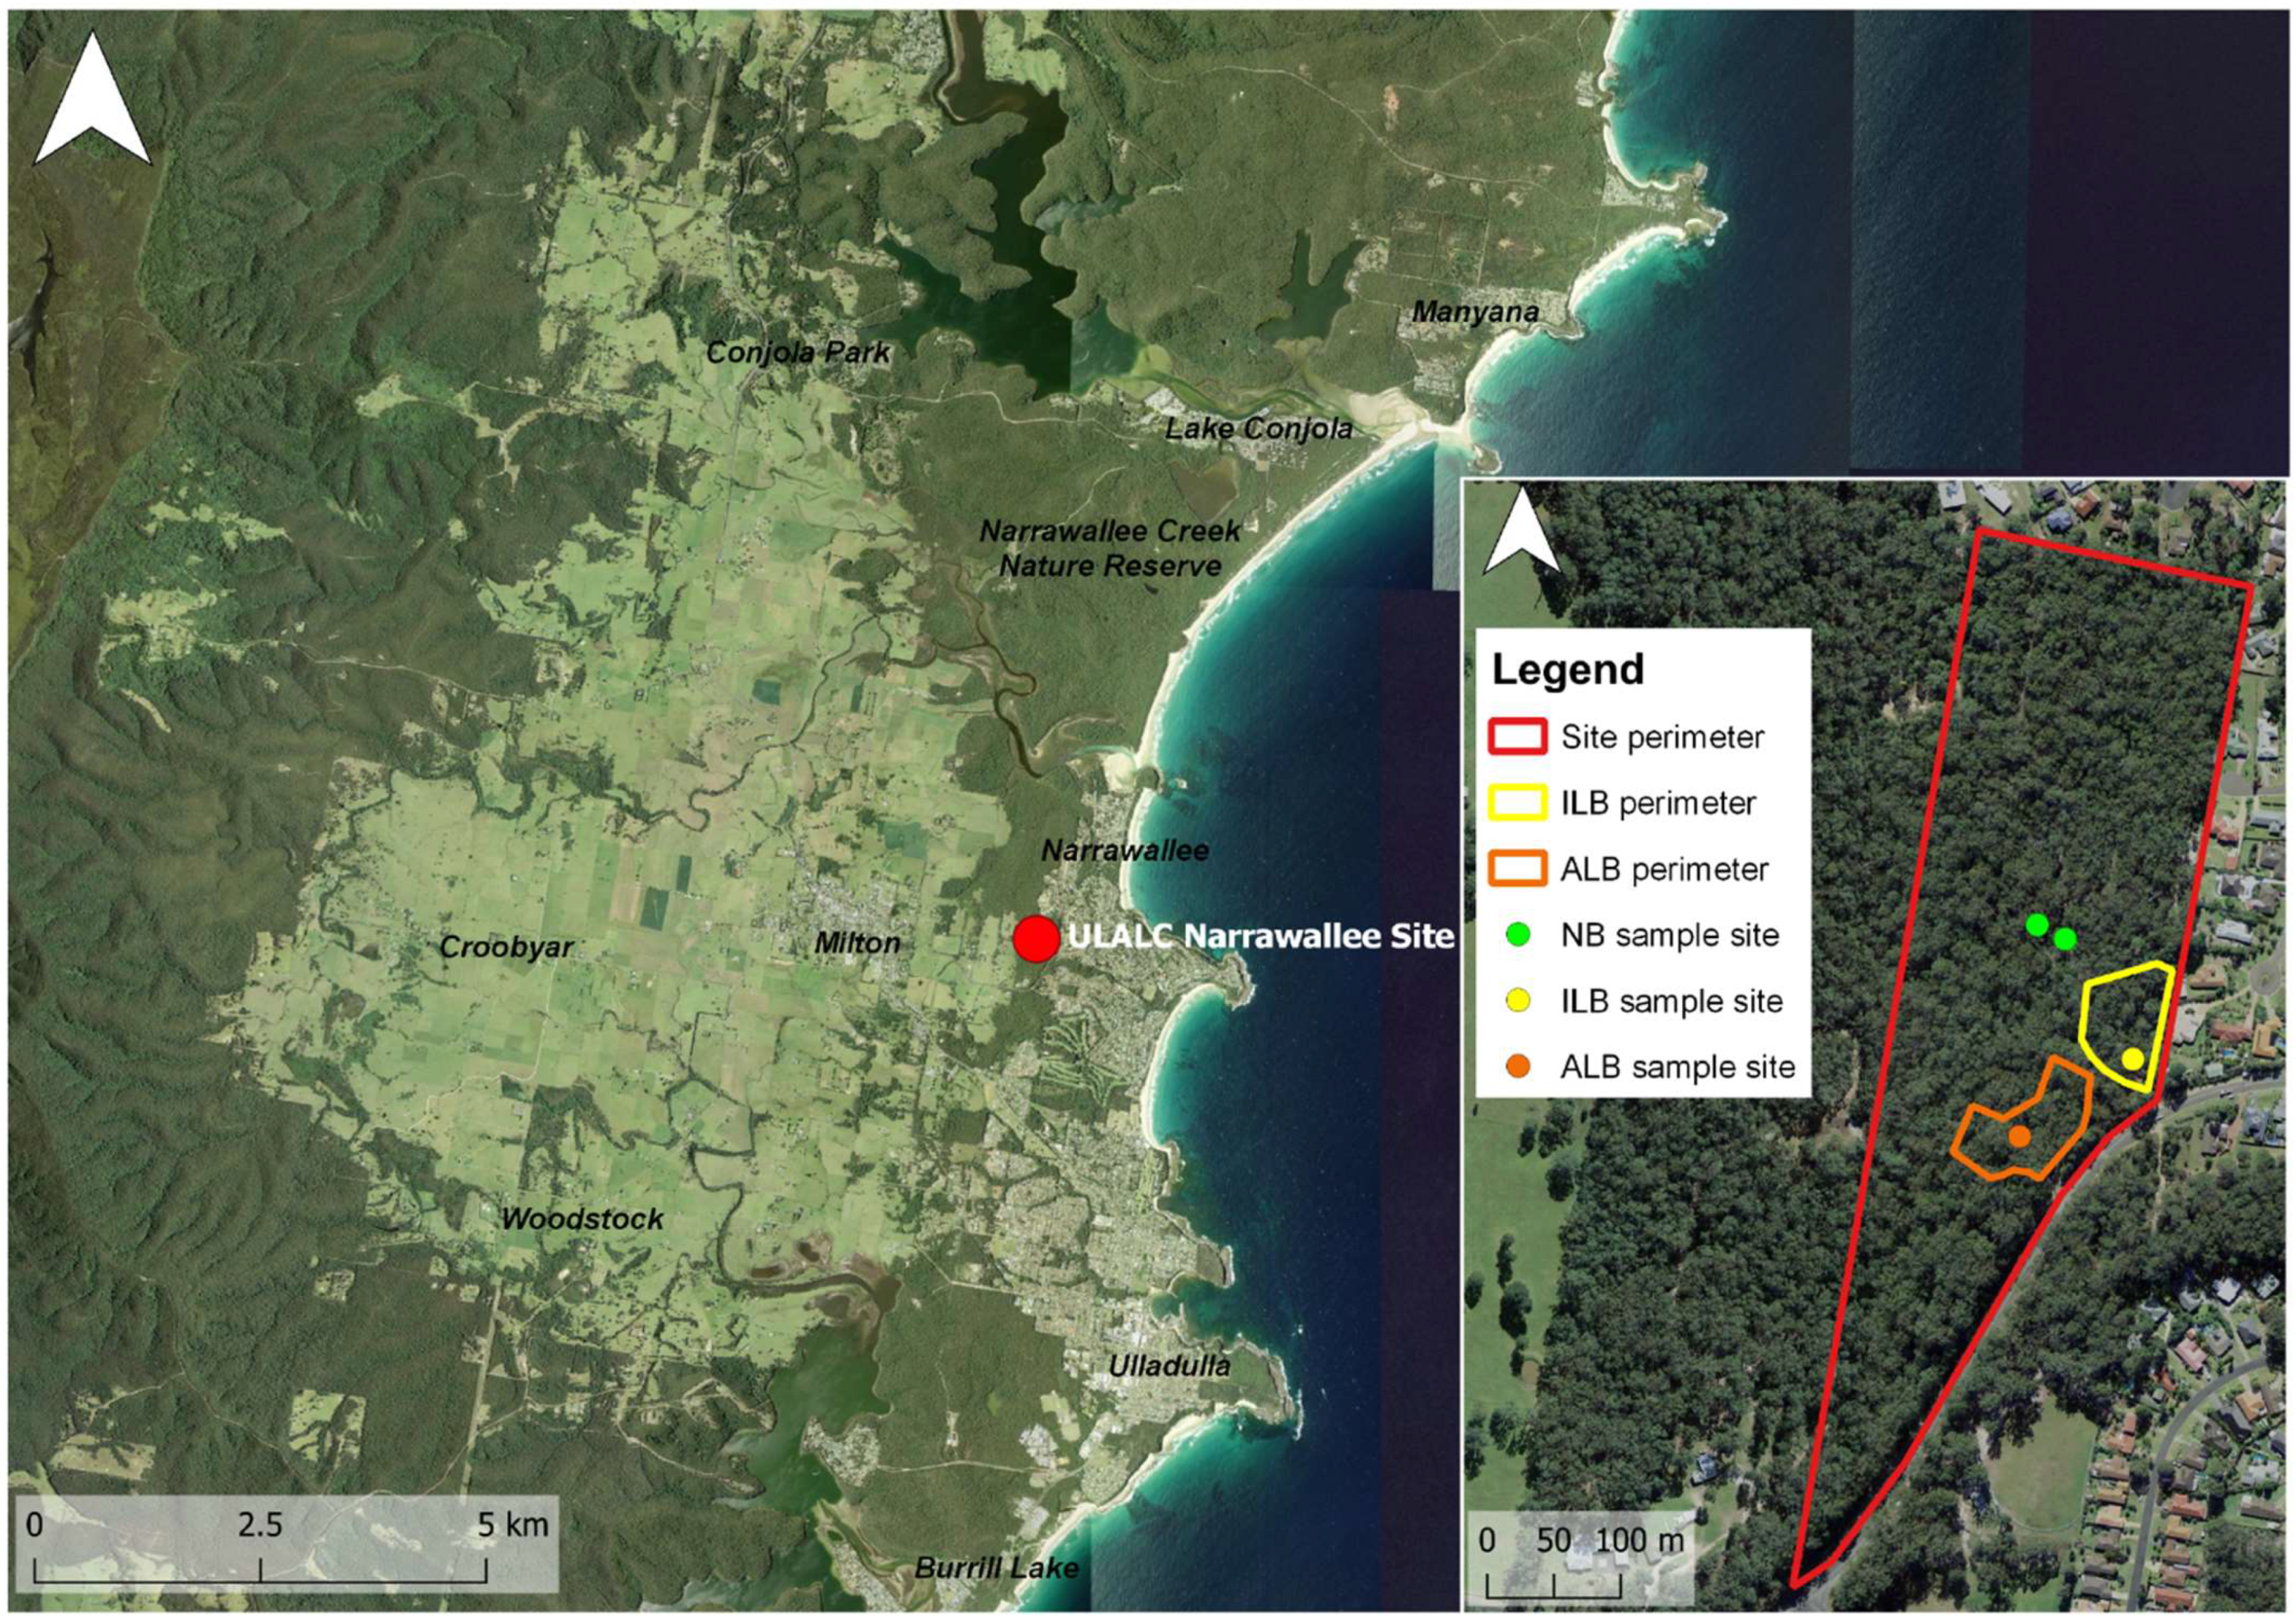
2.1. Study Area
2.2. Experimental Design and Soil Sampling
2.3. Field Measurements
2.4. Laboratory Analysis of Soil Physical and Chemical Properties
2.5. Statistical Analysis
3. Results
4. Discussion
5. Conclusions
Supplementary Materials
Author Contributions
Funding
Institutional Review Board Statement
Informed Consent Statement
Data Availability Statement
Conflicts of Interest
References
- Bradstock, R.A. A biogeographic model of fire regimes in Australia: Current and future implications. Glob. Ecol. Biogeogr. 2010, 19, 145–158. [Google Scholar] [CrossRef]
- Morgan, G.W.; Tolhurst, K.G.; Poynter, M.W.; Cooper, N.; McGuffog, T.; Ryan, R.; Wouters, M.A.; Stephens, N.; Black, P.; Sheehan, D.; et al. Prescribed burning in south-eastern Australia: History and future directions. Aust. For. 2020, 83, 28–32. [Google Scholar] [CrossRef]
- Arias, M.E.; Gonzalez-Perez, J.A.; Gonzalez-Vila, F.J.; Ball, A.S. Soil health–A new challenge for microbiologists and chemists. Int. Microbiol. Off. J. Span. Soc. Microbiol. 2005, 8, 13–21. [Google Scholar]
- Alcañiz, M.; Outeiro, L.; Francos, M.; Farguell, J.; Úbeda, X. Long-term dynamics of soil chemical properties after a prescribed fire in a Mediterranean forest (Montgrí Massif, Catalonia, Spain). Sci. Total Environ. 2016, 572, 1329–1335. [Google Scholar] [CrossRef] [PubMed]
- Alcañiz, M.; Outeiro, L.; Francos, M.; Úbeda, X. Effects of prescribed fires on soil properties: A review. Sci. Total Environ. 2018, 613–614, 944–957. [Google Scholar] [CrossRef] [PubMed]
- Certini, G. Effects of fire on properties of forest soils: A review. Oecologia 2005, 143, 1–10. [Google Scholar] [CrossRef] [PubMed]
- Granged, A.J.; Jordán, A.; Zavala, L.M.; Muñoz-Rojas, M.; Mataix-Solera, J. Short-term effects of experimental fire for a soil under eucalyptus forest (SE Australia). Geoderma 2011, 167–168, 125–134. [Google Scholar] [CrossRef]
- Muqaddas, B.; Zhou, X.; Lewis, T.; Wild, C.; Chen, C. Long-term frequent prescribed fire decreases surface soil carbon and nitrogen pools in a wet sclerophyll forest of Southeast Queensland, Australia. Sci. Total Environ. 2015, 536, 39–47. [Google Scholar] [CrossRef]
- Muñoz-Rojas, M.; Erickson, T.E.; Martini, D.; Dixon, K.W.; Merritt, D.J. Soil physicochemical and microbiological indicators of short, medium and long term post-fire recovery in semi-arid ecosystems. Ecol. Indic. 2016, 63, 14–22. [Google Scholar] [CrossRef]
- Muñoz-Rojas, M.; Lewandrowski, W.; Erickson, T.E.; Dixon, K.W.; Merritt, D.J. Soil respiration dynamics in fire affected semi-arid ecosystems: Effects of vegetation type and environmental factors. Sci. Total Environ. 2016, 572, 1385–1394. [Google Scholar] [CrossRef]
- Malacara, D. Color Vision and Colorimetry: Theory and Applications; SPIE: Bellingham, WA, USA, 2011. [Google Scholar]
- Walker, B. Development of Low-Cost Sensors and Evaluation using High Precision Fourier Transform Infrared Spectroscopy; University of Wollongong: Wollongong, Australia, 2021. [Google Scholar]
- Phillips, R.; Griffith, D.W.; Dijkstra, F.; Lugg, G.; Lawrie, R.; Macdonald, B. Tracking Short-Term Effects of Nitrogen-15 Addition on Nitrous Oxide Fluxes Using Fourier-Transform Infrared Spectroscopy. J. Environ. Qual. 2013, 42, 1327–1340. [Google Scholar] [CrossRef] [PubMed]
- Wessel, A. On using the effective contact angle and the water drop penetration time for classification of water repellency in dune soils. Earth Surf. Process. Landf. 1988, 13, 555–561. [Google Scholar] [CrossRef]
- Rayment, G.; Higginson, F.R. Australian Laboratory Handbook of Soil and Water Chemical Methods; Inkata Press Pty Ltd.: Melbourne, Australia, 1992. [Google Scholar]
- Heiri, O.; Lotter, A.; Lemcke, G. Loss on ignition as a method for estimating organic and carbonate content in sediments: Reproducibility and comparability of results. J. Paleolimnol. 2001, 25, 101–110. [Google Scholar] [CrossRef]
- Donkin, M.J. Loss-on-ignition as an estimator of soil organic carbon in A-horizon forestry soils. Commun. Soil Sci. Plant Anal. 1991, 22, 233–241. [Google Scholar] [CrossRef]
- Allaire, J. RStudio: Integrated Development Environment for R, version 0.96.122; RStudio: Boston, MA, USA, 2012; Volume 770, pp. 165–171. [Google Scholar]
- Bisdom, E.B.A.; Dekker, L.W.; Schoute, J.F.T. Water repellency of sieve fractions from sandy soils and relationships with organic material and soil structure. In Soil Structure/Soil Biota Interrelationships; Brussaard, L., Kooistra, M.J., Eds.; Elsevier: Amsterdam, The Netherlands, 1993; pp. 105–118. [Google Scholar]
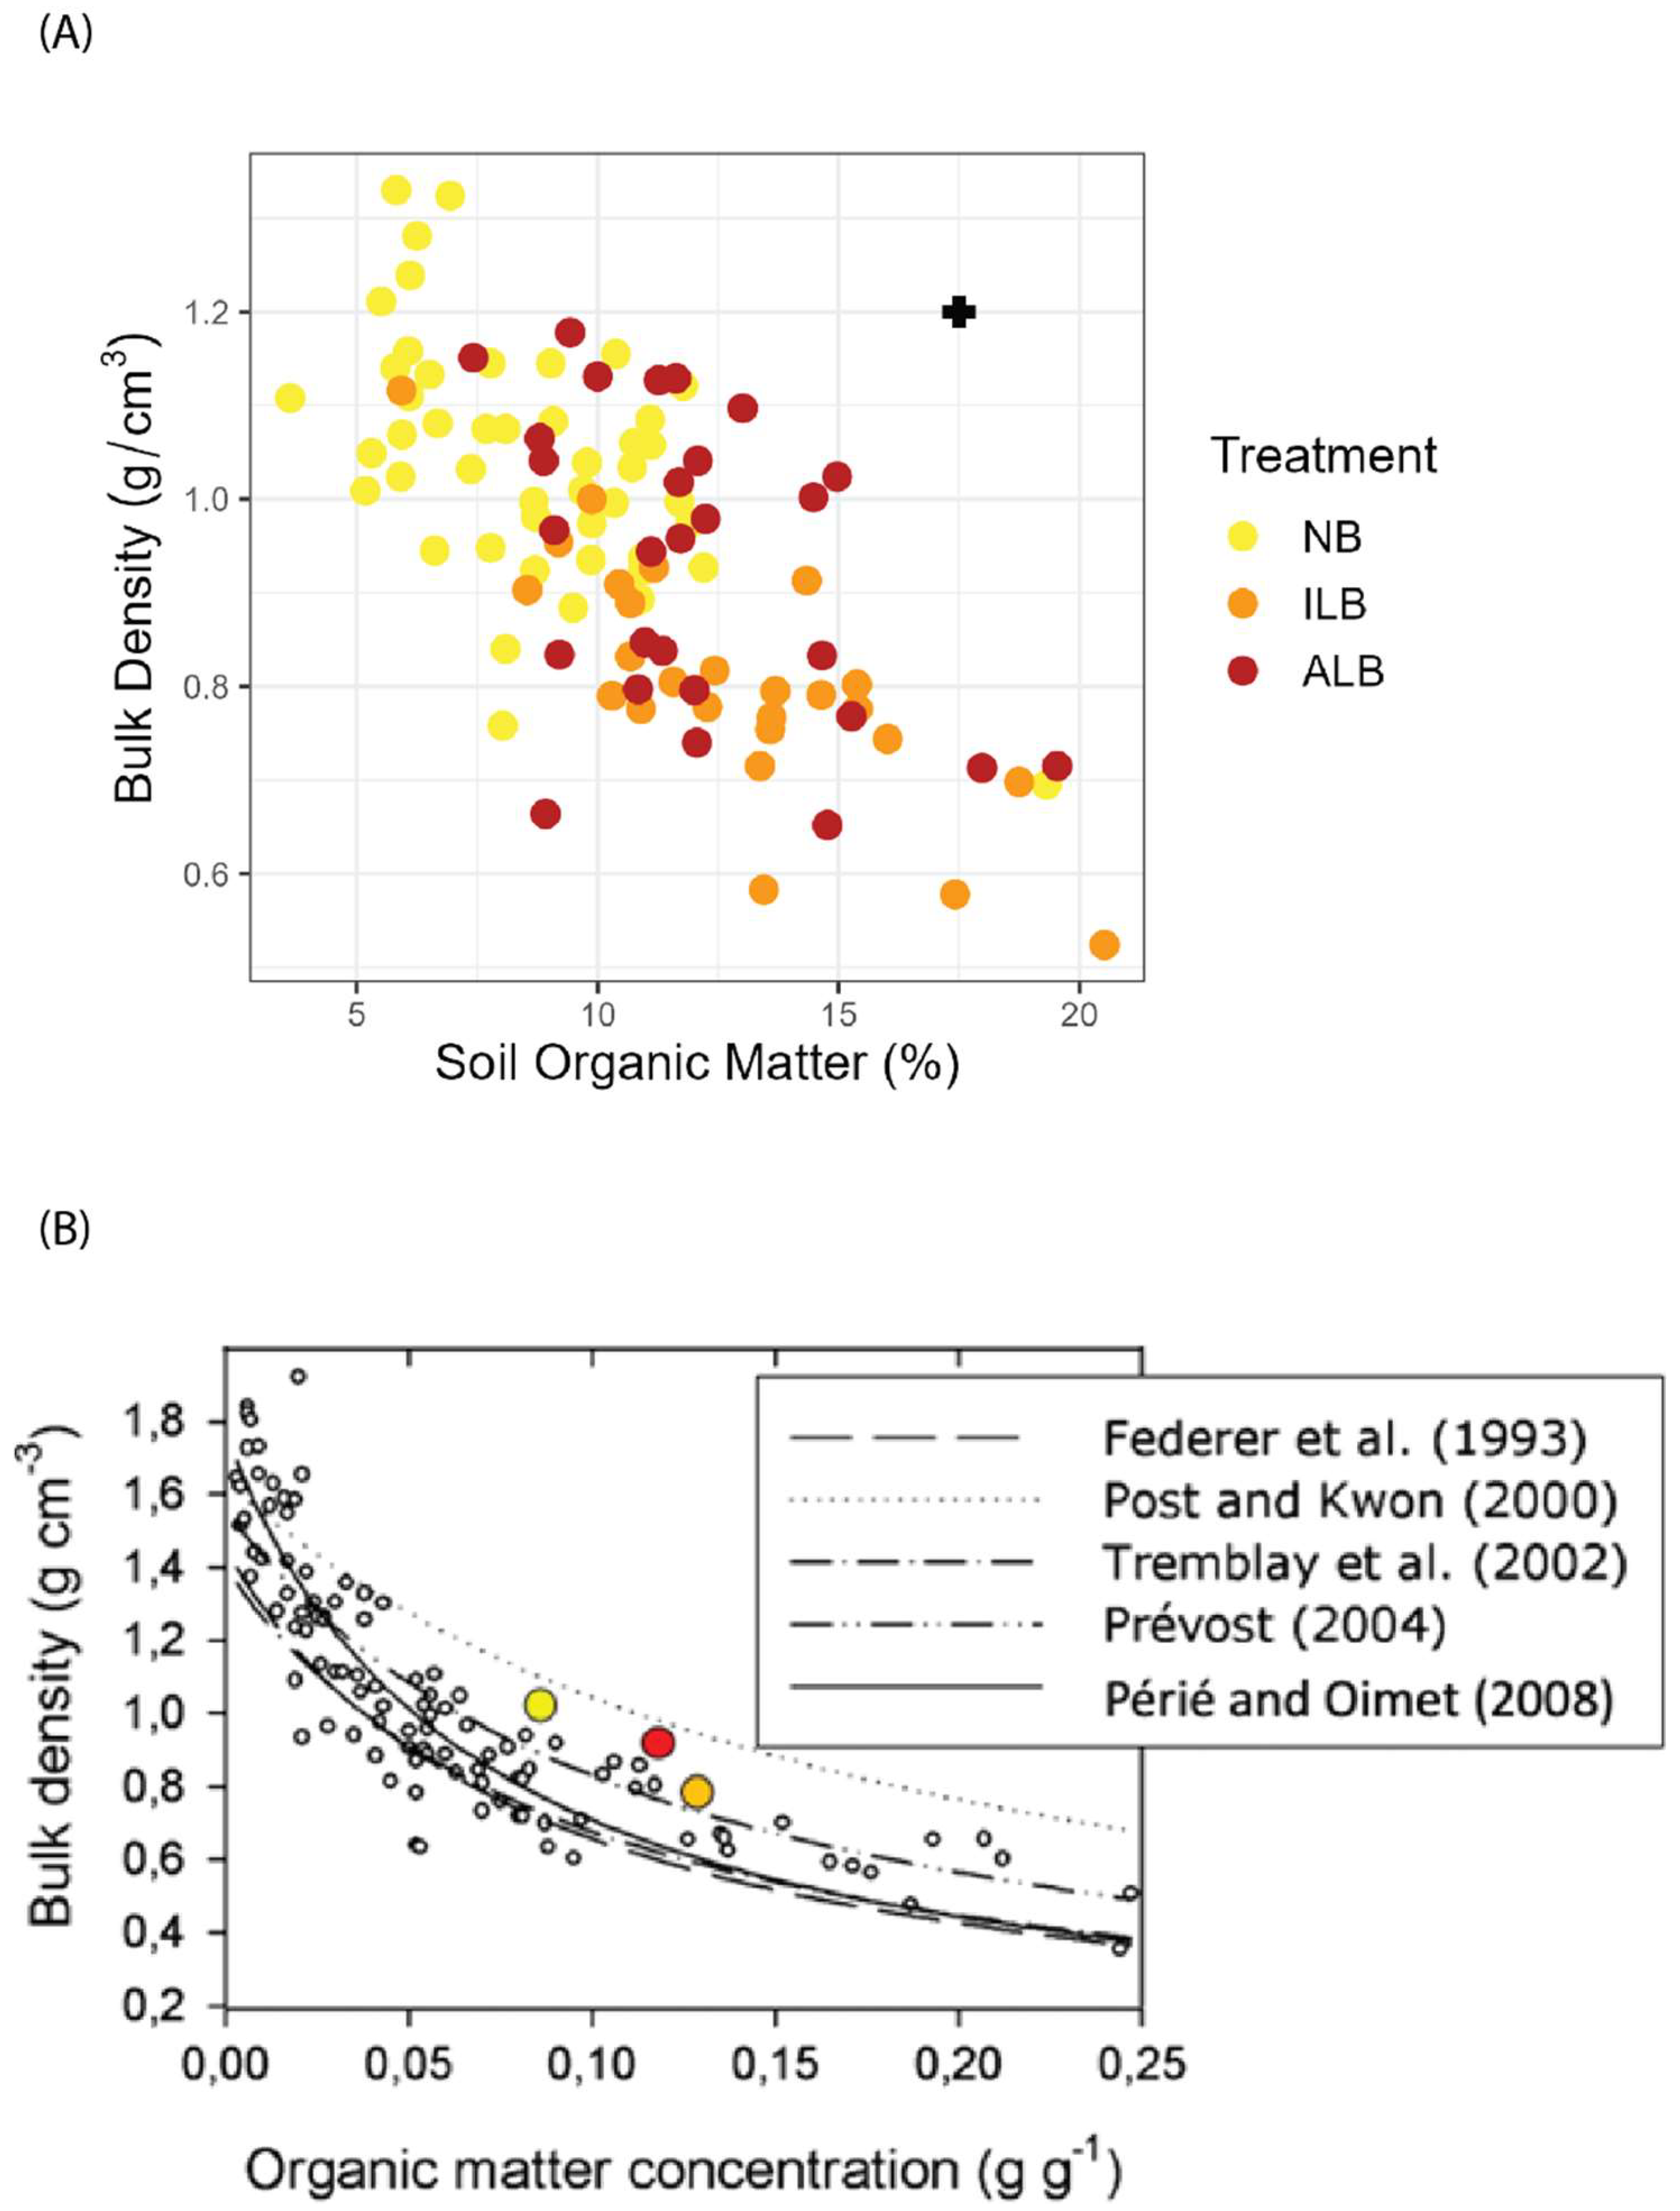
- Périé, C.; Ouimet, R. Organic carbon, organic matter and bulk density relationships in boreal forest soils. Can. J. Soil Sci. 2008, 88, 315–325. [Google Scholar] [CrossRef]
- Brye, K.R. Soil physiochemical changes following 12 years of annual burning in a humid–subtropical tallgrass prairie: A hypothesis. Acta Oecologica 2006, 30, 407–413. [Google Scholar] [CrossRef]
- Lal, R.; Kimble, J. Importance of soil bulk density and methods of its measurement. In Assessment Methods for Soil Carbon; CRC Press: Boca Raton, FL, USA, 2000; pp. 31–44. [Google Scholar]
- Granged, A.J.; Zavala, L.M.; Jordán, A.; Bárcenas-Moreno, G. Post-fire evolution of soil properties and vegetation cover in a Mediterranean heathland after experimental burning: A 3-year study. Geoderma 2011, 164, 85–94. [Google Scholar] [CrossRef]
- Kennard, D.K.; Gholz, H.L. Effects of high- and low-intensity fires on soil properties and plant growth in a Bolivian dry forest. Plant Soil 2001, 234, 119–129. [Google Scholar] [CrossRef]
- Prieto-Fernández, A.; Acea, M.J.; Carballas, T. Soil microbial and extractable C and N after wildfire. Biol. Fertil. Soils 1998, 27, 132–142. [Google Scholar] [CrossRef]
- Doerr, S.H.; Blake, W.H.; Shakesby, R.A.; Stagnitti, F.; Vuurens, S.H.; Humphreys, G.S.; Wallbrink, P. Heating effects on water repellency in Australian eucalypt forest soils and their value in estimating wildfire soil temperatures. Int. J. Wildland Fire 2004, 13, 157–163. [Google Scholar] [CrossRef]
- Doerr, S.; Shakesby, R.; Blake, W.; Chafer, C.; Humphreys, G.; Wallbrink, P. Effects of differing wildfire severities on soil wettability and implications for hydrological response. J. Hydrol. 2006, 319, 295–311. [Google Scholar] [CrossRef]
- USDA-NRCS. Soil Bulk Density/Moisture/Aeration–Soil Quality Kit; USDA: Washington, DC, USA, 2008. [Google Scholar]
- Hubbert, K.R.; Oriol, V. Temporal fluctuations in soil water repellency following wildfire in chaparral steeplands, southern California. Int. J. Wildland Fire 2005, 14, 439–447. [Google Scholar] [CrossRef]
- Terefe, T.; Mariscal-Sancho, I.; Peregrina, F.; Espejo, R. Influence of heating on various properties of six Mediterranean soils. A laboratory study. Geoderma 2008, 143, 273–280. [Google Scholar] [CrossRef]
- Jensen, M.; Michelsen, A.; Gashaw, M. Responses in plant, soil inorganic and microbial nutrient pools to experimental fire, ash and biomass addition in a woodland savanna. Oecologia 2001, 128, 85–93. [Google Scholar] [CrossRef]
- Mills, A.J.; Fey, M.V. Frequent fires intensify soil crusting: Physicochemical feedback in the pedoderm of long-term burn experiments in South Africa. Geoderma 2004, 121, 45–64. [Google Scholar] [CrossRef]
- Livesley, S.J.; Grover, S.; Hutley, L.B.; Jamali, H.; Butterbach-Bahl, K.; Fest, B.; Beringer, J.; Arndt, S.K. Seasonal variation and fire effects on CH4, N2O and CO2 exchange in savanna soils of northern Australia. Agric. For. Meteorol. 2011, 151, 1440–1452. [Google Scholar] [CrossRef]
- Hu, T.; Zhao, B.; Li, F.; Dou, X.; Hu, H.; Sun, L. Effects of fire on soil respiration and its components in a Dahurian larch (Larix gmelinii) forest in northeast China: Implications for forest ecosystem carbon cycling. Geoderma 2021, 402, 115273. [Google Scholar] [CrossRef]
- Serna-Chavez, H.M.; Fierer, N.; van Bodegom, P.M. Global drivers and patterns of microbial abundance in soil. Glob. Ecol. Biogeogr. 2013, 22, 1162–1172. [Google Scholar] [CrossRef]
- Yan, N.; Marschner, P.; Cao, W.; Zuo, C.; Qin, W. Influence of salinity and water content on soil microorganisms. Int. Soil Water Conserv. Res. 2015, 3, 316–323. [Google Scholar] [CrossRef]
- Burton, J.; Chen, C.; Xu, Z.; Ghadiri, H. Soil microbial biomass, activity and community composition in adjacent native and plantation forests of subtropical Australia. J. Soils Sediments 2010, 10, 1267–1277. [Google Scholar] [CrossRef]


| NB | ILB | ALB | Sample Size | F Value | p-Value | |
|---|---|---|---|---|---|---|
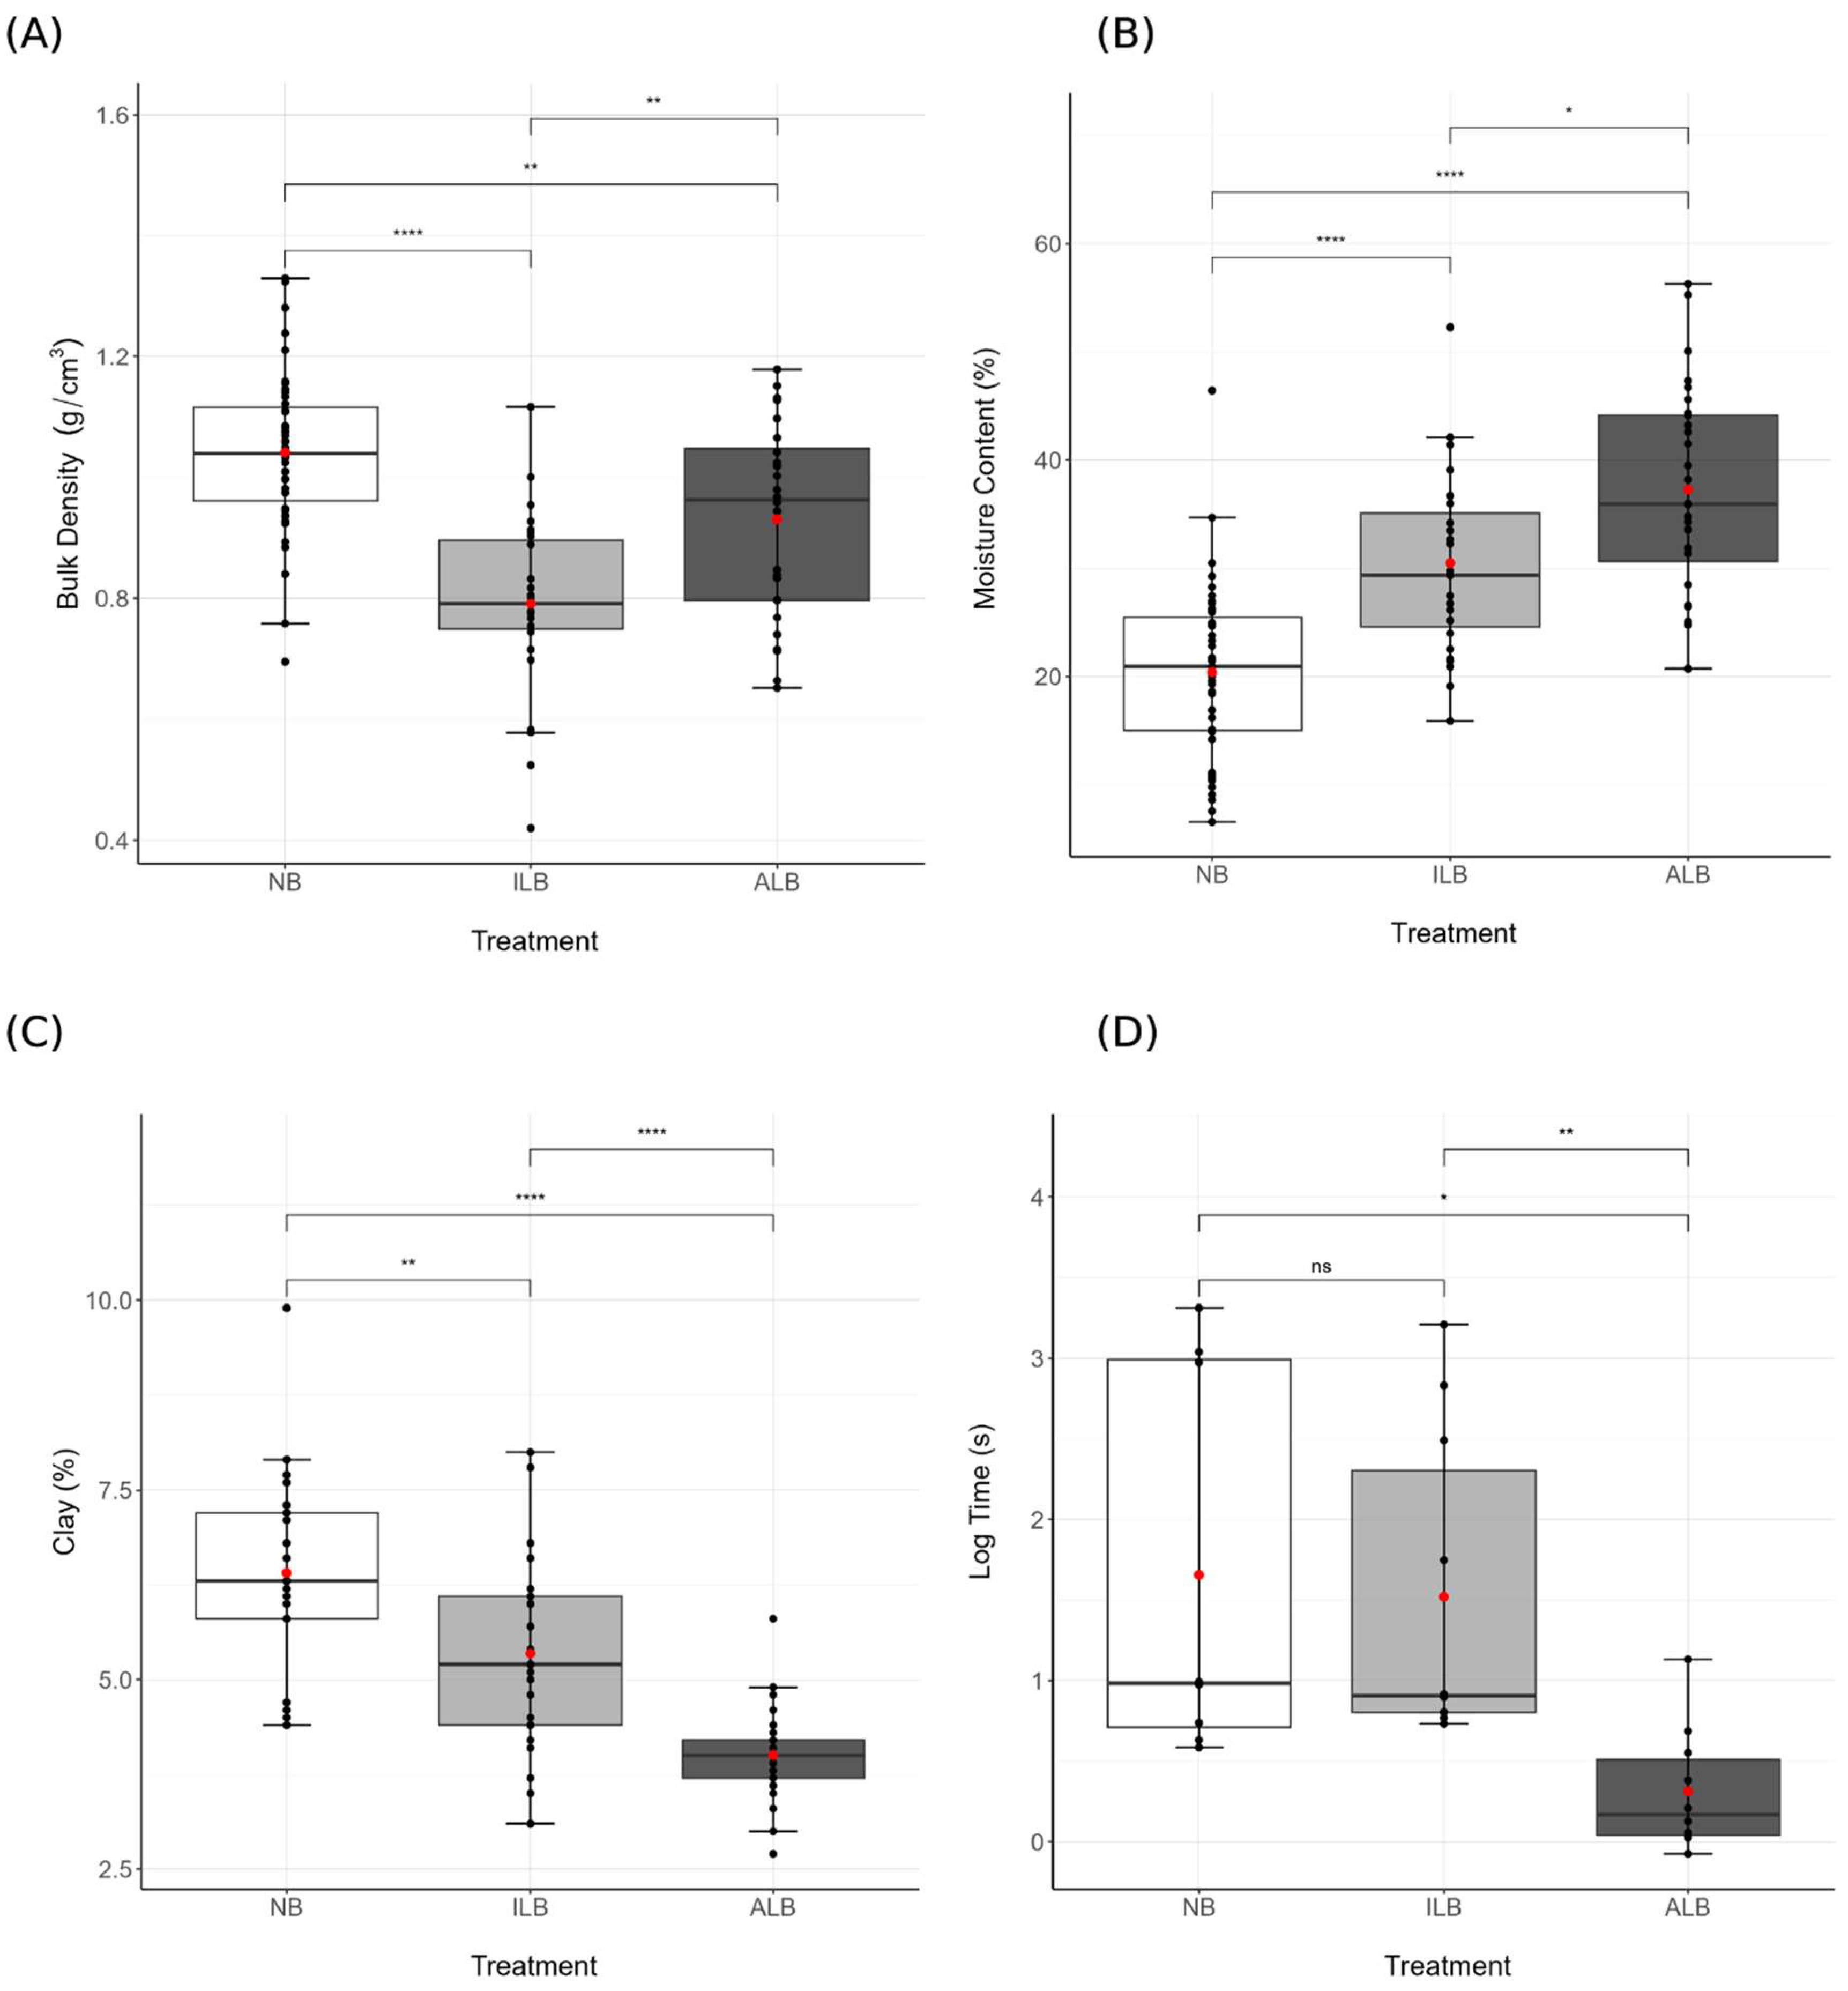
| Moisture content (%) | 20.4 ± 1.1 a | 30.5 ± 1.7 b | 37.3 ± 1.8 c | n = 100 | 34.895 | 3.39 × 10⁻¹² |
| Bulk density (g.cm−3) | 1.04 ± 0.02 c | 0.79 ± 0.03 a | 0.93 ± 0.03 b | n = 100 | 26.214 | 7.308 × 10⁻¹⁰ |
| Sand (%) | 62.3 ± 1.0 a | 62.0 ± 1.0 a | 63.5 ± 1.6 a | n = 73 | 0.5735 | 0.5661 |
| Silt (%) | 31.3 ± 0.8 a | 32.7 ± 0.8 a | 32.5 ± 1.1 a | n = 73 | 0.665 | 0.5174 |
| Clay (%) | 6.4 ± 0.3 a | 5.3 ± 0.2 b | 4.0 ± 0.1 c | n = 73 | 29.849 | 3.623 × 10⁻¹⁰ |
| WDPT (s) | 516 ± 255 b | 270 ± 156 b | 3 ± 1 a | n = 26 | 6.4589 | 0.005479 |
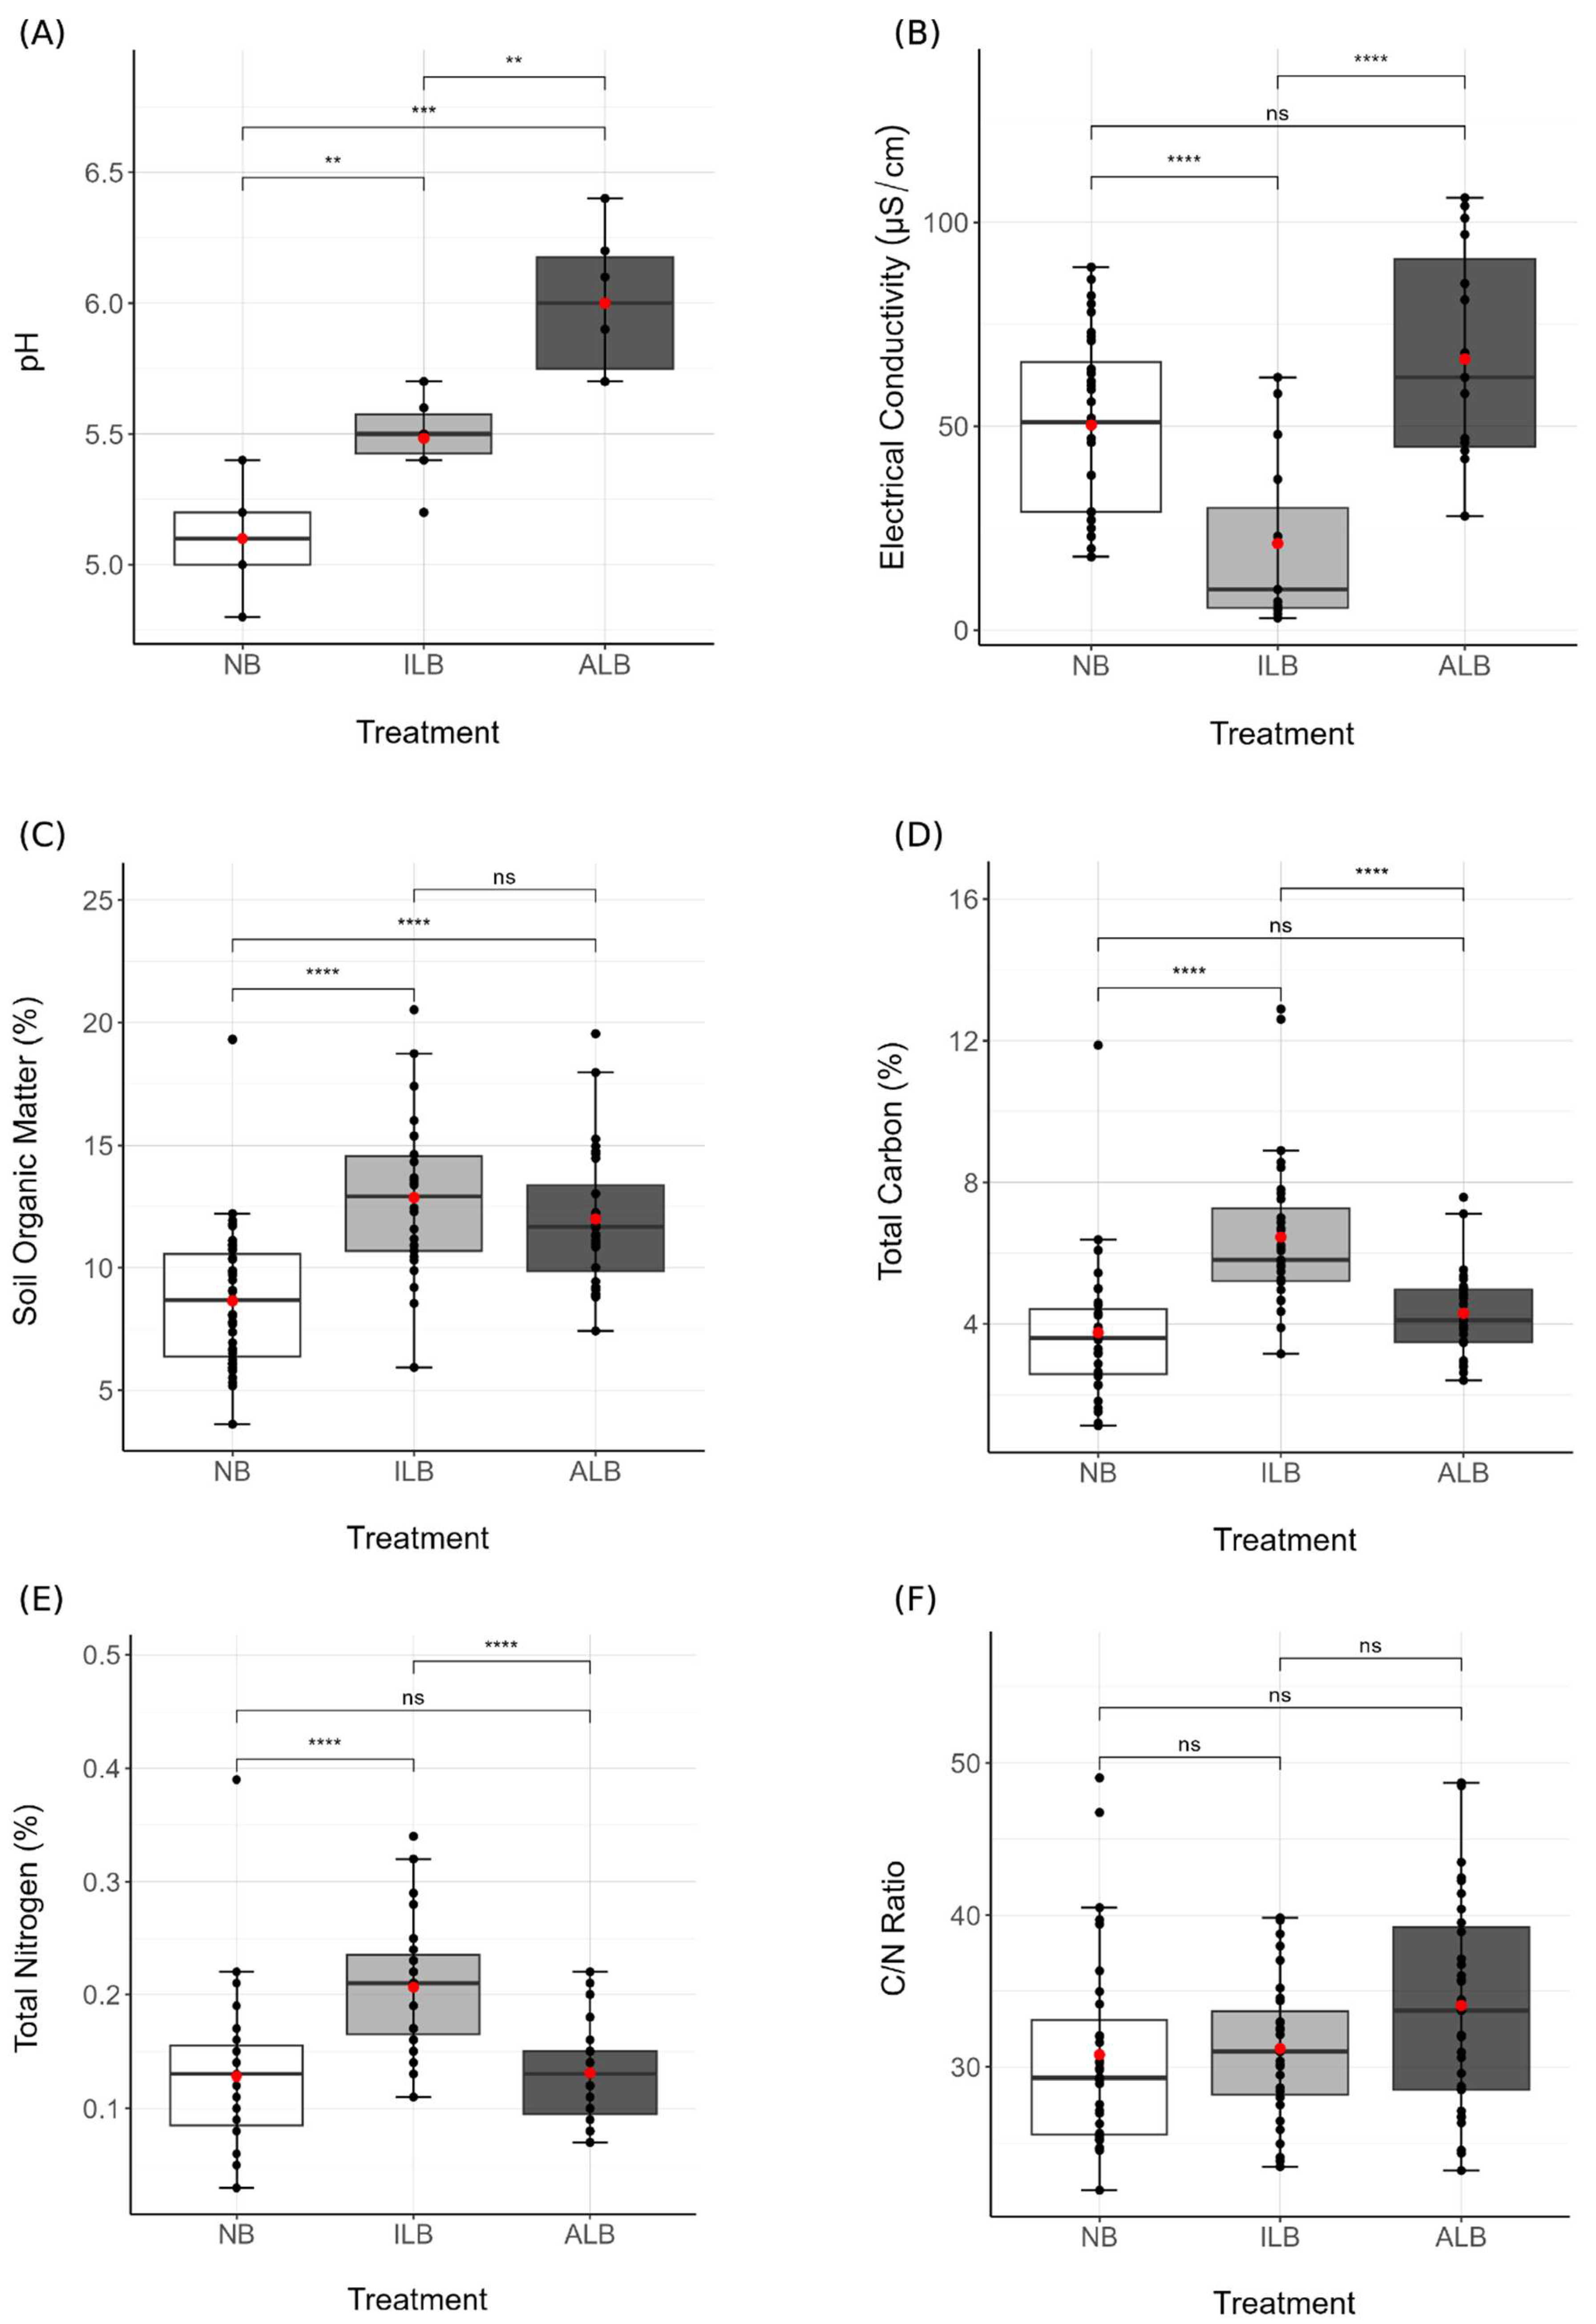
| pH | 5.1 ± 0.1 a | 5.5 ± 0.1 b | 6.0 ± 0.1 c | n = 20 | 36.715 | 2.971 × 10⁻⁷ |
| EC (µS.cm−1) | 50 ± 3 b | 21 ± 5 a | 66 ± 7 b | n = 68 | 25.863 | 4.744 × 10⁻⁹ |
| Organic matter (wt%) | 8.6 ± 0.4 a | 12.9 ± 0.6 b | 12.0 ± 0.5 b | n = 100 | 23.797 | 3.768 × 10⁻⁹ |
| C (wt%) | 3.8 ± 0.4 a | 6.5 ± 0.4 b | 4.3 ± 0.4 a | n = 91 | 21.489 | 2.349 × 10⁻⁸ |
| N (wt%) | 0.13 ± 0.01 a | 0.21 ± 0.02 b | 0.13 ± 0.01 a | n = 91 | 18.701 | 1.614 × 10⁻⁷ |
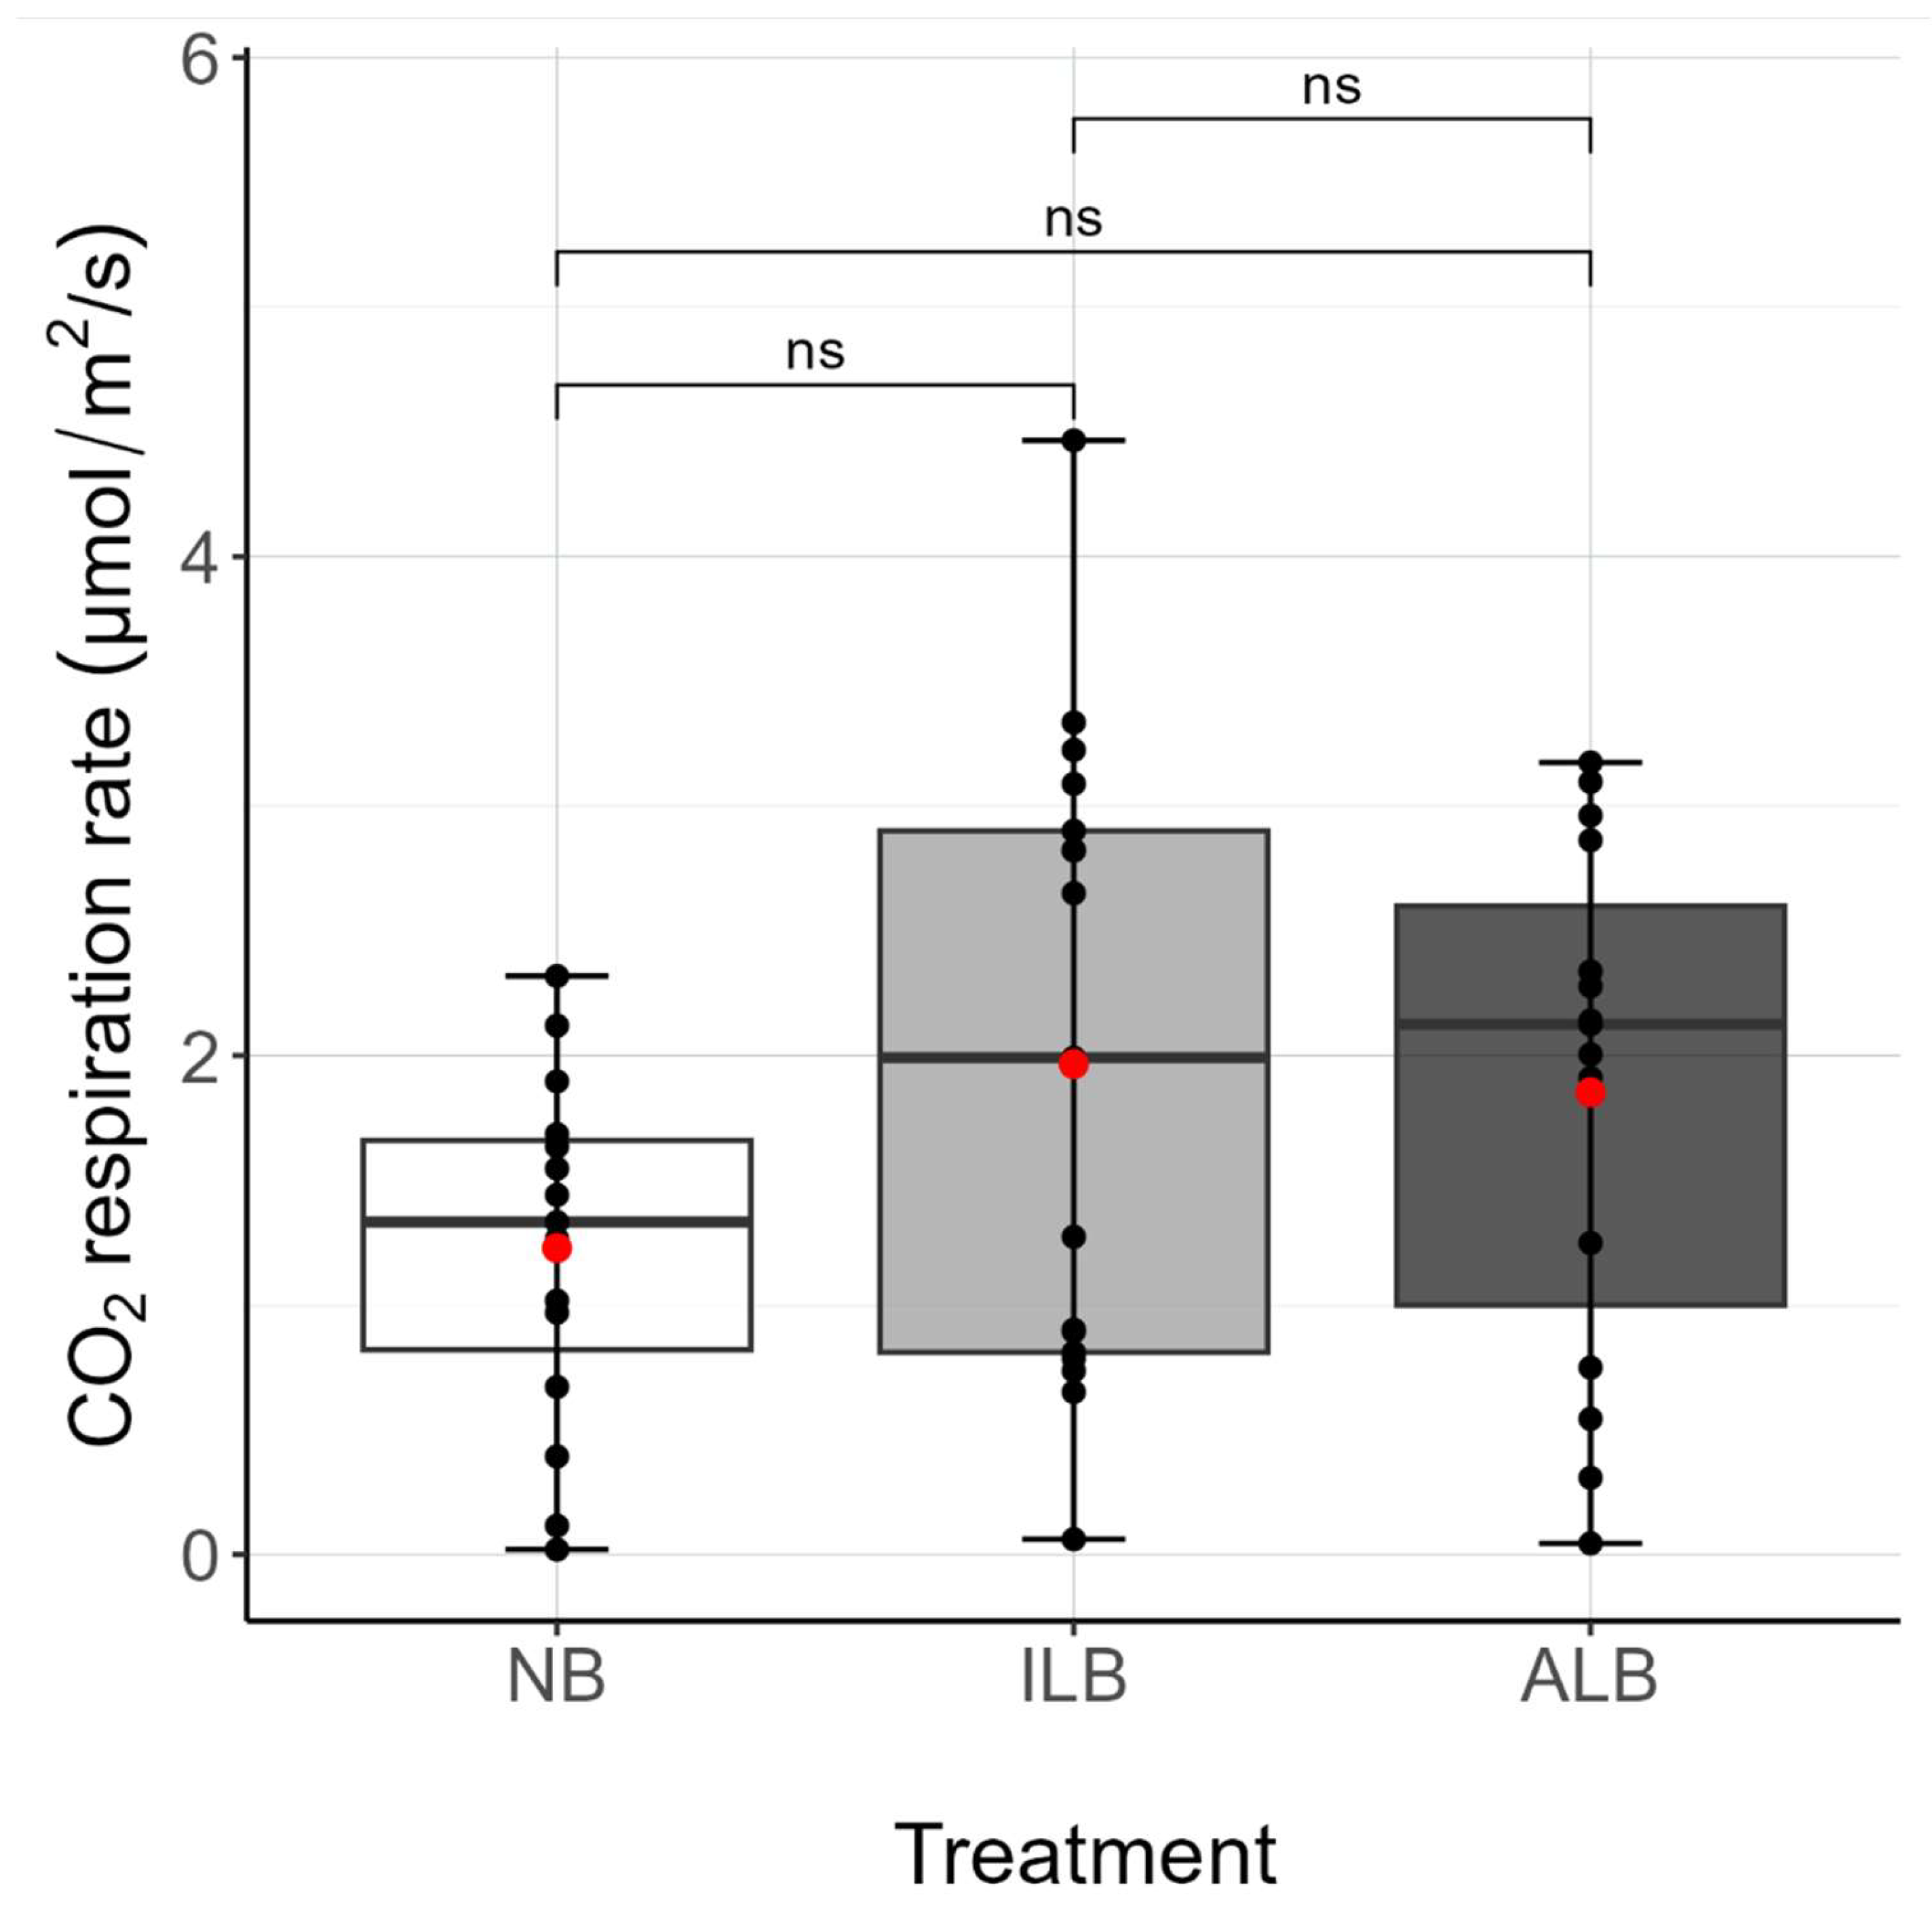
| CO2 respiration rate (mol.cm−2.s−1) | 1.23 ± 0.17 a | 1.97 ± 0.30 a | 1.85 ± 0.26 a | n = 47 | 2.236 | 0.1189 |
Disclaimer/Publisher’s Note: The statements, opinions and data contained in all publications are solely those of the individual author(s) and contributor(s) and not of MDPI and/or the editor(s). MDPI and/or the editor(s) disclaim responsibility for any injury to people or property resulting from any ideas, methods, instructions or products referred to in the content. |
© 2024 by the authors. Licensee MDPI, Basel, Switzerland. This article is an open access article distributed under the terms and conditions of the Creative Commons Attribution (CC BY) license (https://creativecommons.org/licenses/by/4.0/).
Share and Cite
Murramarang Country; Davis, J.; Simmons, J.; Snelson, S.; Channell, V.; Haynes, K.; Deutscher, N.; Brook, L.; Dosseto, A. Quantitative Assessment of the Effect of Agency-Led Prescribed Burns and Cultural Burns on Soil Properties in Southeastern Australia. Fire 2024, 7, 75. https://doi.org/10.3390/fire7030075
Murramarang Country, Davis J, Simmons J, Snelson S, Channell V, Haynes K, Deutscher N, Brook L, Dosseto A. Quantitative Assessment of the Effect of Agency-Led Prescribed Burns and Cultural Burns on Soil Properties in Southeastern Australia. Fire. 2024; 7(3):75. https://doi.org/10.3390/fire7030075
Chicago/Turabian StyleMurramarang Country, Jessica Davis, Jack Simmons, Shane Snelson, Victor Channell, Katharine Haynes, Nicholas Deutscher, Leanne Brook, and Anthony Dosseto. 2024. "Quantitative Assessment of the Effect of Agency-Led Prescribed Burns and Cultural Burns on Soil Properties in Southeastern Australia" Fire 7, no. 3: 75. https://doi.org/10.3390/fire7030075