
Evaluating the Ceiling Gas Temperature in a Branched Tunnel Fire with a Sloped Mainline Region under Natural Ventilation

1
College of Safety Engineering, Chongqing University of Science and Technology, Chongqing 401331, China
2
State Key Laboratory of Fire Science, University of Science and Technology of China, Hefei 230026, China
*
Author to whom correspondence should be addressed.
Fire 2024, 7(5), 152; https://doi.org/10.3390/fire7050152
Submission received: 11 March 2024
/
Revised: 18 April 2024
/
Accepted: 22 April 2024
/
Published: 24 April 2024
(This article belongs to the Special Issue Advance in Tunnel Fire Research)
Abstract
:The effect of the mainline slope on the ceiling temperature profile in a branched tunnel has not been clarified nor included in existing models. Thus, in this paper, the numerical code was employed to investigate the induced airflow velocity and gas temperature beneath the ceiling in a branch tunnel with a sloped upstream mainline. The mainline slope varied from 1% to 7%, with an interval of 1%. Five fire power of 3 MW, 5 MW, 10 MW, 15 MW, and 20 MW are employed on each slope. The airflow velocity and the longitudinal temperature in the mainline tunnel are measured and analyzed. Results show that the stack effect obviously occurred, which caused longitudinal velocity to prevent the smoke reverse flow in the mainline. The induced airflow velocity in the upstream inclined mainline is higher with increasing slope, and the dimensionless velocity is normalized well by the proposed expression. The maximum ceiling temperature is independent of the mainline slope and correlated well by Q*2/3, but the effect of the mainline slope on temperature longitudinal decay is worth considering. Finally, a normalized expression for longitudinal temperature decay in an inclined mainline is proposed by taking the fire power and mainline slope into account.
1. Introduction
The urban tunnel has been constructed and rapidly developed to relieve the traffic pressure in large and middle-sized cities [1]. The development of urban tunnels could raise the frequency of fire accidents due to the complex road conditions and huge traffic volume. The consequence of fire in urban tunnels would cause serious casualties and facility damage [2,3,4] because of personnel in densely populated places and traffic loads [5]. Moreover, the urban tunnel always connects to a ground transportation system or underground garage, which results in more complex structures, including multi-slope and bifurcation [6,7]. The stack effect combined with multiple pathways of airflow eventuates the different smoke propagation and temperature distribution from that in an ordinary single tunnel fire, which is more complicated and difficult to control [8,9,10]. Therefore, it is very necessary to clarify the tunnel fire characteristics in this urban tunnel.
The smoke temperature in tunnel fires as an important and fundamental parameter has received much attention [9]. The well-known predicted model for maximum smoke temperature beneath the tunnel ceiling in a natural tunnel fire was developed by Alpert [11,12] on the basis of the ceiling jet theory. For longitudinally ventilated tunnel fire, Kurioka et al. [13] used the non-dimensional heat release rate and Frond number to correlate the maximum temperature and established a piecewise function for the maximum ceiling temperature. Hu et al. [14] found that the predictions made by this formula agreed well with full-scale experimental data. However, the calculated value is a great deviation from actual results under low ventilation velocity or natural ventilation, which shows inapplicable circumstances. Li et al. [15] used non-dimensional velocity to distinguish the effect of longitudinal ventilation velocity on maximum temperature and developed an empirical model given as Equation (1).
where △Tmax is the maximum ceiling temperature rise in K, Q is the heat release rate in kW, v is the ventilation velocity in m/s, r is the radius of the fire source in m, Hef is the effective tunnel height in m, U’ is the non-dimensional ventilation velocity, w* is the characteristic plume velocity in m/s, and g is the gravitational acceleration in m/s2; ρa is the ambient density in kg/m3, cp is the specific heat of air kJ/kg·K, and Ta is the ambient temperature in K.
The smoke temperature beneath the tunnel ceiling is influenced by many factors, such as the ventilation method [16], ventilation velocity [17], side wall effect [18,19], blockage effect [20,21], sealing tunnel portal [22,23,24,25], vertical shaft [26,27,28] and tunnel slope [29,30,31]. In practical engineering, the tunnel usually includes different slopes. In these tilted tunnel fires, the stack effect induced by thermal buoyancy force would affect the smoke movement and temperature distribution beneath the tunnel ceiling. Hu et al. [32] claimed that the previous model overestimates the maximum temperature in the tilted tunnel fire, and proposed a sloped coefficient to modify the model of Equation (1). For the combination effect of stack effect and ambient pressure, Ji et al. [33] numerically studied the temperature distribution in the inclined tunnel under varied ambient pressure. Zhang et al. [31] numerically studied the maximum temperature in tunnels with different cross-sections which influenced the heat loss. Han et al. [34] proposed an empirical model for maximum ceiling temperature in inclined tunnels with one closed end that the stack effect was frustrated.
From the above studies, the smoke temperature in a tilted tunnel is quite different from that in an ordinary horizontal tunnel, as the pressure difference induced by the stack effect and the inclination angle are important factors that affect the stack effect intensity. The previous study on maximum temperature in tilted tunnels mainly focused on ordinary single-line tunnel fires. The fire behavior in the bifurcated tunnel is more complicated [35]. However, the temperature distribution in a bifurcated tunnel combined with the effect of the mainline slope has rarely been investigated. The smoke divergence flow in the branched tunnel would weaken the maximum temperature [36], the bifurcation angle is a key parameter for temperature distribution [37]. Lei et al. experimentally investigated the maximum temperature in the branched tunnel with bifurcation angles 45° [38] and 90° [39], the maximum temperature is a nonlinear variation with different bifurcation angle due to accumulation of high-temperature smoke and divergence flow in the ramp. The fire source’s longitudinal location in the mainline [38] and transverse position at the joint node [40,41] would affect the smoke entering to ramp due to the initial momentum and buoyancy along the ramp direction change that caused the lower maximum temperature. The curved ramp is always used to connect the mainline with other transportation systems the interchange area is usually constructed with curved and sloped ramps. Liang et al. [42] and Cheng et al. [43] suggested that the horizontally curved part of the T-shape tunnel induced higher temperatures. For branched tunnels with slope, the previous research mainly focused on the tilted ramp with the horizontal mainline tunnel (Chen et al., 2020) [39] and the inclined connected area of the metro tunnel [9]. For the inclined mainline of a branched tunnel, Huang et al. [44] numerically studied the smoke backlayering length under the uphill mainline region. They found that the temperature in a branched tunnel is influenced by its own slope condition. However, the research on smoke temperature in a branched tunnel with an inclined mainline is scarce, and there is no existing prediction model. The mainline tunnel slope will influence the divergence flow ratio from entry to the ramp, and smoke accumulated in the mainline results in a variation of the maximum temperature. Hence, it is necessary to clarify the smoke characteristic in a branched tunnel with different types of inclined mainline.
In view of this, the present paper carried out a series of numerical tests in which the mainline slopes and heat release rate were varied. The temperature profile and smoke propagation characteristics were recorded and then analyzed. Based on the numerical results and theoretical analysis, the predicted model for induced airflow velocity and gas temperature rise in the mainline tunnel was tried to develop.
2. Theoretical Analysis
Figure 1 shows the schematic of smoke propagation in a branched tunnel with a titled mainline before shunting. The stack effect will be induced in the mainline tunnel. One part of the smoke enters the ramp, and the divergence flow ratio is influenced by the bifurcation angle. The pressure difference induced by the stack effect is given as ΔPstack = ΔρgH, where ΔPstack is the stack pressure difference in Pa, Δρ is the density difference in kg/m3, and H is the height in m. Under the circumstances, the stack pressure is only induced at the upstream mainline before shunting. Thus, the stack pressure in the upstream region is expressed as follows:
where lu is the smoke back-layering length upstream in m, β is the tunnel slope angle in degree, and h and L are the height difference and length between the inclined mainline two ends in m.
At upstream, the longitudinal temperature decays exponentially [20], given as follows:
where ΔT is the longitudinal temperature rise in K, and Ku is the temperature exponential decay coefficient. Substituted Equation (4) into Equation (3) and integrals as follows:
In a branched tunnel under natural ventilation, the longitudinal airflow velocity with an inclined mainline before shunting includes airflow induced by buoyancy and airflow induced by asymmetric air entrainment between the fire source’s two sides at different cross-sections. The total pressure induced by buoyancy includes the density difference between the smoke layer and fresh air in horizontal condition Δρgd and the pressure difference ΔPstack,u induced by the stack effect between smoke stagnation and joint node. Thus, the pressure difference induced by buoyancy is given as follows:
Thus, the induced airflow velocity in a sloped tunnel due to buoyancy can be given as follows:
where d is the thickness of the smoke layer in m and vbuo is the airflow velocity induced by buoyancy in m/s.
In a naturally horizontal tunnel, the air entrainment is proportional to the local gas velocity [45]. The smoke velocity would be influenced by the bifurcation angle due to the different divergence ratios between the ramp and mainline. The airflow velocity induced by asymmetric movement between the fire source’s two sides is expressed as follows:
where ρsmoke is the density of the smoke layer in kg/m2, ve is the induced velocity in m/s, and Pa, Pb, and Pc are the kinetic energy in mainline before shunting, mainline after shunting, and ramp in Pa, respectively; ΔPe is the pressure difference induced by asymmetric entrainment in Pa. The kinetic energy in the tunnel could be expressed as follows:
where Pi is the dynamic pressure of smoke movement in different tunnel regions in Pa, and ui is the smoke movement velocity in a tunnel in m/s.
After the vertical plume impinges on the ceiling, one part of the kinetic energy converts to negligible thermal energy, and another one converts to initial kinetic energy to drive smoke movement longitudinally. The maximum vertical plume velocity beneath the ceiling is given by [12], expressed as Equation (10). The horizontal velocity of smoke movement in a naturally tunnel can be given as Equation (11) on the basis of conservation of momentum [46,47] and the hypothesis of average smoke layer velocity is equal to 50% of its maximum value.
where H is the tunnel height in m, kr is the coefficient induced by the branched structure, λ is the friction coefficient, and Ds is the hydraulic diameter of the smoke layer in m. From ideal gas law with density and temperature, the dynamic pressure in each tunnel region induced by smoke movement is given as follows:
Substituted Equation (4) into Equation (12), obtained as follows:
where li is the length of the relative tunnel region in m.
From the above analysis, the induced flow velocity due to asymmetric entrainment can be simplified as follows:
Defined the pressure difference from portal A to portal B is positive, if Pa > Pb + Pccosθ, ve is a positive value in the same direction as vbuo, otherwise ve is negative.
According to the previous study in single-line tunnels [13] and branched tunnels [36], the maximum temperature relates to Qef*2/3, and kr relates to sinθ. Therefore, the ventilation velocity in the branched tunnel with an inclined mainline before shunting can be given as follows:
Further, the right-hand side of the expression of induced velocity is normalized using w*, and the left-hand side of the expression is normalized using (gH)1/2. The dimensionless formula for induced ventilation velocity is given as follows:
Based on the theoretical analysis of fire plume in ventilated tunnels, the piecewise formula of maximum excess temperature in branched tunnels was established in previous work [36]. Thus, the maximum temperature in the branched tunnel with a sloped region Ⅰ can be correlated using the following piecewise expression Equation (18).
where CT is the coefficient accounting for bifurcation structure, and V’ is the dimensionless induced velocity.
3. Numerical Method
3.1. Physical Model Set-Up
A numerical code of FDS (Fire Dynamic Simulator, Version 6.7) was employed to simulate the tunnel fire. Its reliability of results has been extensively verified on single-line tunnel fire [48] and branched tunnel fire [44]. FDS numerically solves the Navier-Stokes equations for low-speed thermally-driven flow. In large-edge simulation, the “turbulence model” refers to the closure for SGS flux terms. Deardorff’s model was used to solve the turbulent viscosity. In tunnel fire scenarios, soot is the most important combustion product, controlling the thermal radiation from the fire and hot smoke. As the radiation spectrum of soot is continuous, it is possible to assume that the gas behaves as a gray medium. Radiative heat transfer was included in the model via the solution of the radiation transport equation for a gray gas [49]. The radiative transport was solved using techniques like those for convective transport in finite volume methods (FVM) for fluid flow. The correlation between theoretical analysis and numerical simulation is shown in Figure 2.
The full-scale tunnel with a rectangular cross-section was modeled with a total length of 380 m. The branched tunnel was constructed in three parts, which were the mainline tunnel before shunting (region Ⅰ), the mainline tunnel after shunting (region Ⅱ), and the ramp (region Ⅲ). The region Ⅰ was 230 m in length with a cross dimension of 13.5 m width (W) and 7.0 m height (H). The region Ⅱ was 150 m in length with a dimension of 9.8 m (W) × 7.0 m (H). The region Ⅲ was 150 m with a dimension of 7 m (W) × 7.0 m (H), as shown in Figure 3. The bifurcation angle of 5° was considered in the present study. The tunnel was made of concrete with heat conductivity of 1.8 W/ (m K) (emissivity of 0.9, the absorption coefficient of 50,000 L/m), surrounded by 0.2 m thick thermally conducting concrete walls. The surfaces of the walls have a constant sand grain surface roughness of 0.003 m [49].
The mainline tunnel before shunting was sloped, and the negative tilted angle β varied from 1% to 7% with an interval of 1%. The fire source was located at the joint node. The heat release rate of the fire source was 3 MW, 5 MW, 10 MW, 15 MW, and 20 MW. Table 1 lists the test cases. The ambient temperature in all cases was 293 K, the pressure was 101,325 Pa, and the relative humidity was 40%.
The thermocouples with a bead diameter of 1 mm were used to detect the temperature at the tunnel centerline. The thermocouple tree was installed near the fire source on two sides at 50 m to measure the longitudinal and vertical temperatures. Six thermocouples with a vertical interval of 1 m consisted of the thermocouple tree; the horizontal interval of each tree was 2 m. The first thermocouple is below the tunnel ceiling by 0.1 m. In the ramp and away from the fire source 50 m in the mainline, the thermocouple was placed below the tunnel ceiling 0.1 m with a horizontal interval of 4 m. The velocity at the tunnel center was measured with an interval of 77 m in region Ⅰ and at region Ⅱ end.
3.2. Grid Sensitivity Analysis
The grid size, which relates to the characteristic fire diameter D*, is an important parameter determining the accuracy of results and computation time, given as Equation (19). For tunnel fire in the sloped branched tunnel, the previous study [44] validated that the numerical result was reliable under D*/δx = 6. The minimum fire power in the present work was 3 MW, and the corresponding D* was 1.49. Hence, the grid size of 0.25 m was adopted under D*/δx = 6. Therefore, in order to save time and obtain accurate results, the grid size near the fire source 55 m was set as 0.25 m, and the mesh away from the fire source was 0.5 m. The boundary of the mesh is set as “Open” to connect with the outside.
where D* is the characteristic fire diameter.
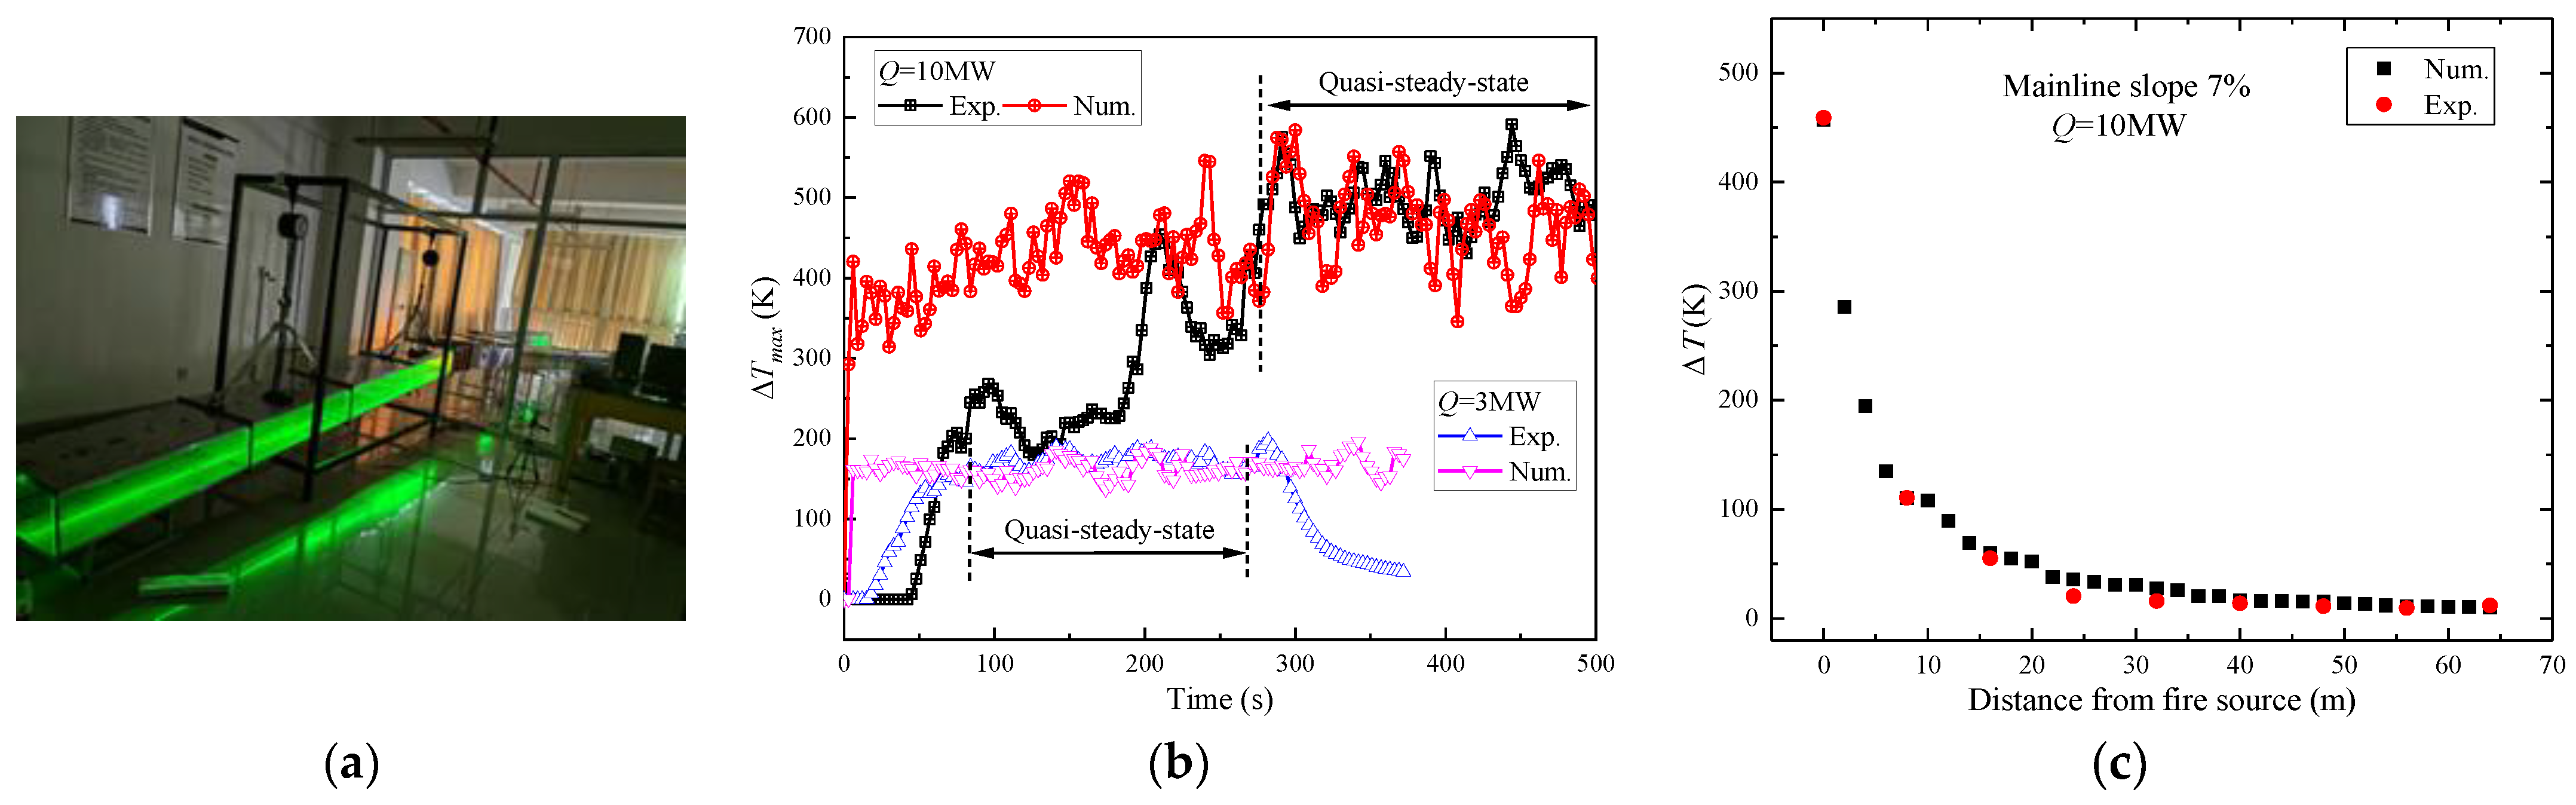
To validate the reliability of the numerical data, a 1/20 small-scale experiment was carried out to compare with the numerical results. The 1/20 small-scale experimental results in a previous study were used to validate the accuracy of FDS for bifurcation tunnel fire [37]. The small branched tunnel with a sloped mainline before shunting (region Ⅰ) was built so that the bifurcation angle is 5°. The cross-sectional dimension of the mainline was 0.5 m (Width) × 0.25 m (Height), and the ramp with dimension of 0.35 m (Width) × 0.25 m (Height) was connected to the mainline. The length scale for region Ⅰ, region Ⅱ, and ramp was 4 m, 6 m, and 4 m, respectively. The experiments were conducted in the branched tunnel with a mainline slope of 7%, as shown in Figure 4a. The side walls of the tunnel were made of 5 mm thick fireproof glass on one side to facilitate the observation of combustion and smoke spread, and the remaining walls were made of 1.5 mm stainless steel plates. The data acquisition system also included thermocouples, an Agilent DAQ970A inspector, and a high-speed video camera. All thermocouples were connected to a data acquisition system, Keyssight DAQ970A (Keysight Technologies, Santa Rosa, CA, USA), which captured the measurement signals and converted the information to a PC. The propagation of smoke and entrainment flow was observed using a green laser sheet, and a video camera was used to film the smoke flow process and the flame changes.
The fire source was located at a joint node with N-heptane as fuel. Two heat release rates, which were converted to full scale at 3 MW and 10 MW, were employed to verify the numerical results. The heat release rate is obtained by transforming the Froude similarity criterion into a reduced size, given as follows:
where m is the model parameter and f is the full-size parameter.
The comparison of time history temperature at the quasi-steady state and longitudinal temperature between numerical and experimental values is shown in Figure 4b,c. The experimental results were converted to full-scale values before comparison. The numerical results agree well with experimental data during a quasi-steady state; the comparison results can further validate the reliability and accuracy of the numerical data.
4. Results and Discussion
4.1. Induced Velocity in Sloped Mainline
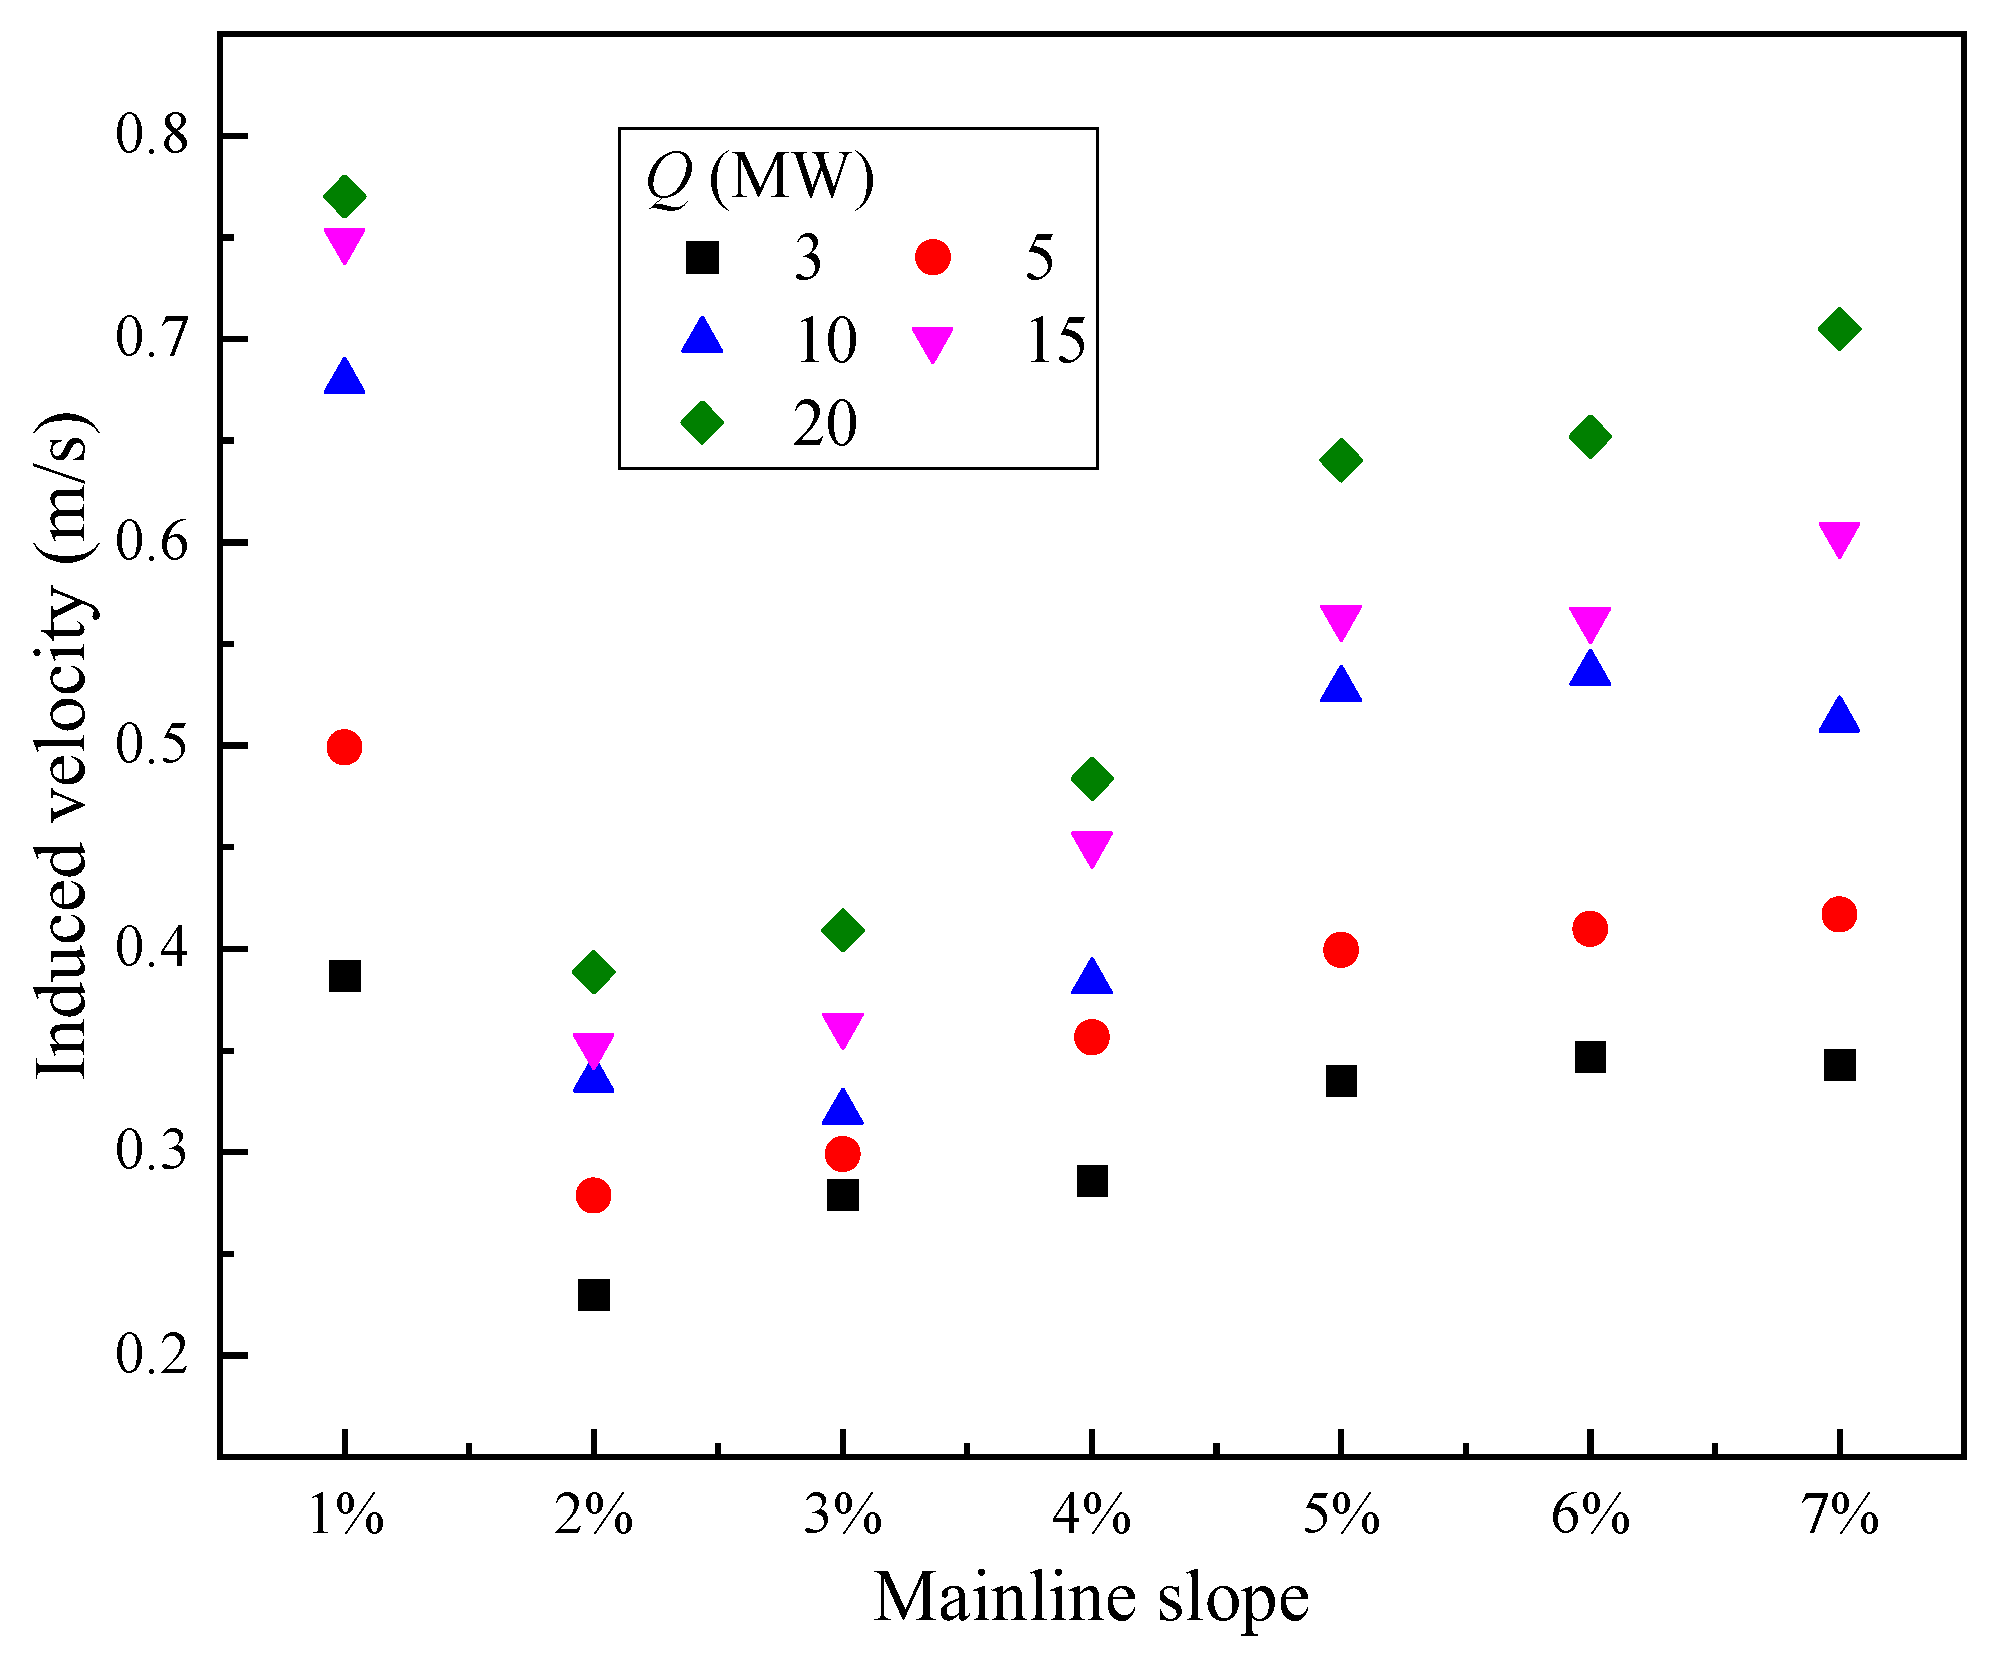
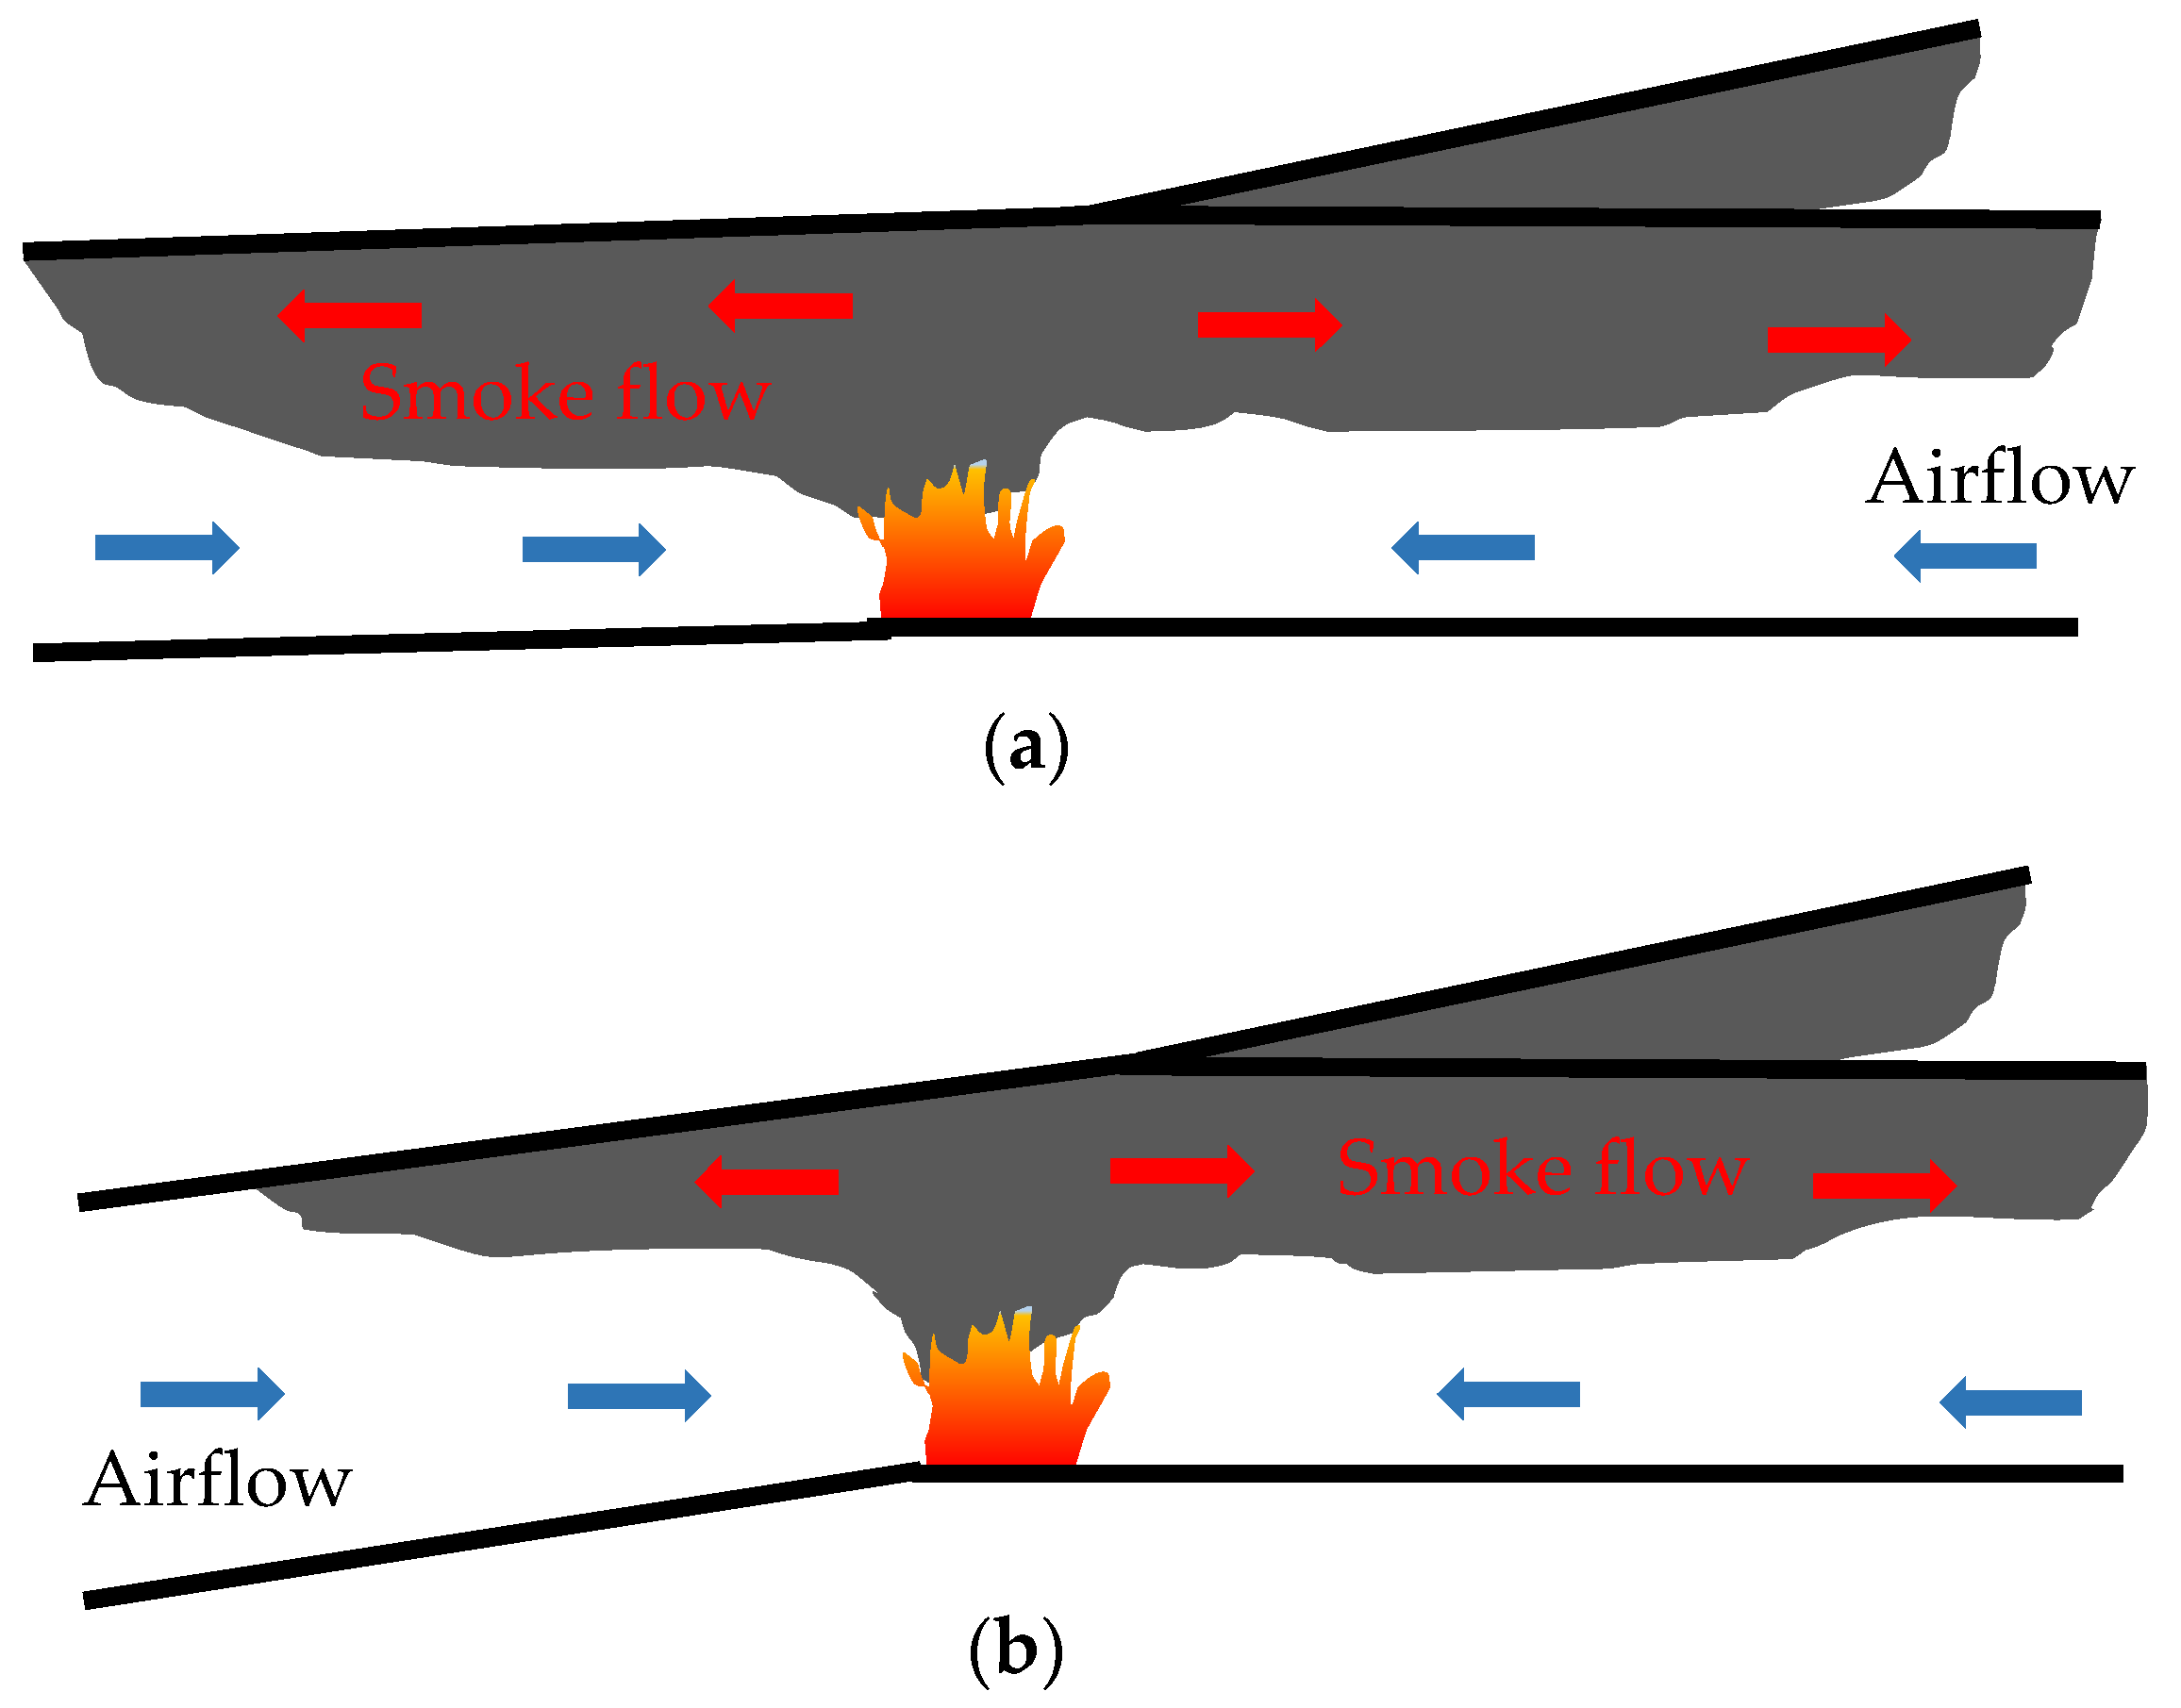
In the mainline tunnel, the pressure difference caused by the stack effect can be quantified using the formula ΔP = Δρgh, where Δρ varied with temperature difference due to the heat loss in the tunnel. The velocity profile near the lower portal was uniform due to being less affected by flame turbulence. Thus, the velocity at the lower portal was used to describe the induced airflow. The mean air velocity of the cross-section in region Ⅰ is 0.81 times the measured value at the center of the cross-section [50]. Figure 5 shows the mean air velocity under different conditions. For a 1% tunnel slope, the smoke spilled from the lower portal, resulting in a relatively large measured velocity. In fact, that is the speed of the smoke layer in the opposite direction with the stack effect, as shown in Figure 6a. The airflow velocity in the titled mainline region depends on the relative prevailingness of outflow initial momentum and stack effect [51]. The initial momentum to outlet is larger compared to the stack effect under a slope of 1%. This competitive gap increases with the heat release rate, which results in a rising outflow velocity.
When the slope is ≥2%, the induced velocity from the lower portal to the higher region is shown in Figure 5. In a sloped single-line tunnel fire, the critical tunnel slope for changing airflow direction is 2° (>2%) [52]. For a given heat release rate, the airflow velocity rose with a larger mainline slope as increasing of h but the growth rate weakened with a slope larger than 5%. Because the downstream region is horizontal, that weakens the stack effect, especially on a slope larger than 5%. For a given tunnel slope, the airflow velocity increased with the heat release rate because of the greater density difference Δρ between the smoke layer and fresh air. This is consistent with a previous study conducted by Zhou [53]. Under different heat release rates, the difference in airflow velocity gradually increased with a larger mainline tunnel slope.
For all conditions, the relationship between non-dimensional induced velocity and non-dimensional parameters in Equation (17) is shown in Figure 7. The non-dimensional velocity V’ increased with the normalized parameter Π but with two growth patterns. For a tunnel slope equal to 1%, the V’ is logarithmically varied with Π, expressed as Equation (21). The previous study also obtained the logarithmic relationship between longitudinal airflow velocity and fire power in the inclined single-line tunnel with a slope less than 2°, but a linear relationship is obtained when the tunnel slope is equal to or larger than 2° [52]. For a mainline slope larger than 1%, the induced airflow velocity can be linearly correlated by the dimensionless parameter Π with a slope of 0.0015. Therefore, the piecewise expression for airflow velocity in region Ⅰ under a naturally branched tunnel is given as Equation (21). The previous study in inclined single-line tunnel fire found the non-dimensional induced airflow velocity increased with 1/3 power of dimensionless heat release rate multiplied by dimensionless tunnel height under slope 0–15% [52].
Comparison has been made between numerical results and predictions based on Equation (21), as well as previous models for induced velocity as shown in Figure 8. It is obvious that the previous models overestimate the induced airflow velocity. Mainly because the previous model was deduced based on the inclined single-line tunnel, but the present study focused on the branched tunnel only with an inclined mainline tunnel before shunting. Otherwise, Yang et al. [52] have not considered the length of the inclined region at an inclined angle of less than 2°. Zhong et al. [54] used tunnel width to normalize the dimensionless heat release rate and correlated a linear formula for all tunnel slopes without identifying airflow direction. Thus, the previous model is not applicable for branched tunnels with inclined mainlines before shunting. The predictions calculated by Equation (21) agree well with a numerical model. The airflow velocity in the sloped mainline before shunting can be well calculated by the present model.
4.2. Maximum Temperature in Branched Tunnel
Figure 9 presents the maximum excess temperature beneath the tunnel ceiling. For Q ≥ 15 MW, ΔTmax declined with the mainline slope. For Q < 15 MW, the effect of the mainline slope on the maximum ceiling temperature rise is limited. But in the inclined single-line tunnel, Zhong et al. [54] and Zhang et al. [31] found that the maximum temperature decreased with the larger tunnel slope regardless of fire power. The downstream and upstream in the previous ordinary tunnel are also inclined so that the fire plume can easily deflect downstream. The induced airflow enhances the heat convection between smoke and fresh air, resulting in a cooling effect. At the same time, the distance from the fire source to the ceiling increased with the tunnel slope. The more heat is lost due to convection and radiation before the plume impinges on the ceiling, the maximum temperature decreases with a greater tunnel slope in an ordinary inclined tunnel.
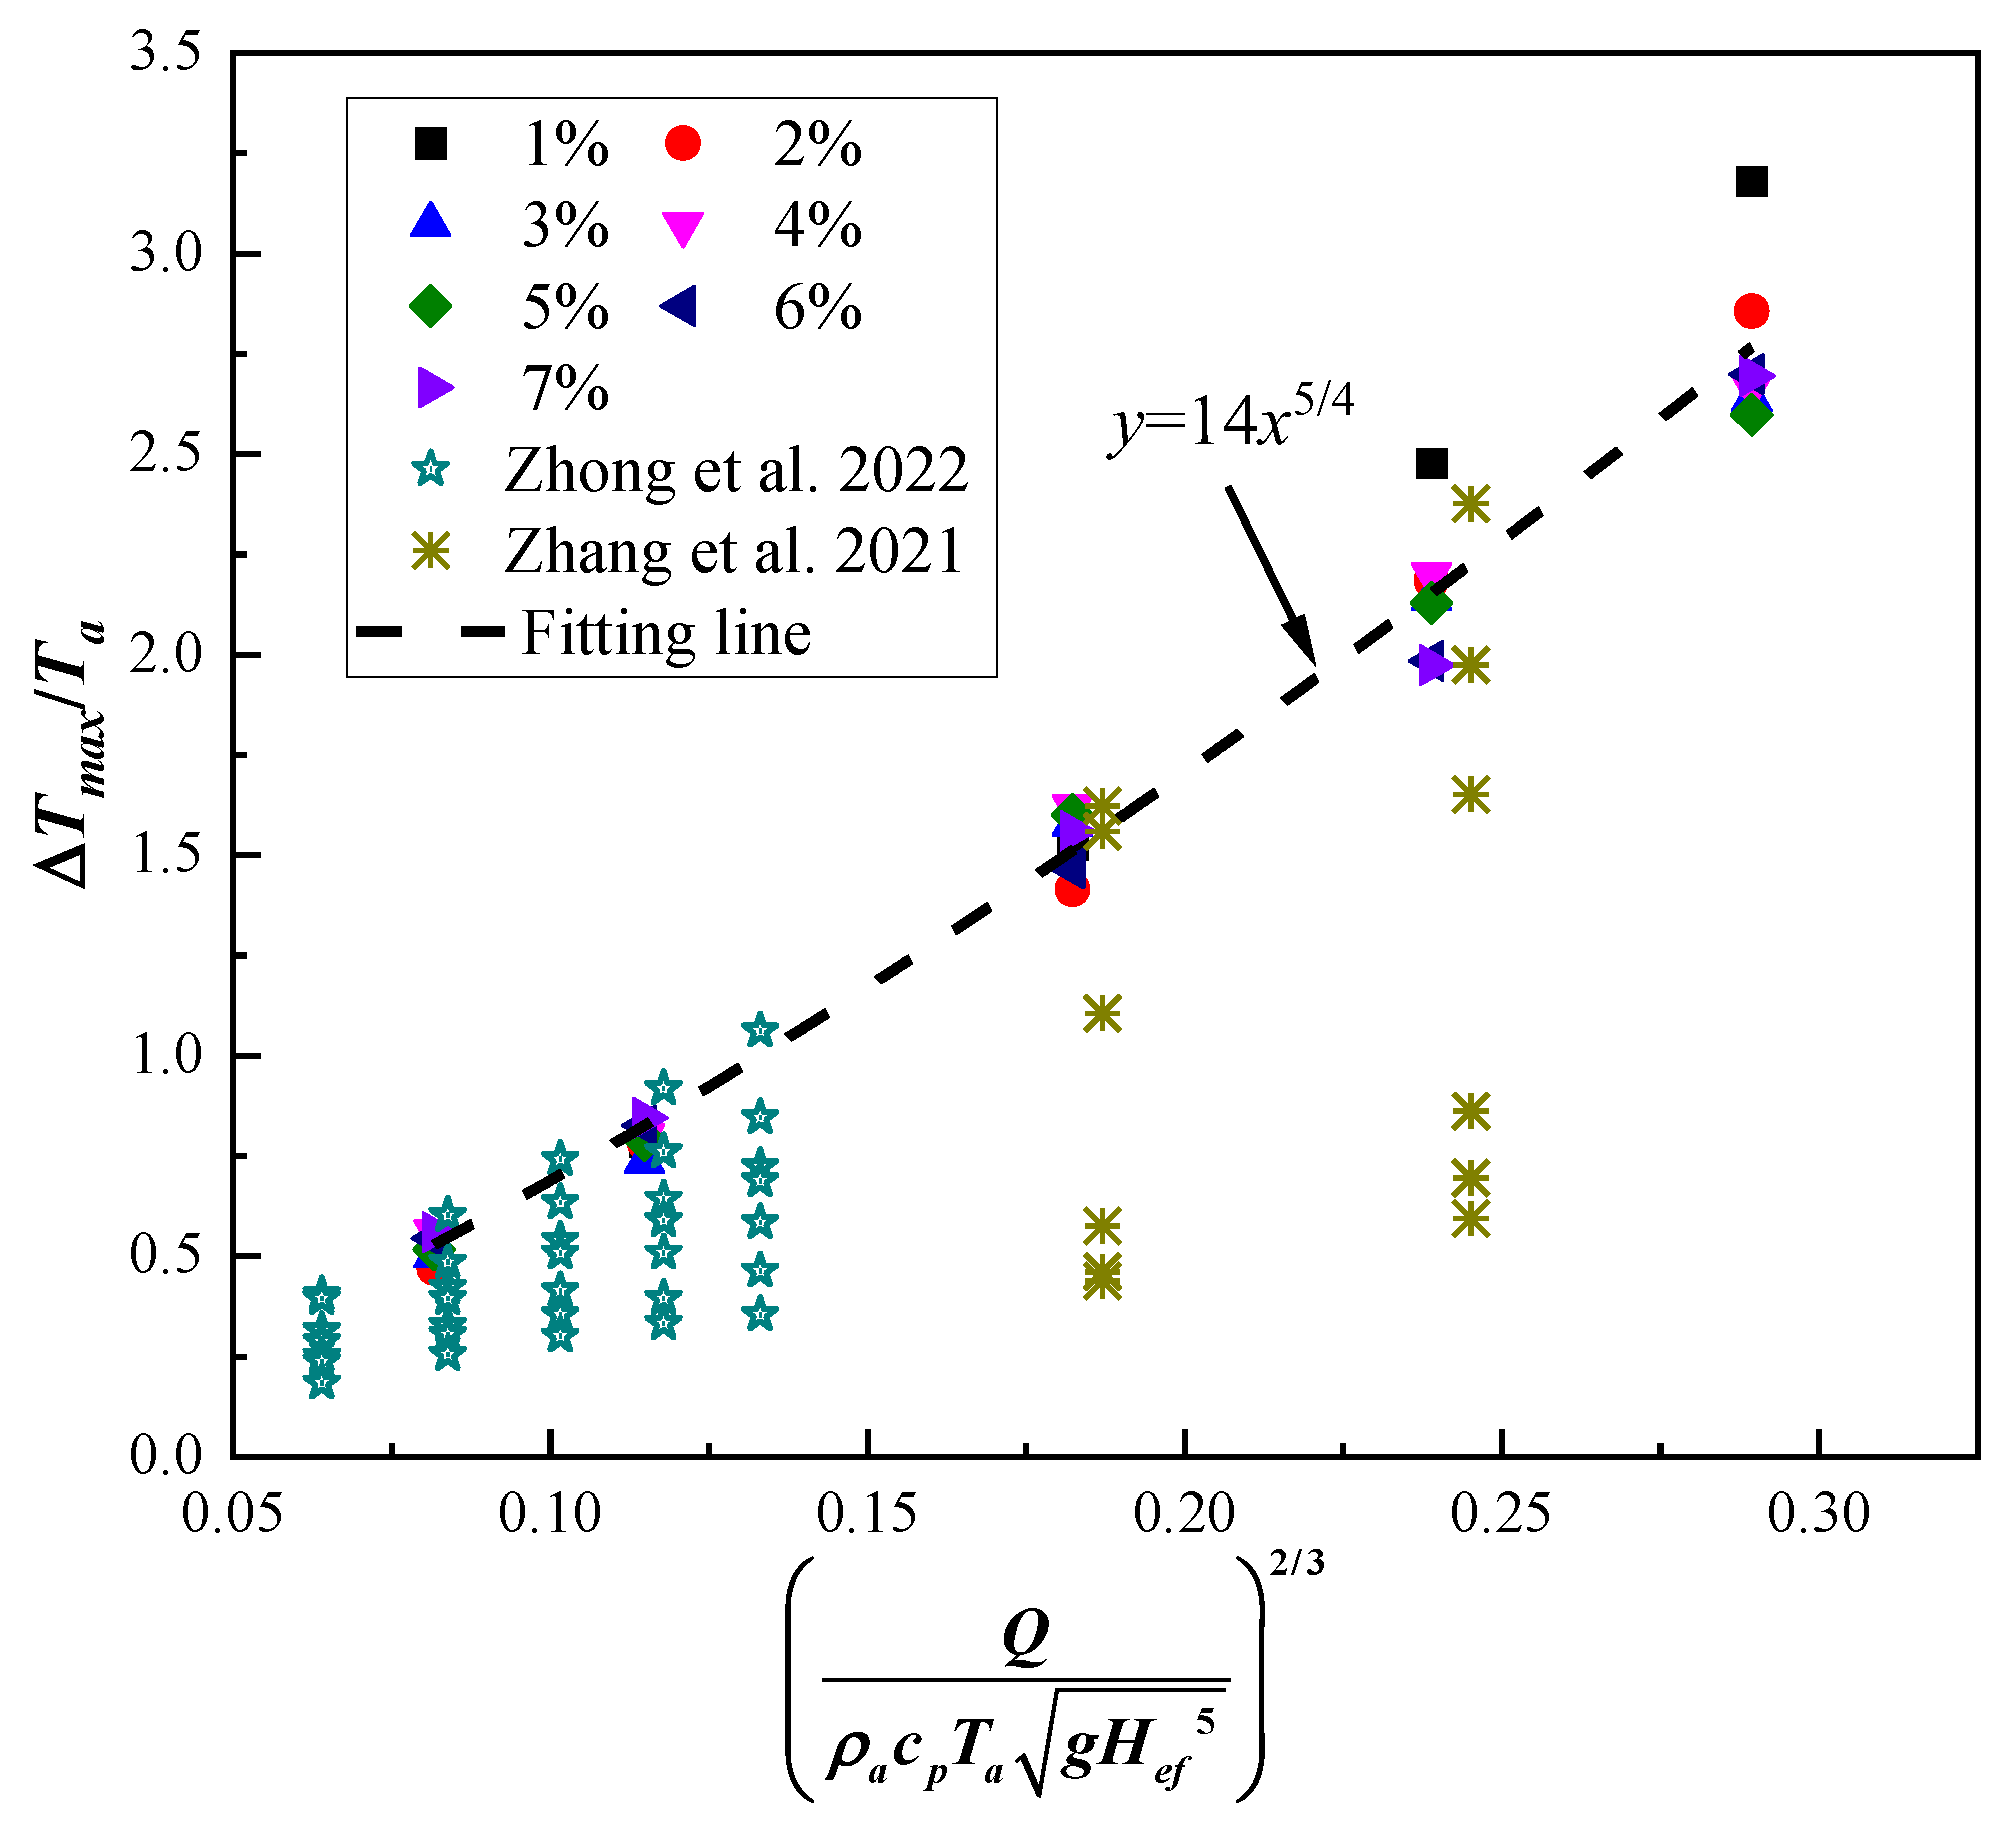
But for the present study, downstream of the fire source is a horizontal region that weakens the stack effect, and the distance between the fire source and the tunnel ceiling is fixed. The deflection effect of the fire plume and the cooling effect of airflow controlled the maximum temperature, which is only noteworthy when the heat release rate is relatively large. Under all mainline slopes, the maximum excess temperature increased with a greater heat release rate. This is consistent with a previous experimental study [20]. Equation (18) shows that dimensionless maximum excess temperature is independent of wind speed during relatively small airflow velocity because the enhancement effect of heat convection on maximum temperature can be ignored. For relatively large ventilation velocity, the dimensionless maximum temperature is influenced by the heat release rate and airflow velocity that always occur in a forced ventilation tunnel. In present conditions, V’ is less than 0.19 when the mainline slope does not exceed 7%. Thus, the dimensionless maximum temperature is correlated with Qef*2/3, as shown in Figure 10. Overall, the dimensionless ceiling maximum excess temperature can be well collapsed by Qef*2/3 exponentially, expressed as Equation (22).
The previous data in the inclined single-line tunnel are added for comparison, which also shows an exponential relationship. It should be noted that the results obtained by Zhong et al. [54] agree well with the present fitting line when the tunnel slope is less than 3%, but this key slope is 1% from data obtained by Zhang et al. [31]. This difference may result from the tunnel height, length scale of the inclined tunnel, and longitudinal location of the fire source that caused different heat transfer mechanisms in the tunnel.
4.3. Temperature Longitudinal Decay in Sloped Mainline
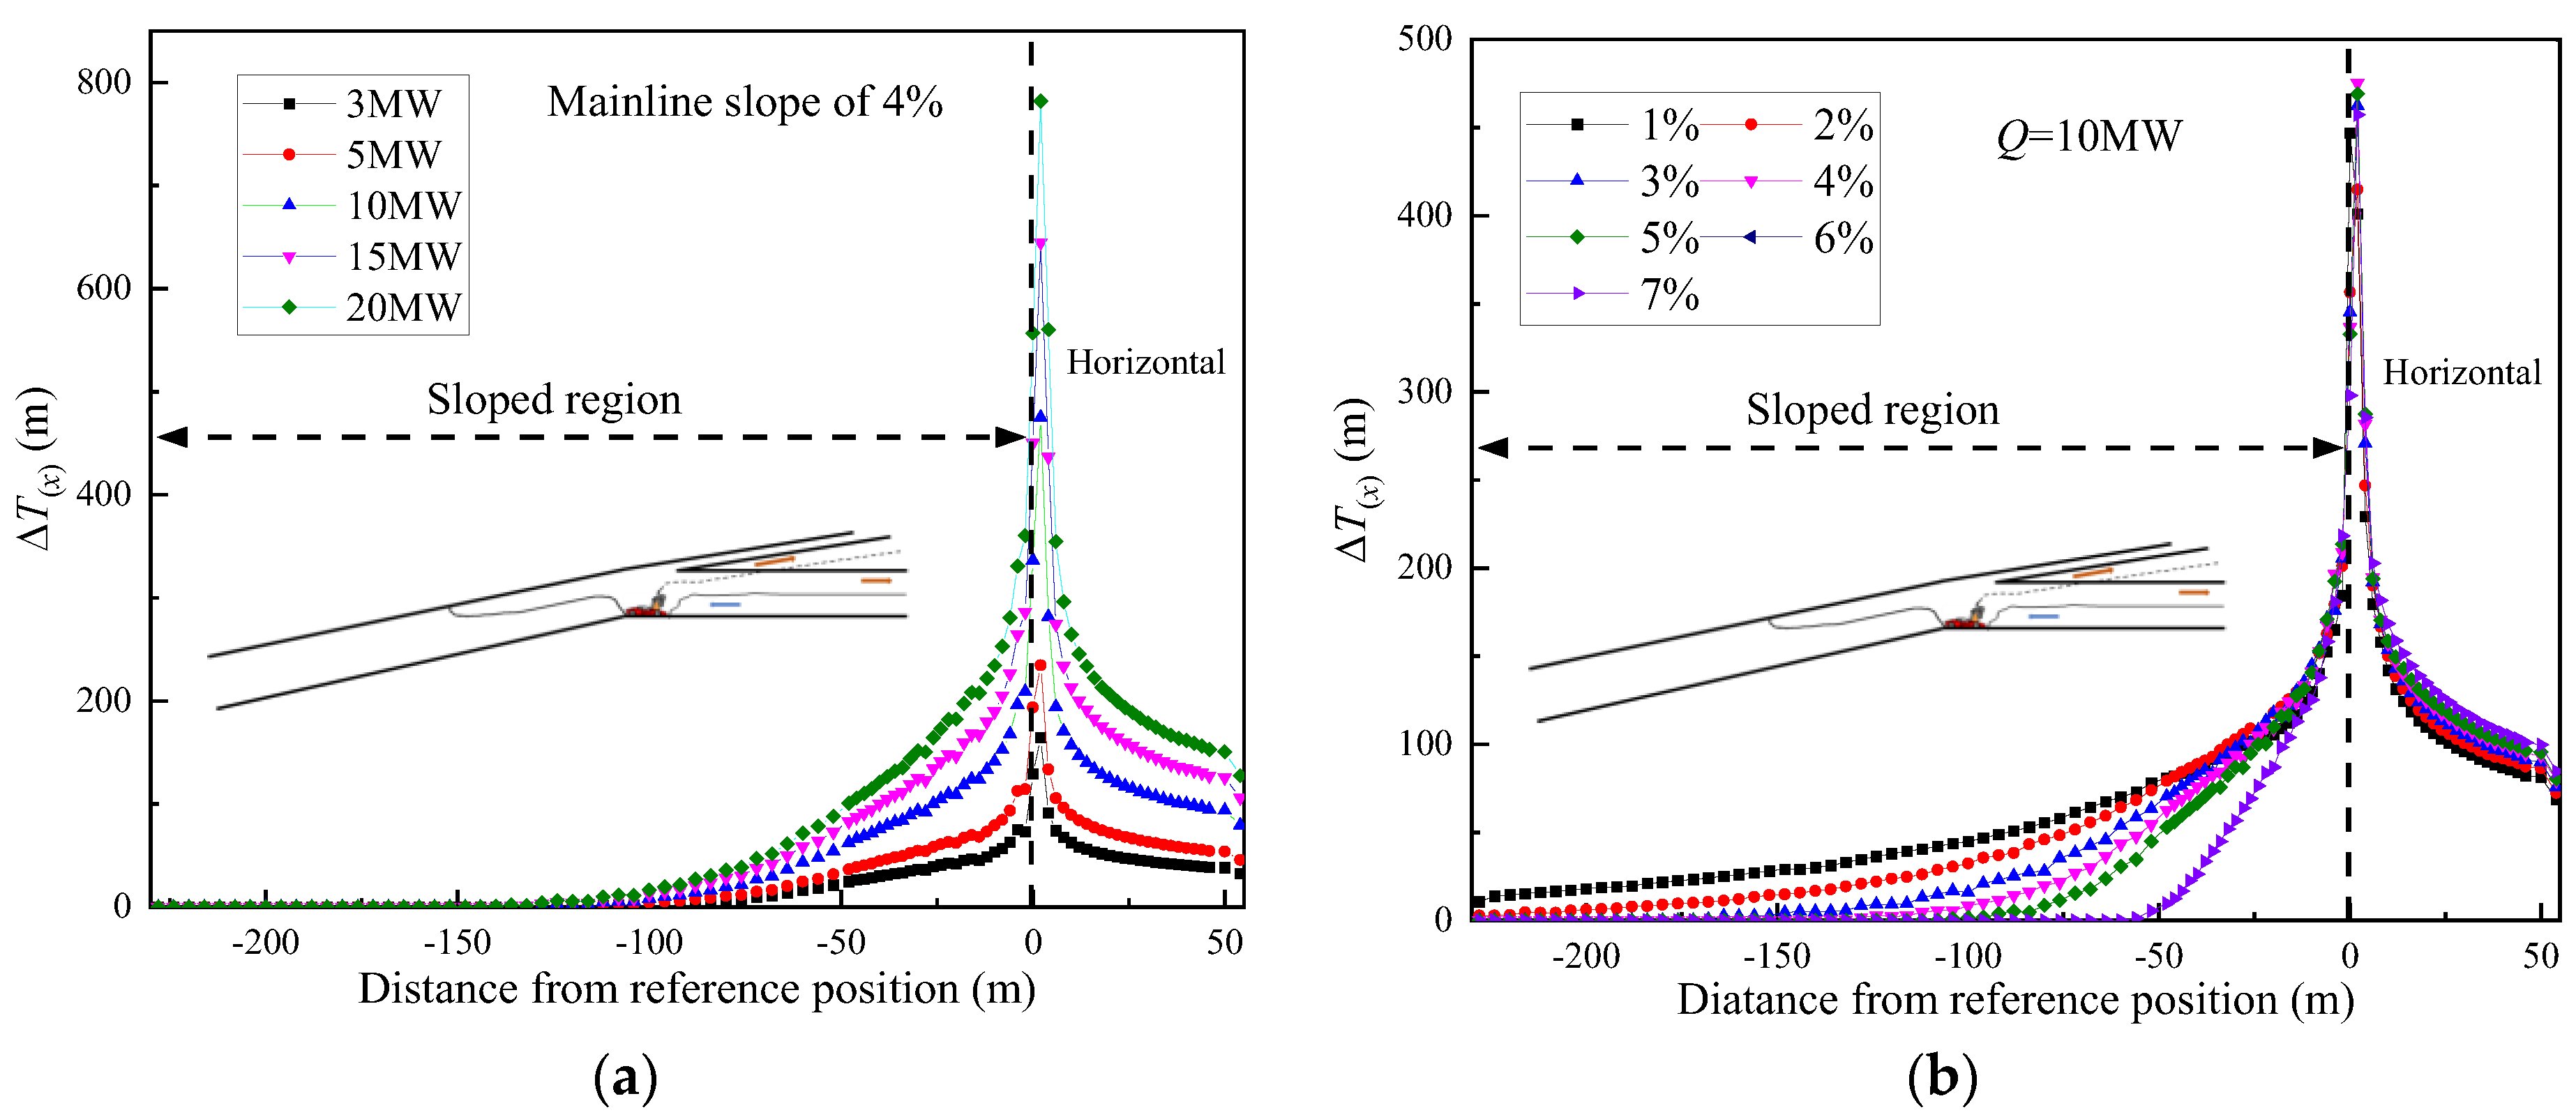
Figure 11 shows the typical longitudinal temperature distribution in a sloped mainline. The ceiling temperature decays to ambient value before arriving at the lower entrance, which indicates the smoke has stagnated in the sloped mainline. (1) For a certain mainline slope, the longitudinal temperature is higher under a stronger heat release rate, and it occurs over a longer distance of temperature rise in the sloped region. (2) For a given heat release rate, the steeper mainline slope results in a lower longitudinal temperature rise, and the gas temperature decays a bit faster with distance, which results in a shorter smoke backflow. When the mainline slope is higher, the stack effect is considerable, which entrains more fresh air. The strong cooling effect of thermal convection accelerates the gas temperature decay with distance. From Figure 11b, the effect of the mainline slope (region Ⅰ) on temperature longitudinal decay in the horizontal mainline region (region Ⅱ) is limited, especially away from the fire source. Thus, the following part mainly analyzes the temperature longitudinal decay in the sloped region.
From previous experimental studies [37,40], the sum of two exponential functions can well correlate with the longitudinal temperature decay in the horizontally branched tunnel. Lei et al. [38] found that the sum of two exponential functions collapsed the longitudinal ceiling temperature well in the branched tunnel with a ramp slope [39]. More specifically, the longitudinal decay factor in the sloped mainline tunnel varies with the mainline slope. However, the previous research mainly focused on the horizontal mainline. Thus, the dimensionless longitudinal temperature under different slopes is fitted by following the sum of two exponential expressions.
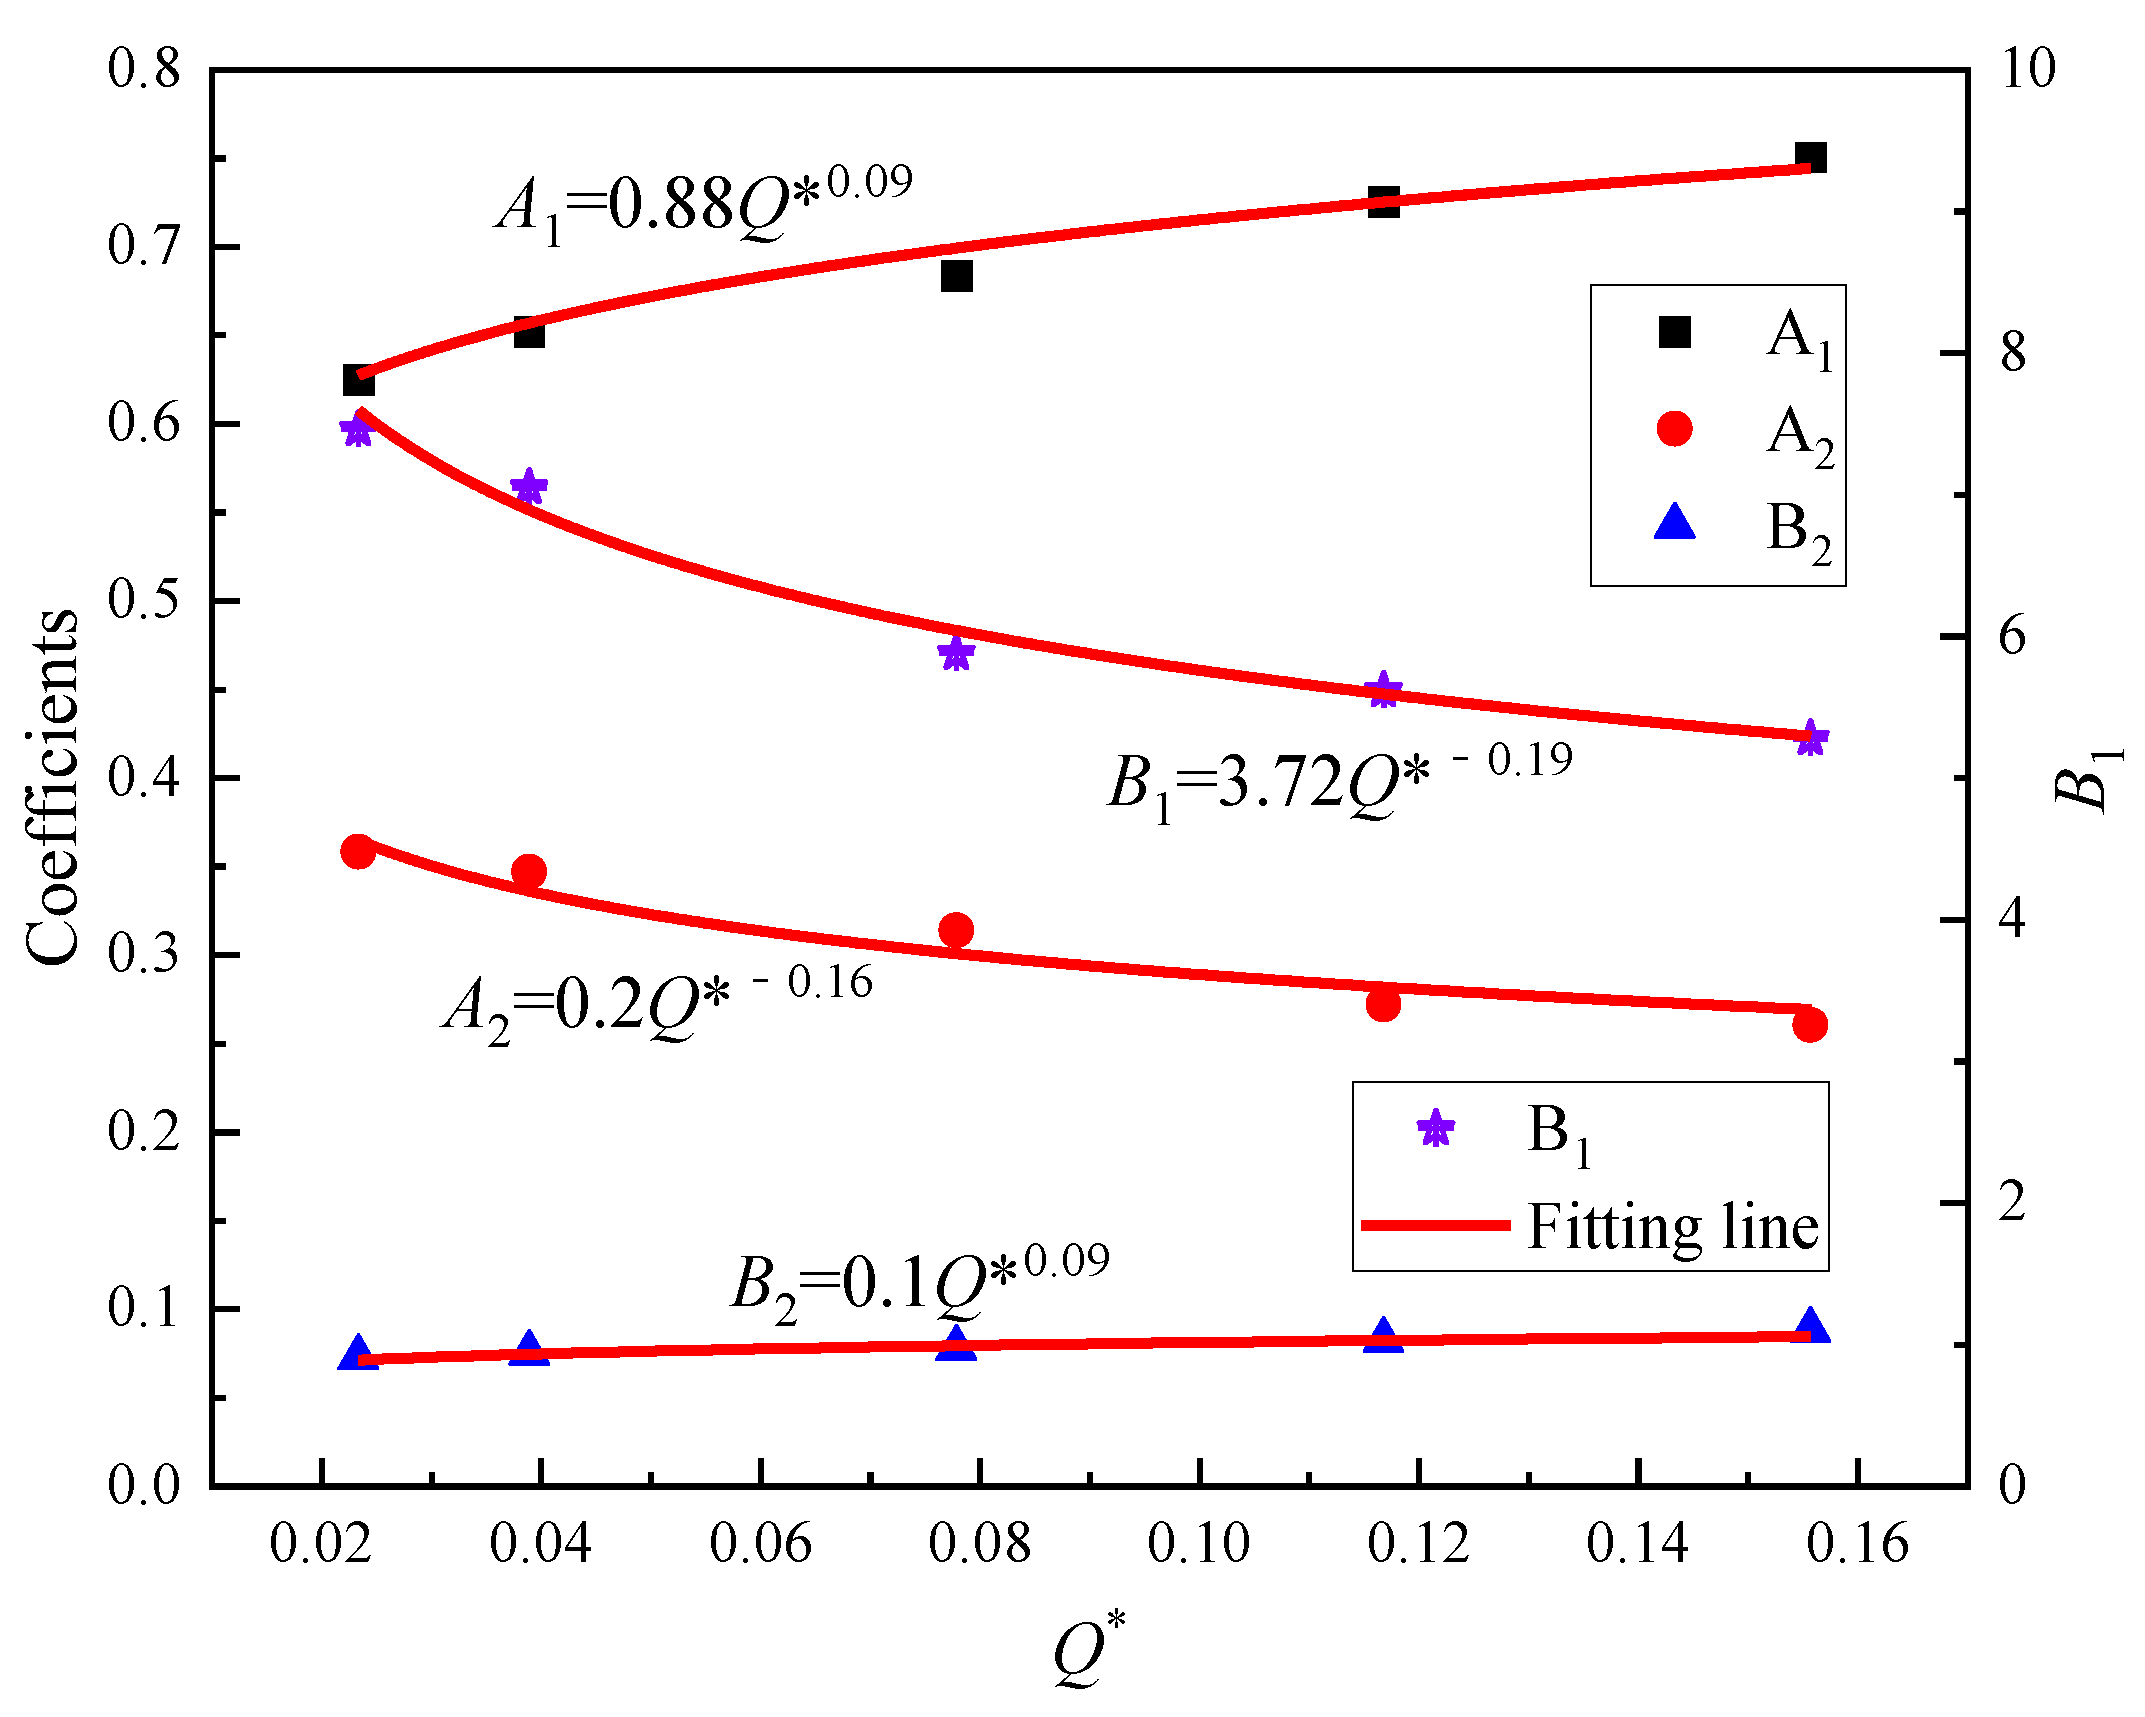
where A1 and A2 are constant coefficients, B1 and B2 are the coefficients varied with different branched tunnel regions, x is the axis distance in m, xmax is the position of maximum temperature, and H is the tunnel height in m.
Figure 12 presents the dimensionless ceiling temperature collapsed by Equation (23), which refers only to the upstream area of the fire. It can be observed that the dimensionless ceiling temperature decays a bit faster with distance under a stronger heat release rate when the mainline slope equals 1%. Under this circumstance, the exponential power index coefficient and the constant coefficient are varied with the heat release rate, which is consistent with the previous experimental study [38] in the horizontally branched tunnel. When the mainline slope is larger than 1%, the decay coefficients of dimensionless ceiling temperature are only varied with the mainline slope but independent of fire power, which is basically consistent with previous research with inclined ramps [39]. Because the inclined ramp induced the stack effect, that also accelerated the airflow in the mainline.
For the mainline slope equal to 1%, the dimensionless heat release rate is employed to correlate the decay coefficient of ceiling temperature, as shown in Figure 13. All the decay coefficients of ceiling temperature can be well correlated by Q*, given as follows:
Substituted Equation (24) into Equation (23) can predict the longitudinal ceiling temperature in a sloped mainline with a 1% slope. For the mainline slope larger than 1%, the coefficients of A1, A2, and B1 have a very small difference between each condition. Therefore, the average value is used to correct the coefficients, where A1 = 0.6, A2 = 0.4 and B1 = 2.5. The exponential power index coefficient of B2 increases with the mainline slope and can be correlated by h/L, as shown in Figure 14. The coefficient of B2 can be given as follows:
Substituted coefficients into Equation (23), the longitudinal temperature can be predicted during mainline slope larger than 1%. So, the ceiling temperature at the sloped mainline region away from the fire source can be predicted by combining Equations (22) and (23). It should be noted that the proposed model applies to the branched tunnel with a sloped mainline before shunting under natural conditions.
5. Conclusions
This study reveals the effect of the mainline slope on airflow velocity and ceiling temperature in a branched tunnel with an inclined upstream mainline. The maximum temperature and temperature longitudinal decay in the inclined mainline region are analyzed and normalized. The predicted models for induced airflow velocity and ceiling temperature at inclined mainlines are proposed. The major findings are as follows:
- (1)
- The unidirectional airflow velocity in the inclined mainline region is induced during a slope larger than 1% due to the stack effect. The induced velocity increased with the upstream mainline slope that prevents the smoke reverse flow. A dimensionless expression is proposed to correlate the induced airflow velocity that shows a good linearly increasing for the mainline slope larger than 1%.
- (2)
- The effect of the mainline slope on the maximum temperature beneath the tunnel ceiling is limited, especially for relatively small fire power. The dimensionless maximum temperature can be well collapsed using Qef*2/3 but is independent on a mainline slope. The growth rate of maximum temperature is divided into two parts by a slope of 1%. A two-piecewise formula is developed for the maximum temperature beneath the ceiling in the branched tunnel with an inclined upstream mainline.
- (3)
- The mainline slope before shunting significantly affects the temperature longitudinal decay in the inclined mainline region, which can be well correlated using the sum of two exponential functions. The attenuation coefficients relate to heat release rate under a 1% slope, but it is independent of fire power during a slope larger than 1%. The empirical model is proposed to predict the longitudinal ceiling temperature in the sloped mainline region. This study contributes to the understanding of smoke temperature profiles in naturally branched tunnels with negative mainlines and guides extraction design.
Limitations also apply to the predicted models developed in this study. This study is primarily focused on addressing the influence of the mainline tunnel slope and heat release rate on the smoke temperature profile and induced velocity under a naturally ventilated tunnel, where the longitudinal ventilation velocity and bifurcation angle are not considered to simplify the problem. The related study will be taken into our future work.
Author Contributions
Conceptualization, N.L.; methodology, N.L. and Y.H.; formal analysis, N.L.; writing—original draft, N.L. and X.Y.; data curation, X.Y.; writing—review & editing, Y.H., X.Y. and J.Y.; investigation, X.Y. and J.Y.; supervision, N.L.; project administration, Y.H.; funding acquisition, Y.H. All authors have read and agreed to the published version of the manuscript.
Funding
This study was supported by the National Natural Science Foundation of China (NSFC) [Grant No. 52104185], the Research Foundation of Chongqing for graduated doctors [Grant No. CSTB2022BSXM-JCX0151], the Natural Science Foundation of Chongqing, China [Grant No. cstc2021jcyj-msxmX0919], the Science and Technology Research Program of Chongqing Municipal Education Commission [Grant No. KJQN202101527], Opening Fund of State Key Laboratory of Fire Science (HZ2023-KF07), the Research Foundation of Chongqing University of Science and Technology, [the project Nos. ckrc2021011, ckrc2021012].
Institutional Review Board Statement
Not applicable.
Informed Consent Statement
Not applicable.
Data Availability Statement
The datasets used during the current study are available from the corresponding author upon reasonable request. The data are not publicly available due to privacy restrictions.
Conflicts of Interest
The authors declare no conflicts of interest.
Abbreviations
| A1, A2 | constant coefficient | ΔT(x) | ceiling excess temperature (K) |
| B1, B2 | coefficients varied with different branched tunnel region | ΔTmax | maximum ceiling temperature rise (K) |
| cp | specific heat of air (kJ/kg·K) | ui | smoke movement velocity in tunnel (m/s) |
| CT | coefficient account for bifurcation structure | U’ | non-dimensional ventilation velocity |
| d | thickness of smoke layer (m) | ve | induced velocity (m/s) |
| D* | characteristic fire diameter | vbuo | airflow velocity induced by buoyancy (m/s) |
| Ds | hydraulic diameter of smoke layer (m) | v | ventilation velocity (m/s) |
| f | full size parameter | V’ | dimensionless induced velocity |
| g | gravitational acceleration (m/s2) | w* | characteristic plume velocity (m/s) |
| h | height difference between inclined mainline two ends (m) | x | axis distance (m) |
| Hef | effective tunnel height (m) | xmax | position of maximum temperature (m) |
| H | tunnel height (m) | ||
| kr | coefficient induced by branched structure | Greek symbols | |
| Ku | temperature exponential decay coefficient | △ | difference |
| lu | smoke back-layering length at upstream (m) | θ | bifurcation angle (°) |
| li | length of relative tunnel region (m) | ρa | ambient density (kg/m3) |
| L | length between inclined mainline two ends (m) | ρsmoke | density of smoke layer (kg/m2) |
| Pa, Pb, Pc | kinetic energy in mainline before shunting, mainline after shunting, and ramp (Pa) | Δρ | density difference (kg/m3) |
| Pi | dynamic pressure of smoke movement in difference tunnel region (Pa) | β | tunnel slope angle in degree |
| ΔPe | pressure difference induced by asymmetric entrainment (Pa) | λ | friction coefficient |
| ΔPbuo | pressure difference induced by buoyancy (Pa) | ||
| ΔPstack | stack pressure difference (Pa) | Subscripts and Superscripts | |
| ΔPstack, u | pressure difference induced by stack effect between smoke stagnation and joint node (Pa) | a | ambient |
| Q | heat release rate (kW) | buo | buoyancy |
| Qef | heat release rate for effective tunnel height | e | entrainment |
| Q* | dimensionless heat release rate | ef | effective |
| Qef* | dimensionless heat release rate based on the effective tunnel height | i | relative tunnel region |
| r | radius of fire source (m) | s | smoke |
| Ta | ambient temperature (K) | stack, u | stack effect at upstream |
| ΔT | longitudinal temperature rise (K) | u | upstream |
References
- Deng, Y.W.; Chen, C.; Li, Q.; Hu, Q.Q.; Yuan, H.T.; Li, J.M.; Li, Y. Measurements of real-world vehicle CO and NOx fleet average emissions in urban tunnels of two cities in China. Atmos. Environ. 2015, 122, 417–426. [Google Scholar] [CrossRef]
- Meng, N.; Shu, Y.M.; Zhang, S.H. Study on smoke temperature induced by two fires in a naturally ventilated tunnel. Tunn. Undergr. Space Technol. 2023, 131, 104774. [Google Scholar] [CrossRef]
- Wan, H.X.; Jiang, Y.J.; Jiang, J.P. A survey of fire accidents during the process of highway tunnel operation in China from 2010 to 2021: Characteristics and countermeasures. Tunn. Undergr. Space Technol. 2023, 139, 105237. [Google Scholar] [CrossRef]
- Caliendo, C.; Genovese, G.; Russo, I. A 3D CFD modeling for assessing the effects of both longitudinal slope and traffic volume on user safety within a naturally ventilated road tunnel in the event of a fire accident. IATSS Res. 2022, 46, 547–558. [Google Scholar] [CrossRef]
- Yang, D.; Liu, Y.L.; Zhao, C.M.; Mao, S.H. Multiple steady states of fire smoke transport in a multi-branch tunnel: Theoretical and numerical studies. Tunn. Undergr. Space Technol. 2017, 61, 189–197. [Google Scholar] [CrossRef]
- Li, Q.; Chen, C.; Deng, Y.W.; Li, J.M.; Xie, G.Y.; Li, Y.; Hu, Q.Q. Influence of traffic force on pollutant dispersion of CO, NO and particle matter (PM2.5) measured in an urban tunnel in Changsha, China. Tunn. Undergr. Space Technol. 2015, 49, 400–407. [Google Scholar] [CrossRef]
- Du, T.; Yang, D.; Peng, S.N.; Xiao, Y.M. A method for design of smoke control of urban traffic link tunnel (UTLT) using longitudinal ventilation. Tunn. Undergr. Space Technol. 2015, 48, 35–42. [Google Scholar] [CrossRef]
- Li, Q.; Chen, C.; Yuan, H.T.; Wang, L.Y.; Xu, S.H.; Li, Y.R. Prediction of pollutant concentration and ventilation control in urban bifurcate tunnel, China. Tunn. Undergr. Space Technol. 2018, 82, 406–415. [Google Scholar] [CrossRef]
- Liu, C.; Zhong, M.H.; Tian, X.L.; Zhang, P.H.; Xiao, Y.; Mei, Q. Experimental and numerical study on fire-induced smoke temperature in connected area of metro tunnel under natural ventilation. Int. J. Therm. Sci. 2019, 138, 84–97. [Google Scholar] [CrossRef]
- Jiang, L.; Creyssels, M.; Hunt, G.R.; Salizzoni, P. Control of light gas releases in ventilated tunnels. J. Fluid Mech. 2019, 872, 515–531. [Google Scholar] [CrossRef]
- Alpert, R.L. Calculation of response time of ceiling-mounted fire detectors. Fire Technol. 1972, 8, 181–195. [Google Scholar] [CrossRef]
- Alpert, R.L. Turbulent ceiling-jet induced by large-scale fires. Combust. Sci. Technol. 1975, 11, 197–213. [Google Scholar] [CrossRef]
- Kurioka, H.; Oka, Y.; Satoh, H.; Sugawa, O. Fire properties in near field of square fire source with longitudinal ventilation in tunnels. Fire Saf. J. 2003, 38, 319–340. [Google Scholar] [CrossRef]
- Hu, L.H.; Huo, R.; Peng, W.; Chow, W.K.; Yang, R.X. On the maximum smoke temperature under the ceiling in tunnel fires. Tunn. Undergr. Space Technol. 2006, 21, 650–655. [Google Scholar] [CrossRef]
- Li, Y.Z.; Lei, B.; Ingason, H. The maximum temperature of buoyancy-driven smoke flow beneath the ceiling in tunnel fires. Fire Saf. J. 2011, 46, 204–210. [Google Scholar] [CrossRef]
- Salizzoni, P.; Peruzzi, C.; Marro, M.; Cingi, P.; Angeli, D.; Kubwimana, T.; Mos, A. Measurements and scaling of buoyancy-induced flows in ventilated tunnels. Flow 2023, 3, E15. [Google Scholar] [CrossRef]
- Tang, F.; Mei, F.Z.; Wang, Q.; He, Z.; Fan, C.G.; Tao, C.F. Maximum temperature beneath the ceiling in tunnel fires with combination of ceiling mechanical smoke extraction and longitudinal ventilation. Tunn. Undergr. Space Technol. 2017, 68, 231–237. [Google Scholar] [CrossRef]
- Zhou, T.N.; He, Y.P.; Lin, X.; Wang, X.H.; Wang, J. Influence of constraint effect of sidewall on maximum smoke temperature distribution under a tunnel ceiling. Appl. Therm. Eng. 2017, 112, 932–941. [Google Scholar] [CrossRef]
- Zhou, T.N.; Li, H.H.; Chen, Q.P.; Wei, R.C.; Wang, J. Understanding sidewall constraint involving ventilation effects on temperature distribution of fire-induced thermal flow under a tunnel ceiling. Int. J. Therm. Sci. 2018, 129, 290–300. [Google Scholar] [CrossRef]
- Hu, L.H.; Huo, R.; Li, Y.Z.; Wang, H.B.; Chow, W.K. Full-scale burning tests on studying smoke temperature and velocity along a corridor. Tunn. Undergr. Space Technol. 2005, 20, 223–229. [Google Scholar] [CrossRef]
- Tang, F.; Cao, Z.L.; Chen, Q.; Meng, N.; Wang, Q.; Fan, C.G. Effect of blockage-heat source distance on maximum temperature of buoyancy-induced smoke flow beneath ceiling in a longitudinal ventilated tunnel. Int. J. Heat Mass Transf. 2017, 109, 683–688. [Google Scholar] [CrossRef]
- Chen, C.K.; Zhu, C.X.; Liu, X.Y.; Yu, N.H. Experimental investigation on the effect of asymmetrical sealing on tunnel fire behavior. Int. J. Heat Mass Transf. 2016, 92, 55–65. [Google Scholar] [CrossRef]
- Yao, Y.Z.; He, K.; Peng, M.; Shi, L.; Cheng, X.D.; Zhang, H.P. Maximum gas temperature rise beneath the ceiling in a portals-sealed tunnel fire. Tunn. Undergr. Space Technol. 2018, 80, 10–15. [Google Scholar] [CrossRef]
- Huang, Y.B.; Li, Y.F.; Dong, B.Y.; Li, J.M.; Liang, Q. Numerical investigation on the maximum ceiling temperature and longitudinal decay in a sealing tunnel fire. Tunn. Undergr. Space Technol. 2018, 72, 120–130. [Google Scholar] [CrossRef]
- Shi, J.K.; Zuo, C.; Xiong, Y.; Zhou, M.; Lin, P. Experimental study of different sealing ratios on the self-extinction of tunnel fires. Tunn. Undergr. Space Technol. 2021, 112, 103894. [Google Scholar] [CrossRef]
- Tang, F.; Cao, Z.L.; Palacios, A.; Wang, Q. A study on the maximum temperature of ceiling jet induced by rectangular-source fires in a tunnel using ceiling smoke extraction. Int. J. Therm. Sci. 2018, 127, 329–334. [Google Scholar] [CrossRef]
- Takeuchi, S.; Aoki, T.; Tanaka, F.; Moinuddin, K.A.M. Modeling for predicting the temperature distribution of smoke during a fire in an underground road tunnel with vertical shafts. Fire Saf. J. 2017, 91, 312–319. [Google Scholar] [CrossRef]
- Cong, H.Y.; Bi, M.S.; Bi, Y.B.; Jiang, H.P.; Li, Y.C.; Gao, W. Experimental and theoretical studies on the smoke temperature distribution along the tunnel ceiling with natural ventilation by the board-coupled shafts. Int. J. Therm. Sci. 2021, 159, 106639. [Google Scholar] [CrossRef]
- Oka, Y.; Imazeki, O. Temperature distribution within a ceiling jet propagating in an inclined flat-ceilinged tunnel with natural ventilation. Fire Saf. J. 2015, 71, 20–33. [Google Scholar] [CrossRef]
- Huo, Y.; Gao, Y.; Chow, W.K. A study on ceiling jet characteristics in an inclined tunnel. Tunn. Undergr. Space Technol. 2015, 50, 32–46. [Google Scholar] [CrossRef]
- Zhang, X.L.; Lin, Y.J.; Shi, C.L.; Zhang, J.P. Numerical simulation on the maximum temperature and smoke back-layering length in a tilted tunnel under natural ventilation. Tunn. Undergr. Space Technol. 2021, 107, 103661. [Google Scholar] [CrossRef]
- Hu, L.H.; Chen, L.F.; Wu, L.; Li, Y.F.; Zhang, J.Y.; Meng, N. An experimental investigation and correlation on buoyant gas temperature below ceiling in a slopping tunnel fire. Appl. Therm. Eng. 2013, 51, 246–254. [Google Scholar] [CrossRef]
- Ji, J.; Wang, Z.Y.; Ding, L.; Yu, L.X.; Gao, Z.H.; Wan, H.X. Effects of ambient pressure on smoke movement and temperature distribution in inclined tunnel fires. Int. J. Therm. Sci. 2019, 145, 106006. [Google Scholar] [CrossRef]
- Han, J.Q.; Liu, F.; Wang, F.; Weng, M.C.; Wang, J. Study on the smoke movement and downstream temperature distribution in a sloping tunnel with one closed portal. Int. J. Therm. Sci. 2020, 149, 106165. [Google Scholar] [CrossRef]
- Chen, C.K.; Nie, Y.L.; Zhang, Y.L.; Lei, P.; Fan, C.G.; Wang, Z.Y. Experimental investigation on the influence of ramp slope on fire behaviors in a bifurcated tunnel. Tunn. Undergr. Sp. Technol. 2020, 104, 103522. [Google Scholar] [CrossRef]
- Huang, Y.B.; Li, Y.F.; Li, J.M.; Li, J.X.; Wu, K.; Zhu, K.; Li, H.H. Experimental investigation on maximum gas temperature beneath the ceiling in a branched tunnel fire. Int. J. Therm. Sci. 2019, 145, 105997. [Google Scholar] [CrossRef]
- Huang, Y.B.; Li, Y.F.; Li, J.X.; Wu, K.; Li, H.H.; Zhu, K. Experimental study on the temperature longitudinal distribution induced by a branched tunnel fire. Int. J. Therm. Sci. 2021, 170, 107175. [Google Scholar] [CrossRef]
- Lei, P.; Chen, C.K.; Zhang, Y.L.; Xu, T.; Sun, H.K. Experimental study on temperature profile in a branched tunnel fire under natural ventilation considering different fire locations. Int. J. Therm. Sci. 2021, 159, 106631. [Google Scholar] [CrossRef]
- Lei, P.; Chen, C.K.; Zhao, D.Y.; Zhang, Y.L.; Xu, T.; Jiao, W.B. Study on heat allocation and temperature profile in a T-shaped branched tunnel fire with different branch slopes under natural ventilation. Tunn. Undergr. Space Technol. 2022, 126, 104508. [Google Scholar] [CrossRef]
- Liu, C.; Zhong, M.H.; Shi, C.L.; Zhang, P.H.; Tian, X.L. Temperature profile of fire-induced smoke in node area of a full-scale mine shaft tunnel under natural ventilation. Appl. Therm. Eng. 2017, 110, 382–389. [Google Scholar] [CrossRef]
- Li, Z.S.; Gao, Y.J.; Li, X.S.; Mao, P.F.; Zhang, Y.C.; Jin, K.Y.; Li, T.; Chen, L.F. Effects of transverse fire locations on flame length and temperature distribution in a bifurcated tunnel fire. Tunn. Undergr. Space Technol. 2021, 112, 103893. [Google Scholar] [CrossRef]
- Liang, K.; Hao, X.F.; An, W.G.; Tang, Y.H.; Cong, Y.Z. Study on cable fire spread and smoke temperature distribution in T-shaped utility tunnel. Case Stud. Therm. Eng. 2019, 14, 100433. [Google Scholar] [CrossRef]
- Cheng, H.H.; Liu, C.; Chen, J.F.; Wu, L.; Zhao, Y.T.; Zhong, M.H. Full-scale experimental study on fire under natural ventilation in the T-shaped and curved tunnel groups. Tunn. Undergr. Space Technol. 2022, 123, 104442. [Google Scholar] [CrossRef]
- Huang, Y.B.; Liu, X.; Dong, B.Y.; Zhong, H.; Wang, B.; Dong, Q.W. Effect of inclined mainline on smoke back-layering length in a naturally branched tunnel fire. Tunn. Undergr. Space Technol. 2023, 134, 104985. [Google Scholar] [CrossRef]
- Gao, Z.H.; Liu, Z.X.; Ji, J.; Fan, C.G.; Li, L.J.; Sun, J.H. Experimental study of tunnel sidewall effect on flame characteristics and air entrainment factor of methanol pool fires. Appl. Therm. Eng. 2016, 102, 1314–1319. [Google Scholar] [CrossRef]
- Huang, Y.B.; Li, Y.F.; Li, J.X.; Wu, K.; Li, H.H.; Zhu, K.; Li, J.M. Experimental investigation of the thermal back-layering length in a branched tunnel fire under longitudinal ventilation. Int. J. Therm. Sci. 2022, 173, 107415. [Google Scholar] [CrossRef]
- Blanchard, E.; Boulet, P.; Desanghère, S.; Carlotti, P. Energy balance in a tunnel fire: Midscale tests and CFD simulations. ISAT 2011, 14, 349–362. [Google Scholar]
- Yao, Y.Z.; Li, Y.Z.; Ingason, H.; Cheng, X.D. Numerical study on overall smoke control using naturally ventilated shafts during fires in a road tunnel. Int. J. Therm. Sci. 2019, 140, 491–504. [Google Scholar] [CrossRef]
- Deng, T.; Norris, S.; Sharma, R.N. Numerical study of the flame geometry of pool fires in longitudinally ventilated tunnels. Tunn. Undergr. Space Technol. 2023, 132, 104882. [Google Scholar] [CrossRef]
- Wang, Z.Y.; Ding, L.; Wan, H.X.; Ji, J.; Gao, Z.H.; Yu, L.X. Numerical investigation on the effect of tunnel width and slope on ceiling gas temperature in inclined tunnels. Int. J. Therm. Sci. 2020, 152, 106272. [Google Scholar] [CrossRef]
- Gao, Z.H.; Li, L.J.; Sun, C.P.; Zhong, W.; Yan, C.B. Effect of longitudinal slope on the smoke propagation and ceiling temperature characterization in sloping tunnel fires under natural ventilation. Tunn. Undergr. Space Technol. 2022, 123, 104396. [Google Scholar] [CrossRef]
- Yang, Y.X.; Long, Z.; Cheng, H.H.; Chen, J.F.; Liu, C.; Zhong, M.H. Experimental and numerical study of smoke temperature distribution characteristics in a sloped tunnel. Sustain. Cities Soc. 2021, 73, 103091. [Google Scholar] [CrossRef]
- Zhou, Y.; Yang, Y.; Mao, Z.L.; Bu, R.W.; Gong, J.H.; Wang, Y.X.; Yi, L. Analytical and numerical study on natural ventilation performance in single- and gable-slope city tunnels. Sustain. Cities Soc. 2019, 45, 258–270. [Google Scholar] [CrossRef]
- Zhong, W.; Liu, L.; Han, N.; Gao, Z.H. Investigation on the maximum ceiling temperature of the weak plume impingement flow in tunnel fires under longitudinal ventilation. Tunn. Undergr. Sp. Technol. 2022, 123, 104396. [Google Scholar] [CrossRef]
Figure 1.
Schematic diagram of smoke movement in branched tunnel with sloped mainline before shunting. The blue arrows represent the direction of flow of the ambient wind and the orange represents the direction of flow of the high temperature flue gases.
Figure 1.
Schematic diagram of smoke movement in branched tunnel with sloped mainline before shunting. The blue arrows represent the direction of flow of the ambient wind and the orange represents the direction of flow of the high temperature flue gases.

Figure 2.
Flowchart of the methodology.

Figure 3.
Schematic of the branched tunnel with slope mainline, (a) Skeleton branched tunnel, (b) Tunnel cross-section.
Figure 3.
Schematic of the branched tunnel with slope mainline, (a) Skeleton branched tunnel, (b) Tunnel cross-section.

Figure 4.
Validation of numerical results by comparing with experimental data, (a) Picture of experimental setup, (b) Temperature at quasi-steady state, and (c) Longitudinal temperature.
Figure 4.
Validation of numerical results by comparing with experimental data, (a) Picture of experimental setup, (b) Temperature at quasi-steady state, and (c) Longitudinal temperature.

Figure 5.
Induced airflow velocity in the mainline tunnel before shunting.

Figure 6.
Schematic of smoke movement in the bifurcated tunnel with different mainline slope, (a) Smoke exhaust through upstream portal, slope ≤ 1%, (b) Smoke exhaust only through downstream end, slope > 1%.
Figure 6.
Schematic of smoke movement in the bifurcated tunnel with different mainline slope, (a) Smoke exhaust through upstream portal, slope ≤ 1%, (b) Smoke exhaust only through downstream end, slope > 1%.

Figure 7.
Non-dimensional velocity vs. non-dimensional parameter Π.

Figure 8.
Comparison of airflow velocity between predictions and numerical results, Yang et al. [52], Zhong et al. [54].

Figure 9.
Maximum excess temperature beneath the tunnel ceiling.

Figure 10.
Maximum ceiling excess temperature as a function of Qef*2/3 in the branched tunnel with sloped mainline, Zhong et al. [54], Zhang et al. [31].

Figure 11.
Typical temperature longitudinal decay in sloped mainline, (a) Different heat release rate with a slope of 4%, (b) Different mainline slope with HRR 10 MW. The blue arrow represents the direction of ambient air flow and the orange arrow represents the direction of high temperature flue gas flow, which is easy to understand.

Figure 12.
Dimensionless temperature longitudinal distribution in sloped mainline, (a) Mainline slope of 1%, (b) Mainline slope of 2%, (c) Mainline slope of 3%, (d) Mainline slope of 4%, (e) Mainline slope of 5%, (f) Mainline slope of 6%, and (g) Mainline slope of 7%.
Figure 12.
Dimensionless temperature longitudinal distribution in sloped mainline, (a) Mainline slope of 1%, (b) Mainline slope of 2%, (c) Mainline slope of 3%, (d) Mainline slope of 4%, (e) Mainline slope of 5%, (f) Mainline slope of 6%, and (g) Mainline slope of 7%.


Figure 13.
Correlation of decay coefficient with heat release rate for ceiling temperature, 1% slope.
Figure 13.
Correlation of decay coefficient with heat release rate for ceiling temperature, 1% slope.

Figure 14.
Relationship between coefficient B2 and h/L.


Table 1.
Summary of test conditions.
| No. | Heat Release Rate (MW) | Slope (%) |
|---|---|---|
| 1–7 | 3 | 1, 2, 3, 4, 5, 6, 7 |
| 8–14 | 5 | |
| 15–21 | 10 | |
| 22–28 | 15 | |
| 29–35 | 20 |
Disclaimer/Publisher’s Note: The statements, opinions and data contained in all publications are solely those of the individual author(s) and contributor(s) and not of MDPI and/or the editor(s). MDPI and/or the editor(s) disclaim responsibility for any injury to people or property resulting from any ideas, methods, instructions or products referred to in the content. |
© 2024 by the authors. Licensee MDPI, Basel, Switzerland. This article is an open access article distributed under the terms and conditions of the Creative Commons Attribution (CC BY) license (https://creativecommons.org/licenses/by/4.0/).
Share and Cite
MDPI and ACS Style
Lu, N.; Yao, X.; Yang, J.; Huang, Y. Evaluating the Ceiling Gas Temperature in a Branched Tunnel Fire with a Sloped Mainline Region under Natural Ventilation. Fire 2024, 7, 152. https://doi.org/10.3390/fire7050152
AMA Style
Lu N, Yao X, Yang J, Huang Y. Evaluating the Ceiling Gas Temperature in a Branched Tunnel Fire with a Sloped Mainline Region under Natural Ventilation. Fire. 2024; 7(5):152. https://doi.org/10.3390/fire7050152
Chicago/Turabian StyleLu, Ning, Xiaolin Yao, Jinming Yang, and Youbo Huang. 2024. "Evaluating the Ceiling Gas Temperature in a Branched Tunnel Fire with a Sloped Mainline Region under Natural Ventilation" Fire 7, no. 5: 152. https://doi.org/10.3390/fire7050152