Article

Modeling the Spatial Distribution of Wildfire Risk in Chile Under Current and Future Climate Scenarios

1
Instituto de Bosques y Sociedad, Universidad Austral de Chile, Campus Isla Teja, Valdivia 5090000, Chile
2
College of Forestry, Agriculture and Natural Resources, University of Arkansas at Monticello, 110 University Ct Monticello, Monticello, AR 71655, USA
3
Departamento de Ciencias Forestales, Facultad de Ciencias Agrarias y Forestales, Universidad Católica del Maule, Talca 3460000, Chile
4
Departamento de Ciencias Agrarias, Universidad Católica del Maule, Campus San Isidro, km 6 Camino Los Niches, Curicó 3340000, Chile
*
Author to whom correspondence should be addressed.
Fire 2025, 8(3), 113; https://doi.org/10.3390/fire8030113
Submission received: 3 February 2025 / Revised: 28 February 2025 / Accepted: 10 March 2025 / Published: 15 March 2025

Abstract

Wildfires pose severe threats to terrestrial ecosystems by causing loss of biodiversity, altering landscapes, compromising ecosystem services, and endangering human lives and infrastructure. Chile, with its diverse geography and climate, faces escalating wildfire frequency and intensity due to climate change. This study employs a spatial machine learning approach using a Random Forest algorithm to predict wildfire risk in Central and Southern Chile under current and future climatic scenarios. The model was trained on a time series dataset incorporating climatic, land use, and physiographic variables, with burned-area scars as the response variable. By applying this model to three projected climate scenarios, this study forecasts the spatial distribution of wildfire probabilities for multiple future periods. The model’s performance was high, achieving an Area Under the Curve (AUC) of 0.91 for testing and 0.87 for validation. The accuracy, True Positive Rate (TPR), and True Negative Rate (TNR) values were 0.80, 0.87, and 0.73, respectively. Currently, the prediction of wildfire risk in Mediterranean-type climate areas and the central Araucanía are most at risk, particularly in agricultural zones and rural–urban interfaces. However, future projections indicate a southward expansion of wildfire risk, with an overall increase in probabilities as climate scenarios become more pessimistic. These findings offer a framework for policymakers, facilitating evidence-based strategies for adaptive land management and effective mitigation of wildfire risk.

1. Introduction

Wildfires have big impacts on terrestrial ecosystems, leading to loss of biodiversity, altering the overall landscape, and disrupting various ecosystem services and functions [1]. Wildfires also threaten human lives, land property, and air quality [2,3,4]. Over the last decades, the burn area, frequency, and intensity of wildfires have increased globally [5,6]. These changes in fire regimes are closely related to anthropogenic climate change, characterized by higher air temperatures, shifts in precipitation patterns, and prolonged dry seasons [7,8,9,10]. In this context, Chile ranks among the most vulnerable countries to climate change, which is influenced by its geographical and climatic diversity [11]. The country has experienced significant wildfire events throughout its history, with a pronounced increase in frequency and intensity over the years [5,12]. Recently, in the years 2017 and 2023, the country experienced the largest wildfires in its history, affecting 560,000 and 440,000 hectares, respectively [3,13]. These increases in wildfire activity are driven by climatic factors, such as prolonged droughts and extreme weather conditions, as well as human activities such as land-use changes and forest management practices [14,15]. The country’s diverse climatic and geographical conditions, particularly in the south-central regions, result in significant variability in fire regimes across the country [16,17]. In Chile’s south-central region, Mediterranean shrublands and sclerophyllous forests coexist with temperate deciduous forests, and this region is considered globally relevant for its high level of biodiversity and endemism [18]. In this area, plentiful vegetative biomass combined with seasonal drying leads to some of the highest levels of fire activity in South America [5,19]. Over the past few decades, extensive industrial plantations of Eucalyptus and Pinus species, uniform in structure and composition, have rapidly expanded across this region, supplanting a more diverse landscape and leading to the condition of an anthropogenic landscape [20]. Also, crop stubble-burning practices could be responsible for large fires in this zone, particularly in annual crop fields [21]. Combined with rising temperatures and drought, this increased continuity of flammable woody material linked to plantation expansion and agricultural practices is believed to alter the fundamental conditions governing wildfire activity [5]. Similar behavior has been documented in southern Europe, where land changes are promoting wildfires [22], and the increasing dryness with climate change could have aggressive effects on the fire regime by leading to larger fires in summer in Southern France [23] and California [24].
Thus, under future climatic scenarios, there is a need to have a deeper understanding of the fire dynamic and the development of advanced risk prediction models [25,26]. These models must also adopt a region-specific approach to develop effective management strategies, such as the one in the Chilean context [5,21]. Chile is experiencing a rising trend in wildfire occurrence and spread, fueled by climate change and anthropogenic pressures. This underscores the need for more effective territorial planning and policy measures to prevent and mitigate these events.
Technological advancements have significantly enhanced our capacity to assess wildfire risk [4,27]. Existing prediction tools often rely on physical processes or empirical studies, primarily focused on current risks derived from historical data [28]. However, modeling wildfire risk under future climate change scenarios presents unique challenges and requires more sophisticated approaches [4,7,29]. Machine learning (ML) has recently emerged as a powerful tool in wildfire risk prediction, offering advanced methods to analyze complex datasets and uncover patterns with unprecedented accuracy [30]. By integrating historical fire data, climatic variables, vegetation types, and human activities, ML enables more precise projections of future wildfire occurrences [21,31,32]. Techniques such as neural networks, decision trees, and support vector machines effectively capture the nonlinear and complex relationships among wildfire predictors [30,33,34]. However, the accuracy of these models largely depends on the quality, availability, and spatial resolution of input data, which are often inconsistent across regions [4,33]. Additionally, tailoring these models to local conditions through feature selection and parameter tuning is critical for their effectiveness [35,36]. ML methods are widely used for wildfire risk mapping [37,38], but face challenges in explainability, often appearing as “black boxes” [39]. eXplainable Artificial Intelligence (XAI) aims to create transparent, interpretable models that foster trust and uncover biases [40]. Most wildfire-focused XAI research, however, emphasizes global feature importance rather than factor variability [41]. Incorporating local explainability tools like SHapley Additive exPlanations (SHAP) can enhance model acceptance by clarifying how decisions are made [42,43].
Integrating climate change scenarios into wildfire risk models is also crucial for anticipating changes in fire frequency, intensity, and spatial distribution. Spatial modeling is a valuable analytical tool for understanding forest fire risk, as it offers more profound insights into fire-prone areas and their local conditions related to potential fire spread [44]. The results of these approaches can exhibit spatial consistency with the distribution of incidents, enabling us to understand how various factors influence fires, characterize their spatiotemporal patterns, and map the spatial variability in the probability of occurrence across the territory [21].
This is needed to guide adaptive management strategies to mitigate the impacts of varying wildfire risks under different climate scenarios [5,18]. Several anthropogenic climatic forcing scenarios are typically considered to model the effect on climate variables [45]. The optimistic scenario assumes effective mitigation of greenhouse gas emissions, leading to slower climate change and moderate increases in wildfire risk [46]. The intermediate scenario, reflecting partial success in emission reductions, aligns with current global trends and serves as a realistic planning framework [47,48]. The pessimistic scenario, assuming continued high emissions, predicts rapid climate change, with drastic increases in wildfire frequency and intensity due to higher temperatures and altered precipitation patterns [2,7,49]. Additionally, special attention must be given to modeling wildfire risks in urban–rural interfaces (URIs). These areas, where the natural and urban zones intersect, are particularly vulnerable and pose significant challenges for wildfire management [50]. Increasing urbanization and land-use changes have intensified wildfire risks in these areas, jeopardizing human communities and ecosystems [51].
This study aims to predict the probability of fire occurrence in Central and Southern Chile under current and future climate scenarios. Contrary to the common practice of focusing exclusively on overall feature importance, this research addresses a critical shortfall by deploying an XAI technique that uses summaries and dependence plots to thoroughly evaluate each variable’s contribution, thereby heightening both the interpretability and the dependability of the findings. The specific objectives are to (1) identify climatic, land use, and physiographic variables for predicting recent wildfire patterns, (2) assess a wildfire risk model under three distinct climate scenarios—optimistic, intermediate, and pessimistic—and (3) analyze the probability of fire occurrence in different land-use zones and urban–rural interfaces under present and future conditions. The findings will provide critical insights into the effects of climate change on wildfire risks in Central Chile, informing policymaking and supporting the efforts of governmental agencies, environmental planners, and stakeholders in fire management.

2. Materials and Methods

2.1. Study Area

The study area extended from 34° to 44° south latitude in mainland Chile, covering seven administrative regions in the central and southern parts of the country (from the O’Higgins region to the Los Lagos region) (Figure 1). The land use in this area includes forest plantations, shrublands, grasslands, and crops [52]. It is also home to 86% of the country’s population and the epicenter of more than 90% of historically recorded wildfires [18]. This area is the most vulnerable to increased wildfire frequency due to climate and land-use changes [12,21].
The study area has significant climatic variation. In the central zone (34–37° south latitude), a Mediterranean-type climate predominates, characterized by dry and warm summers, and mild and wet winters. The annual precipitation ranges from 100 to 500 mm [17]. Summer maximum temperatures can exceed 30 °C, leading to vegetation moisture loss and increasing fire susceptibility [5]. The combination of summer droughts and occasional strong winds creates conditions conducive to rapid fire spreading [3]. The predominant natural vegetation in this zone is of the sclerophyllous forest type, with hard-leafed trees such as Nothofagus obliqua, Quillaja saponaria, Peumus boldus, and Cryptocarya alba [53]. In drier areas, drought-resistant shrubs like Lithraea caustica, Vachellia caven, and Rosmarinus officinalis dominate [54]. A diverse richness of natural grasses and herbs is also found in grazing areas.
In contrast, the southern zone (37–44° south latitude) features a temperate climate with cold and wet winters, with annual precipitation ranging from 1000 to 1500 mm, resulting in wetter summers than in the central zone [55]. Despite the moderate temperatures, winter rainfall can produce excessive vegetation, fueling summer fires, especially during exceptional droughts or when combined with high temperatures and winds [21]. The dominant natural vegetation in this region is of the temperate forest type, with tree species such as Nothofagus dombeyi, Luma apiculata, Podocarpus salignus, and Fitzroya cupressoides, accompanied by a rich coverage of ferns, mosses, and lichens [56].

2.2. Factors Influencing Wildfires

Several climatic, physiographic, and land-use factors were identified as influential in wildfire behavior. Climatic variables included temperature [26,57,58] and precipitation [5,7,19,20,31], which condition the vegetation’s susceptibility to fire. Physiographic variables included elevation [34,57] and slope [21,34,59], and the land-use categories [31,34], which accounted for the spatial distribution of ignitions and fire spread.

2.3. Fire Occurrence Data

Fire detection through satellite remote sensing has become essential for understanding fire regimes, evaluating their impacts on ecosystems, and informing fire management strategies [60]. Several global burned-area products, such as MODIS MCD64A1 [61], ESA FIRECCI51 [62], MERIS FIRECCI41 [63], or the GFED (Global Fire Emissions Database) [64], systematically map fire extent and timing, typically at coarse spatial resolutions (250–1000 m). The ESA FIRECCI51 product was chosen for Chile’s central and southern wildfires primarily because it offers a finer spatial resolution (250 m) than its MODIS counterparts (e.g., MCD64A1 at 500 m), enhancing its detection capability of smaller fires. Coarse-resolution datasets may underrepresent these smaller events, which are common in Mediterranean ecosystems and can collectively contribute significantly to the total burned area [60]. FIRECCI51 incorporates improvements in its detection algorithms, reducing border effects and capturing low-intensity fires better than previous ESA products, which is crucial for robust wildfire analysis at local to national scales [65]. Consequently, fire occurrence data were obtained from the FIRECCI51 global burned-area product of the European Space Agency [62]. This dataset consists of georeferenced images with a spatial resolution of 250 m, including attributes such as detection date, confidence level, and land cover type affected by fires according to the Land Cover CCI [66]. FIRECCI51 data were processed in Google Earth Engine [67] and resampled to a resolution of 500 m from 2001 to 2018 (Figure 1).

2.4. Physiographic, Climatic, and Land-Use Data

Elevation data were obtained from the Shuttle Radar Topography Mission product [68], which provides global-scale data at a 30 m resolution. To match the spatial resolution of the several factors that influenced wildfires, we resampled the elevation data to 500 m using cubic convolution that better preserves continuity and smooth transitions without losing too much precision. Land-use data were sourced from the Chilean Land Cover product, which is derived from 2013–2014 Landsat 7/8 images with 30 m of spatial resolution and an accuracy of 80% for land-use category mapping [52].
Climatic data and future projections were provided by Bioforest (https://arauco.com (accessed on 1 February 2025)). Between 2001 and 2017, daily minimum and maximum air temperatures and precipitation were collected from 103 and 321 weather stations, respectively. A data quality control procedure was performed using multiple linear regression with observations from nearby stations to address anomalies such as missing, duplicated, or unrealistic values. Subsequently, these stations’ monthly minimum and maximum temperature and precipitation data were integrated with MERRA-2 satellite data and interpolated at a 500 m resolution [25]. This approach was applied to the HadGEM2-ES model [69], which aligns with the average outcomes of 15 CMIP5 models [45] across various regions in Latin America [70] and demonstrates strong performance in Central Chile [25].
The future climate projection considered the 2020–2060 period, and the representativity of future scenarios was based on Van Vuuren et al. [71], which considered three greenhouse gas Representative Concentration Pathways (RCPs): (i) RCP 2.6, an optimistic scenario involving sufficiently ambitious emission reductions often seen as the most ambitious pathway for limiting global warming to around 2 °C above pre-industrial levels (or even slightly below); (ii) RCP 4.5/6.0, a moderate (or stabilization) scenario in which emissions peak by 2050 and decline significantly by 2080; and (iii) RCP 8.5, a pessimistic high-emission scenario that assumes continuous increases in greenhouse gases throughout the 21st century, resulting in the highest concentrations and, consequently, the most extreme climate changes among the evaluated scenarios. To assess the impact of climate change on the probability of fire occurrence, we used projected climate data for the RCP 2.6, 4.5, and 8.5 scenarios. Due to a lack of climatic data fitted to local conditions, we could not count on the RCP 6.0 scenario.

2.5. Modeling the Probability of Fire Occurrence

2.5.1. Construction of Predictor Variables

The modeling of the probability of fire occurrence began by constructing the different predictor variables (Table 1). Climatic variables were calculated from monthly temperature and precipitation data for 2001–2017 (Table 1). For temperature (15), the minimum, mean, and maximum values were averaged seasonally and annually over the 2001–2017 period. For precipitation (6), the seasonal and annual means were calculated for the same span, as was the average accumulated precipitation. Physiographic variables (2) considered the elevation and the slope derived from elevation data using the generic terrain analysis algorithm implemented in QGIS (version 3.28.12) [72]. Land-use variables (8) were calculated as the proportion of land occupied for agriculture, native forest, plantations, grasslands, urban areas, wetlands, barren soils, and shrublands within a 500 m pixel size [58]. All variables were reprojected to the same coordinate system (EPSG: 4326), clipped to the same extent, and transformed into a raster format. Variable processing was performed using the R 4.4.1 programming language and environment [73]. Thirty-one predictor variables were constructed and employed to train wildfire occurrence models [21,30]. The response variable, representing wildfire occurrences was derived from burn scar data [31] from the FIRECCI51 annual series compilation for 2001–2018.

2.5.2. Training Dataset

A dataset of 16,100 points with a random spatial distribution was initially generated across the study area to calibrate wildfire occurrence models. Although RF can be robust to spatial autocorrelation with large samples [31], we decided to use a minimum distance filtering approach to reduce an eventual spatial autocorrelation, ensuring no two points were closer than the 1 km threshold [42]. This filtering process resulted in a subset of spatially independent points while maintaining sufficient coverage across the study area. These points were classified into two categories, (1) burned and (0) unburned, maintaining a balanced proportion between the two [36]. At each sampling point, values for the predictors and response variable were collected [21]. Subsequently, this dataset was divided into 70% for training and 30% for model testing [31,34].

2.5.3. Modeling Algorithm

The algorithm selected for modeling was Random Forest (RF) [74], a non-parametric ensemble technique. RF has been successfully used to estimate probabilities of fire occurrence in various contexts [21,32,36]. RF can be trained iteratively with a random subset of data [31] and improves decision tree models by providing high classification efficiency and robustness against outliers [36]. This algorithm also facilitates the analysis and the evaluation of variable importance by measuring accuracy decrease [30].

2.5.4. Model Calibration

The RF model was calibrated using the training dataset and the “caret” package (version 6.0-94) [75] in R [73]. Prior to training, hyperparameters—the number of trees (ntree), the minimum node size (nodesize), and the number of variables per split (mtry)—were configured [35] to prevent overfitting and to improve model generalization. The ntree value was 500 [30,36]. The nodesize parameter was explored within a range of 1–500 to balance generalization and precision. At the same time, mtry was tested within a range of 1 to n (where n is the total number of variables) to find the optimal value by minimizing error rates [35].
A preliminary model was created with RF to identify the percentage contributions of all predictor variables (Table 1). Pearson correlation analysis was used to remove irrelevant or highly correlated variables. This iterative process continued until a subset of variables contributed over 5% and with no significant correlation (r < 0.8 and r > −0.8) (Figure 2). After that, a new model was trained with this subset of variables to evaluate their contributions. To strengthen the model, we applied 10-fold cross-validation, where each fold was successively excluded from training and used for testing [34]. Additionally, to prevent bias or overfitting, we repeated this training process 10 times with new divisions in each iteration [31]. The transparency of ML models, a central focus of XAI, emphasizes the critical role of conditioning factors in predictions, allowing analysts to discern which elements the models prioritize when assessing forest fire susceptibility [41]. XAI methodologies include global approaches that examine the overall impact of essential factors (e.g., permutation feature importance, impurity decrease, information gain) and local strategies that address individual predictions. SHAP is a commonly used local method for clarifying each factor’s contribution in particular cases [40]. We used the Kernel SHAP package (version 0.5.0) [76] in R, which provides SHAP dependence plots to illustrate how model outputs shift based on specific values, thereby highlighting trends and critical thresholds in fire susceptibility [32,42]. This framework aids in pinpointing key patterns among the variables influencing the likelihood of forest fires. The final model was used to predict the spatial distribution of the probability of fire occurrences under current conditions [21,30] and various projected climate change scenarios [2,26]. Future projections accounted for climate variables as dynamic factors, while agricultural land use and elevation were kept constant.

2.5.5. Performance Evaluation Metrics

To assess the model’s performance, we used the 2017–2018 FIRECCI51 data, which had not been included in the training process, as validation data. We compared the validation data with predictions and generated a Receiver Operating Characteristic (ROC) curve to verify the model’s predictive accuracy. The ROC is a threshold-independent method used to measure model performance regarding fit and generalization [21,30]. It is constructed by plotting sensitivity (true positive rate) against the false positive rate (1-specificity) [31]. Additionally, the AUC was calculated as a quantitative metric of model performance, where a value of 1 indicates perfect prediction and a value below 0.5 suggests poor performance [30]. A model is considered good to excellent if the AUC exceeds 0.8 [34]. For imbalanced problems like wildfires, where fire events are less frequent than non-fire events, metrics such as accuracy, true positive rate (TPR), and true negative rate (TNR) are necessary for a more comprehensive performance evaluation [32].
accuracy = (TP + TN)/(TP + FP + TN + FN)
TPR = TP/(TP + FN)
TNR = TN/(TN + FP)
where TP = true positives (correctly identified fires), FP = false positives (non-fire cases misclassified as fires), TN = true negatives (correctly identified non-fires), and FN = false negatives (fires not detected or misclassified as non-fires).

2.5.6. Spatialization of the Model in Current and Future Scenarios

The developed model and selected predictor variables were used to predict probabilities of fire occurrence under the current scenario. Additionally, using predictive climate variables for different climate change scenarios, probabilities of fire occurrences were projected for RCP 2.6, 4.5, and 8.5 for the periods 2020–2040 and 2040–2060. These timeframes ensured that projection periods aligned with the model training period [59].

2.6. Characterization of the Probabilities of Fire Occurrence for Land Uses and Interface Zones

Probabilities of fire occurrence for current and future scenarios were characterized by extracting model-provided values for each land-use category. Additionally, the probabilities of fire occurrence were analyzed in relation to interface zones based on their spatial distribution. These interface zones were delineated by the Forest Fire Protection Office (GEPRIF) of the Chilean Forest Service (CONAF) through visual interpretation of high-resolution images [77]. The interface categories considered were as follows:
Principal: Areas within 500 m of cities with over 5000 inhabitants.
Secondary: Areas within 300 m of towns with 2001–5000 inhabitants.
Village: Zones within 150 m of settlements with 301–2000 inhabitants.
Rural housing: Zones within 50 m of isolated rural dwellings.

3. Results

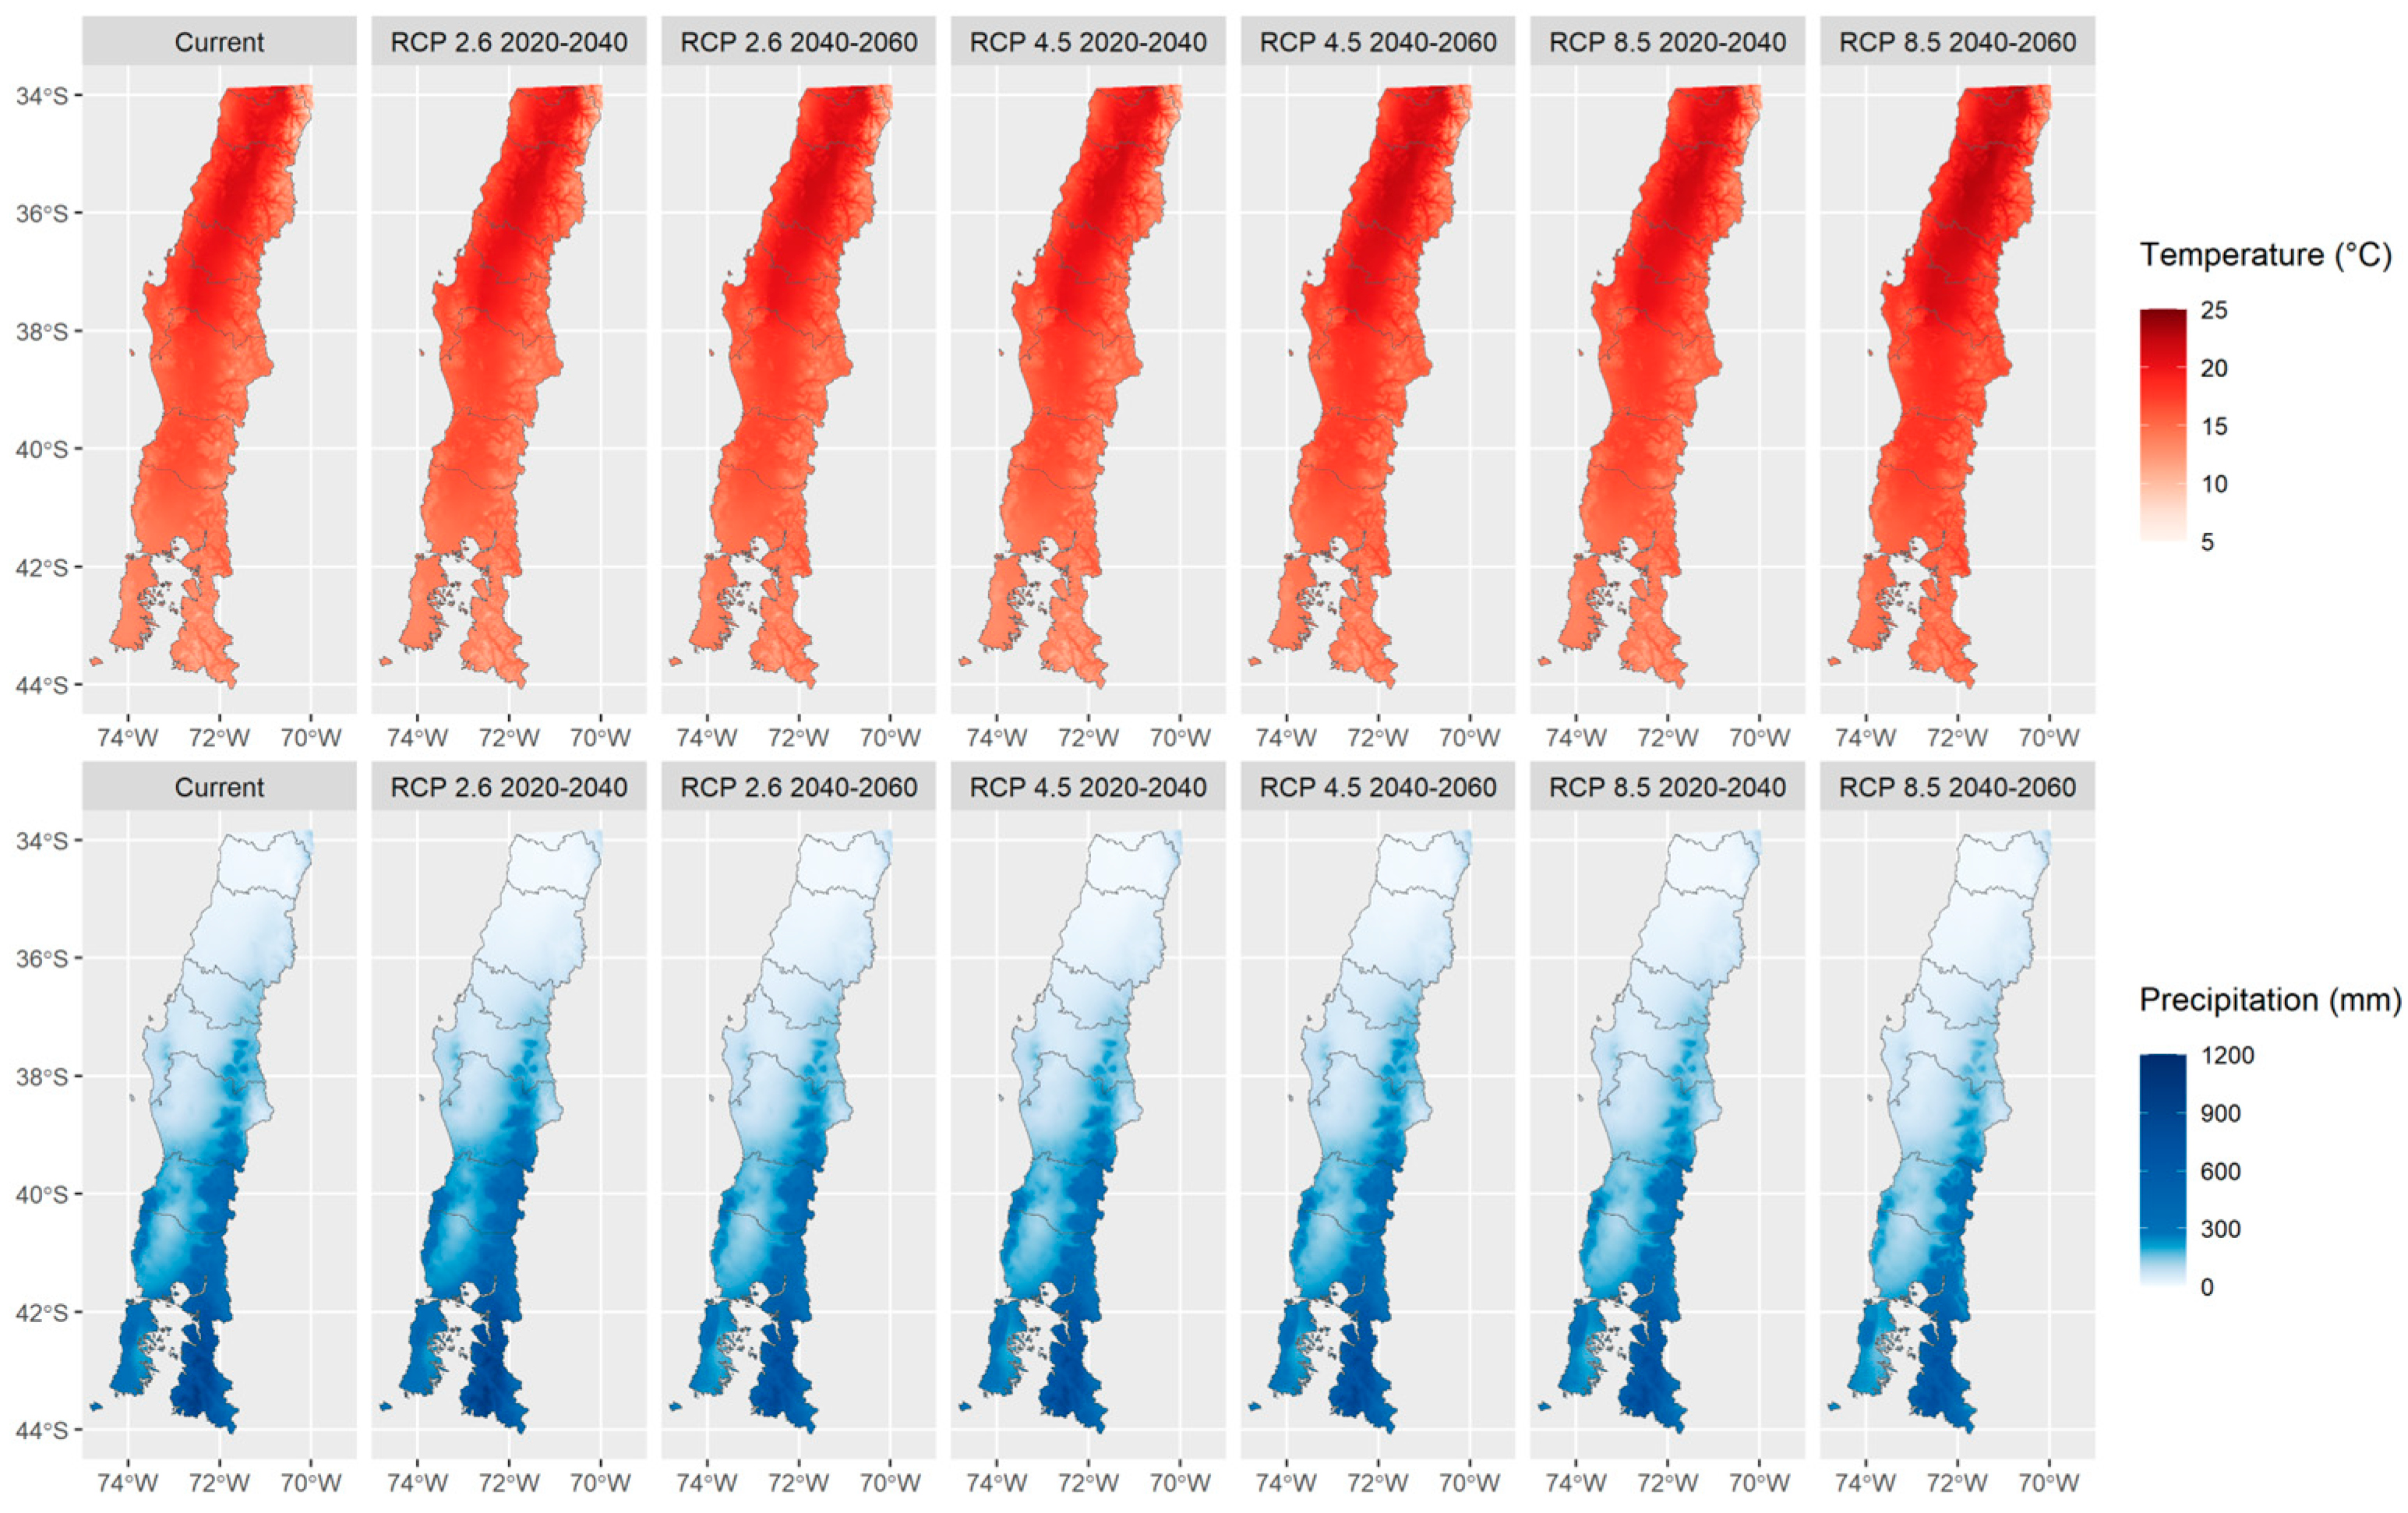
3.1. Spatial Distribution of Fires and Climatic Variables in South-Central Chile

Figure 1 illustrates the spatial distribution of fires detected by the FIRECCI51 product during 2001–2017. A higher concentration of fires was observed in the Coastal Mountain Range and the Central Interior Valley of the central regions, with a notable reduction in fire activity in the Andes Mountain Range and the southern Araucanía region. Figure 3 shows that the largest burned areas, both annual and total, were in the Araucanía region, followed by the Maule, Bío Bío, and Ñuble regions. Comparing the two regions with the highest total burned area, the Araucanía region had over 3-fold the burned area of the Maule region. In contrast, the Los Ríos and Los Lagos regions exhibited the lowest burned-area values.
Summer average temperature and precipitation were identified as influential factors for the probability of fire occurrence (Table 2). Figure 4 illustrates the spatial distributions for precipitation and temperature under the current scenario and projected climate changes. For the RCP 2.6, 4.5, and 8.5 scenarios, the average temperature showed increases of 0.93 °C, 1.50 °C, and 2.37 °C, respectively, relative to current conditions, while the precipitation decreased by 13.67%, 12.97%, and 29.04%, respectively.

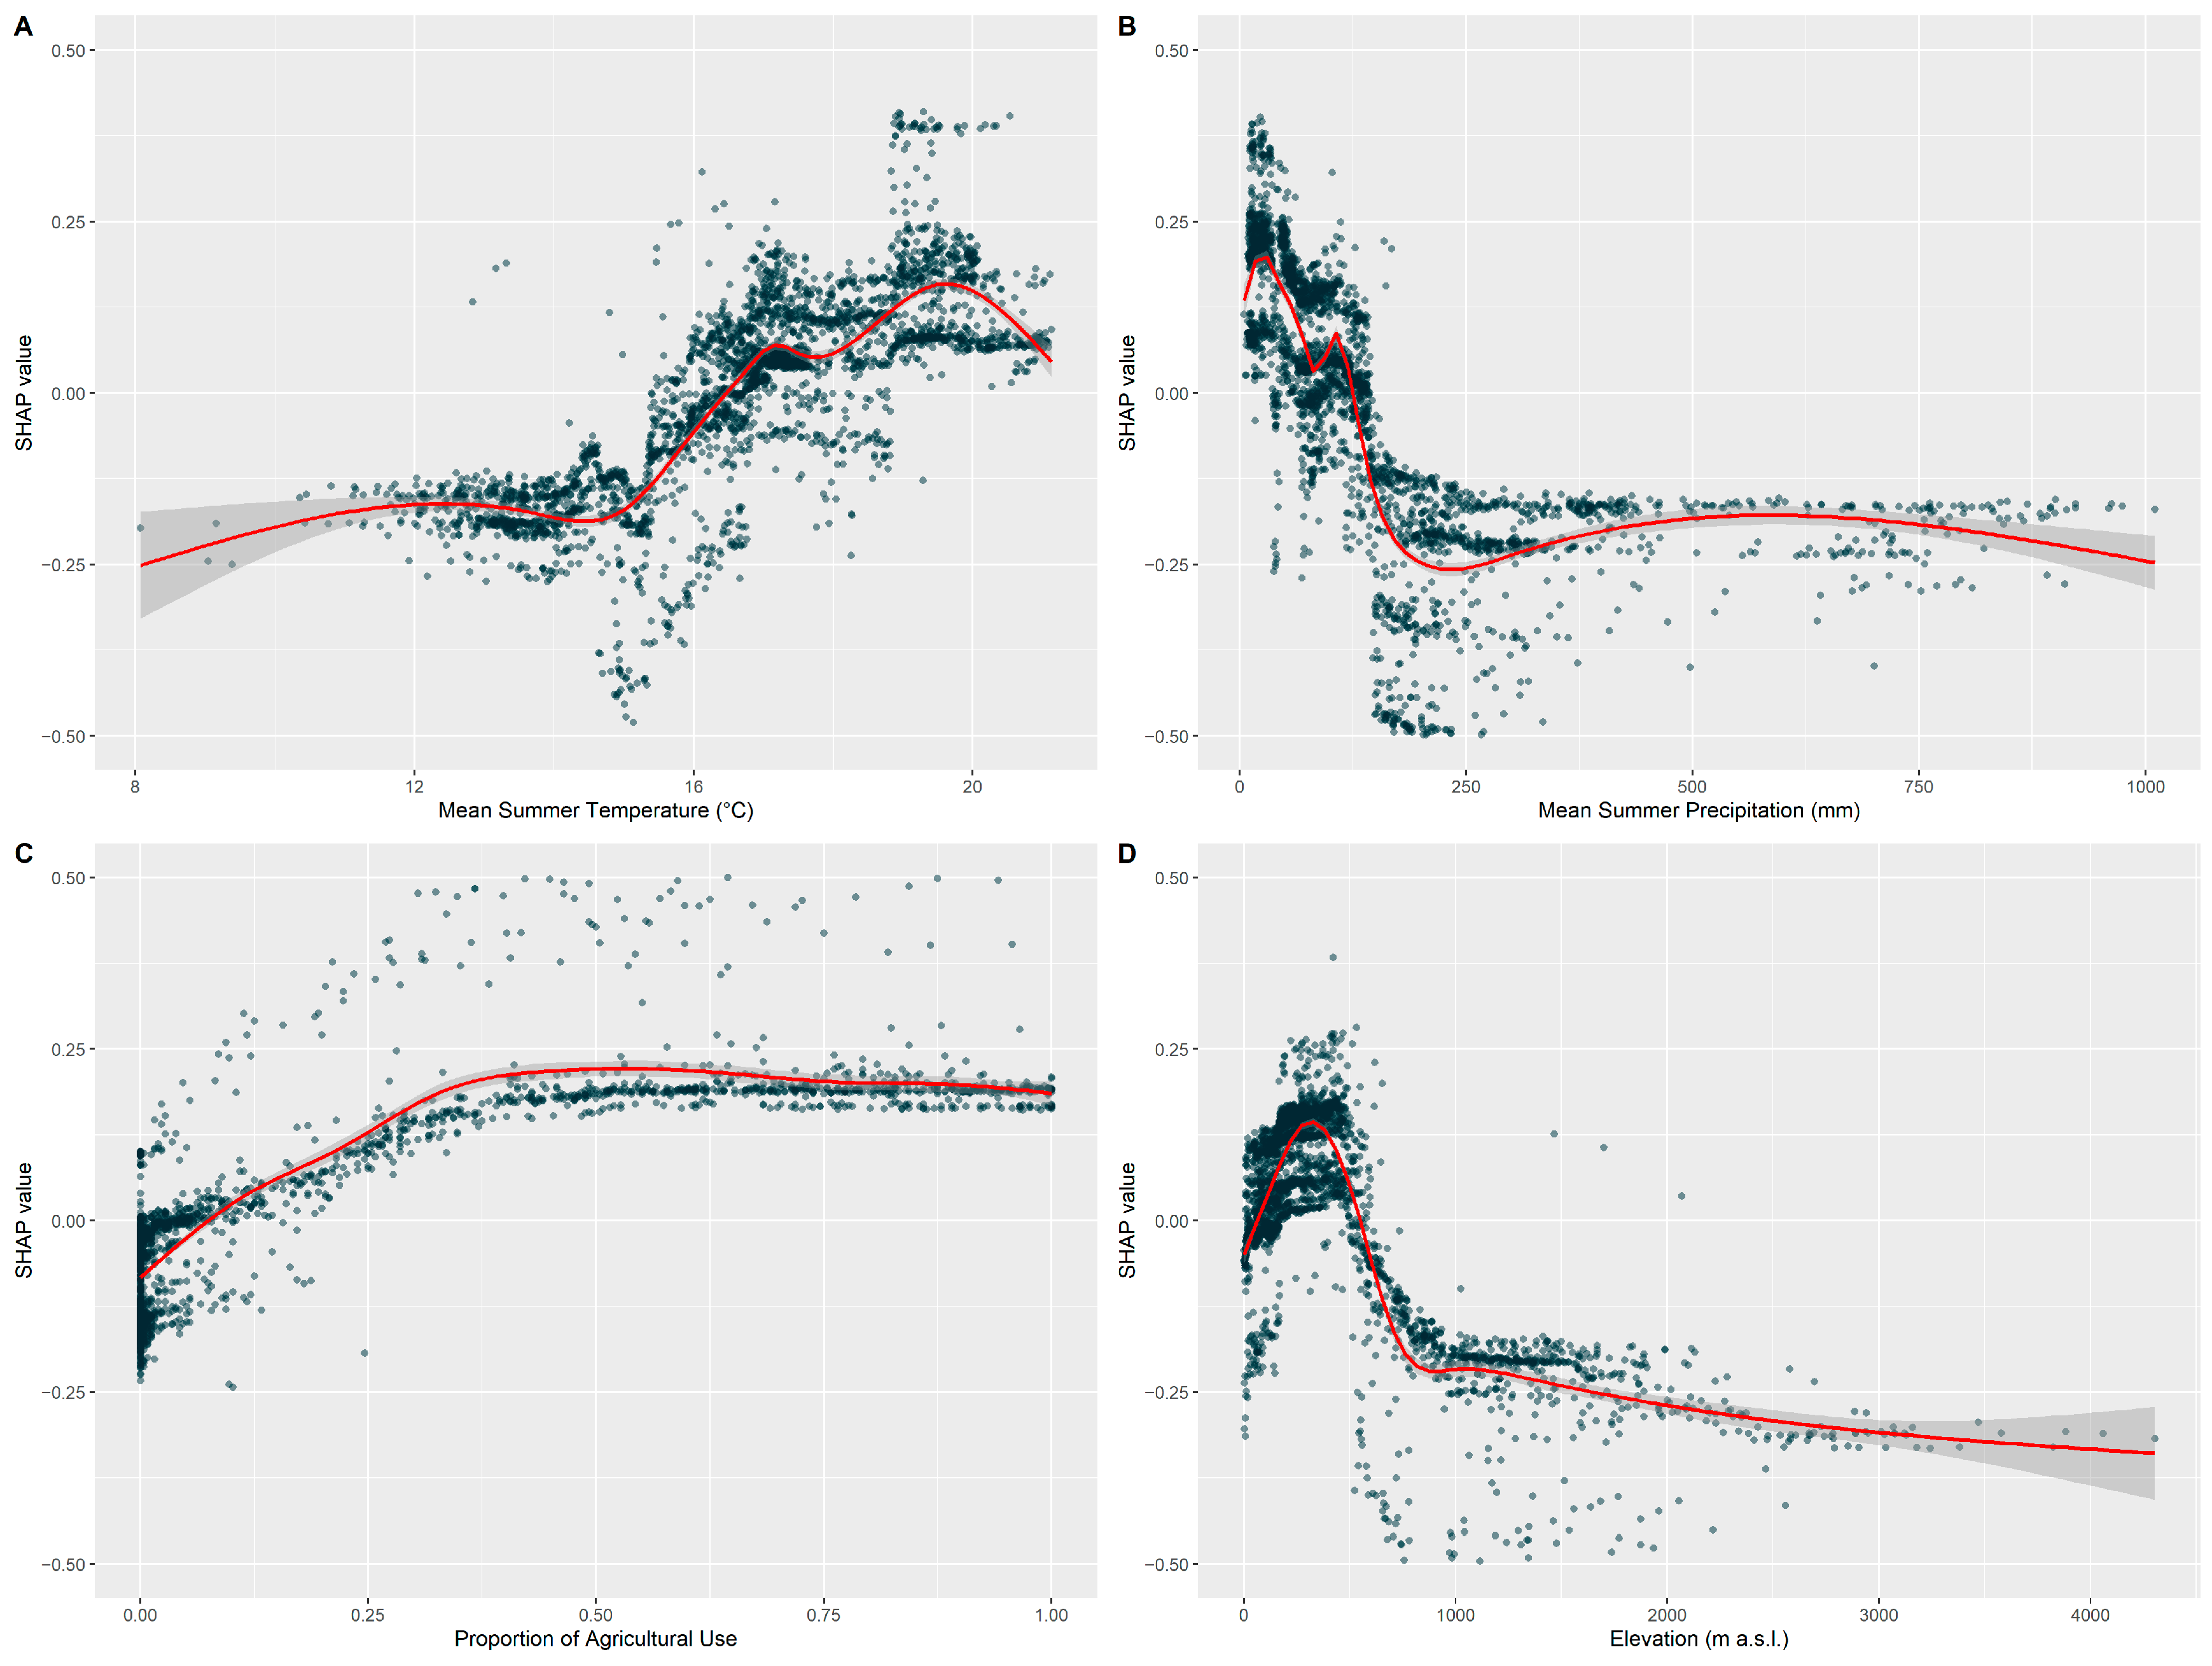
3.2. Modeling the Probability of Occurrence

The hyperparameter tuning for RF determined that values of mtry = 4, nodesize = 100, and ntree = 500 provided adequate model accuracy without compromising generalization.
Regarding model performance, it achieved an AUC of 0.91 with the test dataset and an average value of 0.87 when evaluated against the 2017–2018 FIRECCI season. Accuracy, TPR, and TNR values were 0.80, 0.87, and 0.73, respectively.
Relationships between the selected variables and the probability of fire occurrence model exhibited nonlinear behavior (Figure 5). The probability increased with summer temperature, particularly in the range between 17 °C and 20 °C, then showed a slight decrease (Figure 5A). On the other hand, we found low probabilities of fire occurrence with lower summer precipitation and elevation (Figure 5B,D). An asymptotic-like relationship was identified for agricultural land use, with maximum probabilities observed when the percentage of agricultural use exceeded approximately 35% (Figure 5C).

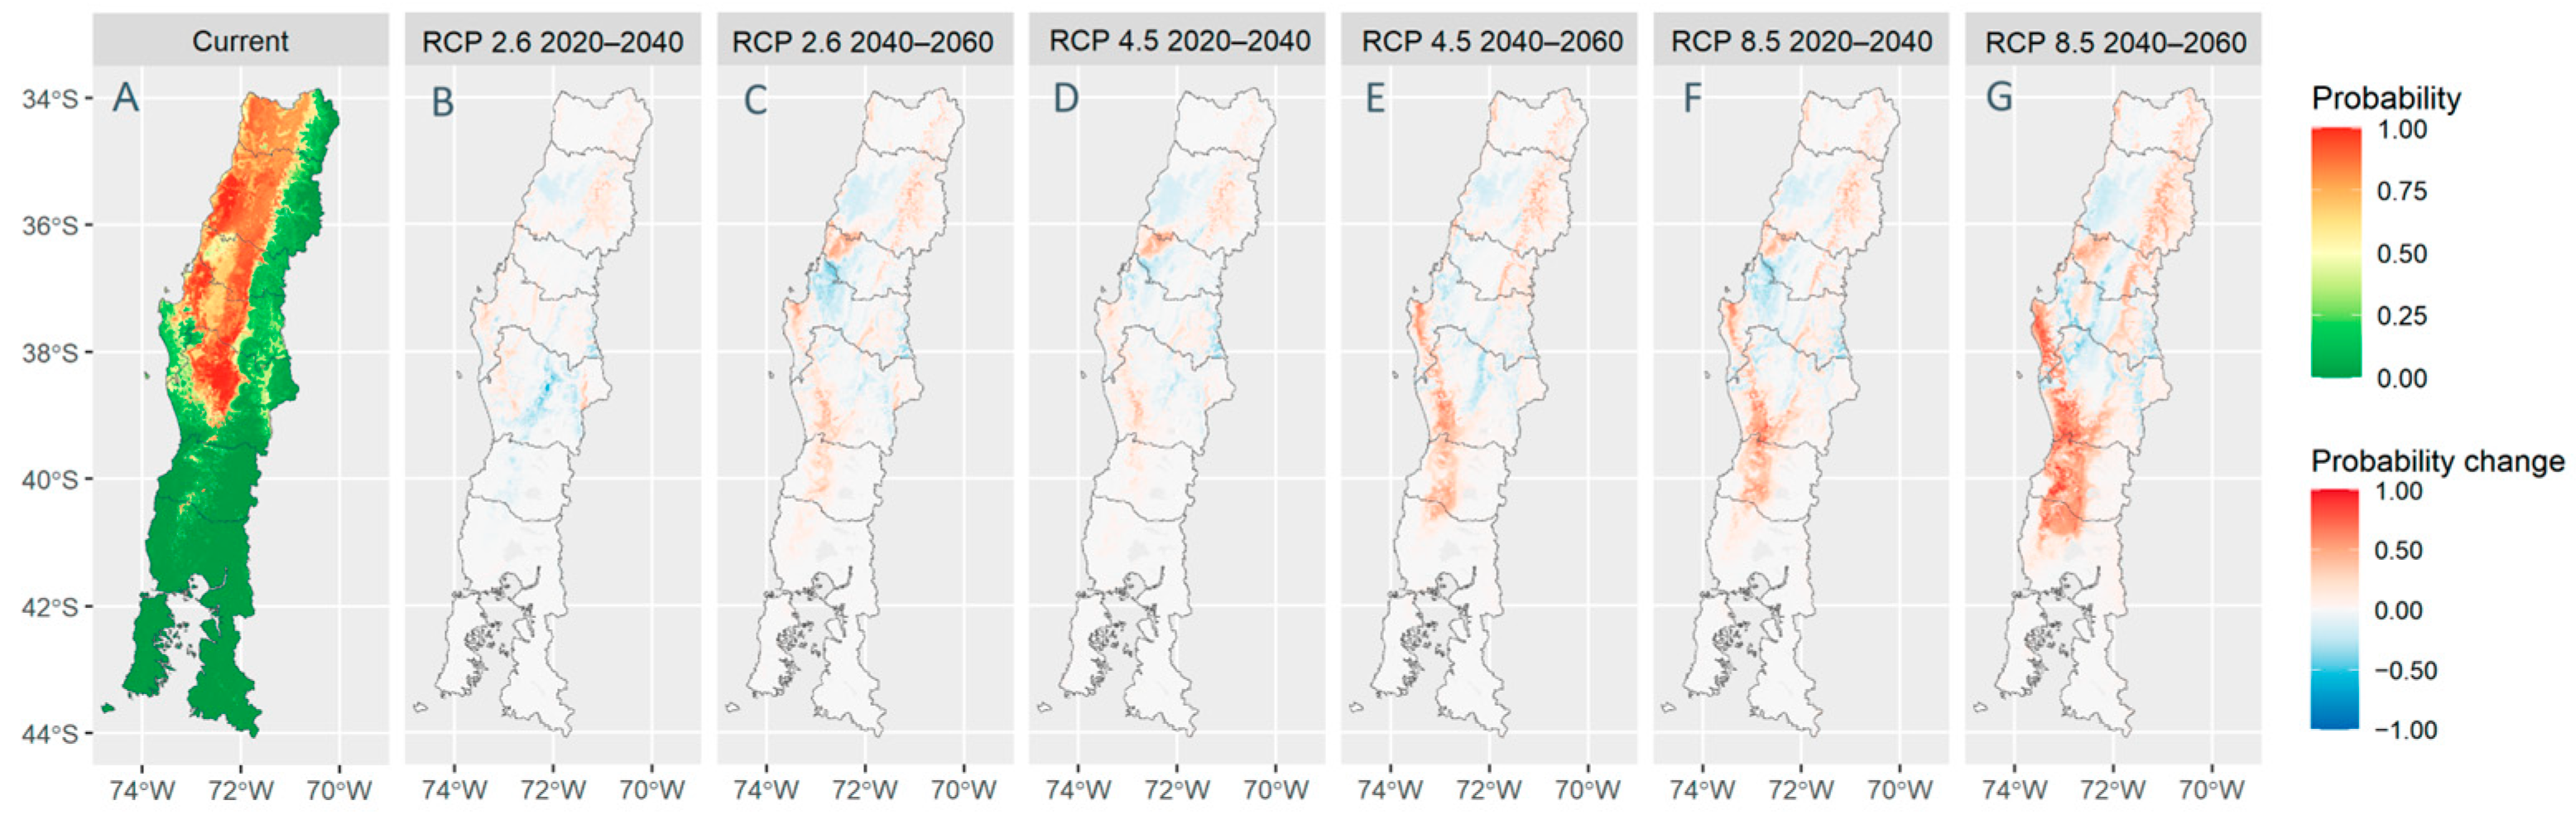
3.3. Current Spatial Distribution of Probability of Fire Occurrence

The calibrated model using historical data revealed that probability of fire occurrence exhibited high values in the Coastal Mountain Range and Central Interior Valley, particularly between the O’Higgins region and the northern Bío Bío region, as well as in the Central Interior Valley in the Araucanía region (Figure 6A). In contrast, lower values were observed throughout the Precordillera (i.e., Andes piedmont) and Andes Mountains from the O’Higgins to La Araucanía regions and in almost all the zones from the Los Ríos region southward.

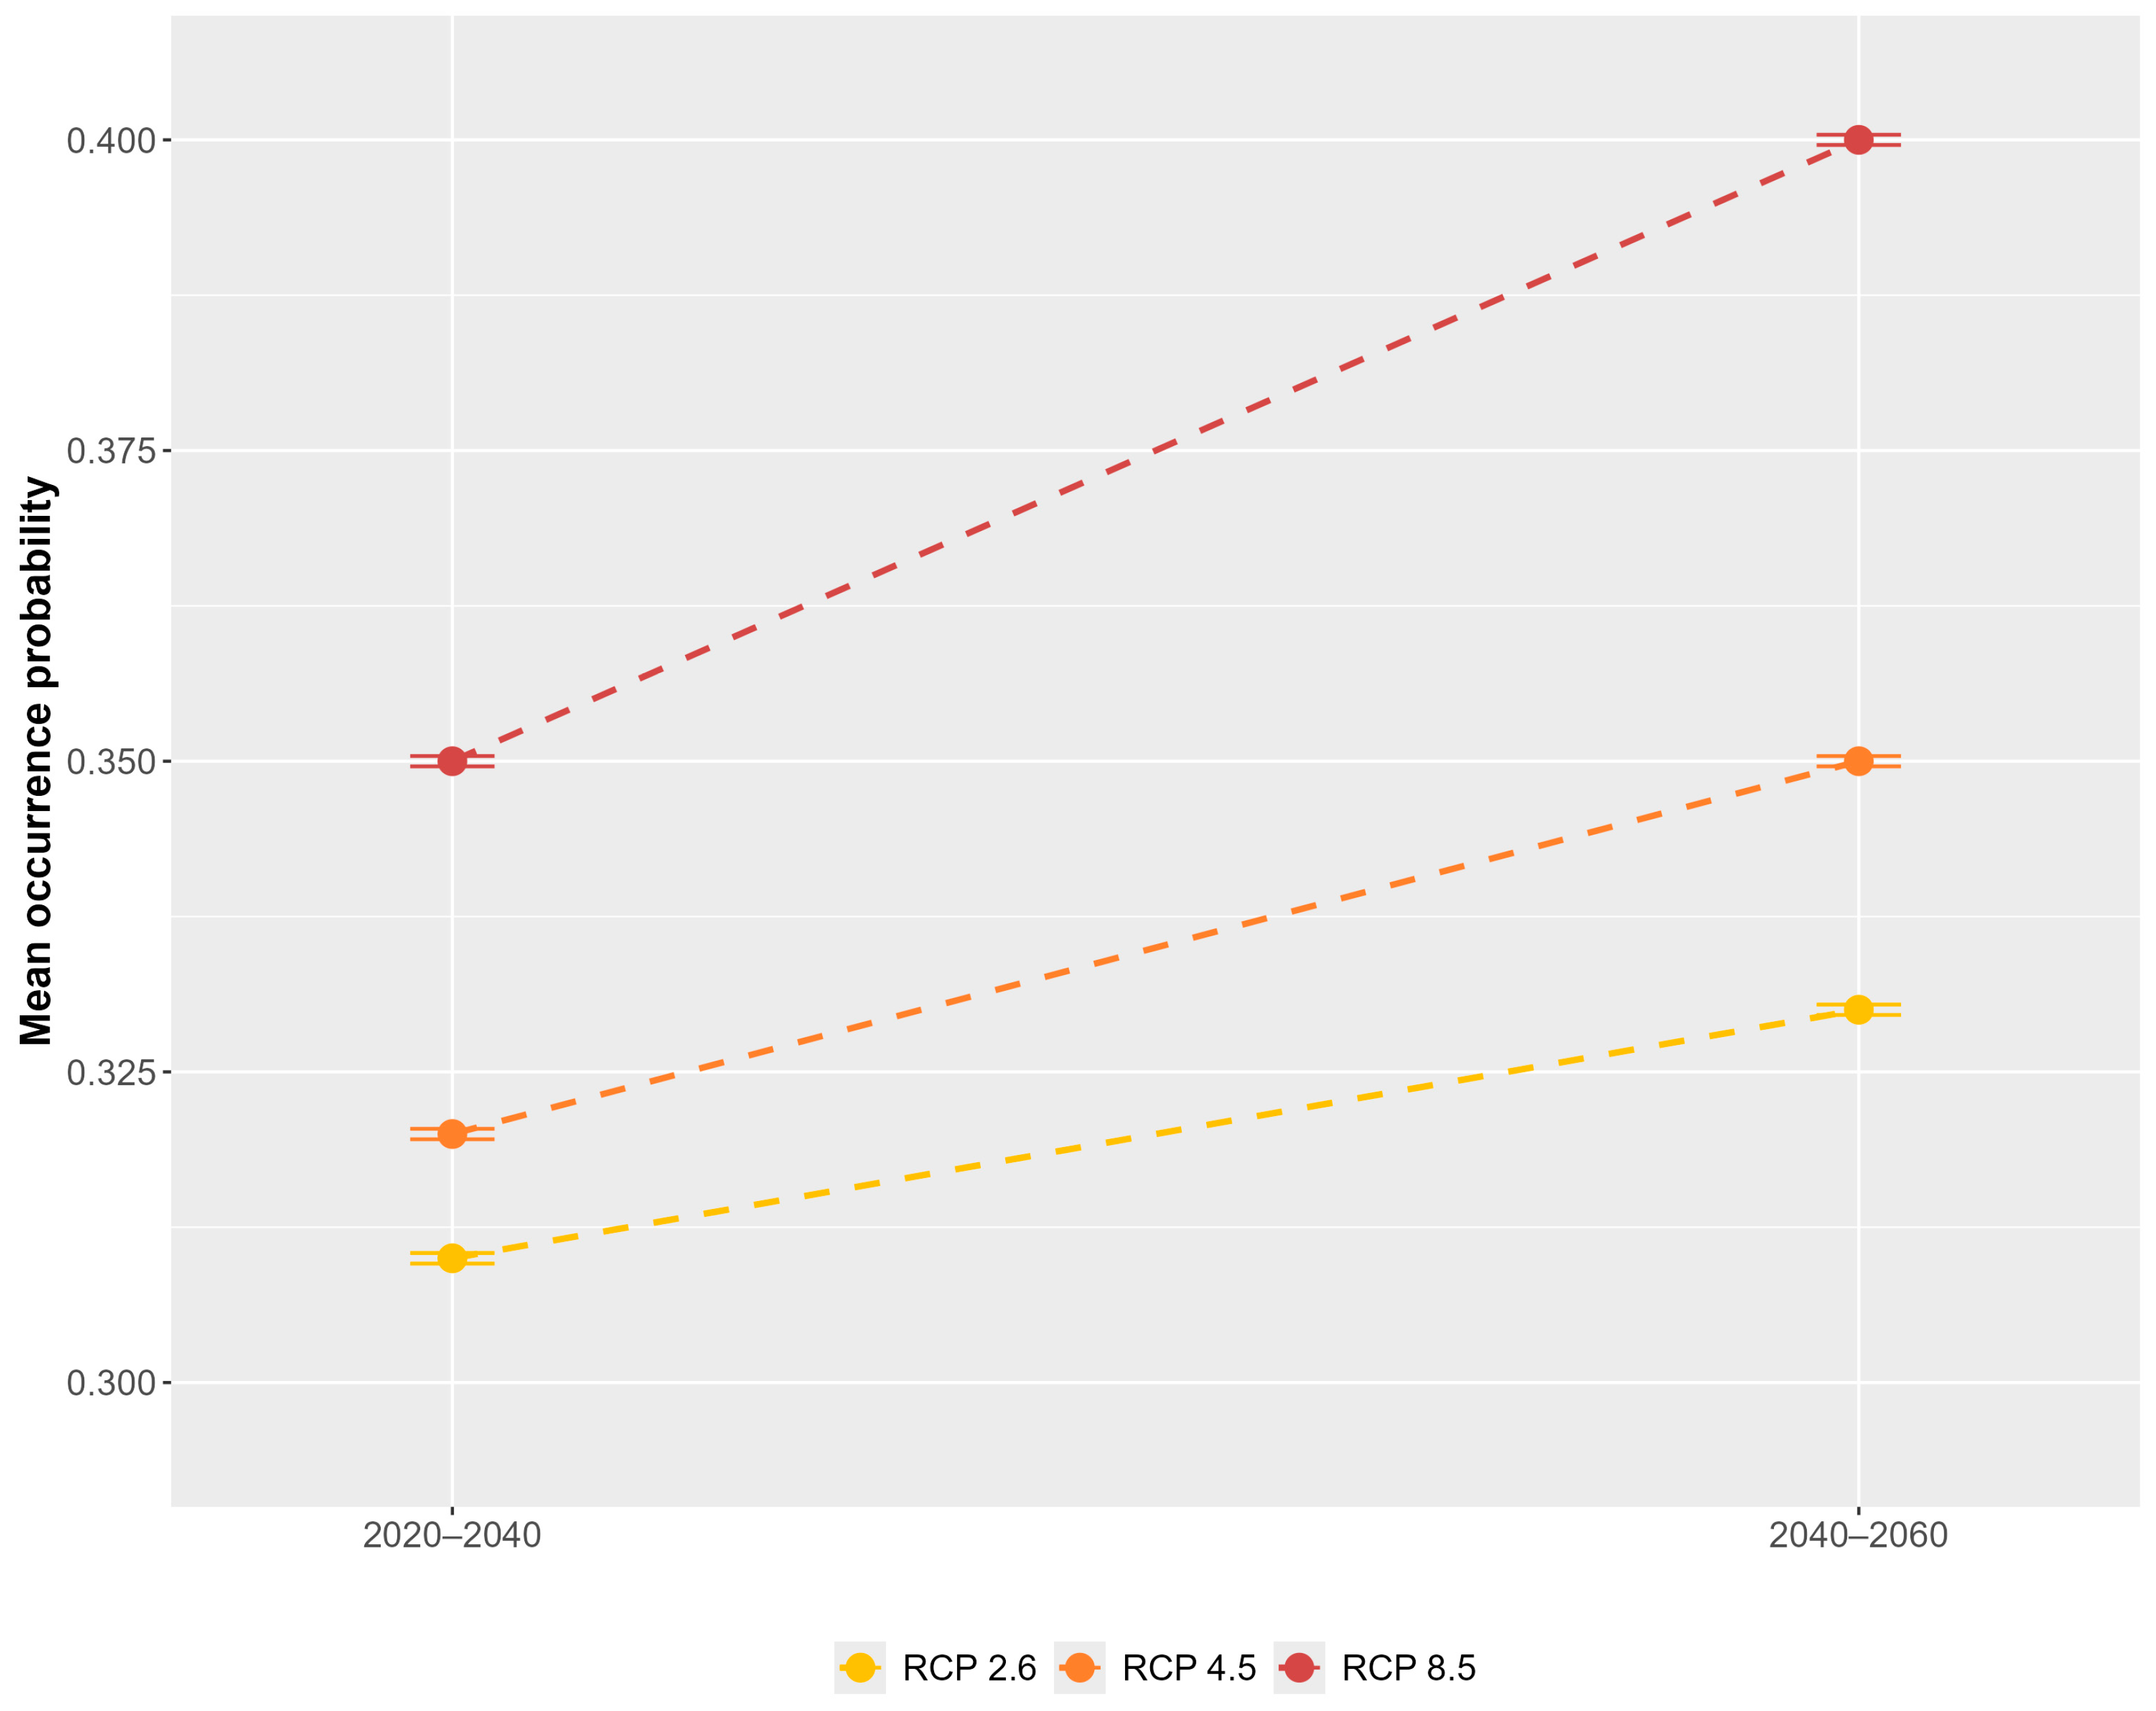
3.4. Future Spatial Distribution of Probability of Fire Occurrence

Future projections of probability of fire occurrence under various climate periods and scenarios showed a general northward shift with higher probability values in the Precordillera and a southward shift in the Coastal Mountain Range, increasing noticeably with time and getting worse when moving toward the pessimistic climate change scenario (Figure 6B–G). Specifically, the Precordillera experienced significant increases from the O’Higgins to the Ñuble region. In contrast, the southern Coastal Mountain Range experienced increases extending into the Central Interior Valley from the Bío Bío to Los Lagos regions. However, in some areas, such as the northern Coastal Mountain Range in the Bío Bío and Maule regions, probabilities were slightly lower than in the current scenario (Figure 6E–G). Despite these variations, the general trend indicated a higher average probability of fire occurrence than currently observed, with increases of up to 3.98%, 9.81%, and 26.69% for the RCP 2.6, 4.5, and 8.5 scenarios, respectively (Figure 7).

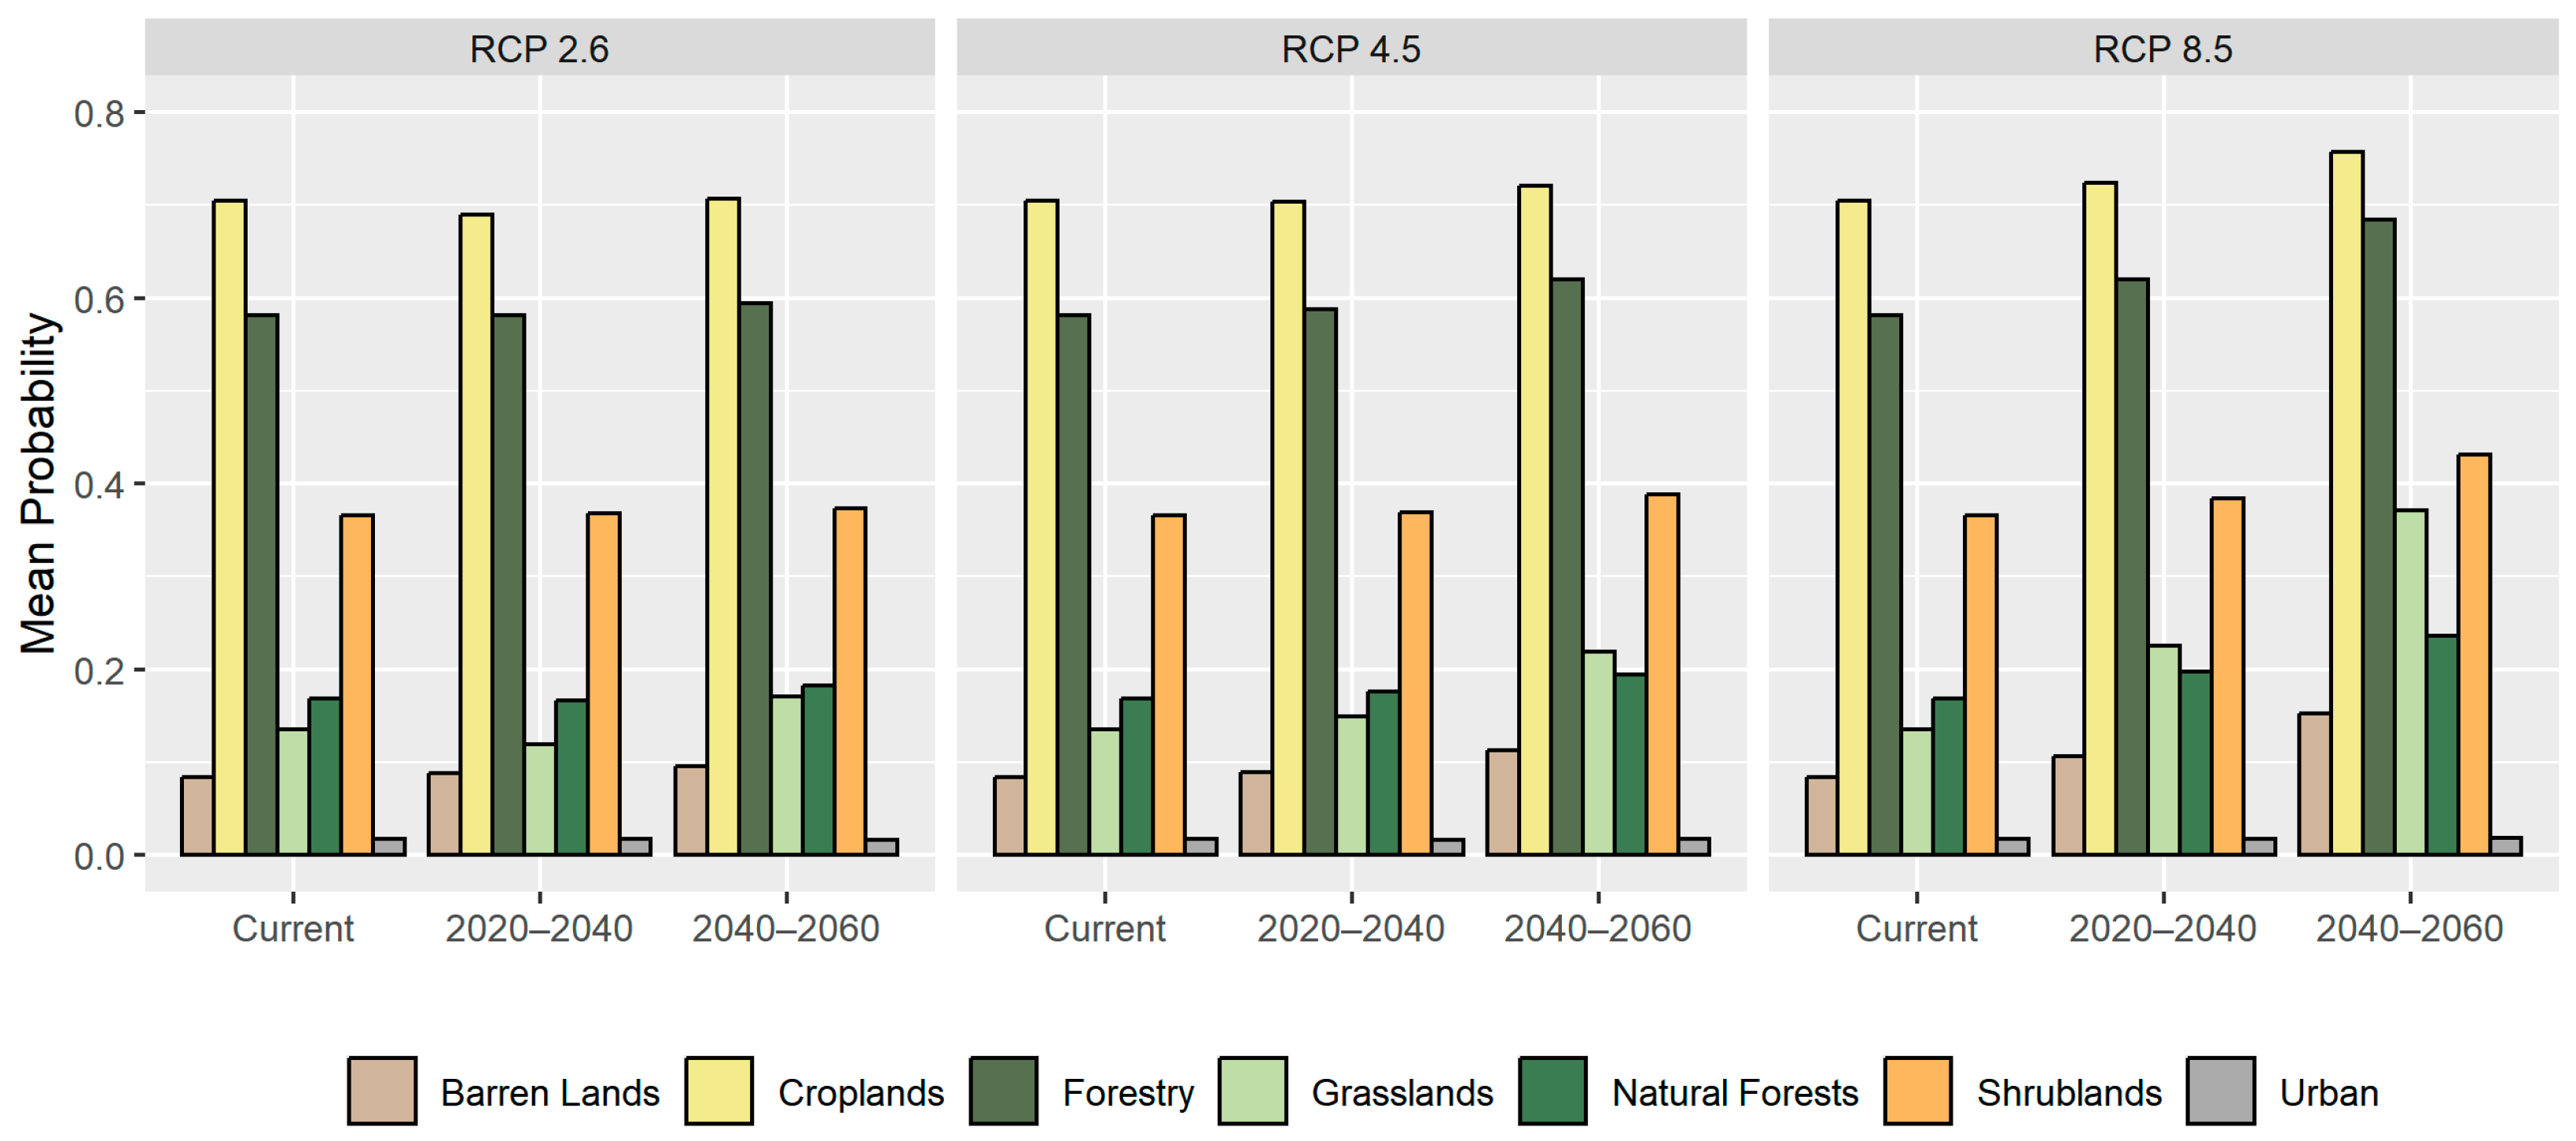
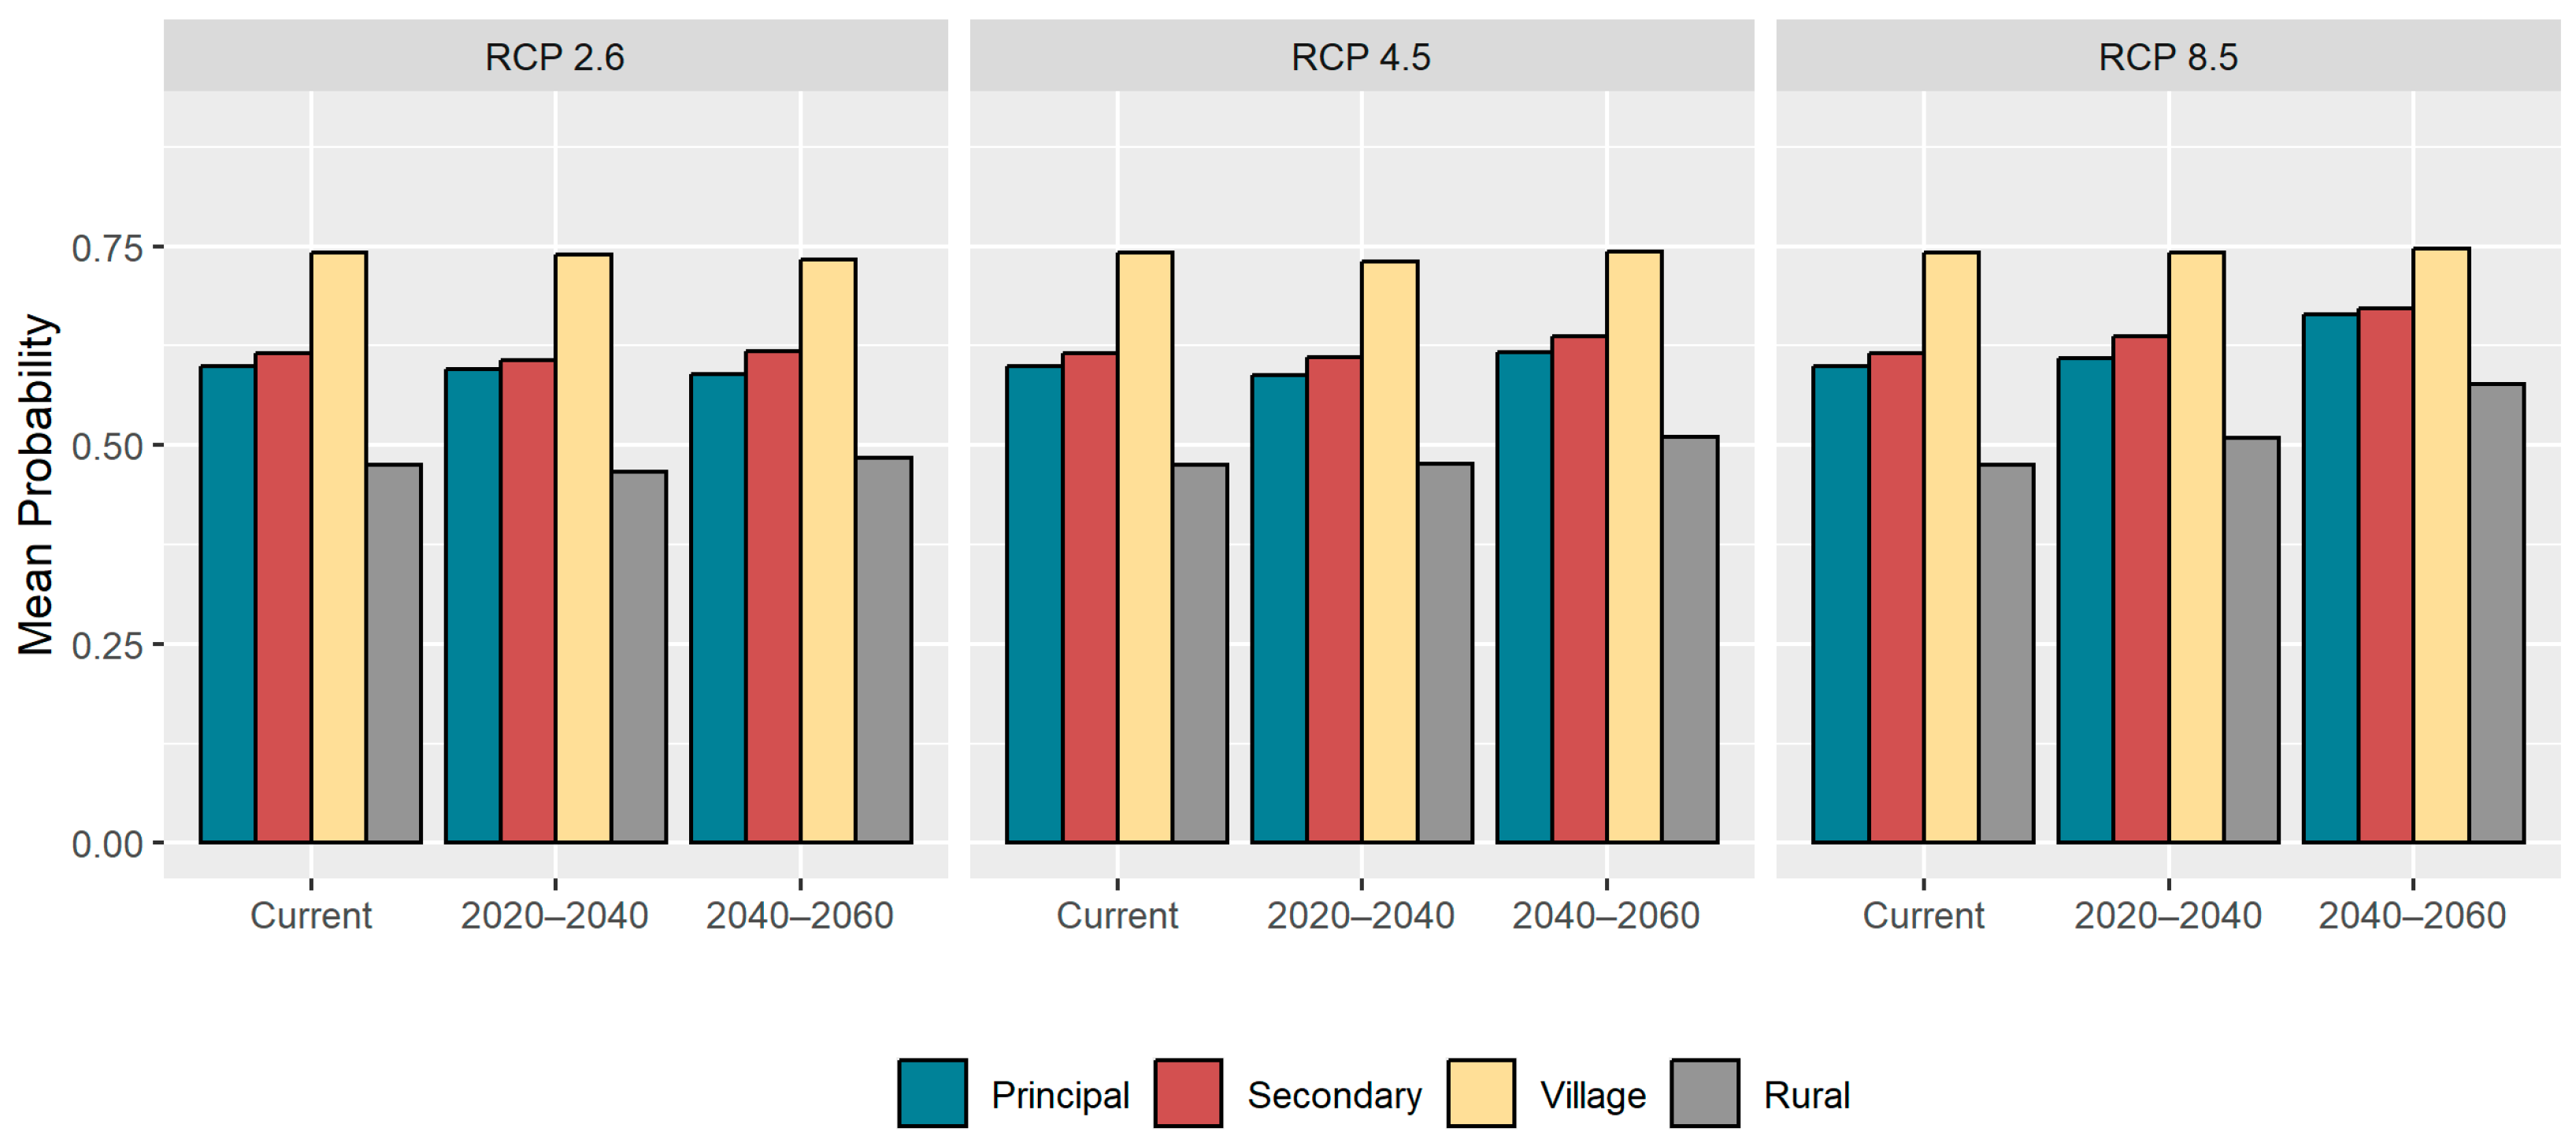
3.5. Characterization of Fire Occurrence Probability Across Land Uses and Urban–Rural Interfaces

In the current scenario, the highest average probability of fire occurrence was observed in croplands (0.70), followed by forestry plantations (0.58). The lowest values were found in urban areas (0.02) and barren land (0.08), while intermediate values were observed in shrublands (0.37) (Figure 8). Projections under the climate scenarios and periods considered largely retained this ranking, with notable increases primarily in grasslands and natural forests during the second period of RCP 4.5 and in both periods of RCP 8.5 (Figure 8).
For urban–rural interfaces in the current scenario, the highest and lowest probabilities were found in the village (0.74) and rural (0.47) interfaces, respectively, while the principal and secondary interfaces had intermediate values (approximately 0.60). Overall, these probabilities were not affected by the projected climate change scenarios, and the rural, secondary, and principal interfaces only showed slight increases during the second period of the RCP 4.5 and 8.5 pathways (Figure 9).

4. Discussion

4.1. Model Performance and Spatial Distribution of Fire Occurrence

Several studies agree that the most influential variables affecting the probability of fire occurrence include climatic, land use, and physiographic variables [21,31,34,35,57]. However, the contribution of each factor varies with the location and extent of the study area, as well as the quality and resolution of the data. In our study, the current probability of fire occurrence was mainly affected by the summer average temperature, summer average precipitation, proportion of agricultural use, and elevation. Overall, the RF model adequately reflects the historical distribution of burned areas and the spatial variation of the predictor variables in the study area, similar to the models reported in other studies [12,18,21]. The AUC value is equivalent to those in other studies in the Chilean context [21], while the accuracy, TPR, and TNR values indicate solid model performance, highlighting its ability to predict the probability of fires (i.e., high TPR). The latter result is particularly relevant in wildland–urban interface areas and zones near populations, where false negatives (undetected fires) could have critical consequences [3,78]. The RF algorithm’s ability to model and predict the probability of fire occurrence in diverse contexts and scenarios [30,31,36] is enhanced when input variables accurately represent the phenomenon and the spatial autocorrelation is addressed [34,57,59].
In the current climatic scenario, the areas with the highest probability of fire occurrence were mainly located in the Coastal Mountain Range and the Central Interior Valley between the O’Higgins and Ñuble regions. Further south, this distribution partially extends toward the Coastal Mountain Range of the Bio Bío region and the Central Interior Valley of the La Araucanía region. This spatial distribution partially differs from that reported by [21], who analyzed a smaller area that began further north (Valparaíso region, 32° south latitude) and ended in the La Araucanía region. In [21], the authors also used records from CONAF and the MCD64A1 product, which detects less than 50% of fires smaller than 100 ha [60], while the FIRECCI51 product used in our study is a more sensitive product for detecting small fires [60,65]. This greater sensibility is especially relevant in the agricultural zones of Ñuble, Bio Bío, and Araucanía, with numerous small fires contributing significantly to the large burned area detected in those regions during the study period. Moreover, the RF model by [21] included other predictor variables, such as growing season precipitation and population density. In our case, the former variable was excluded in the preliminary analyses, while the latter was not directly considered because of its lower spatial resolution. Thus, incorporating summer temperature and precipitation enables fire risk prediction in a broader geographic and climatic region.
Variables such as the average air temperature affect fire activity, increasing evapotranspiration and vegetation flammability [14,17,18]. The largest burned areas in Chile (Maule region, 2017, and Ñuble region, 2023) occurred under extreme climatic conditions, with a precipitation deficit of over 50% and mean temperature over 2 °C higher relative to historical values [12]. Temperature also relates to the spatial distribution of land use, with crops concentrated in warmer areas where fires occur more frequently [18]. Although some crops have low fuel continuity and flammability due to irrigation practices, accidental burns because of cleaning or disposing of annual crop residues are common [21]. Conversely, precipitation tended to be inversely related to fire occurrence, similar to what has been reported in other studies [17]. The recent increase in the number and extent of burned areas coincides with the megadrought affecting the central zone [5,16], where the precipitation has declined by about 25–45%, while the average annual temperature has increased by over 1 °C from the 1970–2000 baseline, facilitating the fire ignition and spread [21].

4.2. Effects of Land Use on the Probability of Fire Occurrence

Land use is a decisive factor in influencing fire occurrence since it reflects fuel distribution, continuity, and abundance. In this study, the probability increases proportionally with the agricultural cover, up to approximately 35%, after which it remains constant, with similar trends reported by [18]. These agricultural areas with risk-prone activities favor ignition and fire spread into areas with greater biomass [6,21]. Elevation showed a unimodal pattern, with a higher probability at low elevations (0–500 m) where agricultural lands, shrublands, and plantations predominate [50]. Above this altitude, the probability declines sharply, consistent with [21]. Elevation influences vegetation distribution, seasonal thermal regimes, and precipitation [56].
Regarding the distribution of land uses across the study area, in the central regions, fires predominated on shrubland, plantations, and crops, whereas in the southern regions they were on grasslands, crops, and native forests. Shrublands and plantations have abundant vegetation, connectivity, and the capacity to propagate fire under high temperatures quickly [5,21]. In Central Chile, the fire activity of Mediterranean–sclerophyll shrublands increases after wet autumns and during negative phases of the Southern Annular Mode [5]. Furthermore, the high presence of invasive species in the understory of forest plantations, which have lower ignition temperatures and rapid biomass accumulation, create horizontal and vertical continuity of the fuel load, facilitating fire spread [79]. Some studies indicate that the fire activity on forest plantations in the center and south-central zones has increased since 1990 [18,21,80].
In the case of agricultural areas, the burning of crop residues has been identified as a primary cause of larger fires [21]. In the central zone, with a higher density of roads and economic activities [6], agricultural areas near roads have experienced increased ignitions [18]. Rural abandonment, fuel accumulation, and the development of wildland–urban interface areas also influence the increase in fire frequency [17,18]. In the Mediterranean-type climate region of Central Chile, fires are frequently associated with grasslands, especially after the rainy period, which increases the vegetation growth in spring and turns it into a flammable fuel in summer [17].
On the other hand, burning for land-use changes, waste disposal, and poorly controlled pastureland burning, particularly during the dry season, can heighten the wildfire risk in the southern region [6,21]. These fires may accidentally spread and evolve into large-scale events in native forests. These forests can store more moisture in the vegetation but are still vulnerable under prolonged drought, as was noticed in the megadrought registered in Chile since 2010 [21], which exhibited a reduction in precipitation by around 40% with temperature increases [16]. Fires in native forests, either Mediterranean–sclerophyllous or temperate deciduous, are often associated with proximity to agricultural lands, plantations, and shrublands with invasive species [21]. Additionally, intentionality and human interaction influence ignition and spread in these land covers [5,6]. Consequently, stricter controls on agricultural burning and enhanced land-use regulations are essential, including initiatives prioritizing less flammable tree species, the creation of firebreaks separating plantations from native forests, and ongoing monitoring in urban–rural interface areas to minimize fuel loads and curb wildfire risk [6].

4.3. Potential Effects of Climate Change on Fire Occurrence

Climatic variability drives fire risk, as less rainfall in the summer months increases vegetation dryness, favoring ignition and spread [17,35,57]. Thus, unusual phenomena such as the megadrought (2010–2018) exacerbate this situation [5]. Conversely, temperature directly correlates with increased fire activity [5,17,80], differentiating active from inactive fire seasons [14]. Heatwaves and El Niño Southern Oscillation influences can dry Mediterranean and temperate vegetation [12]. In this study, the probability of fire occurrence increases when the mean summer temperature exceeds approximately 17 °C, while in [35], it occurs above 20 °C. The differences in these findings can be attributed to the different thermal metrics used; our study focused on the mean summer temperature, while the study by [35] relied on the maximum summer temperature.
In future scenarios, an increase in the probability of fire occurrence is projected in the study zone, similar to that reported in the Northern Hemisphere [2,29,47]. Climate change, linked to increased anthropogenic emissions, affects key fire climatic variables, especially temperature, and drought [81]. CMIP5 climate models have shown capabilities to reproduce global historical precipitation and temperature patterns [45], and projections from the HadGEM-2 model for the study area indicate decreased precipitation and increased temperature, consistent with trends in Chile described by [16]. Thus, rising temperatures, heatwaves [12,18], and the extension and severity of droughts [17,25,82] will increase the number, frequency, and magnitude of fires. In future scenarios, the increase in the probability of fire occurrence depends on the RCP trajectory, being slight in RCP 2.6, moderate in RCP 4.5, and considerable in RCP 8.5. The most significant differences appear in the second temporal period of each trajectory, reflecting the cumulative effect of greenhouse gases [45].
Although the projections kept land uses constant, not all changes were uniform. The increase in grasslands and native forests stands out, indicating a future rise in conducive conditions for fires in areas currently at lower risk. This phenomenon is concentrated in the north, the Andean foothills, and the south, from the Coastal Mountain Range toward the Central Interior Valley. Higher probability in grasslands near native forests facilitates spread into covers with greater biomass [21], while the increased risk in the foothills, with high fuel loads and complex terrain, will complicate fire control [15].
Under future climate scenarios, native forests will face various impacts. On the one hand, despite their adaptation to extreme climate conditions, sclerophyllous forests in the Mediterranean region will experience reduced productivity and increased water stress, making them particularly vulnerable to wildfires [83]. On the other hand, temperate native forests, especially those that remain intact, could maintain or even increase their productivity. However, rising temperatures also heighten their vulnerability [84]. This vulnerability is exacerbated in extreme climate conditions, characterized by more pronounced warming and reduced rainfall, which can dry even the wettest fuels and facilitate the spread of large-scale fires [21]. This pattern has been observed in the large fires that affected Maule, Biobío, and La Araucanía in 2017, as well as in the China Muerta and Malleco National Reserves and Tolhuaca National Park, again in La Araucanía, in 2015 [5]. Due to their exceptionally high intensity, these fires are more difficult to control, require significant economic resources to combat, pose a considerable risk to firefighters, and cause extensive infrastructure destruction [82].
Although the probability values for the wildland–urban interface categories do not vary significantly over time and RCP scenarios, it is noteworthy that villages have the highest probabilities, and rural dwellings show the most significant increase. Villages in rural areas depend on limited local resources during emergencies, and common agricultural burns in these areas can trigger uncontrolled fires [6,18]. Meanwhile, rural dwellings, dispersed and surrounded by vegetation, present high vulnerability [50]. The lack of territorial planning has created a dichotomy: rural abandonment increases available fuel, while informal urban expansion into rural areas creates interfaces at greater risk [21,51,78]. The future increase in the probability of fire occurrence in rural dwelling suggests a complex scenario for fire prevention and control, requiring policies and planning to improve the resilience of these areas [15]. To implement more resilient land-use planning in areas with a high probability of occurrence, it is a priority to establish a security perimeter around homes through preventive management of vegetation (fuel), as well as to regulate the expansion of residential areas near forest plantations or native forests, as indicated in the recommendations on the URI [82]. In addition, it is essential to advance in the normative and spatial definition of these interfaces [50], recognizing the need to design heterogeneous and adaptive landscapes that reduce the probability of catastrophic events under climate change [15]. In countries with Mediterranean climates, such as southern Europe, firebreak programs, prescribed burns, and land-use restrictions have been successfully implemented in urban–rural interface areas [22]. From a technological point of view, the implementation of early warning systems based on remote sensors and satellites allows for the rapid detection of fire outbreaks [50], while the use of updated geospatial data (GIS) facilitates the identification of communities at risk and the design of more efficient evacuation plans and preventive measures [44].
Some limitations of this study are those associated with the algorithm, data sources, and climate models. ML algorithms often lack interpretability, limiting insight into how predictors influence the phenomenon (even though SHAP curves illustrate variable contributions rather than causal relationships). The land-use dataset did not distinguish between annual and perennial crops, which differ in fire response [21]. Future projections only considered climate changes, keeping land use constant and potentially underestimating shifts [3,18,26]. Errors of omission and commission in FIRECCI51 can undermine model performance [60], and higher-resolution products (e.g., Sentinel2BAM; [85]) could mitigate these issues by providing more accurate local fire data. Although DEM resampling may reduce terrain detail, elevation is less influential than temperature, precipitation, and agricultural land use, so the impact on predictions is likely minimal. Future studies could explore integrating high-resolution elevation data, but this would require other predictor variables to be available at a finer spatial scale. Finally, a single climate model (HadGEM-2) restricts a comprehensive assessment of uncertainties, which could be addressed with multiple models [25,26]. However, uncertainties were partially mitigated by considering various RCPs, and HadGEM-2 has proven conservative regarding burning rates compared to models like MIROC and CanESM2 [2], implying a more precautionary projection.

5. Conclusions

This research developed a spatially explicit model to predict the likelihood of wildfires in the south-central region of Chile, demonstrating its sensitivity to current and future climatic conditions. The results show a significant increase in fire occurrence probability under high-emission RCP scenarios. This evidence underscores the growing vulnerability of the territory and highlights the urgent need to adopt more resilient land-use planning strategies.
We observed an increase in the likelihood of wildfires in Central and South-Central Chile, driven by climatic factors (rising temperatures and reduced precipitation) and land use. This heightened risk extends further south in native forests with higher biomass loads and is intensified under higher emissions scenarios (e.g., RCP 8.5). Moreover, this vulnerability is exacerbated by the growing presence of rural housing and villages in wildland–urban interfaces, land abandonment, and the widespread use of agricultural burning practices.
Our results lay a solid foundation for fostering more informed and adaptive land management practices. As climate change intensifies and wildfire risks grow, it is crucial to act decisively. Implementing these strategies will enhance resilience and safeguard ecosystems, communities, and the region’s future.

Author Contributions

Conceptualization, J.G., R.P., M.Y., S.E. and M.C.-B.; methodology, J.G. and R.P.; software, R.P.; validation, J.G., R.P. and M.Y.; formal analysis, J.G.; investigation, J.G.; resources, J.G. and R.P.; data curation, R.P.; writing—original draft preparation, J.G., R.P., M.Y., S.E. and M.C.-B.; writing—review and editing, J.G., R.P., M.Y., S.E. and M.C.-B.; funding acquisition, J.G. All authors have read and agreed to the published version of the manuscript.

Funding

The present research and publication were supported by the Chilean government through the Agencia Nacional de Investigación y Desarrollo (ANID) throughout the “Programa FONDECYT Iniciación en la Investigación” (grant No. 11231083).

Institutional Review Board Statement

Not applicable.

Informed Consent Statement

Not applicable.

Data Availability Statement

The original contributions presented in the study are included in the article, further inquiries can be directed to the corresponding author.

Acknowledgments

The authors would like to thank the project “Adaptación al Cambio Climático en la Actividad Forestal, Productividad y Reducción de Impactos código 19BP-117312” by the Corporación de Fomento de la Producción de Chile (CORFO). We are also grateful to the editors and the anonymous reviewers for their constructive comments and suggestions, which significantly improved the quality of this manuscript.

Conflicts of Interest

The authors declare no conflicts of interest.

References

  1. Batllori, E.; Parisien, M.A.; Krawchuk, M.A.; Moritz, M.A. Climate change-induced shifts in fire for Mediterranean ecosystems. Glob. Ecol. Biogeogr. 2013, 22, 1118–1129. [Google Scholar] [CrossRef]
  2. Boulanger, Y.; Parisien, M.-A.; Wang, X. Model-specification uncertainty in future area burned by wildfires in Canada. Int. J. Wildland Fire 2018, 27, 164–175. [Google Scholar] [CrossRef]
  3. de la Barrera, F.; Barraza, F.; Favier, P.; Ruiz, V.; Quense, J. Megafires in Chile 2017: Monitoring multiscale environmental impacts of burned ecosystems. Sci. Total Environ. 2018, 637, 1526–1536. [Google Scholar] [CrossRef]
  4. Jain, P.; Coogan, S.C.; Subramanian, S.G.; Crowley, M.; Taylor, S.; Flannigan, M.D. A review of machine learning applications in wildfire science and management. Environ. Rev. 2020, 28, 478–505. [Google Scholar] [CrossRef]
  5. González, M.E.; Gómez-González, S.; Lara, A.; Garreaud, R.; Díaz-Hormazábal, I. The 2010–2015 Megadrought and its influence on the fire regime in central and south-central Chile. Ecosphere 2018, 9, e02300. [Google Scholar] [CrossRef]
  6. Pozo, R.A.; Galleguillos, M.; González, M.E.; Vásquez, F.; Arriagada, R. Assessing the socio-economic and land-cover drivers of wildfire activity and its spatiotemporal distribution in south-central Chile. Sci. Total Environ. 2022, 810, 152002. [Google Scholar] [CrossRef]
  7. Moritz, M.A.; Parisien, M.-A.; Batllori, E.; Krawchuk, M.A.; Van Dorn, J.; Ganz, D.J.; Hayhoe, K. Climate change and disruptions to global fire activity. Ecosphere 2012, 3, 1–22. [Google Scholar] [CrossRef]
  8. Sun, Q.; Miao, C.; Hanel, M.; Borthwick, A.G.; Duan, Q.; Ji, D.; Li, H. Global heat stress on health, wildfires, and agricultural crops under different levels of climate warming. Environ. Int. 2019, 128, 125–136. [Google Scholar] [CrossRef]
  9. Turco, M.; Abatzoglou, J.T.; Herrera, S.; Zhuang, Y.; Jerez, S.; Lucas, D.D.; AghaKouchak, A.; Cvijanovic, I. Anthropogenic climate change impacts exacerbate summer forest fires in California. Proc. Natl. Acad. Sci. USA 2023, 120, e2213815120. [Google Scholar] [CrossRef]
  10. USGCRP. Impacts, Risks, and Adaptation in the United States: Fourth National Climate Assessment, Volume II; U.S. Global Change Research Program: Washington, DC, USA, 2017; p. 1515. [Google Scholar]
  11. Ministerio del Medio Ambiente. Plan de Acción Nacional de Cambio Climático 2017–2022; Ministerio del Medio Ambiente de Chile: Santiago, Chile, 2017; p. 250. [Google Scholar]
  12. Cordero, R.R.; Feron, S.; Damiani, A.; Carrasco, J.; Karas, C.; Wang, C.; Kraamwinkel, C.T.; Beaulieu, A. Extreme fire weather in Chile driven by climate change and El Niño–Southern Oscillation (ENSO). Sci. Rep. 2024, 14, 1974. [Google Scholar] [CrossRef]
  13. Ministerio de Hacienda. Reporte de la Estimación de Los Costos Fiscales y Económicos de la Emergencia Por los Incendios Forestales; Ministerio de Hacienda de Chile: Santiago, Chile, 2023; p. 9. [Google Scholar]
  14. McWethy, D.B.; Garreaud, R.D.; Holz, A.; Pederson, G.T. Broad-scale surface and atmospheric conditions during large fires in South-Central Chile. Fire 2021, 4, 28. [Google Scholar] [CrossRef]
  15. Sarricolea, P.; Serrano-Notivoli, R.; Fuentealba, M.; Hernández-Mora, M.; De la Barrera, F.; Smith, P.; Meseguer-Ruiz, Ó. Recent wildfires in Central Chile: Detecting links between burned areas and population exposure in the wildland urban interface. Sci. Total Environ. 2020, 706, 135894. [Google Scholar] [CrossRef] [PubMed]
  16. Garreaud, R.D.; Alvarez-Garreton, C.; Barichivich, J.; Boisier, J.P.; Christie, D.; Galleguillos, M.; LeQuesne, C.; McPhee, J.; Zambrano-Bigiarini, M. The 2010–2015 megadrought in central Chile: Impacts on regional hydroclimate and vegetation. Hydrol. Earth Syst. Sci. 2017, 21, 6307–6327. [Google Scholar] [CrossRef]
  17. Urrutia-Jalabert, R.; González, M.E.; González-Reyes, Á.; Lara, A.; Garreaud, R. Climate variability and forest fires in central and south-central Chile. Ecosphere 2018, 9, e02171. [Google Scholar] [CrossRef]
  18. Gómez-González, S.; González, M.E.; Paula, S.; Díaz-Hormazábal, I.; Lara, A.; Delgado-Baquerizo, M. Temperature and agriculture are largely associated with fire activity in Central Chile across different temporal periods. For. Ecol. Manag. 2019, 433, 535–543. [Google Scholar] [CrossRef]
  19. Holz, A.; Kitzberger, T.; Paritsis, J.; Veblen, T.T. Ecological and climatic controls of modern wildfire activity patterns across southwestern South America. Ecosphere 2012, 3, 1–25. [Google Scholar] [CrossRef]
  20. Heilmayr, R.; Echeverría, C.; Fuentes, R.; Lambin, E.F. A plantation-dominated forest transition in Chile. Appl. Geogr. 2016, 75, 71–82. [Google Scholar] [CrossRef]
  21. McWethy, D.B.; Pauchard, A.; García, R.A.; Holz, A.; González, M.E.; Veblen, T.T.; Stahl, J.; Currey, B. Landscape drivers of recent fire activity (2001–2017) in south-central Chile. PLoS ONE 2018, 13, e0201195. [Google Scholar] [CrossRef]
  22. Moreira, F.; Viedma, O.; Arianoutsou, M.; Curt, T.; Koutsias, N.; Rigolot, E.; Barbati, A.; Corona, P.; Vaz, P.; Xanthopoulos, G. Landscape–wildfire interactions in southern Europe: Implications for landscape management. J. Environ. Manag. 2011, 92, 2389–2402. [Google Scholar] [CrossRef]
  23. Fréjaville, T.; Curt, T. Seasonal changes in the human alteration of fire regimes beyond the climate forcing. Environ. Res. Lett. 2017, 12, 035006. [Google Scholar] [CrossRef]
  24. Syphard, A.D.; Keeley, J.E.; Abatzoglou, J.T. Trends and drivers of fire activity vary across California aridland ecosystems. J. Arid Environ. 2017, 144, 110–122. [Google Scholar] [CrossRef]
  25. Carrasco, G.; Almeida, A.C.; Falvey, M.; Olmedo, G.F.; Taylor, P.; Santibañez, F.; Coops, N.C. Effects of climate change on forest plantation productivity in Chile. Glob. Change Biol. 2022, 28, 7391–7409. [Google Scholar] [CrossRef]
  26. Syphard, A.D.; Sheehan, T.; Rustigian-Romsos, H.; Ferschweiler, K. Mapping future fire probability under climate change: Does vegetation matter? PLoS ONE 2018, 13, e0201680. [Google Scholar] [CrossRef] [PubMed]
  27. Scott, J.H.; Thompson, M.P.; Calkin, D.E. A Wildfire Risk Assessment Framework for Land and Resource Management; General Technical Report RMRS-GTR-315; U.S. Department of Agriculture, Forest Service, Rocky Mountain Research Station: Fort Collins, CO, USA, 2013; p. 83. [Google Scholar]
  28. Shmuel, A.; Heifetz, E. A machine-learning approach to predicting daily wildfire expansion rate. Fire 2023, 6, 319. [Google Scholar] [CrossRef]
  29. Tian, X.; Cui, W.; Shu, L.; Zong, X. Effects of climate change on burn probability of forests in Daxing’anling. Forests 2019, 10, 611. [Google Scholar] [CrossRef]
  30. Pang, Y.; Li, Y.; Feng, Z.; Feng, Z.; Zhao, Z.; Chen, S.; Zhang, H. Forest fire occurrence prediction in China based on machine learning methods. Remote Sens. 2022, 14, 5546. [Google Scholar] [CrossRef]
  31. Kim, S.J.; Lim, C.-H.; Kim, G.S.; Lee, J.; Geiger, T.; Rahmati, O.; Son, Y.; Lee, W.-K. Multi-temporal analysis of forest fire probability using socio-economic and environmental variables. Remote Sens. 2019, 11, 86. [Google Scholar] [CrossRef]
  32. Shmuel, A.; Heifetz, E. Global wildfire susceptibility mapping based on machine learning models. Forests 2022, 13, 1050. [Google Scholar] [CrossRef]
  33. Alkhatib, R.; Sahwan, W.; Alkhatieb, A.; Schütt, B. A brief review of machine learning algorithms in forest fires science. Appl. Sci. 2023, 13, 8275. [Google Scholar] [CrossRef]
  34. Pham, B.T.; Jaafari, A.; Avand, M.; Al-Ansari, N.; Dinh Du, T.; Yen, H.P.H.; Phong, T.V.; Nguyen, D.H.; Le, H.V.; Mafi-Gholami, D.; et al. Performance Evaluation of Machine Learning Methods for Forest Fire Modeling and Prediction. Symmetry 2020, 12, 1022. [Google Scholar] [CrossRef]
  35. Oliveira, S.; Oehler, F.; San-Miguel-Ayanz, J.; Camia, A.; Pereira, J.M. Modeling spatial patterns of fire occurrence in Mediterranean Europe using Multiple Regression and Random Forest. For. Ecol. Manag. 2012, 275, 117–129. [Google Scholar] [CrossRef]
  36. Tan, C.; Feng, Z. Mapping Forest Fire Risk Zones Using Machine Learning Algorithms in Hunan Province, China. Sustainability 2023, 15, 6292. [Google Scholar] [CrossRef]
  37. Akinci, H.A.; Akinci, H.; Zeybek, M. Comparison of diverse machine learning algorithms for forest fire susceptibility mapping in Antalya, Türkiye. Adv. Space Res. 2024, 74, 647–667. [Google Scholar] [CrossRef]
  38. Yue, W.; Ren, C.; Liang, Y.; Liang, J.; Lin, X.; Yin, A.; Wei, Z. Assessment of wildfire susceptibility and wildfire threats to ecological environment and urban development based on GIS and multi-source data: A case study of Guilin, China. Remote Sens. 2023, 15, 2659. [Google Scholar] [CrossRef]
  39. Gevaert, C.M.; Carman, M.; Rosman, B.; Georgiadou, Y.; Soden, R. Fairness and accountability of AI in disaster risk management: Opportunities and challenges. Patterns 2021, 2, 100363. [Google Scholar] [CrossRef] [PubMed]
  40. Ghaffarian, S.; Taghikhah, F.R.; Maier, H.R. Explainable artificial intelligence in disaster risk management: Achievements and prospective futures. Int. J. Disaster Risk Reduct. 2023, 98, 104123. [Google Scholar] [CrossRef]
  41. Ochoa, C.; Bar-Massada, A.; Chuvieco, E. A European-scale analysis reveals the complex roles of anthropogenic and climatic factors in driving the initiation of large wildfires. Sci. Total Environ. 2024, 917, 170443. [Google Scholar] [CrossRef] [PubMed]
  42. Iban, M.C.; Aksu, O. SHAP-Driven Explainable Artificial Intelligence Framework for Wildfire Susceptibility Mapping Using MODIS Active Fire Pixels: An In-Depth Interpretation of Contributing Factors in Izmir, Türkiye. Remote Sens. 2024, 16, 2842. [Google Scholar] [CrossRef]
  43. Iban, M.C.; Sekertekin, A. Machine learning based wildfire susceptibility mapping using remotely sensed fire data and GIS: A case study of Adana and Mersin provinces, Turkey. Ecol. Inform. 2022, 69, 101647. [Google Scholar] [CrossRef]
  44. González, C.; Castillo, M.; García-Chevesich, P.; Barrios, J. Dempster-Shafer theory of evidence: A new approach to spatially model wildfire risk potential in central Chile. Sci. Total Environ. 2018, 613, 1024–1030. [Google Scholar] [CrossRef]
  45. Flato, G.; Marotzke, J.; Abiodun, B.; Braconnot, P.; Chou, S.C.; Collins, W.; Cox, P.; Driouech, F.; Emori, S.; Eyring, V. Evaluation of climate models. In Climate Change 2013: The Physical Science Basis. Contribution of Working Group I to the Fifth Assessment Report of the Intergovernmental Panel on Climate Change; Cambridge University Press: Cambridge, UK, 2014; pp. 741–866. [Google Scholar]
  46. Hope, E.S.; McKenney, D.W.; Pedlar, J.H.; Stocks, B.J.; Gauthier, S. Wildfire suppression costs for Canada under a changing climate. PLoS ONE 2016, 11, e0157425. [Google Scholar] [CrossRef]
  47. Amatulli, G.; Camia, A.; San-Miguel-Ayanz, J. Estimating future burned areas under changing climate in the EU-Mediterranean countries. Sci. Total Environ. 2013, 450, 209–222. [Google Scholar] [CrossRef]
  48. Davis, R.; Yang, Z.; Yost, A.; Belongie, C.; Cohen, W. The normal fire environment—Modeling environmental suitability for large forest wildfires using past, present, and future climate normals. For. Ecol. Manag. 2017, 390, 173–186. [Google Scholar] [CrossRef]
  49. Young, A.M.; Higuera, P.E.; Duffy, P.A.; Hu, F.S. Climatic thresholds shape northern high-latitude fire regimes and imply vulnerability to future climate change. Ecography 2017, 40, 606–617. [Google Scholar] [CrossRef]
  50. Miranda, A.; Carrasco, J.; González, M.; Pais, C.; Lara, A.; Altamirano, A.; Weintraub, A.; Syphard, A.D. Evidence-based mapping of the wildland-urban interface to better identify human communities threatened by wildfires. Environ. Res. Lett. 2020, 15, 094069. [Google Scholar] [CrossRef]
  51. Syphard, A.D.; Bar Massada, A.; Butsic, V.; Keeley, J.E. Land use planning and wildfire: Development policies influence future probability of housing loss. PLoS ONE 2013, 8, e71708. [Google Scholar] [CrossRef]
  52. Zhao, Y.; Feng, D.; Yu, L.; Wang, X.; Chen, Y.; Bai, Y.; Hernández, H.J.; Galleguillos, M.; Estades, C.; Biging, G.S. Detailed dynamic land cover mapping of Chile: Accuracy improvement by integrating multi-temporal data. Remote Sens. Environ. 2016, 183, 170–185. [Google Scholar] [CrossRef]
  53. Gajardo, R. La Vegetación Natural de Chile: Clasificación y Distribución Geográfica; Editorial Universitaria Santiago: Santiago, Chile, 1995. [Google Scholar]
  54. Donoso, P.; Promis, Á. Silvicultura en Bosques Nativos. Avances en la Investigación en Chile, Argentina y Nueva Zelandia; Cuneo, M., Ed.; Marisa Cuneo: Valdivia, Chile, 2013; Volume 1, p. 253. [Google Scholar]
  55. Viale, M.; Garreaud, R. Orographic effects of the subtropical and extratropical Andes on upwind precipitating clouds. J. Geophys. Res. Atmos. 2015, 120, 4962–4974. [Google Scholar] [CrossRef]
  56. Veblen, T.; Schlegel, F.; Oltremari, J. Temperate broad-leaved evergreen forests of South America. In Ecosystems of the World 10; Ovington, J.D., Ed.; Elsevier: Amsterdam, The Netherlands, 1983; pp. 5–32. [Google Scholar]
  57. Parisien, M.-A.; Moritz, M.A. Environmental controls on the distribution of wildfire at multiple spatial scales. Ecol. Monogr. 2009, 79, 127–154. [Google Scholar] [CrossRef]
  58. Parisien, M.-A.; Snetsinger, S.; Greenberg, J.A.; Nelson, C.R.; Schoennagel, T.; Dobrowski, S.Z.; Moritz, M.A. Spatial variability in wildfire probability across the western United States. Int. J. Wildland Fire 2012, 21, 313–327. [Google Scholar] [CrossRef]
  59. Massada, A.B.; Syphard, A.D.; Stewart, S.I.; Radeloff, V.C. Wildfire ignition-distribution modelling: A comparative study in the Huron–Manistee National Forest, Michigan, USA. Int. J. Wildland Fire 2013, 22, 174–183. [Google Scholar] [CrossRef]
  60. Katagis, T.; Gitas, I.Z. Assessing the accuracy of MODIS MCD64A1 C6 and FireCCI51 burned area products in Mediterranean ecosystems. Remote Sens. 2022, 14, 602. [Google Scholar] [CrossRef]
  61. Giglio, L.; Boschetti, L.; Roy, D.P.; Humber, M.L.; Justice, C.O. The Collection 6 MODIS burned area mapping algorithm and product. Remote Sens. Environ. 2018, 217, 72–85. [Google Scholar] [CrossRef] [PubMed]
  62. Chuvieco, E.; Lizundia-Loiola, J.; Pettinari, M.L.; Ramo, R.; Padilla, M.; Tansey, K.; Mouillot, F.; Laurent, P.; Storm, T.; Heil, A. Generation and analysis of a new global burned area product based on MODIS 250 m reflectance bands and thermal anomalies. Earth Syst. Sci. Data 2018, 10, 2015–2031. [Google Scholar] [CrossRef]
  63. Alonso-Canas, I.; Chuvieco, E. Global burned area mapping from ENVISAT-MERIS and MODIS active fire data. Remote Sens. Environ. 2015, 163, 140–152. [Google Scholar] [CrossRef]
  64. Giglio, L.; Randerson, J.; Van der Werf, G.; Kasibhatla, P.; Collatz, G.; Morton, D.; DeFries, R. Assessing variability and long-term trends in burned area by merging multiple satellite fire products. Biogeosciences 2010, 7, 1171–1186. [Google Scholar] [CrossRef]
  65. Lizundia-Loiola, J.; Otón, G.; Ramo, R.; Chuvieco, E. A spatio-temporal active-fire clustering approach for global burned area mapping at 250 m from MODIS data. Remote Sens. Environ. 2020, 236, 111493. [Google Scholar] [CrossRef]
  66. ESA. Land Cover CCI Product User Guide Version 2; European Space Agency: Paris, France, 2017. [Google Scholar]
  67. Gorelick, N.; Hancher, M.; Dixon, M.; Ilyushchenko, S.; Thau, D.; Moore, R. Google Earth Engine: Planetary-scale geospatial analysis for everyone. Remote Sens. Environ. 2017, 202, 18–27. [Google Scholar] [CrossRef]
  68. NASA. Shuttle Radar Topography Mission (SRTM); NASA Jet Propulsion Laboratory: Pasadena, CA, USA, 2013. Available online: https://earthexplorer.usgs.gov/ (accessed on 1 February 2025).
  69. Collins, W.; Bellouin, N.; Doutriaux-Boucher, M.; Gedney, N.; Halloran, P.; Hinton, T.; Hughes, J.; Jones, C.; Joshi, M.; Liddicoat, S. Development and evaluation of an Earth-System model–HadGEM2. Geosci. Model Dev. 2011, 4, 1051–1075. [Google Scholar] [CrossRef]
  70. Castellanos-Acuña, D.; Vance-Borland, K.W.; St. Clair, J.B.; Hamann, A.; López-Upton, J.; Gómez-Pineda, E.; Ortega-Rodríguez, J.M.; Sáenz-Romero, C. Climate-based seed zones for Mexico: Guiding reforestation under observed and projected climate change. New For. 2018, 49, 297–309. [Google Scholar] [CrossRef]
  71. Van Vuuren, D.P.; Edmonds, J.; Kainuma, M.; Riahi, K.; Thomson, A.; Hibbard, K.; Hurtt, G.C.; Kram, T.; Krey, V.; Lamarque, J.-F. The representative concentration pathways: An overview. Clim. Change 2011, 109, 5–31. [Google Scholar] [CrossRef]
  72. QGIS Development Team. QGIS Geographic Information System, Open Source Geospatial Foundation Project. 2023. Available online: https://qgis.org (accessed on 1 February 2025).
  73. R Core Team R: A Language and Environment for Statistical Computing; R Foundation for Statistical Computing: Vienna, Austria, 2023.
  74. Breiman, L. Random forests. Mach. Learn. 2001, 45, 5–32. [Google Scholar] [CrossRef]
  75. Kuhn, M. Building predictive models in R using the caret package. J. Stat. Softw. 2008, 28, 1–26. [Google Scholar] [CrossRef]
  76. Mayer, M.; Watson, D.; Biecek, P. kernelshap: Kernel SHAP. R Package, Version 0.7.0; Comprehensive R Archive Network (CRAN): Vienna, Austria, 2024. [Google Scholar]
  77. GEPRIF. CONAF. Delimitación de Zonas de Interfaz para Sitios de Importancia en Comunas Críticas para la Protección de Incendios Forestales. Available online: https://drive.google.com/drive/folders/1Zn5qd0wkMM-kc8vau_oYMvHzP9T1pQvi (accessed on 1 February 2025).
  78. Úbeda, X.; Sarricolea, P. Wildfires in Chile: A review. Glob. Planet. Change 2016, 146, 152–161. [Google Scholar] [CrossRef]
  79. García, R.A.; Engler, M.L.; Pena, E.; Pollnac, F.W.; Pauchard, A. Fuel characteristics of the invasive shrub Teline monspessulana (L.) K. Koch. Int. J. Wildland Fire 2015, 24, 372–379. [Google Scholar] [CrossRef]
  80. González, M.; Lara, A.; Urrutia, R.; Bosnich, J. Cambio climático y su impacto potencial en la ocurrencia de incendios forestales en la zona centro-sur de Chile (33°–42° S). Bosque 2011, 32, 215–219. [Google Scholar] [CrossRef]
  81. Westerling, A.; Brown, T.; Schoennagel, T.; Swetnam, T.; Turner, M.; Veblen, T. Briefing: Climate and wildfire in western US forests. In Forest Conservation and Management in the Anthropocene: Conference Proceedings; Sample, V.A., Bixler, R.P., Eds.; Rocky Mountain Research Station: Fort Collins, CO, USA, 2014; pp. 81–102. [Google Scholar]
  82. González, M.E.; Sapiains, R.; Gómez-González, S.; Garreaud, R.; Miranda, A.; Galleguillos, M.; Jacques, M.; Pauchard, A.; Hoyos, J.; Cordero, L.; et al. Incendios Forestales en Chile: Causas, Impactos y Resiliencia; Center for Climate and Resilence Research (CR)²: Santiago, Chile, 2020; p. 84. [Google Scholar]
  83. Miranda, A.; Lara, A.; Altamirano, A.; Di Bella, C.; González, M.E.; Camarero, J.J. Forest browning trends in response to drought in a highly threatened mediterranean landscape of South America. Ecol. Indic. 2020, 115, 106401. [Google Scholar] [CrossRef]
  84. Gutiérrez, Á.; Ortega, J.; Urra, V.; Vera, C. Estudio Vulnerabilidad Terrestre del Plan Nacional de Adaptación al Cambio Climático en Biodiversidad: Productividad de Bosques Nativos y Cambio Climático; Universidad de Chile: Santiago, Chile, 2024; p. 39. [Google Scholar]
  85. Bastarrika, A.; Rodriguez-Montellano, A.; Roteta, E.; Hantson, S.; Franquesa, M.; Torre, L.; Gonzalez-Ibarzabal, J.; Artano, K.; Martinez-Blanco, P.; Mesanza, A. An automatic procedure for mapping burned areas globally using Sentinel-2 and VIIRS/MODIS active fires in Google Earth Engine. ISPRS J. Photogramm. Remote Sens. 2024, 218, 232–245. [Google Scholar] [CrossRef]
Figure 1. Study area. Red pixels represent FIRECCI51 data.
Fire 08 00113 g001
Figure 2. The calibration process for the wildfire occurrence model.
Fire 08 00113 g002
Figure 3. Burned areas and land-use types per region affected by fires during the 2000–2017 period.
Fire 08 00113 g003
Figure 4. Spatial distribution of summer average temperature and precipitation during the historical period and under future climate change scenarios.
Fire 08 00113 g004
Figure 5. SHAP curves for variables: (A) summer average temperature; (B) summer average precipitation; (C) proportion of agricultural use; (D) elevation. The red line represents the fitted GAM, and the gray shed represents confidence intervals. The X-axis represents the actual values of the selected variable, and the Y-axis (SHAP value) indicates how that variable’s value influences the prediction relative to a baseline. A positive SHAP value means this variable pushes the predicted probability of fire above the average, while a negative SHAP value means it pulls the probability below the average.
Fire 08 00113 g005
Figure 6. Spatial distribution of the probability of fire occurrence under current conditions and future RCP scenarios: (A) current conditions; (B) difference from current conditions under RCP 2.6 (2020–2040); (C) difference from current conditions under RCP 2.6 (2040–2060); (D) difference from current conditions under RCP 4.5 (2020–2040); (E) difference from current conditions under RCP 4.5 (2040–2060); (F) difference from current conditions under RCP 8.5 (2020–2040); (G) difference from current conditions under RCP 8.5 (2040–2060). Each difference panel (BG) shows how the probability of fire occurrence is projected to change relative to the current baseline (panel a) under various RCP scenarios and periods.
Fire 08 00113 g006
Figure 7. Average probability of fire occurrence for different periods and climate change scenarios. Horizontal bars represent standard errors.
Fire 08 00113 g007
Figure 8. Average probability of fire occurrence for different land uses in the current and future climate change scenarios.
Fire 08 00113 g008
Figure 9. Average probabilities of fire occurrence for different urban–rural interface categories in the current and future climate change scenarios.
Fire 08 00113 g009
Table 1. Predictor variables used for historical wildfire occurrence model calibration.
Category and VariableTemporal ResolutionSpatial Resolution
ClimateTemperature (°C)MaximumAnnual and seasonal500 m
Minimum500 m
Mean500 m
Precipitation (mm)MeanAnnual and seasonal500 m
AccumulatedAnnual500 m
PhysiographyElevation (masl)500 m
Slope (°)500 m
Land useProportion of land use500 m
Table 2. Predictive variables and relative importance in fire occurrence probability.
VariableRelative Importance (%)
Mean summer temperature36.27
Mean summer precipitation28.30
Proportion of agricultural use21.24
Elevation14.18
Disclaimer/Publisher’s Note: The statements, opinions and data contained in all publications are solely those of the individual author(s) and contributor(s) and not of MDPI and/or the editor(s). MDPI and/or the editor(s) disclaim responsibility for any injury to people or property resulting from any ideas, methods, instructions or products referred to in the content.

