
Application of Pebbles for Geotechnical Seismic Isolation (GSI): Experimental Parametric Study


Faculty of Civil Engineering, Architecture and Geodesy, University of Split, 21000 Split, Croatia
*
Author to whom correspondence should be addressed.
Vibration 2024, 7(1), 64-82; https://doi.org/10.3390/vibration7010004
Submission received: 27 November 2023
/
Revised: 16 December 2023
/
Accepted: 15 January 2024
/
Published: 16 January 2024
Abstract
:Low-income regions do not have the economic strength to use conventional isolators; therefore, low-cost alternatives are needed. The recent series of earthquakes in Turkey has once again demonstrated the destructive power of this natural disaster and highlighted the need for high-quality earthquake-resistant structures. In this context, a comprehensive experimental parametric study on the use of natural stone pebbles (ASL-1) and stone pebbles in combination with a geogrid layer (ASL-2) as suitable materials for a GSI system is conducted and the main results are presented. The seismic behavior of five different models was tested using four different acceleration diagrams with different peak ground accelerations (PGAs). Characteristic displacements, accelerations, and strains were measured. The results and conclusions presented are based on the integration and synthesis of several previously conducted studies.
1. Introduction
The recent series of earthquakes in Turkey has once again demonstrated the destructive power of this natural disaster and highlighted the need for high-quality earthquake-resistant structures. There were 12 base-isolated hospitals within 200 km of the epicenter of the magnitude 7.8 earthquake, as reported by [1], all of which were operational again after the series of earthquakes, providing further confirmation that the concept of seismic base isolation is the right way to ensure the safety of important facilities.
The main limitations of conventional seismic isolation are the high initial investment, the high level of expertise required for design and construction, and the maintenance requirements throughout the life of the building.
Low-income regions do not have the economic strength to use conventional isolators; thus, low-cost alternatives are needed. Geotechnical seismic isolation (GSI) is a cost-effective seismic isolation technique that has received a lot of attention from researchers in recent decades. The main difference from conventional seismic isolation is that the isolation layer is located below the foundation level, as originally proposed by Tsang [2]. The purpose of such seismic isolation would be served, although it would provide a lower level of seismic force reduction compared to more complex and expensive devices [3,4,5,6,7,8,9,10,11,12,13,14]. It is desirable to use materials that are readily found in nature and have large reserves. Several types of materials have been tested and researched for GSI applications, including sand and gravel [15,16,17,18,19,20,21,22], sand–bitumen mixtures [23], EPS beads–sand mixtures [24], rubber–soil mixtures (RSMs) gravel–soil mixtures (GRMs) [25,26,27,28,29,30,31,32,33,34,35,36,37,38,39,40,41,42,43,44], geosynthetics [45,46,47,48], and geofoam [49,50,51,52,53,54,55,56,57].
The topic of this research is to investigate the possibility of using stone pebbles (ASL-1) and pebbles with geosynthetics to enhance the sliding performance (ASL-2) as suitable materials for the GSI system [58,59,60,61,62,63,64,65]. The price of such seismic isolation is low, and construction is quick and easy. It is expected that they will be widely used in practice, especially for lower rigid buildings and smaller bridges. Pebbles are an interesting material for this application for several reasons: they have a high bearing capacity for gravity loads, and they allow the dissipation of energy by sliding the foundation on the layer, as well as by sliding within the sublayers. It should be highlighted that this isolation system is intended for practical application on low-rise buildings and small bridges (T < 0.4 s) founded on solid ground.
The individual research objectives are the following:
- Determination of the influence of numerous parameters on the effectiveness of the aseismic layer ASL-1: the pebbles fraction, the compaction of the layer, the layer thickness, the moisture content of the layer, the vertical contact stress below the foundation, and the effect of repeated excitations on the effectiveness of the layer.
- Determination of the optimal ASL-1 aseismic layer.
- Determination of the effect of structural stiffness on the effectiveness of the ASL-1 layer.
- Determination of the effect of foundation size on the effectiveness of the ASL-1 layer.
- Determination of the effect of numerous parameters on ASL-2 aseismic layer efficiency: combination of stone pebbles and geosynthetics.
- Determination of the influence of structural stiffness on the efficiency of the ASL-2 layer.
All investigations were carried out as parametric analyses. The value of the analyzed parameter is varied, while all others are kept constant.
Section 2 presents the application of pebbles as a GSI layer. The methodology for selecting the optimal ASL-1 layer is discussed (Section 2.1). Subsequently, the behavior of deformable models on the optimal ASL-1 layer is presented in Section 2.2 (effect of model foundation size and model stiffness on ASL-1 efficiency).
The optimal pebble layer, ASL-1, from Section 2.1 is combined with different geosynthetics to obtain an even more efficient layer: ASL-2 (Section 3). The same methodology as for layer ASL-1 was used to select the optimal layer. Following the methodology used for the ASL-1 isolation, the behavior of the deformable models was tested on the optimal layer: ASL-2. The main research results and discussions are presented in Section 4 separately for the rigid model M0 (Section 4.1) and the deformable models (Section 4.2). At the end of the paper, conclusions are drawn in Section 5.
2. Application of Stone Pebbles as a GSI Layer
2.1. Optimal Aseismic Layer ASL-1
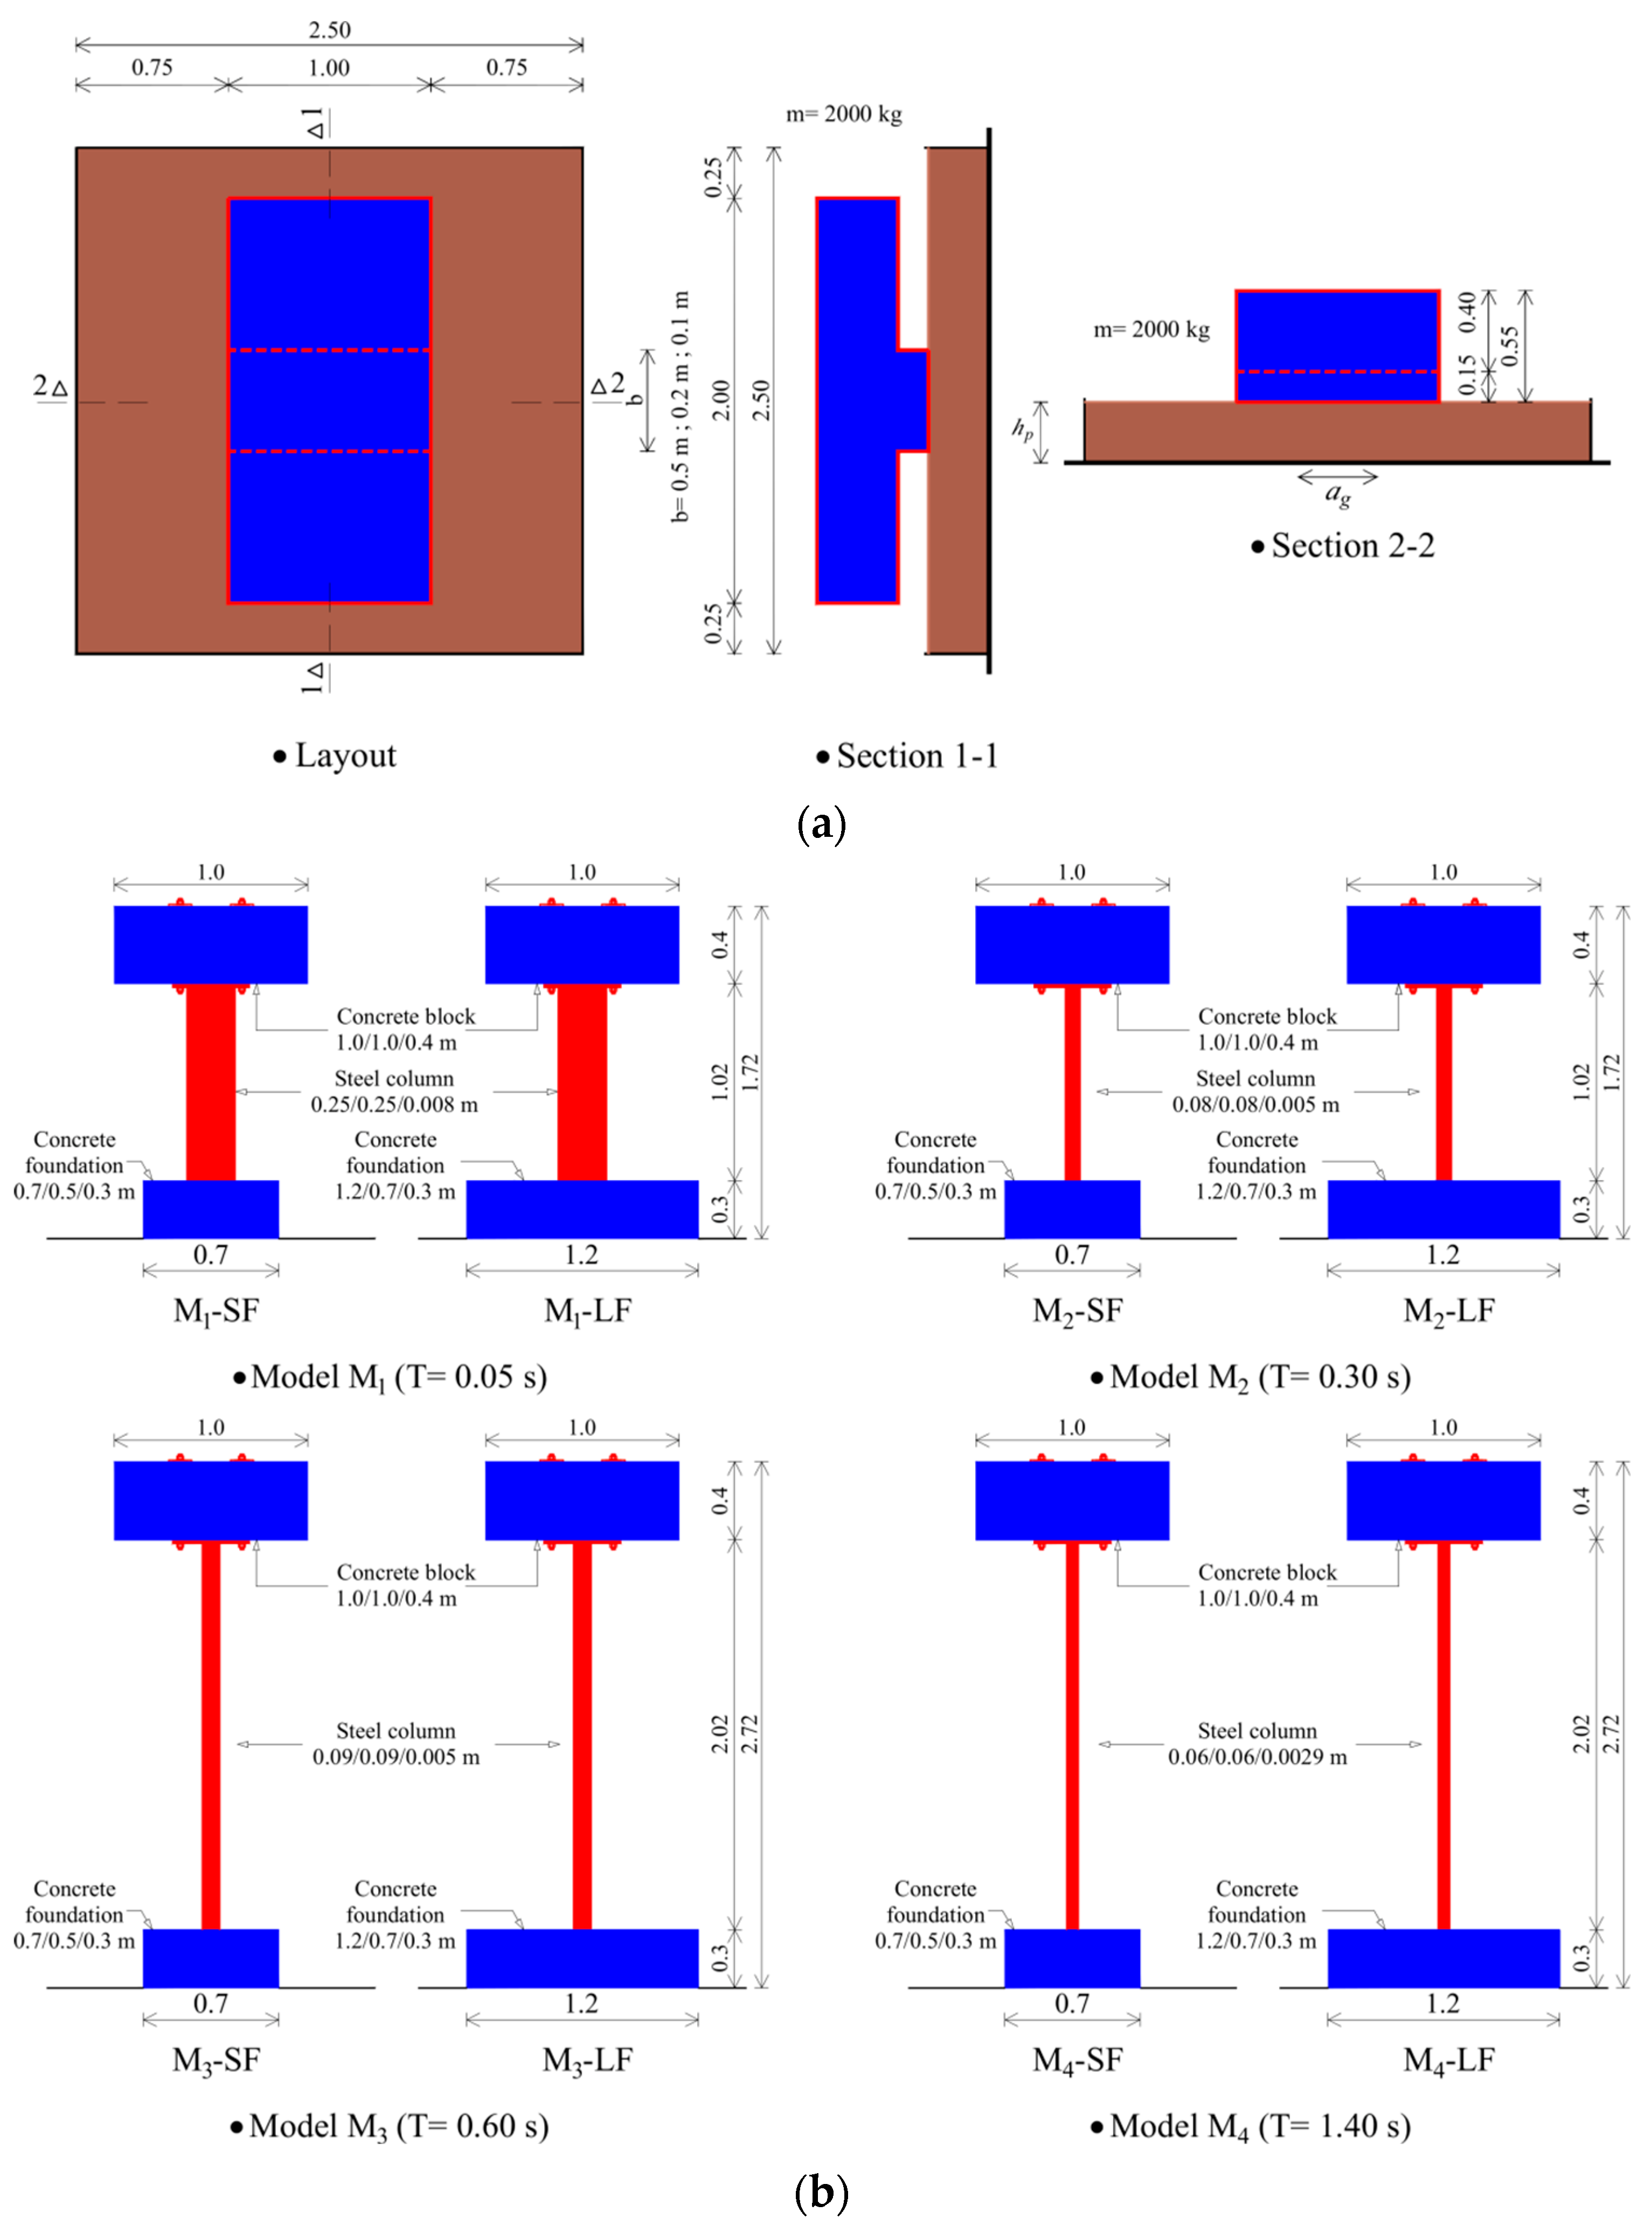
The first task was to determine the optimal layer of pebbles. The following parameters varied (Figure 1a): pebble fraction (4–8 mm, 8–16 mm, 16–32 mm), layer moisture content (10% and 60%), layer compaction (10 MPa, 30 MPa and 60 MPa), layer thickness (30 cm and 60 cm), vertical contact stress below the foundation (40 kPa, 100 kPa, and 200 kPa), and the effects of multiple excitations on the aseismic effectiveness of the layer [59]. The tests were performed as parametric analyses in which the observed parameter was varied while all other parameters remained unchanged. The rigid building model M0 was used for these tests (Figure 2a). Four acceleration diagrams (Figure 3) were applied with three levels of peak ground acceleration (PGA): 0.2 g, 0.4 g, and 0.6 g.
All tests were carried out on the uniaxial shaking table at the University of Split, Croatia. A load capacity of 20 t, a peak displacement of 0.15 m, a frequency of 0–30 Hz, and a maximum acceleration of up to 5 g are the basic technical characteristics of the shaking table used. The shaking table is controlled via acceleration, whereby the acceleration function is freely selectable. The weight of the test specimens, the displacement of the shaking table (acceleration), and the vibration frequency are interdependent. The data from all sensors were recorded and processed using the Quantum-X high-speed data acquisition system (Hottinger Baldwin Messtech-HBM) (sampling rate 200 Hz). Steel strain was monitored with 6/120 LY11 strain gauges (HBM), while displacements were measured with an analogue PB-25-S10-N0S-10C sensor (Uni Measure). Accelerations were measured with a 4610 accelerometer (Measurement Specialties) and all tests were recorded with a video camera.
Three records of real earthquakes (Ston earthquake (AS), Banja Luka earthquake (ABL), and Petrovac earthquake (AP)) and an artificial accelerogram (AA) were used. The artificial accelerogram (AA) is compatible with the elastic spectrum, type 1, from Eurocode 8 [66] and soil type A. It was generated with the SIMQKE software [67] as a superposition of sine functions.
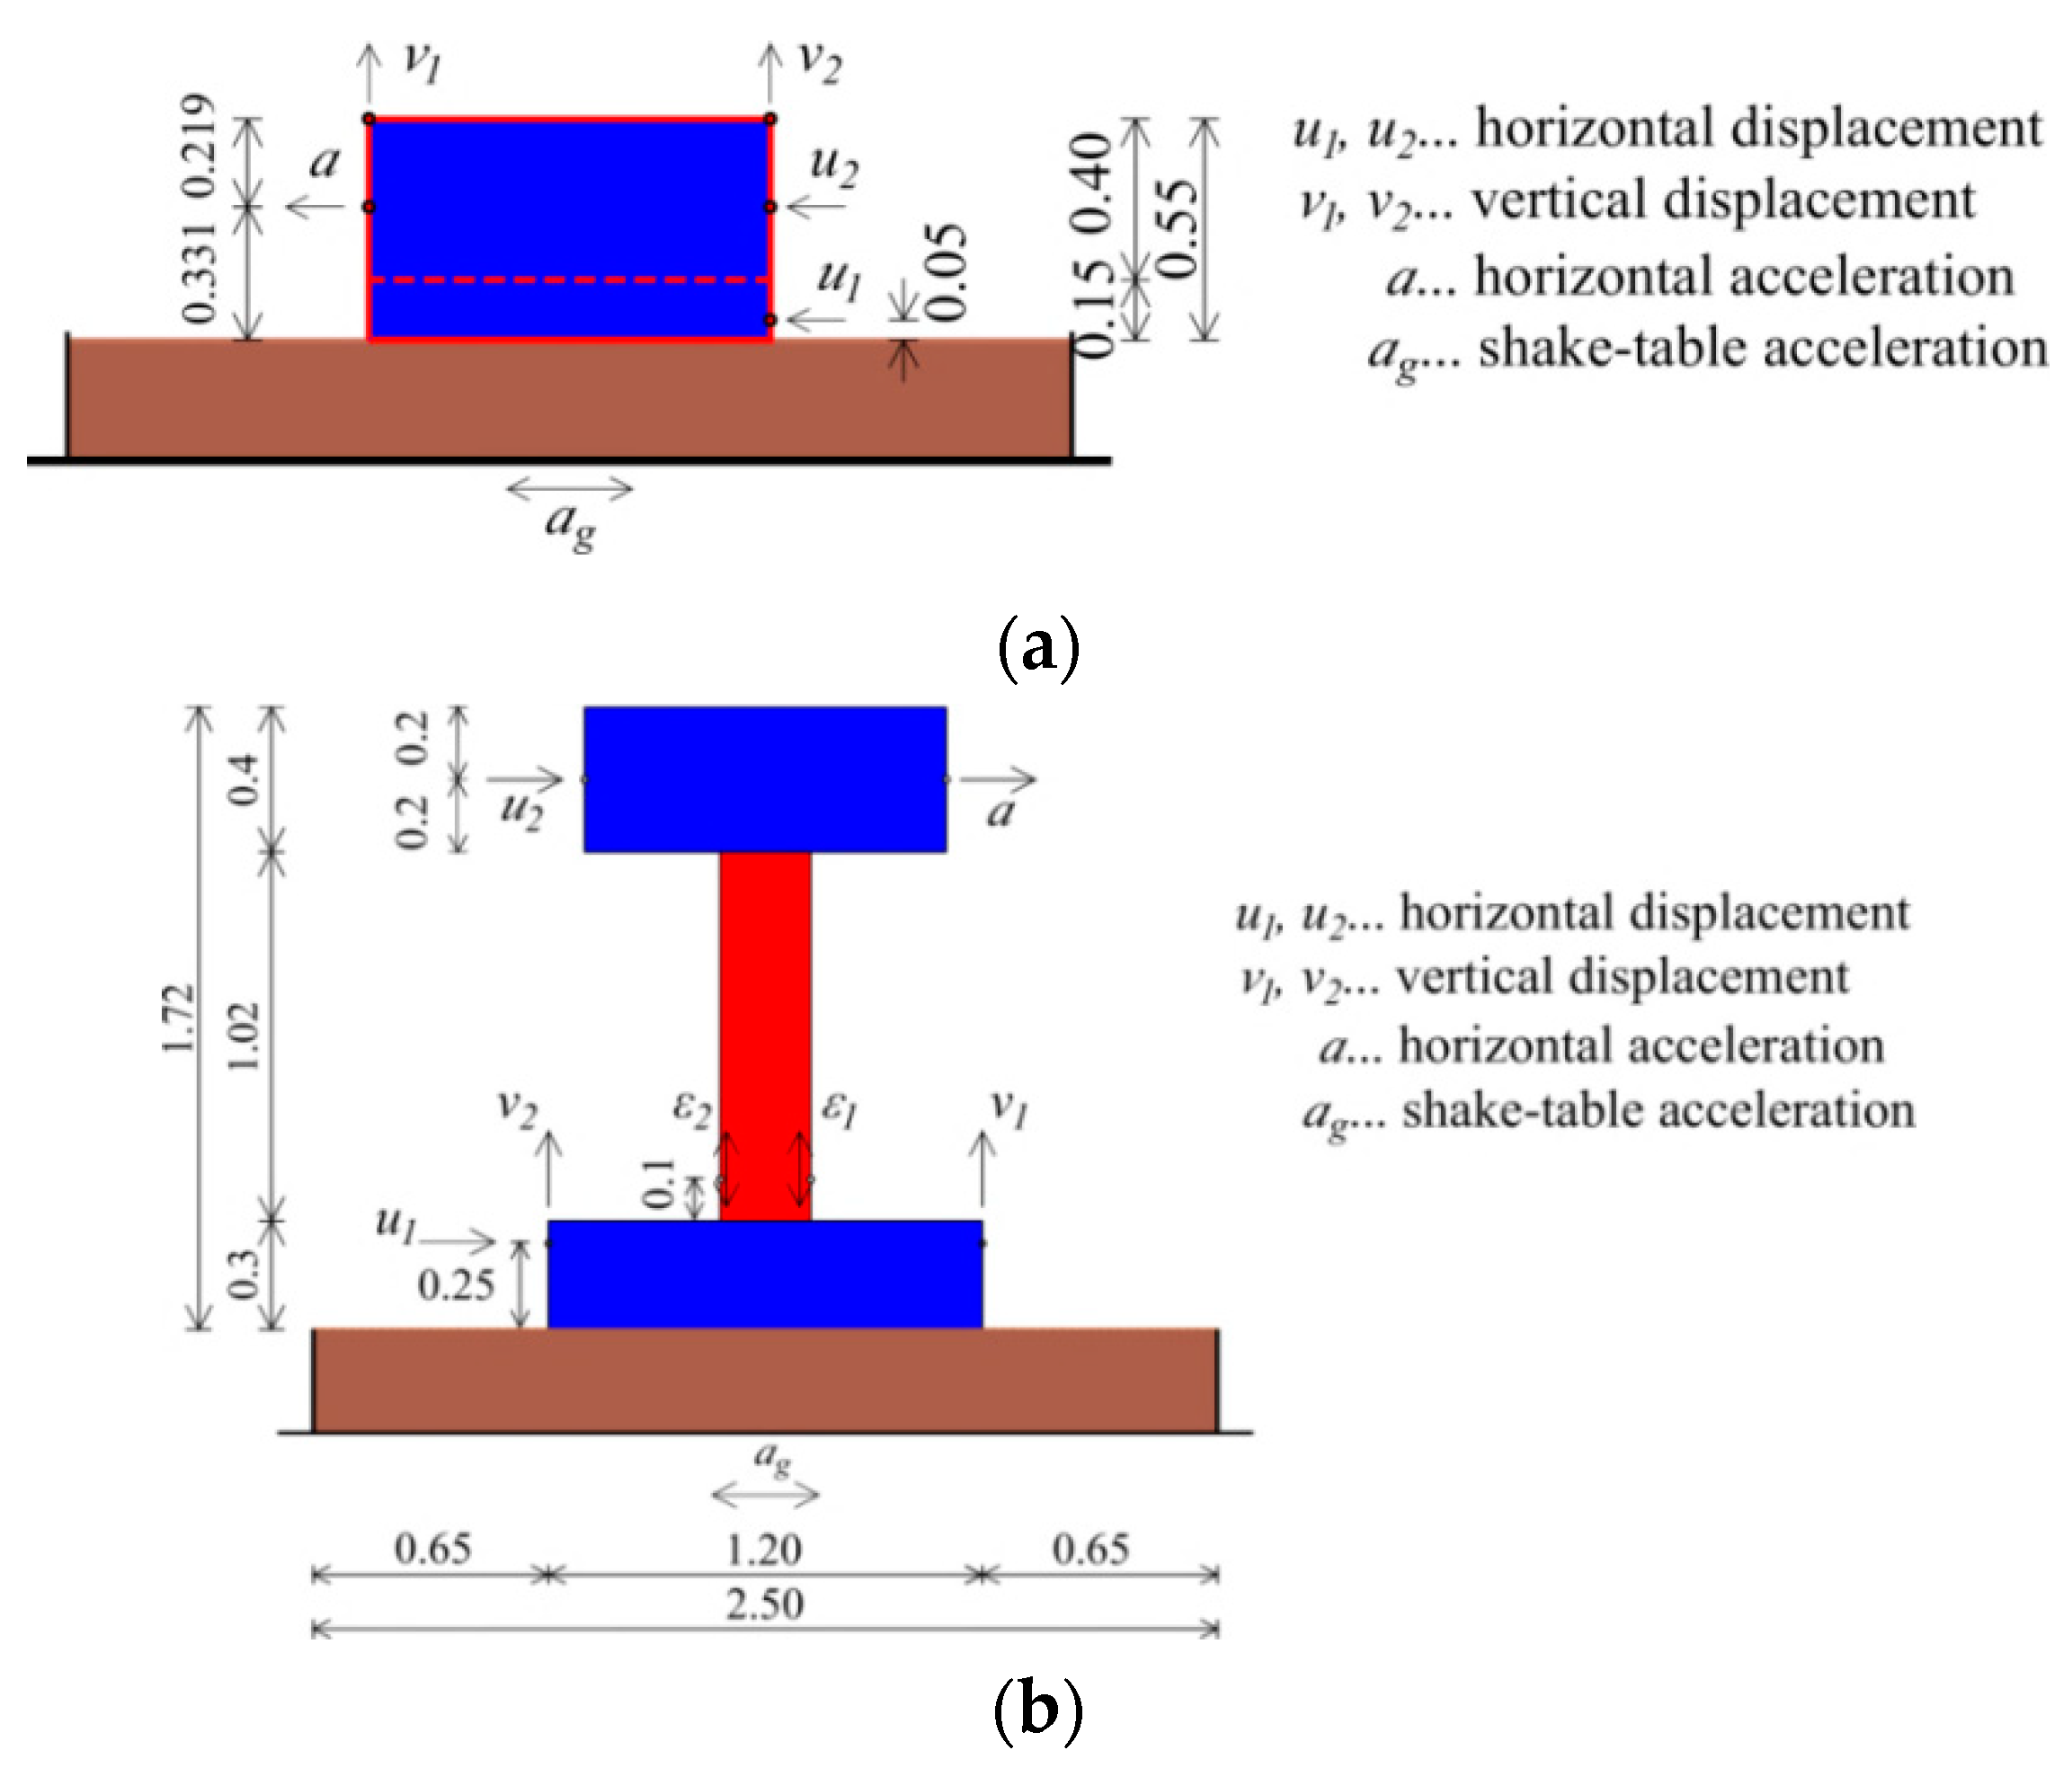
The M0 model is a concrete block consisting of several parts connected with screws, dimensions 100 cm × 200 cm × 40 cm, with weight 2000 kg. Since one of the parameters investigated was the contact stress under the model (40 kPa, 100 kPa, and 200 kPa), the M0 had three different contact areas. The tests were carried out for two types of support: on a rigid base (RB) and on a layer of pebbles in a rigid, immovable frame (dimensions 250 cm × 250 cm). The characteristic displacements and accelerations of the model were measured (Figure 4).
The tests carried out led to the conclusion that the type of acceleration program used and the height of the PGA have a major influence on the aseismic efficiency of the layer.
Furthermore, variations in parameter values had no significant effect on the efficiency of the aseismic layer. Considering the simplicity and speed of construction as well as the rationality of the layer, the following parameters for the pebble layer were optimal: fraction Φb = 16–32 mm, layer compaction 30 MPa, and layer moisture 10%. Therefore, we consider these layer properties to be optimal for a general layer that can be produced from any type of pebbles. Further research was carried out on this optimal layer.
2.2. Behavior of the Deformable Building Models M1–M4 on the Optimal Aseismic Layer ASL-1
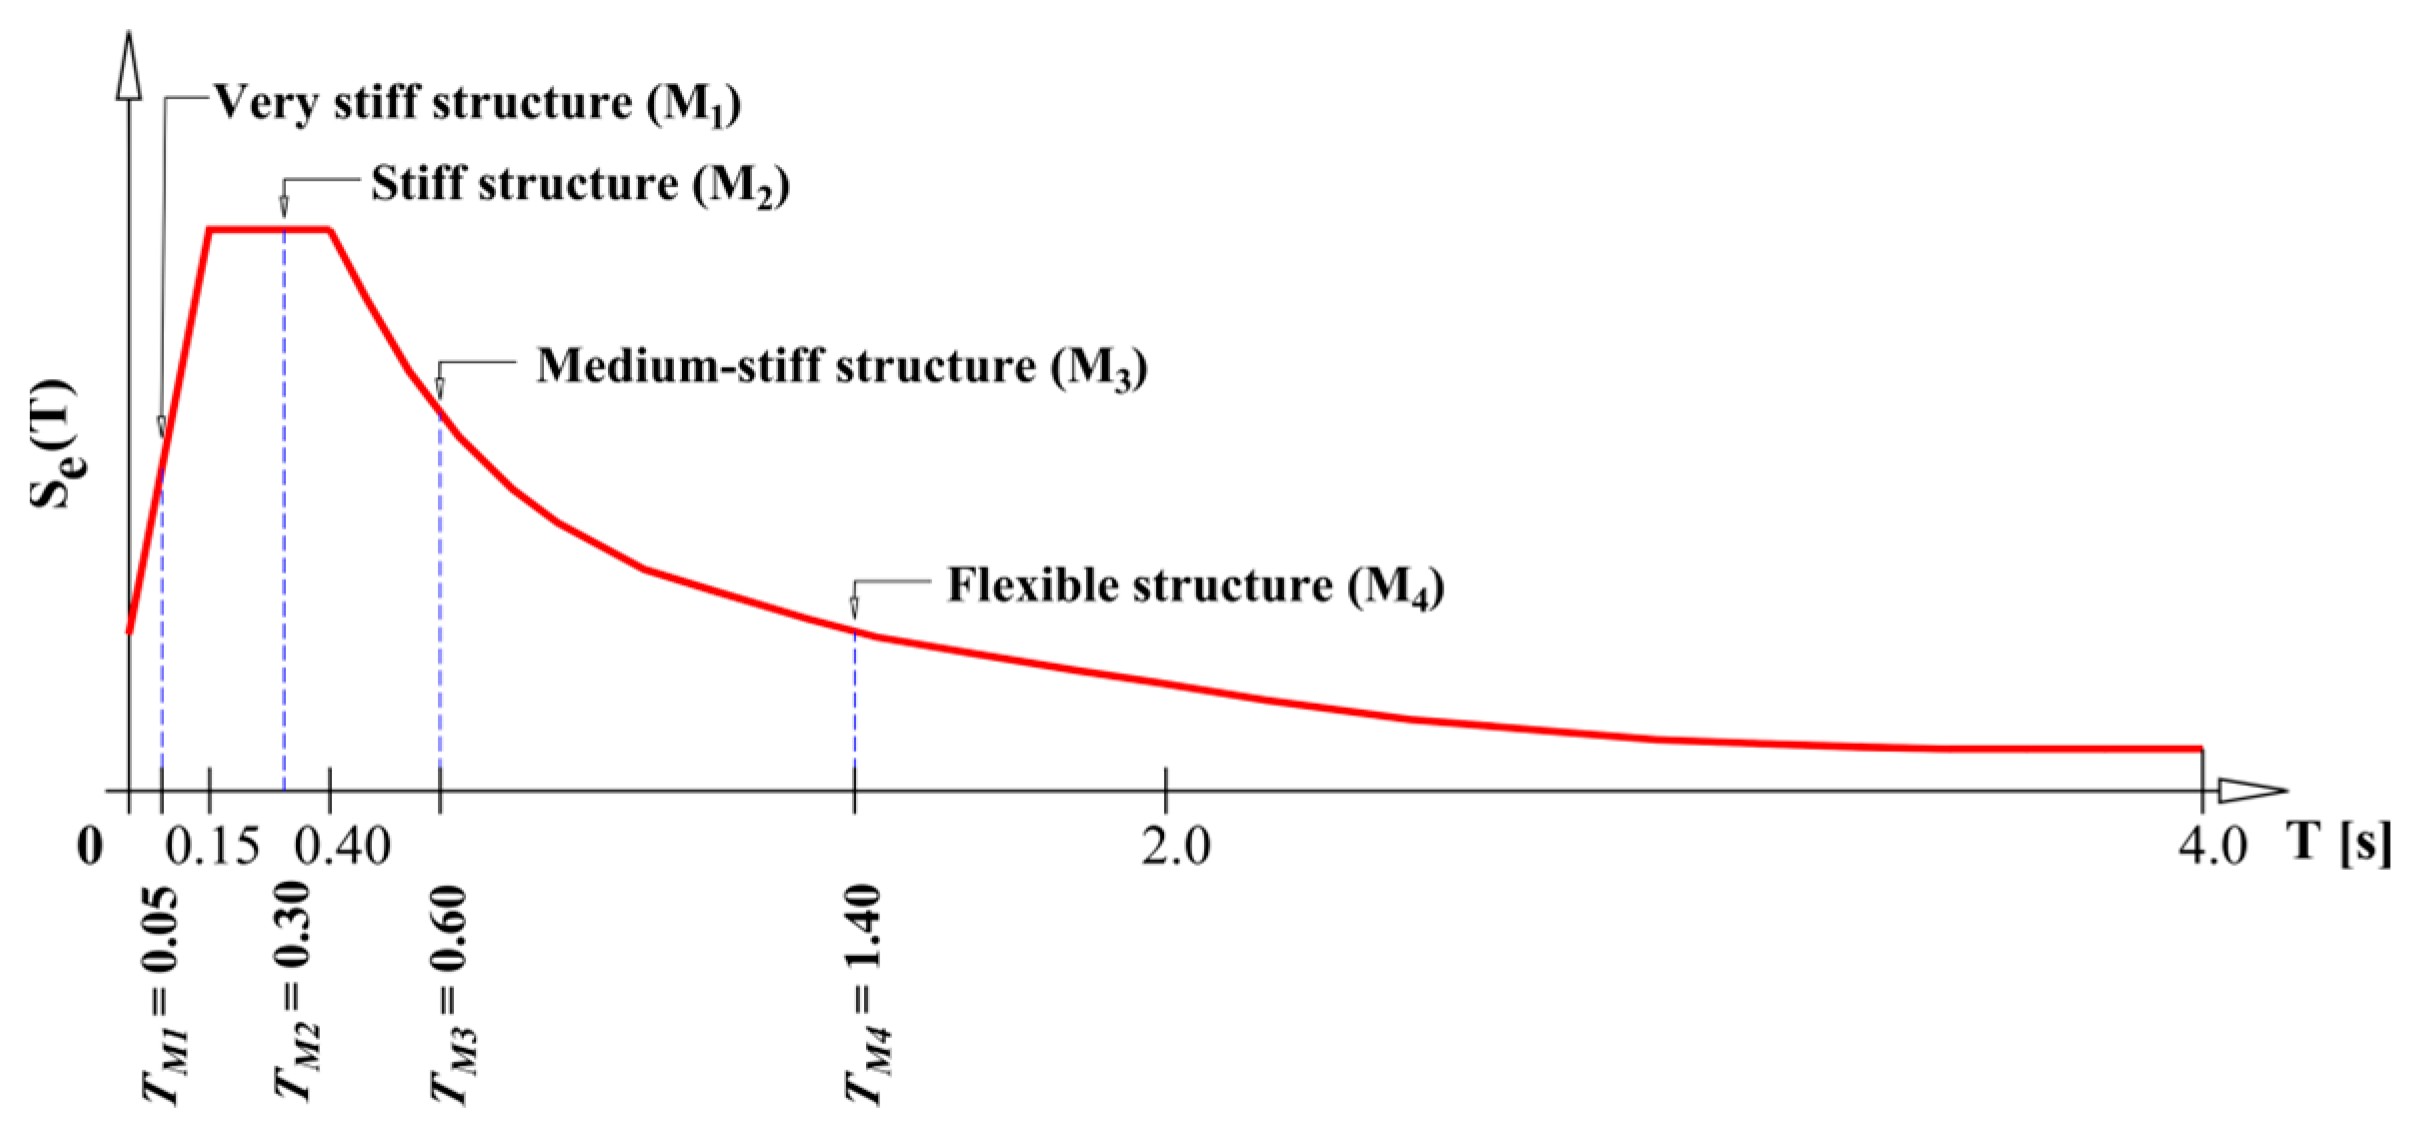
The efficiency of the optimal pebble layer, selected as part of the previous research presented in Section 2.1 [59], was tested experimentally on the deformable building models (M1–M4) shown in Figure 2b. As in the previous studies, the pebble layer was made in a rigid, immovable frame (dimensions 250 cm × 250 cm). Two stone layer thicknesses were tested: hp = 30 cm and hp = 60 cm. Four models with different stiffness were tested, which simulate buildings with a wide range of stiffness [50]. Model M1 represents a very stiff structure (T = 0.05 s), M2 a stiff structure (T = 0.3 s), M3 a moderately stiff structure (T = 0.6 s), and M4 a flexible structure (T = 1.4 s), where T is the fundamental period of vibration (Figure 5). The vibration periods T were determined numerically and confirmed by dynamic testing on a shaking table for the rigid base case [64]. A concrete block (m = 1000 kg) rigidly connected to the column top was used for all tested specimens.
The column is made of quality steel S355, and the cross-section is a hollow, hot-rolled square tube with different dimensions. The cross-sectional properties were chosen to give the models the specified target periods T. The column was rigidly connected to a concrete foundation (70 cm × 50 cm × 30 cm), which was the same size for all models tested. The same models were then tested with much larger foundation dimensions (120 cm × 70 cm × 30 cm) to gain insight into the efficiency of seismic base isolation with little effect of foundation uplift (rocking) [61]. All samples were first tested for the case of classical support on a rigid base without seismic isolation. It was assumed that RB foundations prevent horizontal movement and allow the foundation to rotate and lift. Then, the specimens were tested on the considered aseismic layers. All models were subjected to four accelerograms (Figure 3). The maximum accelerations of the accelerograms were set at lower values to keep the stress in the models in the linear range (for M1 and M2 the PGA was 0.3 g, while for M3 and M4 it was 0.2 g). In this way, the efficiency of seismic isolation is clearly demonstrated without the influence of the nonlinearity of the model material. Part of the tests was performed by gradually increasing the PGA for the most unfavorable accelerogram (AA) until the structure collapsed. The objective of these tests was to determine the difference in the bearing capacity of the structural model with and without seismic isolation. Characteristic accelerations, displacements, and strains of the model were measured (Figure 4b).
To evaluate the efficiency of seismic isolation, the measured accelerations, displacements, and strains were compared on the tested seismic-isolation-based structural model and on the corresponding rigid-based model. Thus, in addition to each model with a seismic isolation layer, the same rigid base model (without a seismic isolation layer) was also tested. The ratio of the measured peak horizontal acceleration at the center of mass at the top of the column for the two cases mentioned was used as an indicator (coefficient) of the effectiveness of seismic isolation. In addition to acceleration, the most important indicator of isolation effectiveness was the strain/stress reduction in the isolated structural model.
- The highest seismic isolation efficiency was obtained for M1, followed by M2, M3, and M4. Moreover, the isolation efficiency was greater as the stiffness of the structure increased.
- Regardless of the model tested, the seismic isolation efficiency was strongly dependent on the type of acceleration program applied.
- For the case of a single base acceleration of the adopted excitation with elastic strain/stress in the model column, models with larger foundations were found to result in higher accelerations, larger column strains, significantly smaller foundation and column top displacements, and significantly smaller vertical foundation displacements. Therefore, only the model with a larger foundation, which has a higher conservative isolation efficiency, was tested further.
- The highest efficiency of this seismic isolation was obtained for the M1 and M2 structural models (T < 0.3 s). For the M3 and M4 models (T > 0.6 s), the effectiveness of ASL-1 is low or even detrimental.
3. Stone Pebble Layer with Sliding Geogrid and Geomembrane Layers as GSI Layer—ASL-2
3.1. Optimal Aseismic Layer ASL-2
The optimal pebble layer, ASL-1, from Section 2.1 is improved with various geosynthetics to obtain an even more efficient layer: ASL-2 [63]. The thicknesses of the pebble layer and the locations and tensile strength of the geosynthetics within the pebble layer were varied. Eleven different seismic isolation layers were created and tested (Figure 6a). The purpose of combining geosynthetics with a layer of pebbles is to provide additional energy dissipation through sliding. The M0 model from [59] was used (Figure 2a), as well as the assumed base accelerations from Figure 3 (PGA = 0.2 g, 0.4 g, and 0.6 g, respectively).
The results of the experiment showed that the average ASL-2 had a higher efficiency than the ASL-1 isolation. However, some ASL-2 isolations were less effective than ASL-1. The most efficient ASL-2 isolations were those with a geogrid on the top of the pebble layer (B2 and B10 shown on Figure 6a). The B2 isolation was selected as the simplest and most practical application. The peak acceleration of the M0 based on the B2 and B10 isolations was, on average, 16% lower for all excitations (regardless of the PGA level) than that based only on the ASL-1 isolation of pebbles (labelled as layer B1 in Figure 6a).
3.2. Behavior of the Deformable Building Models M1–M4 on the Optimal Aseismic Layer ASL-2
The efficiency of the optimal aseismic layer, ASL-2, determined in the research presented in Section 3.1 [63], was experimentally tested on models M1–M4 with a larger foundation (Figure 2b). Four different foundation variants were investigated (rigid base—RB; 30 cm high layer of pebbles—BI1; 30 cm high layer of pebbles with geogrid on the top—BI2; and 60 cm high layer of pebbles with geogrid on the top—BI3) [64]. The same method was used as in the study of the ASL-1 isolation layer presented in Section 2.2. Equal excitations (Figure 3) were also assumed. The effectiveness of the seismic isolations for the AA excitation to collapse the model was also investigated.
The test results have shown that the highest efficiency of this seismic Isolation applies to structural models M1 and M2 (T < 0.3 s). For models M3 and M4, the effectiveness of this isolation is low or even detrimental. This is a well-known fact that was confirmed by experimental testing: it makes no sense to apply seismic isolation in a structure with a high period (approx. T > 0.6 s). The average efficiency coefficients of seismic isolation for the M1 and M2 models were as follows: BI2 vs. RB = 0.75; BI2 vs. BI1 = 0.90; and BI2 vs. BI3 = 0.92. The composite seismic isolation BI2 proved to be the most efficient, with the largest reduction in earthquake force and strain/stress in the model. For four different earthquake accelerograms, this reduction was 25%, which is considered very encouraging for possible practical application.
4. Most Important Research Results and Discussion
In order to highlight the main research results that are crucial for assessing the effectiveness of the considered seismic isolations and the possibility of their application in practice, they are presented only for the substrates shown in Figure 7, while the appearance of model M1 on the shake table before the test is shown in Figure 8.
The results are presented for all applied excitations (AA, AP, AS, and ABL) in order to determine the models’ behavior under various earthquakes. The test results are presented separately for the rigid model M0 and for the deformable models M1 and M2.
4.1. Results for the Rigid Structural Model—M0
The peak acceleration am of the M0 model for all excitations applied depending on the substrate type (RB, BI1, and BI2) and PGA level is presented in Figure 9. The mean value of the results and the result envelope were also drawn for each substrate. It is noticeable that the peak am values significantly depend on the type of applied excitation (AA, AP, AS, and ABL) and the substrate type (RB, BI1, and BI2).
For all substrate types, the ABL excitation was the most favorable, and, on average, AA was the least favorable, followed by AP and AS. It is interesting to note that acceleration am increases disproportionately with increasing PGA level. It is also noted that the am is higher on the RB than on the BI1 isolation and especially higher than on the BI2 isolation.
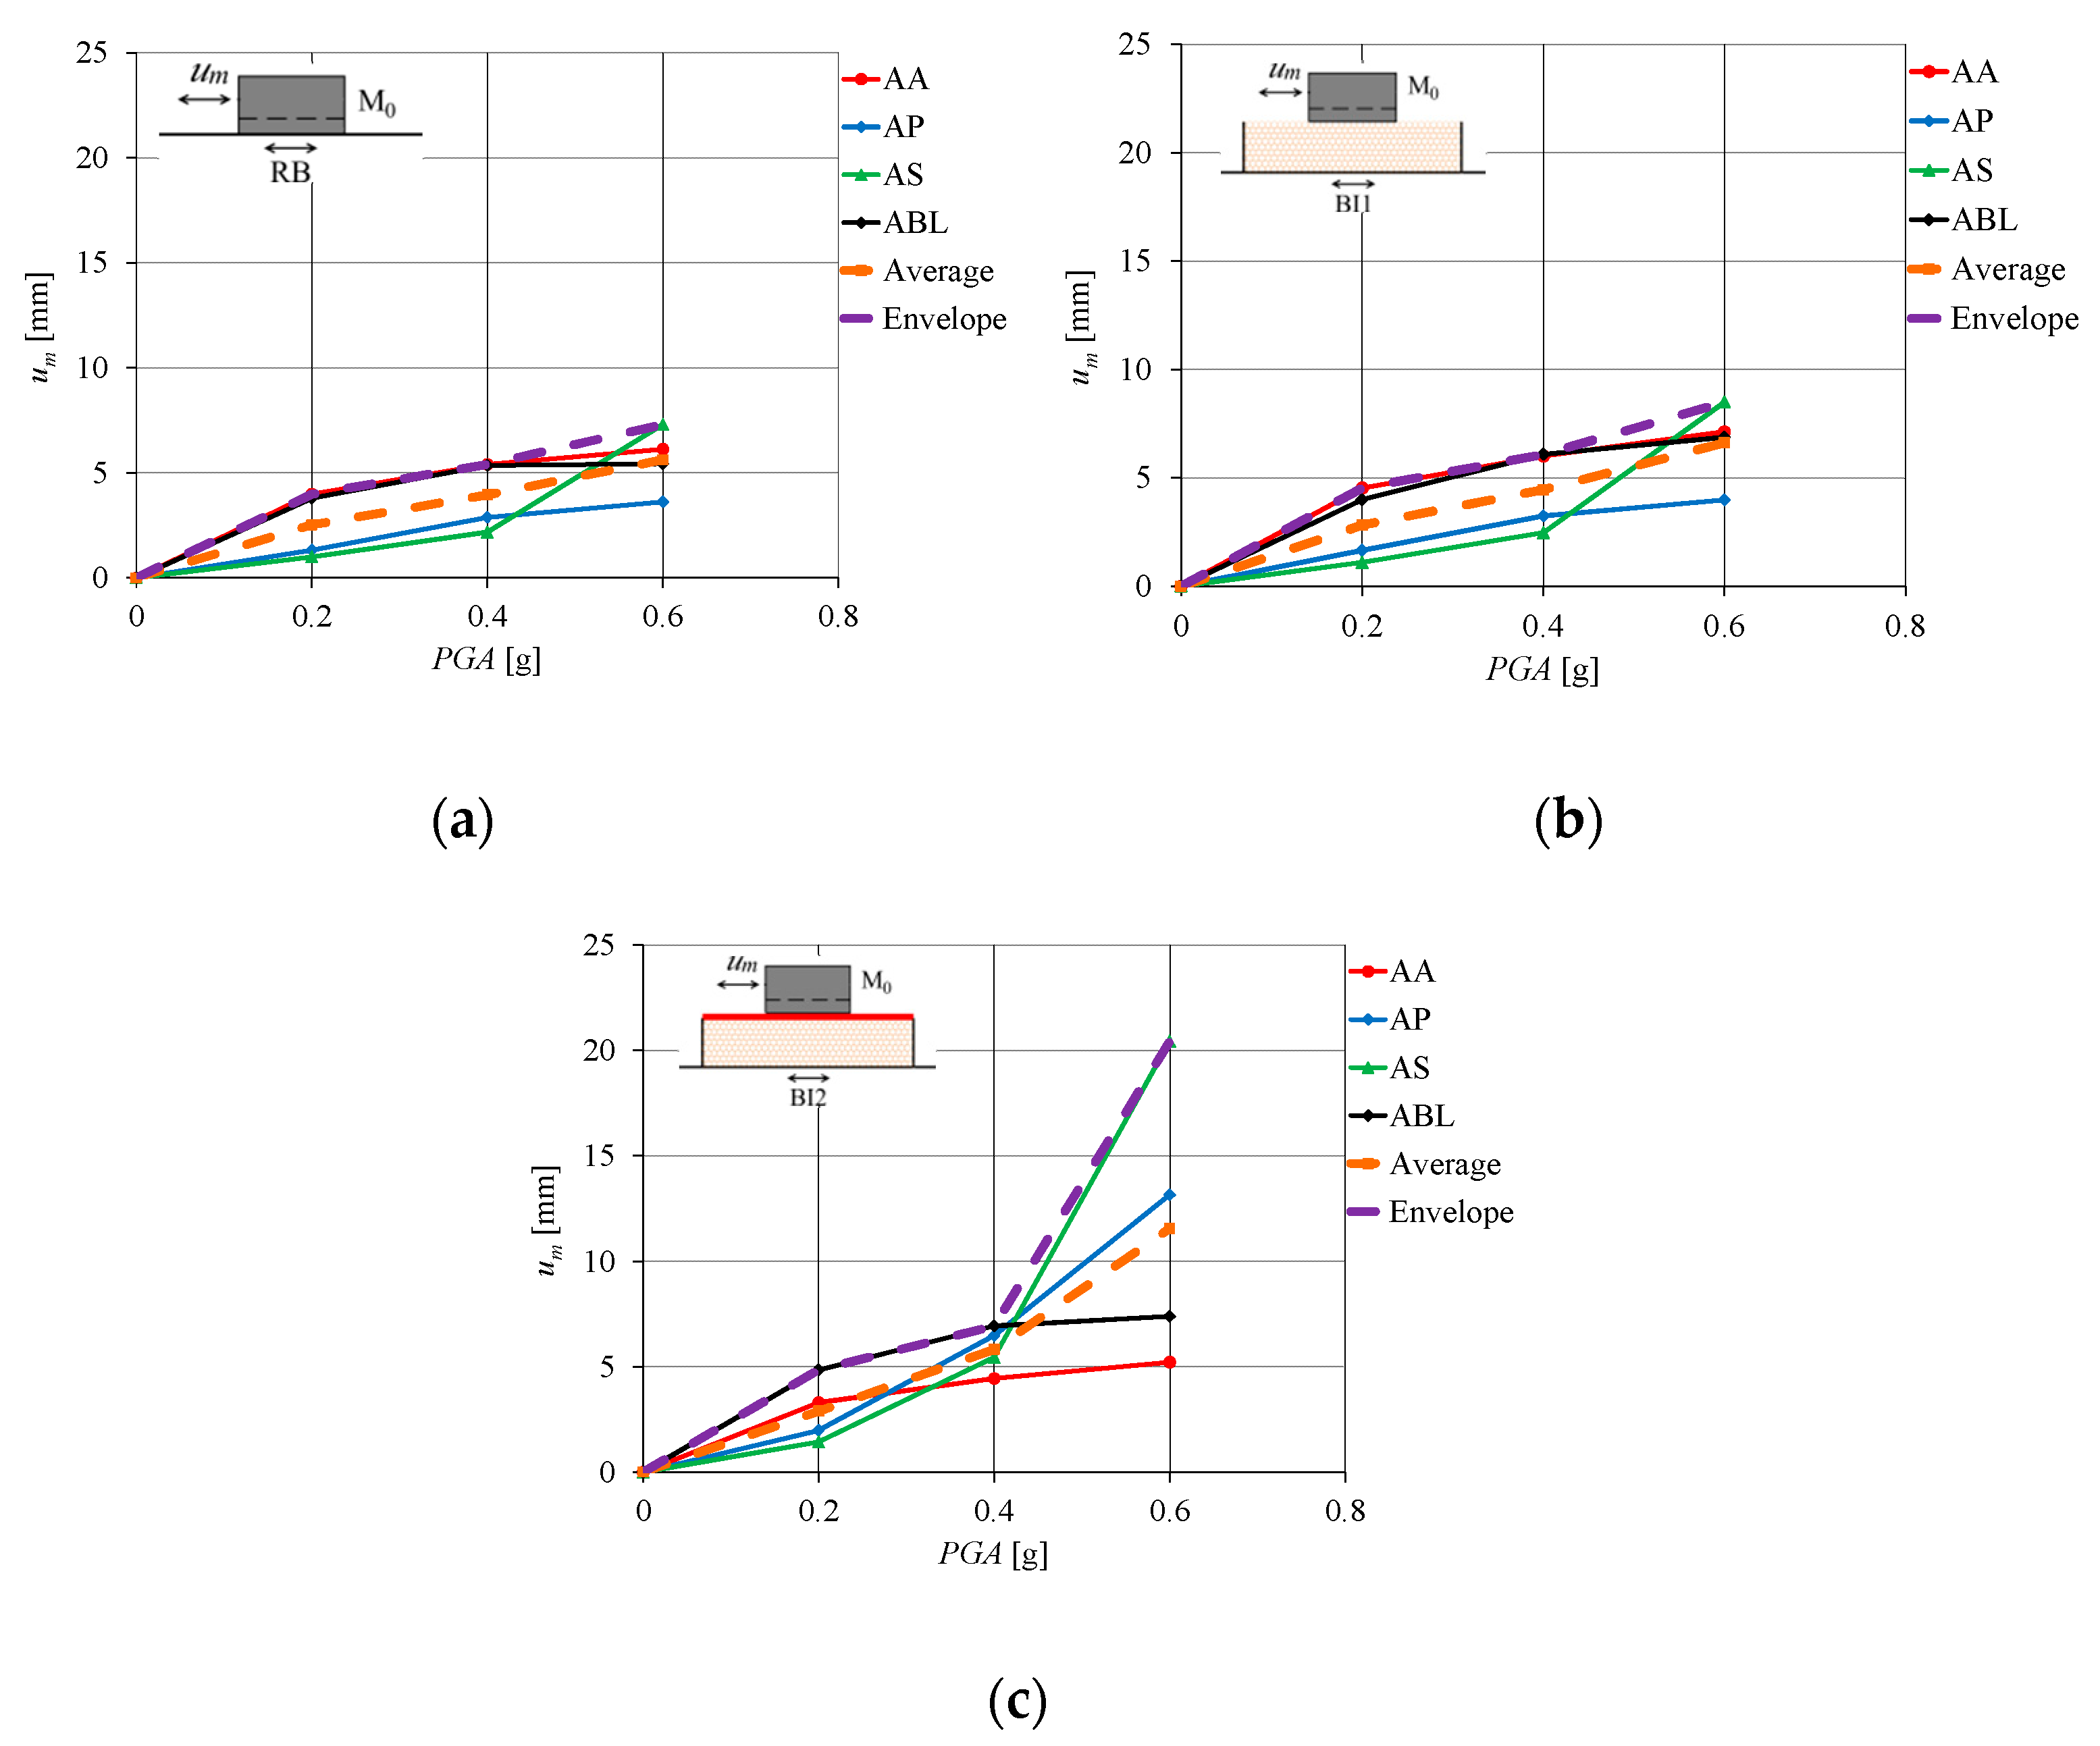
The peak displacement um of model M0 for all applied excitations as a function of substrate type (RB, BI1, and BI2) and PGA level is shown in Figure 10. The mean of the results and the result envelope were also plotted for each substrate. The previously mentioned conclusions about acceleration also apply to the displacements. The peak values of um depend significantly on the excitation type, PGA, and the substrate type. The impact-type earthquakes AS and ABL resulted in large displacements, especially at high PGA levels, i.e., they were the most unfavorable. The unfavorable effect of impact-type earthquakes on the rigid model is explained by the dominant influence of shear force relative to bending.
The envelope of the peak acceleration am of all excitations acting on M0 on substrates RB, BI1, and BI2 is shown in Figure 11. For PGA = 0.6 g, the am ratio is RB:BI1:BI2 = 1:1.19:1.36, and for PGA = 0.2 g, this ratio is RB:BI1:BI2 = 1:1.14:1.48. In terms of am, BI1 isolation is about 19% and BI2 isolation is about 36% more favorable than conventional RB.
The envelope of the peak displacement um of all excitations acting on M0 based on RB, BI1, and BI2 substrates is shown in Figure 12. For PGA = 0.6 g, the um ratio is RB:BI1:BI2 = 1:1.14:2.80, so the isolation of BI1 results in an approximately 14% larger um and the isolation of BI2 results in an approximately 280% larger um than for RB. It is obvious and was expected that a soft substrate (especially BI2 with a sliding layer on top) leads to a larger model displacement than a rigid substrate. For PGA ≤ 0.4 g (lower values of earthquake acceleration), the displacements for BI1 and BI2 are only slightly larger than for RB.
4.2. Research Results for the Structural Models M1 and M2
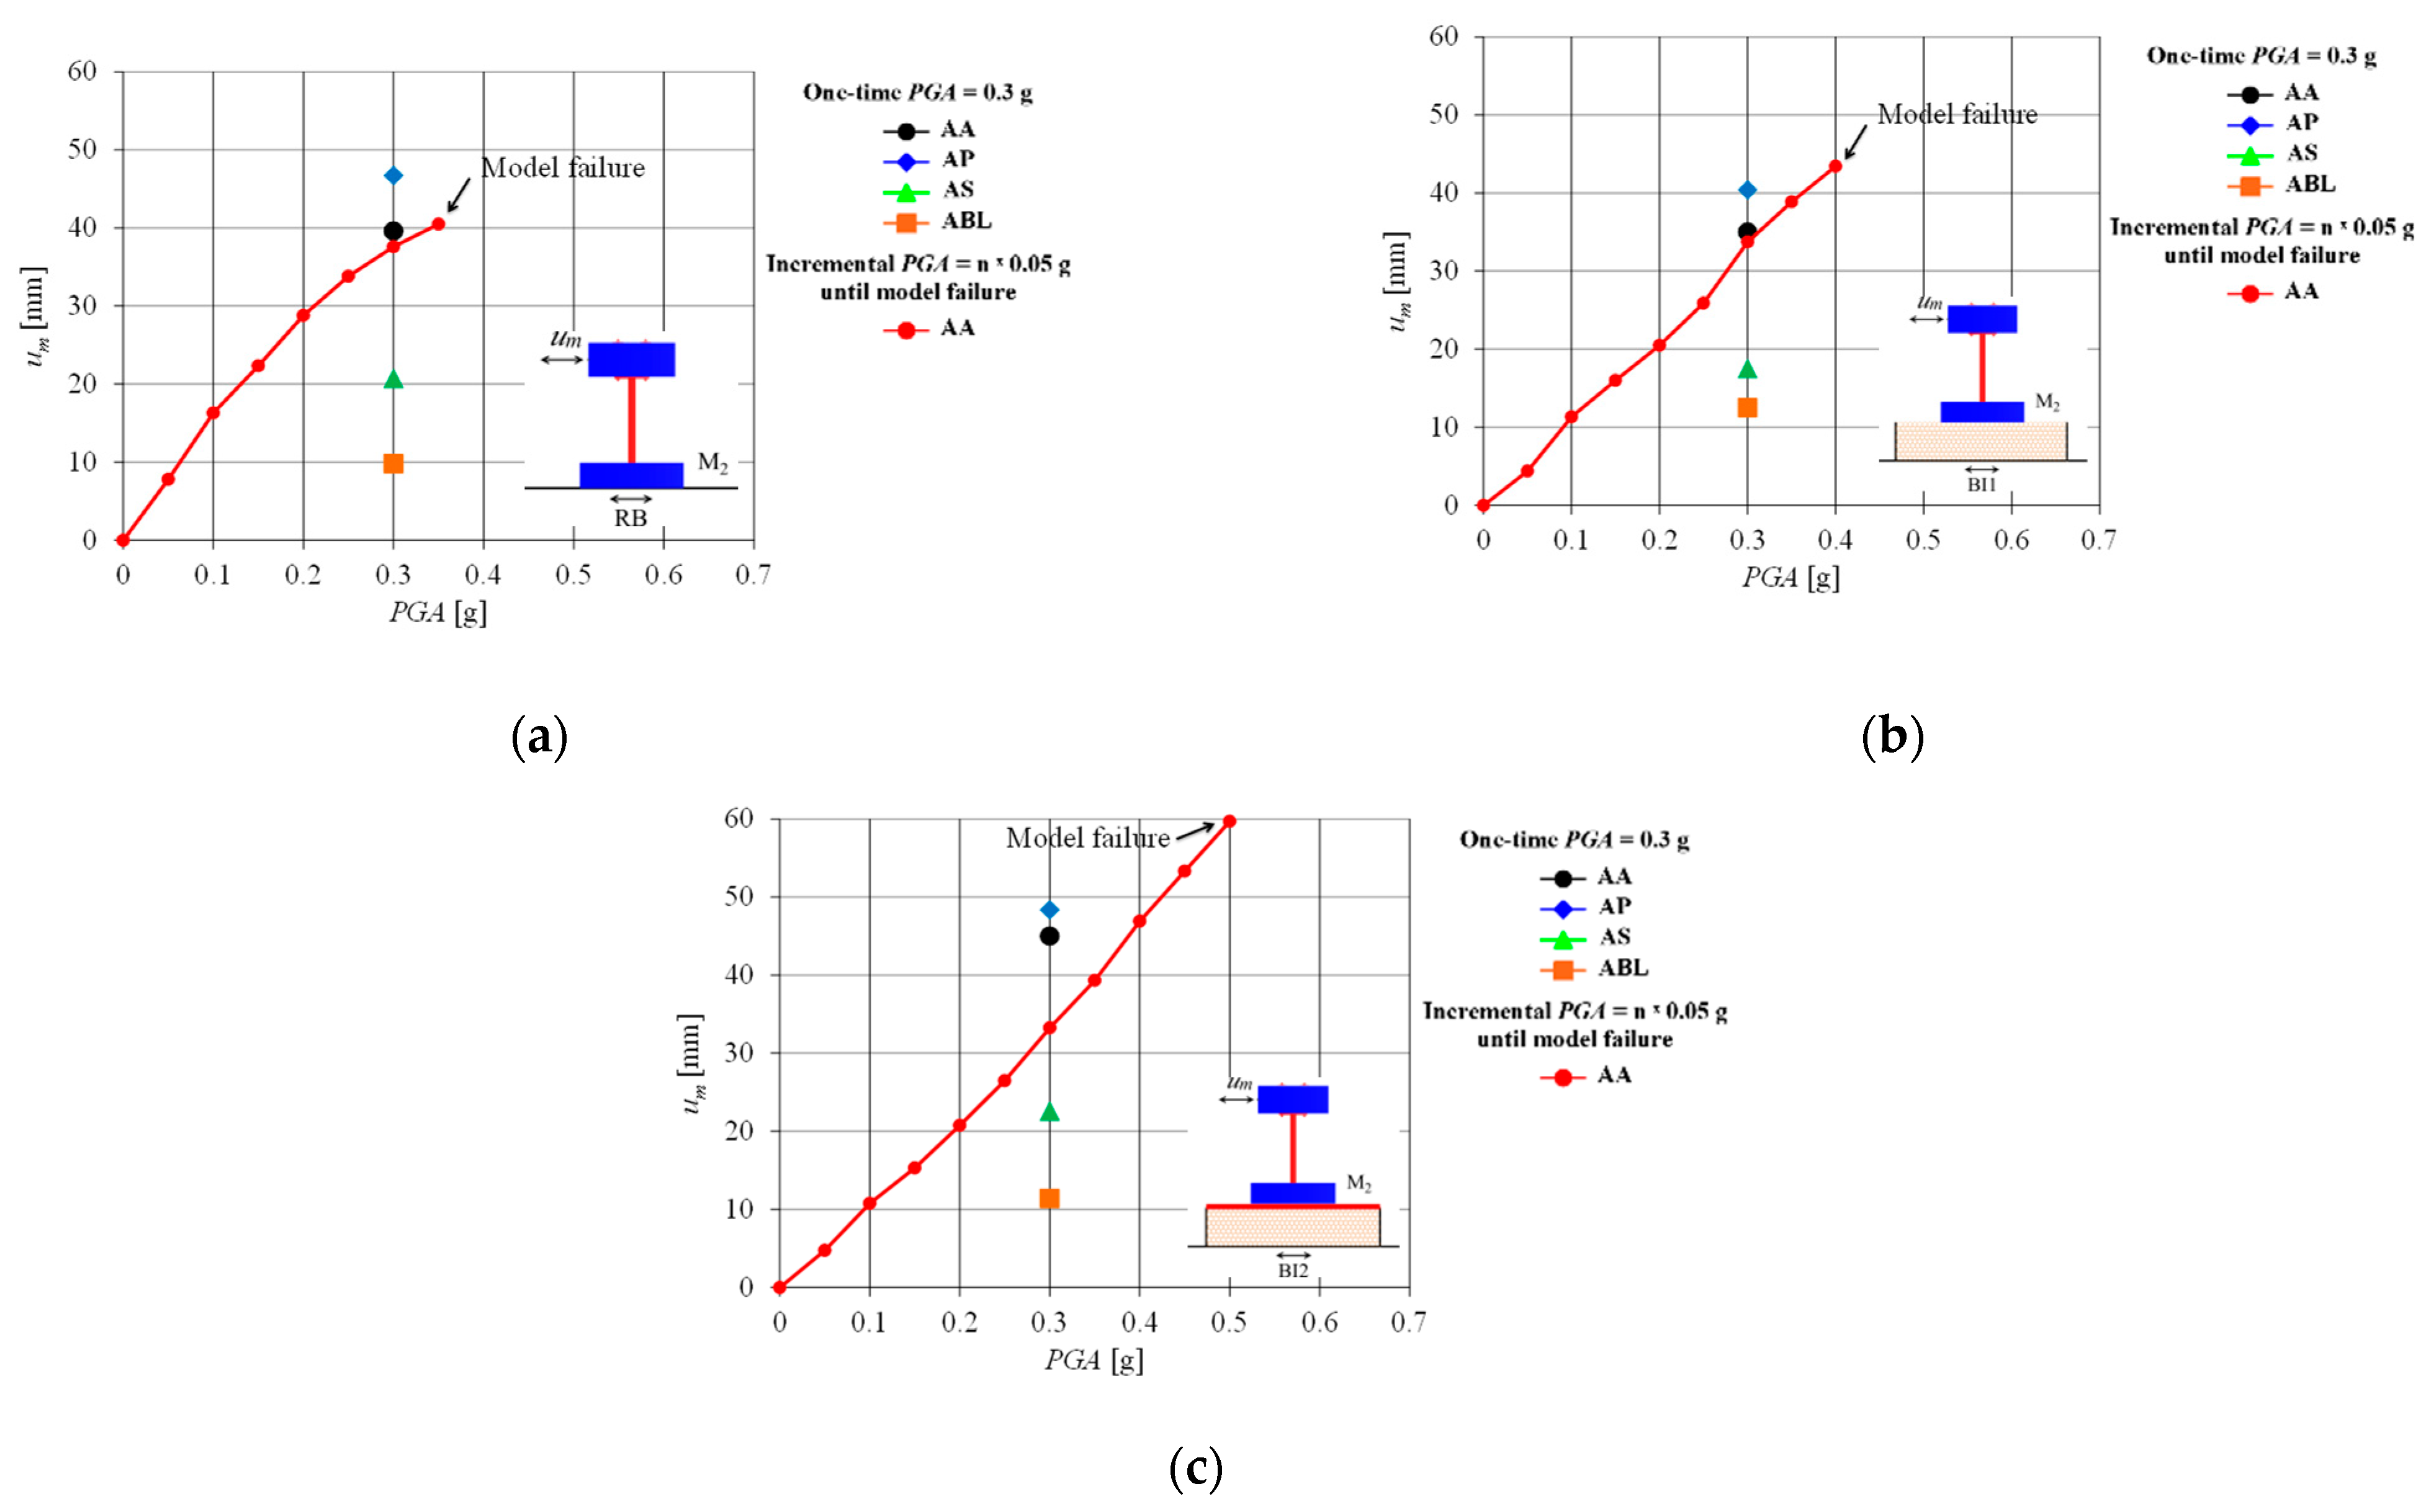
Due to the large scale of experimental testing, models M1 and M2 were tested for a single base excitation with PGA = 0.3 g for AA, AP, AS, and ABL, while model testing with successive increase in PGA until collapse of the structure was performed only for excitation AA (successive increase in PGA by 0.05 g). Structure collapse was defined as failure of the steel column or when the model lost stability. It should be emphasized here that the displacement and strain state of the model for a single excitation with PGA = 0.3 g is more favorable than the displacement and strain state for the same excitation and PGA when the model is previously subjected to a series of excitations with lower PGA = n × 0.05 g (n = 1 to 5). For the above reason, these two states are different.
The peak acceleration am of M1 based on RB, BI1, and BI2 is shown in Figure 13. It is interesting to note that acceleration am increases disproportionately with increasing PGA level. It is also noted that the am for the same structural model is higher on the RB than on the BI1 and especially on the BI2.
The am of the M2 based on RB, BI1, and BI2 is shown in Figure 14, and analogous statements apply for the M1 model shown in Figure 13.
The peak acceleration am of all excitations applied to M1 and M2 based on RB, BI1, and BI2 is shown in Figure 15. M1 (Figure 15a) based on RB collapsed at PGA = 0.4 g, based on BI1 isolation collapsed at PGA = 0.55 g, and based on BI2 collapsed at PGA = 0.6 g. At the above PGAs, am was 15.44 ms−2 for RB, 12.63 ms−2 for BI1, and 12.59 ms−2 for BI2, respectively. It is obvious that the seismic isolation of BI1 and especially BI2 is more favorable than the classical foundation on a rigid base. The above conclusions are also valid for M2 (Figure 15b). M2 (Figure 15b) based on the RB collapsed at PGA = 0.35 g, based on BI1 isolation collapsed at PGA = 0.45 g, and based on BI2 collapsed at PGA = 0.50 g. At the above PGAs, am was 18.46 ms−2 for RB, 14.43 ms−2 for BI1, and 14.52 ms−2 for BI2, respectively. Thus, it can be concluded that BI1 and especially BI2 are more favorable than the classical foundation on an RB.
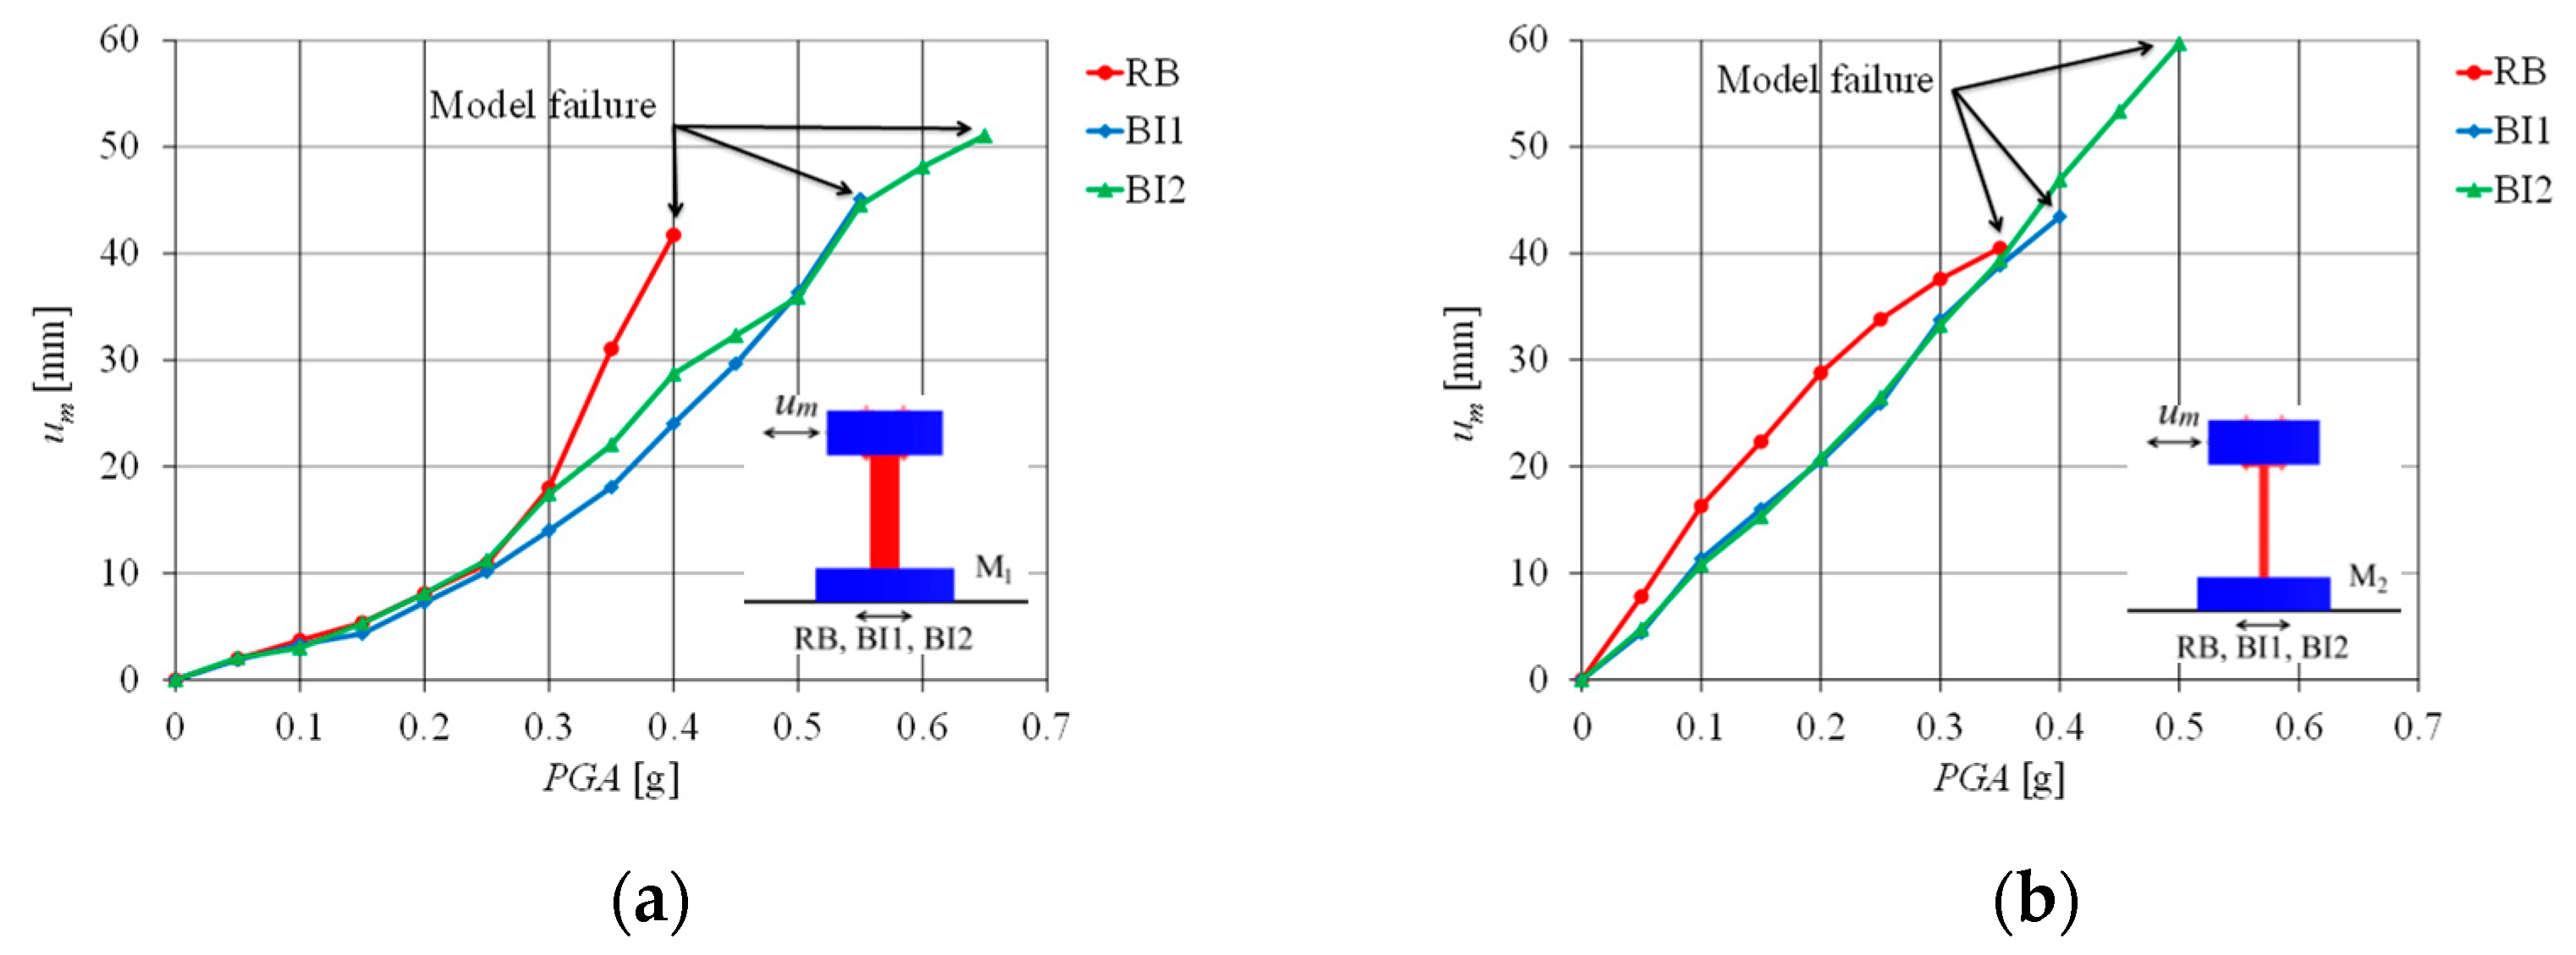
The peak displacement um of M1 is shown in Figure 16. For PGA ≤ 0.4 g, when M1 collapsed on the RB, the seismic-isolation-based models had slightly smaller displacements than the corresponding model on the RB, which is favorable. The smaller displacements of M1 and M2 based on seismic isolation compared to the displacement of M0 on the same substrate are explained by the smaller influence of shear force (sliding of the foundation on the layer’s top) on M1 and M2 compared to M0.
The peak displacement um of M2 is shown in Figure 17. It is noted that until the collapse of the model on the RB, the displacements of M2 on BI1 and BI2 were also slightly lower than on the RB, which is also favorable.
The peak displacements um for the M1 and M2 models based on RB, BI1, and BI2 are shown in Figure 18. In this figure, it can be seen more clearly what is shown in Figure 16 and Figure 17. Thus, it can be seen that the displacements (and not only the accelerations) of M1 and M2 on BI1 and BI2 are also more favorable than in the case of RB.
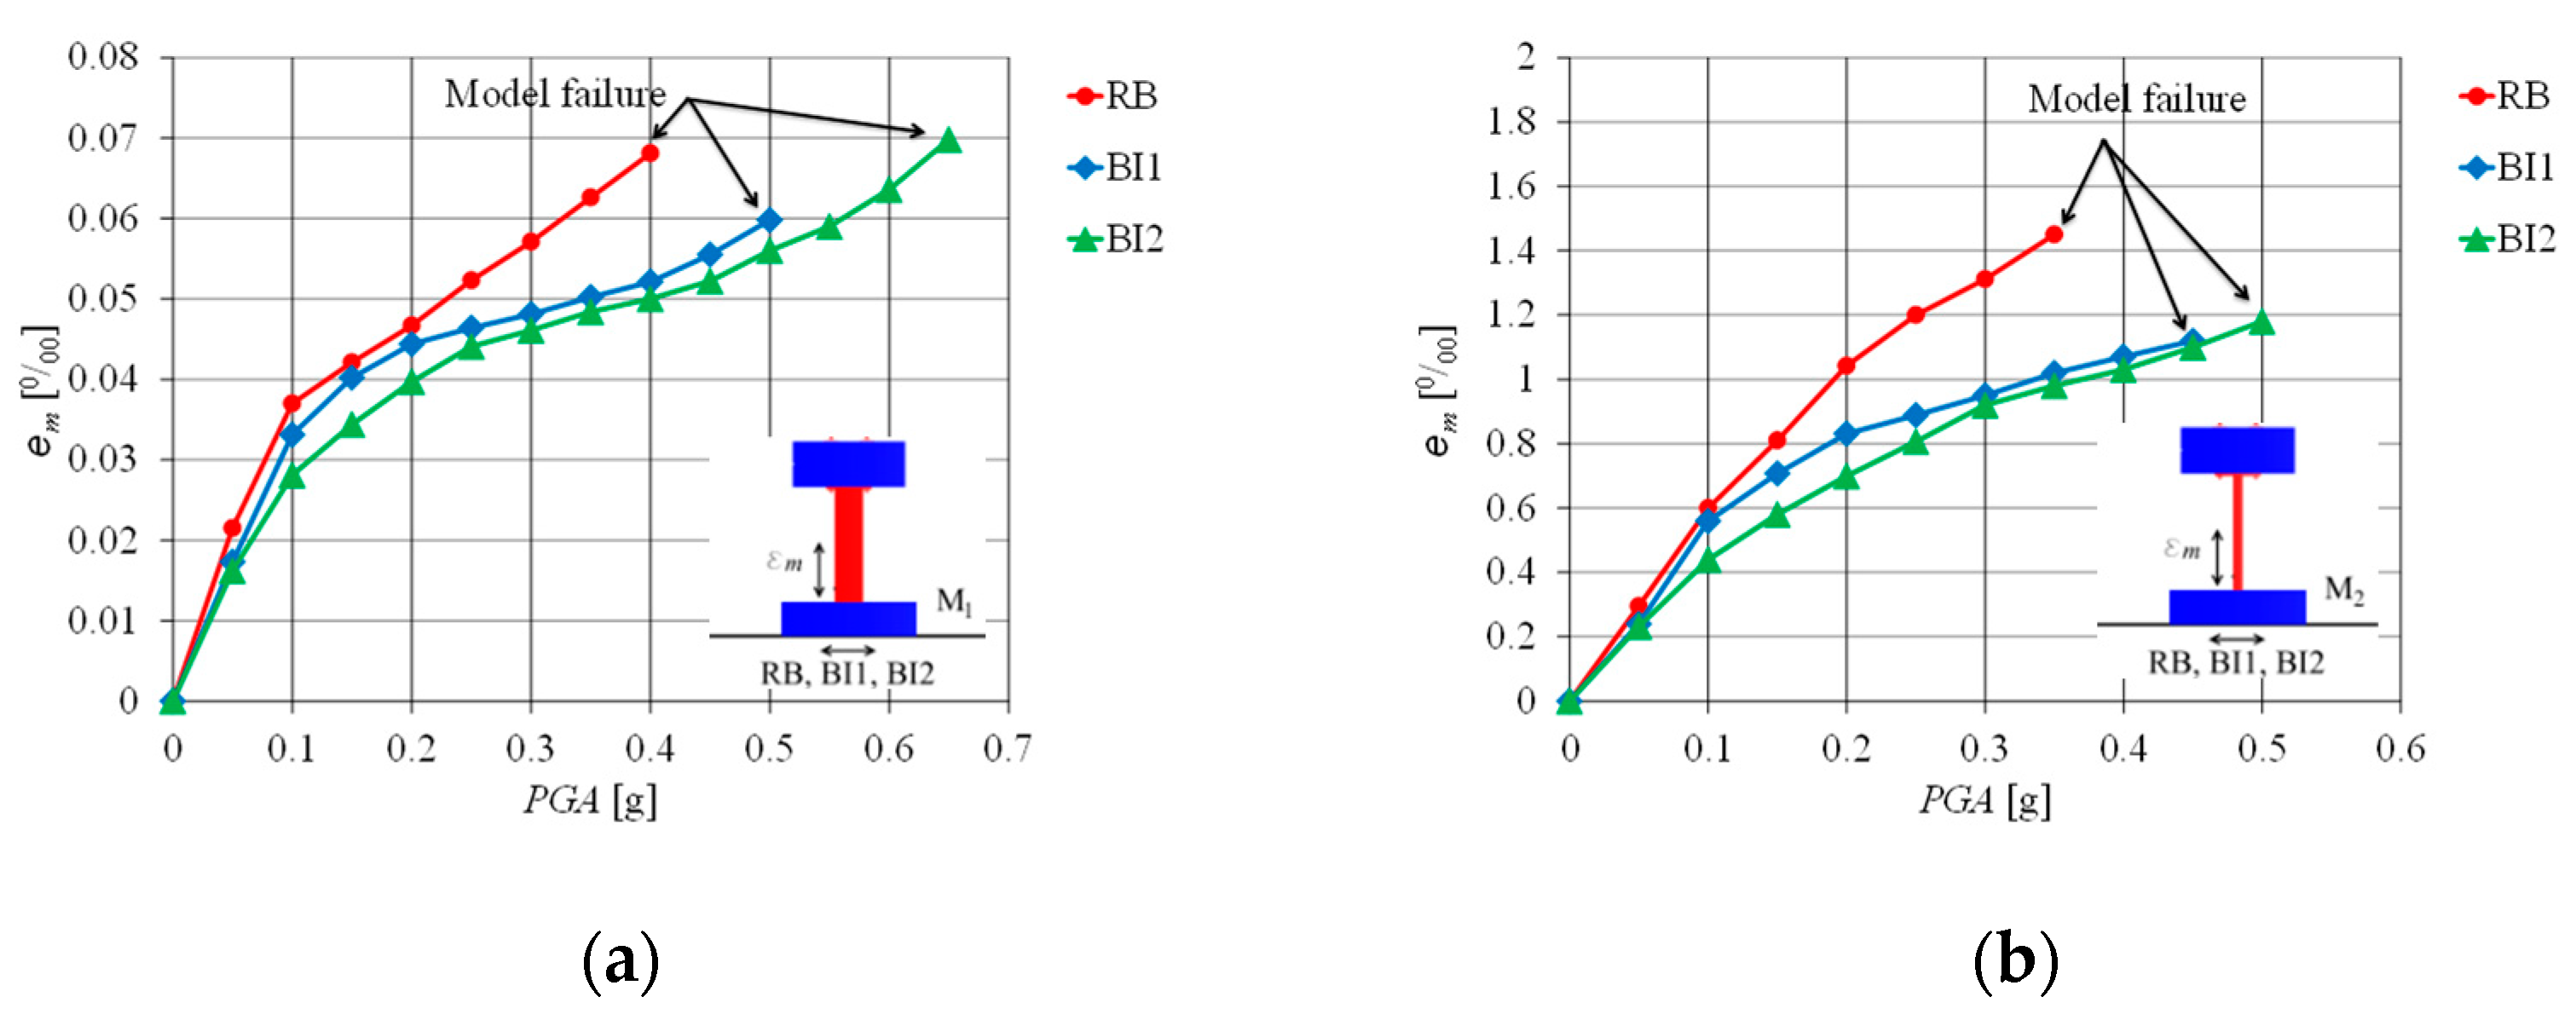
The strain ratio of the structure with isolation compared to the structure without seismic isolation is a suitable indicator of the isolation efficiency. The peak strain εm at the bottom of column M1 is shown in Figure 19, and that of column M2 is shown in Figure 20. It is noted that the shape of these plots is similar to that of the plots for am shown in Figure 13 and Figure 14. That is, the seismic isolation effect with respect to RB is equally expressed by εm and am values.
The ε1 values of M1 and M2 based on RB, BI1, and BI2 are shown in Figure 21. It can be observed that the effectiveness of seismic isolation when reducing strains in M1 and M2 is analogous to the effectiveness when reducing accelerations (Figure 15).
Based on extensive experimental studies of the behavior of structural models of different stiffness with seismic isolation, ASL-1 and ASL-2, compared to a rigid base without seismic isolation, it can be concluded that they significantly reduce seismic forces and strains in very stiff M1 and stiff M2 structural models. In addition, ASL-2 is significantly more efficient than ASL-1, but also slightly more expensive. Compared to RB without seismic isolation, the average efficiency of ASL-1 due to the reduction in acceleration and strain in the tested models is 13% and the average efficiency of ASL-2 is 25%. The average efficiency for M1 and M2 at an “average” excitation is given. Here, the isolation efficiency for the M1 model is higher than for the M2 model. The seismic isolation efficiency depends strongly on the type of excitation. The efficiency is lowest for impact-type earthquakes AS and ABL, which do not shake the structure more strongly, and which introduce little energy into the structure. Fortunately, however, such earthquakes cause much lower inertial forces and strains in the structure than earthquakes of longer durations and predominant periods.
5. Conclusions
Relatively extensive research has confirmed that the use of these seismic isolation layers, compared to RB without seismic isolation, reduces inertial/earthquake forces in the structural models considered, both for lower PGA values and in the case of tests to collapse the models. It was found that these seismic isolations are sufficiently effective for models M1 and M2 (T < 0.3 s), while they are not efficient or are even harmful in flexible models (T > 0.6 s). It was also found that the effectiveness of these seismic isolations is lower for structural models with larger foundation ground plan dimensions. Therefore, conservative values of seismic force reduction and strain reduction were considered in evaluating the effectiveness of these seismic isolations (structural models with larger footings), and the rocking effect was low.
The ASL-1 isolation layer was selected as optimal with the following characteristics: Φb = 16–32 mm, layer compaction 30 MPa, and moisture content 10%.
The optimal composite seismic isolation ASL-2 consists of an optimal pebble layer ASL-1 and a geogrid with higher tensile strength at the top of the layer. The ASL-2 layer is slightly more expensive than the ASL-1 layer, equally simple and quick to construct, but much more efficient in reducing seismic forces and strain in the structural models.
Compared to the case without seismic isolation, RB, the models M1 and M2 resting on the aseismic layer ASL-1 showed an average reduction in seismic forces and strains/stresses of about 13% at lower PGA values and about 25% at failure.
The M1 and M2 models based on the ASL-2 aseismic layer showed a 10% reduction in seismic forces and strains at lower PGA values and about 25% at failure compared to the ASL-1 layer.
Compared to the M1 and M2 models resting on the foundation without seismic isolation, RB, the same models resting on the aseismic layer ASL-2 had a 25% reduction in seismic forces and strains at lower PGA values and about 34% at failure.
Based on the above, ASL-2 is considered to be more optimal than ASL-1. The test results have shown that the ASL-1 and ASL-2 isolations are sufficiently efficient and that their application in real buildings with low heights is possible (T < 0.3 s). It is important to point out that these isolations are effective if the underlying soil is sufficiently rigid [54].
Seismic isolation efficiency depended significantly on the type of acceleration signal applied. The seismic isolation efficiency was higher for the AA and AP excitations than for AS and ABL. AA and AP are long-duration earthquakes that introduce high energy into the system and cause the model to sway more. In fact, the reduction in seismic forces in this isolation concept is achieved by a reduced rocking stiffness in addition to the sliding mechanism, which utilizes the concept of rocking isolation [30,58,59]. The low efficiency of seismic isolation for the acceleration signals AS and ABL should be seen in the context that they cause low stresses in the tested models, which mitigates the fact that there is less efficient seismic isolation for such excitations.
Due to the limitations of the research conducted (four simple building models and only four uniaxial base excitations), the conclusions obtained should be strengthened by further research. Based on the above statement, further experimental research on this topic is required (preferably on real structures or models with realistic material and slightly reduced geometry).
Author Contributions
Conceptualization: J.R. and I.B.; methodology, J.R., I.B., N.G. and M.G.; validation, J.R., I.B., N.G. and M.G.; formal analysis, J.R., I.B., N.G. and M.G.; investigation, J.R., I.B., N.G. and M.G.; resources, J.R.; data curation, J.R., I.B., N.G. and M.G.; writing—original draft preparation, J.R. and I.B.; writing—review and editing, J.R., I.B., N.G. and M.G.; visualization, J.R. and I.B.; supervision, J.R.; funding acquisition, J.R. All authors have read and agreed to the published version of the manuscript.
Funding
This research was supported by the following projects: (a) Seismic base isolation of a building using natural materials—shaking table tests and numerical modelling—IP-06-2016-5325, funded by the Croatian Science Foundation; (b) Project KK.01.1.1.02.0027, co-financed by the Croatian Government and the European Union through the European Regional Development Fund—Operational Programme for Competitiveness and Cohesion.
Data Availability Statement
The data are available from the corresponding author upon request.
Conflicts of Interest
The authors declare no conflicts of interest.
References
- Dilsiz, A.; Günay, S.; Mosalam, K.M.; Miranda, E.; Arteta, C.; Sezen, H.; Fischer, E.; Hakhamaneshi, M.; Hassan Wael, M.; Alhawamdeh, B.; et al. StEER-EERI: Mw 7.8 Kahramanmaras, Türkiye Earthquake Sequence Preliminary Virtual Reconnaissance Report (PVRR); StEER: Kahramanmaras, Türkiye, 2023. [Google Scholar]
- Tsang, H.H. Seismic isolation by rubber-soil mixtures for developing countries. Earthq. Eng. Struct. Dyn. 2008, 37, 283–303. [Google Scholar] [CrossRef]
- Kelly, J. Aseismic base isolation: Review and bibliography. Soil Dyn. Earthq. Eng. 1986, 5, 202–216. [Google Scholar] [CrossRef]
- Furinghetti, M. Definition and Validation of Fast Design Procedures for Seismic Isolation Systems. Vibration 2022, 5, 290–305. [Google Scholar] [CrossRef]
- Solaiachari, D.; Jayakumar, L. Experimental Investigation of Nonlinear Vibration Isolator with Fluidic Actuators (NLVIFA). Sound Vib. 2019, 53, 277–296. [Google Scholar]
- Prost, C.; Abdelnour, B. Tuned mass dampers using wire rope isolators. Sound Vib. 2017, 51, 15–17. [Google Scholar]
- Yenidogan, C. Earthquake-Resilient Design of Seismically Isolated Buildings: A Review of Technology. Vibration 2021, 4, 602–647. [Google Scholar] [CrossRef]
- Fraternali, F.; Amendola, A.; Benzoni, G. Innovative seismic isolation devices based on lattice materials: A review. Ing. Sismica. 2018, 4, 93–113. [Google Scholar]
- Prost, C.; Abdelnour, B. Wire rope isolators for seismic base isolation. Sound Vib. 2018, 52, 2–5. [Google Scholar] [CrossRef]
- Rieß, S.; Kaal, W.; Herath, K. Frequency-Adaptable Tuned Mass Damper Using Metal Cushions. Vibration 2021, 4, 77–90. [Google Scholar] [CrossRef]
- Yuan, M.; Jin, Y.; Liu, K.; Sadhu, A. Optimization of a Non-Traditional Vibration Absorber for Vibration Suppression and Energy Harvesting. Vibration 2022, 5, 383–407. [Google Scholar] [CrossRef]
- Prost, C.; Abdelnour, B. Influence and Enhancement of Damping Properties of Wire Rope Isolators for Naval Applications. Sound Vib. 2018, 52, 1–4. [Google Scholar] [CrossRef]
- De Domenico, D.; Losanno, D.; Vaiana, N. Experimental tests and numerical modeling of full-scale unbonded fiber reinforced elastomeric isolators (UFREIs) under bidirectional excitation. Eng. Struct. 2023, 274, 115118. [Google Scholar] [CrossRef]
- Losanno, D.; Palumbo, F.; Calabrese, A.; Barrasso, T.; Vaiana, N. Preliminary Investigation of Aging Effects on Recycled Rubber Fiber Reinforced Bearings (RR-FRBs). J. Earthq. Eng. 2022, 26, 5407–5424. [Google Scholar] [CrossRef]
- Anastasopoulos, I.; Kourkoulis, R.; Gelagoti, F.; Papadopoulos, E. Rocking response of SDOF systems on shallow improved sand: An experimental study. Soil Dyn. Earthq. Eng. 2012, 40, 15–33. [Google Scholar] [CrossRef]
- Zhang, H.; Song, C.; Wang, M.; Cheng, Y.; Yue, S.; Wu, C. A geotechnical seismic isolation system based on marine sand cushion for attenuating ground shock effect: Experimental investigation. Soil Dyn. Earthq. Eng. 2023, 168, 107854. [Google Scholar] [CrossRef]
- Radnić, J.; Grgić, N.; Matešan, D.; Baloević, G. Shake table testing of reinforced concrete columns with different layout size of foundation. Materwiss Werksttech. 2015, 46, 348–367. [Google Scholar] [CrossRef]
- Banović, I.; Radnić, J.; Grgić, N.; Matešan, D. The use of limestone sand for the seismic base isolation of structures. Adv. Civ. Eng. 2018, 2018, 9734283. [Google Scholar] [CrossRef]
- Tsiavos, A.; Sextos, A.; Stavridis, A.; Dietz, M.; Dihoru, L.; Alexander, N.A. Large-scale experimental investigation of a low-cost PVC ‘sand-wich’ (PVC-s) seismic isolation for developing countries. Earthq. Spectra 2020, 36, 1886–1911. [Google Scholar] [CrossRef]
- Tsiavos, A.; Sextos, A.; Stavridis, A.; Dietz, M.; Dihoru, L.; Alexander, N.A. Experimental investigation of a highly efficient, low-cost PVC-Rollers Sandwich (PVC-RS) seismic isolation. Structures 2021, 33, 1590–1602. [Google Scholar] [CrossRef]
- Tsiavos, A.; Kolyfetis, D.; Panzarasa, G.; Burgert, I.; Stojadinovic, B. Shaking table investigation of a low-cost and sustainable timber-based energy dissipation system with recentering ability. Bull. Earthq. Eng. 2022, 21, 3949–3968. [Google Scholar] [CrossRef]
- Somma, F.; Flora, A. SAP-sand mixtures as a geotechnical seismic isolation technology: From the dynamic characterization to a simple analytical design approach. Bull. Earthq. Eng. 2023, 21, 4065–4089. [Google Scholar] [CrossRef]
- Kuvat, A.; Sadoglu, E. Dynamic properties of sand-bitumen mixtures as a geotechnical seismic isolation material. Soil Dyn. Earthq. Eng. 2020, 132, 106043. [Google Scholar]
- Edinçliler, A.; Yildiz, Ö. Shaking table tests on geotechnical seismic isolation for medium-rise buildings using EPS beads-sand mixtures. Bull. Earthq. Eng. 2023, 21, 3851–3877. [Google Scholar] [CrossRef]
- Tsang, H.H. Geotechnical seismic isolation. In Earthquake Engineering: New Research; Nova Science Publishers Inc.: New York, NY, USA, 2009; pp. 55–87. [Google Scholar]
- Forcellini, D. Assessment on geotechnical seismic isolation (GSI) on bridge configurations. Innov. Infrastruct. Solut. 2017, 2, 9. [Google Scholar] [CrossRef]
- Forcellini, D. Assessment of Geotechnical Seismic Isolation (GSI) as a Mitigation Technique for Seismic Hazard Events. Geosciences 2020, 10, 222. [Google Scholar] [CrossRef]
- Forcellini, D. Seismic resilience of bridges isolated with traditional and geotechnical seismic isolation (GSI). Bull. Earthq. Eng. 2023, 21, 3521–3535. [Google Scholar] [CrossRef]
- Forcellini, D.; Alzabeebee, S. Seismic fragility assessment of geotechnical seismic isolation (GSI) for bridge configuration. Bull. Earthq. Eng. 2023, 21, 3969–3990. [Google Scholar] [CrossRef]
- Tsang, H.H.; Pitilakis, K. Mechanism of geotechnical seismic isolation system: Analytical modeling. Soil Dyn. Earthq. Eng. 2019, 122, 171–184. [Google Scholar] [CrossRef]
- Tsiavos, A.; Alexander, N.A.; Diambra, A.; Ibraim, E.; Vardanega, P.J.; Gonzalez-Buelga, A.; Sextos, A. A sand-rubber deformable granular layer as a low-cost seismic isolation strategy in developing countries: Experimental investigation. Soil Dyn. Earthq. Eng. 2019, 125, 105731. [Google Scholar] [CrossRef]
- Tsiavos, A.; Haladij, P.; Sextos, A.; Alexander, N.A. Analytical investigation of the effect of a deformable sliding layer on the dynamic response of seismically isolated structures. Structures 2020, 27, 2426–2436. [Google Scholar] [CrossRef]
- Pitilakis, D.; Anastasiadis, A.; Vratsikidis, A.; Kapouniaris, A.; Massimino, M.R.; Abate, G.; Corsico, S. Large-scale field testing of geotechnical seismic isolation of structures using gravel-rubber mixtures. Earthq. Eng. Struct. Dyn. 2021, 50, 2712–2731. [Google Scholar] [CrossRef]
- Tsang, H.H.; Lo, S.H.; Xu, X.; Neaz Sheikh, M. Seismic isolation for low-to-medium-rise buildings using granulated rubber-soil mixtures: Numerical study. Earthq. Eng. Struct. Dyn. 2012, 41, 2009–2024. [Google Scholar] [CrossRef]
- Tsang, H.H.; Tran, D.P.; Hung, W.Y.; Pitilakis, K.; Gad, E.F. Performance of geotechnical seismic isolation system using rubber-soil mixtures in centrifuge testing. Earthq. Eng. Struct. Dyn. 2021, 50, 1271–1289. [Google Scholar] [CrossRef]
- Tsang, H.H. Analytical design models for geotechnical seismic isolation systems. Bull. Earthq. Eng. 2022, 21, 3881–3904. [Google Scholar] [CrossRef]
- Tsiavos, A.; Sextos, A.; Stavridis, A.; Dietz, M.; Dihoru, L.; Di Michele, F.; Nicholas, A. Low-cost hybrid design of masonry structures for developing countries: Shaking table tests. Soil Dyn. Earthq. Eng. 2021, 146, 106675. [Google Scholar] [CrossRef]
- Vratsikidis, A.; Pitilakis, D. Field testing of gravel-rubber mixtures as geotechnical seismic isolation. Bull. Earthq. Eng. 2022, 21, 3905–3922. [Google Scholar] [CrossRef]
- Wu, M.; Tian, W.; He, J.; Liu, F.; Yang, J. Seismic isolation effect of rubber-sand mixture cushion under different site classes based on a simplified analysis model. Soil Dyn. Earthq. Eng. 2023, 166, 107738. [Google Scholar] [CrossRef]
- Nikitas, G.; Bhattacharya, S. Experimental study on sand-tire chip mixture foundations acting as a soil liquefaction countermeasure. Bull. Earthq. Eng. 2023, 21, 4037–4063. [Google Scholar] [CrossRef]
- Hazarika, H.; Kuribayashi, K.; Kuroda, S.; Hu, Y. Performance evaluation of waste tires in protecting embankment against earthquake loading. Bull. Earthq. Eng. 2023, 21, 4019–4035. [Google Scholar] [CrossRef]
- Dhanya, J.S.; Fouzul, M.A.; Banerjee, S.; Boominathan, A.; Zhussupbekov, A. Shaking table experiments on framed structure resting on geogrid reinforced geotechnical seismic isolation system. Bull. Earthq. Eng. 2023, 21, 3823–3849. [Google Scholar] [CrossRef]
- Bernal-Sanchez, J.; Leak, J.; Barreto, D. Rubber-soil mixtures: Use of grading entropy theory to evaluate stiffness and liquefaction susceptibility. Bull. Earthq. Eng. 2023, 21, 3777–3796. [Google Scholar] [CrossRef]
- Chiaro, G.; Palermo, A.; Banasiak, L.; Tasalloti, A.; Granello, G.; Hernandez, E. Seismic response of low-rise buildings with eco-rubber geotechnical seismic isolation (ERGSI) foundation system: Numerical investigation. Bull. Earthq. Eng. 2023, 21, 3797–3821. [Google Scholar] [CrossRef]
- Murillo, C.; Thorel, L.; Caicedo, B. Ground vibration isolation with geofoam barriers: Centrifuge modelling. Geotext. Geomembr. 2009, 27, 423–434. [Google Scholar] [CrossRef]
- Nappa, V.; Bilotta, E.; Flora, A. Soft Barriers for the Mitigation of Seismic Risk. Procedia Eng. 2016, 158, 404–409. [Google Scholar] [CrossRef]
- Kalpakcı, V.; Bonab, A.T.; Özkan, M.Y.; Gülerce, Z. Experimental evaluation of geomembrane/geotextile interface as base isolating system. Geosynth. Int. 2018, 25, 1–11. [Google Scholar] [CrossRef]
- Edinçliler, A.; Calikoglu, M. Shaking table experiments on geotechnical seismic isolation for low-rise buildings using geosynthetics. ICG 2018, 2018, 2809–2816. [Google Scholar]
- Aloisio, A.; Contento, A.; Xue, J.; Fu, R.; Fragiacomo, M.; Briseghella, B. Probabilistic formulation for the q-factor of piles with damping pre-hole. Bull. Earthq. Eng. 2023, 21, 3749–3775. [Google Scholar] [CrossRef]
- Azinović, B.; Kilar, V.; Koren, D. The seismic response of low-energy buildings founded on a thermal insulation layer –a parametric study. Eng. Struct. 2014, 81, 398–411. [Google Scholar] [CrossRef]
- Azinović, B.; Kilar, V.; Koren, D. Energy-efficient solution for the foundation of passive houses in earthquake-prone regions. Eng. Struct. 2015, 112, 133–145. [Google Scholar] [CrossRef]
- Gatto, M.P.A.; Lentini, V.; Castelli, F.; Montrasio, L.; Grassi, D. The use of polyurethane injection as a geotechnical seismic isolation method in large-scale applications: A numerical study. Geosciences 2021, 11, 201. [Google Scholar] [CrossRef]
- Gatto, M.P.A.; Lentini, V.; Montrasio, L. Dynamic properties of polyurethane from resonant column tests for numerical GSI study. Bull. Earthq. Eng. 2023, 21, 3991–4017. [Google Scholar] [CrossRef]
- Gatto, M.P.A.; Montrasio, L.; Zavatto, L. Experimental Analysis and Theoretical Modelling of Polyurethane Effects on 1D Wave Propagation through Sand-Polyurethane Specimens. J. Earthq. Eng. 2022, 26, 7170–7193. [Google Scholar] [CrossRef]
- Tsang, H.H.; Akhtar, A.Y. Dynamic properties of recycled polyurethane-coated rubber-soil mixtures. Case Stud. Constr. Mater. 2023, 18, e01859. [Google Scholar]
- Yegian, M.K.; Kadakal, U. Foundation isolation for seismic protection using a smooth synthetic liner. J. Geotech. Geoenviron. 2004, 130, 1121–1130. [Google Scholar] [CrossRef]
- Yegian, M.K.; Lahlaf, A.M. Geomembranes as base isolation. Geotech. Fabr. Rep. 1992, 10, 17–21. [Google Scholar]
- Banović, I.; Radnić, J.; Grgić, N. Shake table study on the efficiency of seismic base isolation using natural stone pebbles. Adv. Mater. Sci. Eng. 2018, 2018, 1012527. [Google Scholar] [CrossRef]
- Banović, I.; Radnić, J.; Grgić, N. Geotechnical seismic isolation system based on sliding mechanism using stone pebble layer: Shake-table experiments. Shock Vib. 2019, 2019, 9346232. [Google Scholar] [CrossRef]
- Banović, I.; Radnić, J.; Grgić, N. Effect of structural stiffness on the efficiency of seismic base isolation using layers of stone pebbles. Ing. Sismica 2020, 37, 66–91. [Google Scholar]
- Banović, I.; Radnić, J.; Grgić, N. Foundation size effect on the efficiency of seismic base isolation using a layer of stone pebbles. Earthq. Struct. 2020, 19, 103–117. [Google Scholar]
- Banović, I.; Radnić, J.; Grgić, N. Numerical model for dynamic analysis of structures with seismic base isolation using a layer of stone pebbles. Ing. Sismica 2021, 38, 37–65. [Google Scholar]
- Banović, I.; Radnić, J.; Grgić, N.; Semren, K. Effectiveness of several low-cost geotechnical seismic isolation methods: A shake-table study. Bull. Earthq. Eng. 2023, 21, 3923–3947. [Google Scholar] [CrossRef]
- Banović, I.; Radnić, J.; Grgić, N.; Buzov, A. Performance of geotechnical seismic isolation using stone pebble—Geogrid layer: Experimental investigation. Soil Dyn. Earthq. Eng. 2023, 171, 107941. [Google Scholar] [CrossRef]
- Banović, I. Seismic Base Isolation Using Natural Materials—Experimental and Numerical Verification. Ph.D. Thesis, University of Split, Split, Croatia, 2021. [Google Scholar]
- EN 1998-1:2004 Eurocode 8; Design of Structures for Earthquake Resistance-Part 1: General Rules, Seismic Actions and Rules for Buildings. CEN: Brussels, Belgium, 2004.
- SIMQKE (SIMulation of EarthQuaKE Ground Motions). Available online: https://gelfi.unibs.it/software/simqke/simqke_gr.htm (accessed on 15 January 2019).
Figure 1.
Stone pebble isolation layer ASL-1: (a) varied parameters; (b) photo of ϕb = 16–32 mm stone pebbles.
Figure 1.
Stone pebble isolation layer ASL-1: (a) varied parameters; (b) photo of ϕb = 16–32 mm stone pebbles.

Figure 2.
Tested models on the ASL-1 and ASL-2 aseismic layers: (a) rigid model M0; (b) models M1–M4.
Figure 2.
Tested models on the ASL-1 and ASL-2 aseismic layers: (a) rigid model M0; (b) models M1–M4.


Figure 5.
Elastic response spectrum according to Eurocode 8 with the periods shown for the models investigated [64].
Figure 5.
Elastic response spectrum according to Eurocode 8 with the periods shown for the models investigated [64].

Figure 6.
ASL-2 aseismic layers: (a) eleven ASL-2 isolations considered in this study; (b) geosynthetics and sand used for the additional layer [63].
Figure 6.
ASL-2 aseismic layers: (a) eleven ASL-2 isolations considered in this study; (b) geosynthetics and sand used for the additional layer [63].

Figure 7.
Substrates tested for which the main results are shown: (a) rigid substrate RB; (b) isolation layer of pebbles BI1; (c) isolation layer of pebbles and geogrids BI2.
Figure 7.
Substrates tested for which the main results are shown: (a) rigid substrate RB; (b) isolation layer of pebbles BI1; (c) isolation layer of pebbles and geogrids BI2.

Figure 8.
Model M1 ready for shake-table testing: (a) M1 on RB; (b) M1 on BI1; (c) M1 on BI2.

Figure 9.
The peak acceleration am: (a) M0 on RB; (b) M0 on BI1; (c) M0 on BI2.

Figure 10.
The peak displacement um: (a) M0 on RB; (b) M0 on BI1; (c) M0 on BI2.

Figure 11.
The envelope of the peak acceleration am of all excitations acting on the M0 based on RB, BI1, and BI2.
Figure 11.
The envelope of the peak acceleration am of all excitations acting on the M0 based on RB, BI1, and BI2.

Figure 12.
The envelope of the peak displacement um of all excitations acting on the M0 based on RB, BI1, and BI2.
Figure 12.
The envelope of the peak displacement um of all excitations acting on the M0 based on RB, BI1, and BI2.

Figure 13.
The peak acceleration am: (a) M1 on RB; (b) M1 on BI1; (c) M1 on BI2.

Figure 14.
The peak acceleration am: (a) M2 on RB; (b) M2 on BI1; (c) M2 on BI2.

Figure 15.
The peak acceleration am of the model based on RB, BI1, and BI2: (a) M1; (b) M2.

Figure 16.
The peak displacement um: (a) M1 on RB; (b) M1 on BI1; (c) M1 on BI2.

Figure 17.
The peak displacement um: (a) M2 on RB; (b) M2 on BI1; (c) M2 on BI2.

Figure 18.
The peak displacement um of models based on RB, BI1, and BI2: (a) M1; (b) M2.

Figure 19.
The peak strain εm: (a) M1 on RB; (b) M1 on BI1; (c) M1 on BI2.

Figure 20.
The peak strain εm: (a) M2 on RB; (b) M2 on BI1; (c) M2 on BI2.

Figure 21.
The peak strain εm of models based on RB, BI1, and BI2: (a) M1; (b) M2.

Disclaimer/Publisher’s Note: The statements, opinions and data contained in all publications are solely those of the individual author(s) and contributor(s) and not of MDPI and/or the editor(s). MDPI and/or the editor(s) disclaim responsibility for any injury to people or property resulting from any ideas, methods, instructions or products referred to in the content. |
© 2024 by the authors. Licensee MDPI, Basel, Switzerland. This article is an open access article distributed under the terms and conditions of the Creative Commons Attribution (CC BY) license (https://creativecommons.org/licenses/by/4.0/).
Share and Cite
MDPI and ACS Style
Banović, I.; Radnić, J.; Grgić, N.; Galić, M. Application of Pebbles for Geotechnical Seismic Isolation (GSI): Experimental Parametric Study. Vibration 2024, 7, 64-82. https://doi.org/10.3390/vibration7010004
AMA Style
Banović I, Radnić J, Grgić N, Galić M. Application of Pebbles for Geotechnical Seismic Isolation (GSI): Experimental Parametric Study. Vibration. 2024; 7(1):64-82. https://doi.org/10.3390/vibration7010004
Chicago/Turabian StyleBanović, Ivan, Jure Radnić, Nikola Grgić, and Marko Galić. 2024. "Application of Pebbles for Geotechnical Seismic Isolation (GSI): Experimental Parametric Study" Vibration 7, no. 1: 64-82. https://doi.org/10.3390/vibration7010004