


Net-Baryon Probability Distributions from Lattice Simulations


1
NRC “Kurchatov Institute”—IHEP, 142281 Protvino, Russia
2
Pacific Quantum Center, Far Eastern Federal University, 690950 Vladivostok, Russia
*
Author to whom correspondence should be addressed.
Particles 2023, 6(3), 771-783; https://doi.org/10.3390/particles6030049
Submission received: 30 June 2023
/
Revised: 7 August 2023
/
Accepted: 14 August 2023
/
Published: 23 August 2023
(This article belongs to the Special Issue Infinite and Finite Nuclear Matter (INFINUM))
Abstract
:We use the results of lattice simulations of the net-baryon number density at imaginary baryon chemical potential in QCD to construct the equation of state of dense and hot strong-interacting matter both above the Roberge–Weiss temperature and below the critical temperature . For these cases, we also evaluate probability distributions of the net-baryon number, as well as the respective cumulants and moments. The consequences of the asymptotic behavior of these probability distributions for the problem of reconstruction of the net-baryon probability distributions from cumulants are discussed.
1. Introduction
The properties of nuclear matter at low temperature and high density and the location of the phase transition to chral-symmetric and/or deconfined quark matter are subjects of both experimental and theoretical studies. With large baryon densities, the only approach based on first principles useful in nonperturbative computations—that is, lattice QCD—is plagued by the so-called sign problem.
For this reason, the generally accepted knowledge in the physics of dense, strong-interacting matter largely comes from low-energy effective models, which are consistent with the first-order chiral phase transition at low temperatures and high baryon densities, as is shown in Figure 1; some experimental evidence for this transition can be found in [1].
There are several methods to obviate the sign problem in lattice studies. In this work, we discuss Taylor expansion at zero baryon chemical potential and the analytical continuation of the quantities computed at imaginary values of , where there is no sign problem.
Our attention is focused on the net-baryon number density, which can be evaluated on a lattice at imaginary . Given the net-baryon number density, one can find the respective pressure and the dependence of the grand canonical partition function on the baryon chemical potential, as well as, therefore, the probability that the system has a definite net-baryon number.
The probability mass function describing the distribution of fireballs produced in heavy-ion collisions in the net-baryon number can be measured experimentally, modulo some plausible assumptions about thermodynamical equilibrium in fireballs. The cumulants associated with this distribution have received considerable attention in the literature [2]. In this regard, considerable theoretical and experimental work has been undertaken on higher-order cumulants corresponding to the distribution of the fireballs produced in heavy-ion collisions in the net-baryon charge.
We discuss the problem of reconstruction of the probability mass function from the cumulants in connection with the phase transition.
On the basis of our lattice results obtained in a simplified version of QCD, we analyze the asymptotic behavior of the distribution in the net-baryon number and study its dependence on the temperature. We find that the decrease in with n as becomes progressively slower as the temperature decreases. We analyze the consequences of this observation for the relation between the cumulants and the probability mass function at low temperatures, where the phase transition is expected.
The results of our lattice simulations agree well with the hadron resonance gas (HRG) model. We try to find signatures of the phase transition that should appear in the behavior of the baryon density at imaginary chemical potentials, where it can be evaluated on a lattice. We discuss in detail possible corrections to the the grand canonical partition function of the HRG model, which are small at the imaginary baryon chemical potential; therefore, however, they are consistent with the first-order phase transition at a real value of . We also consider the equation of state (EoS)— that is, the relation between the pressure and the net-baryon number density— that follows from the results of our lattice simulations. We discuss its changes with temperature and outline a scenario of phase transition in terms of the EoS.
Our study relies on the results of simulations described in [3], which use lattices of size with at several temperature values over the range with .
2. Definitions and Notation
The thermodynamical state of strong-interacting matter is described by the grand canonical partition function
where is the Hamiltonian, is the operator of the baryon charge, is the baryon chemical potential, and . The grand canonical partition function can be expressed in terms of the canonical partition functions,
where runs all states with the net-baryon number . This expression is as follows:
It is referred to as the fugacity expansion. It should be emphasized that and, since the baryon charge takes integer values, the grand canonical partition function is periodic in [4]: . The inverse of the fugacity expansion is provided by the Fourier transform
As was shown in [5], the canonical partition functions are of phenomenological significance because they are related to the probabilities that the net-baryon number at given values of and T equals n:
We introduce special notation for these probabilities at : , which are of particular interest. The probabilities can be expressed in terms of by the formula
where
In addition to these probabilities, we also consider the equation of state; that is, the relation between the pressure
and the net-baryon number density
We also use the respective dimensionless quantities
Considering defined in Equation (4) as a discrete probability mass function, one can conclude that the partition function represents the moment-generating function (up to a constant factor); namely
where are the moments of the random variable n. Now, we use Equations (2) and (4) to obtain the relation
The cumulants of this distribution are given by the coefficients of the Taylor expansion of the cumulant-generating function
We also consider ; from parity conservation, it follows that and . Of particular interest are a few of the lowest-order cumulants
3. Lattice Results
First, we write down the lattice results we need for the net-baryon number density at imaginary values of from [3]. It should be noticed that we presented the net-baryon number density in contrast to the net-quark number density in [3].
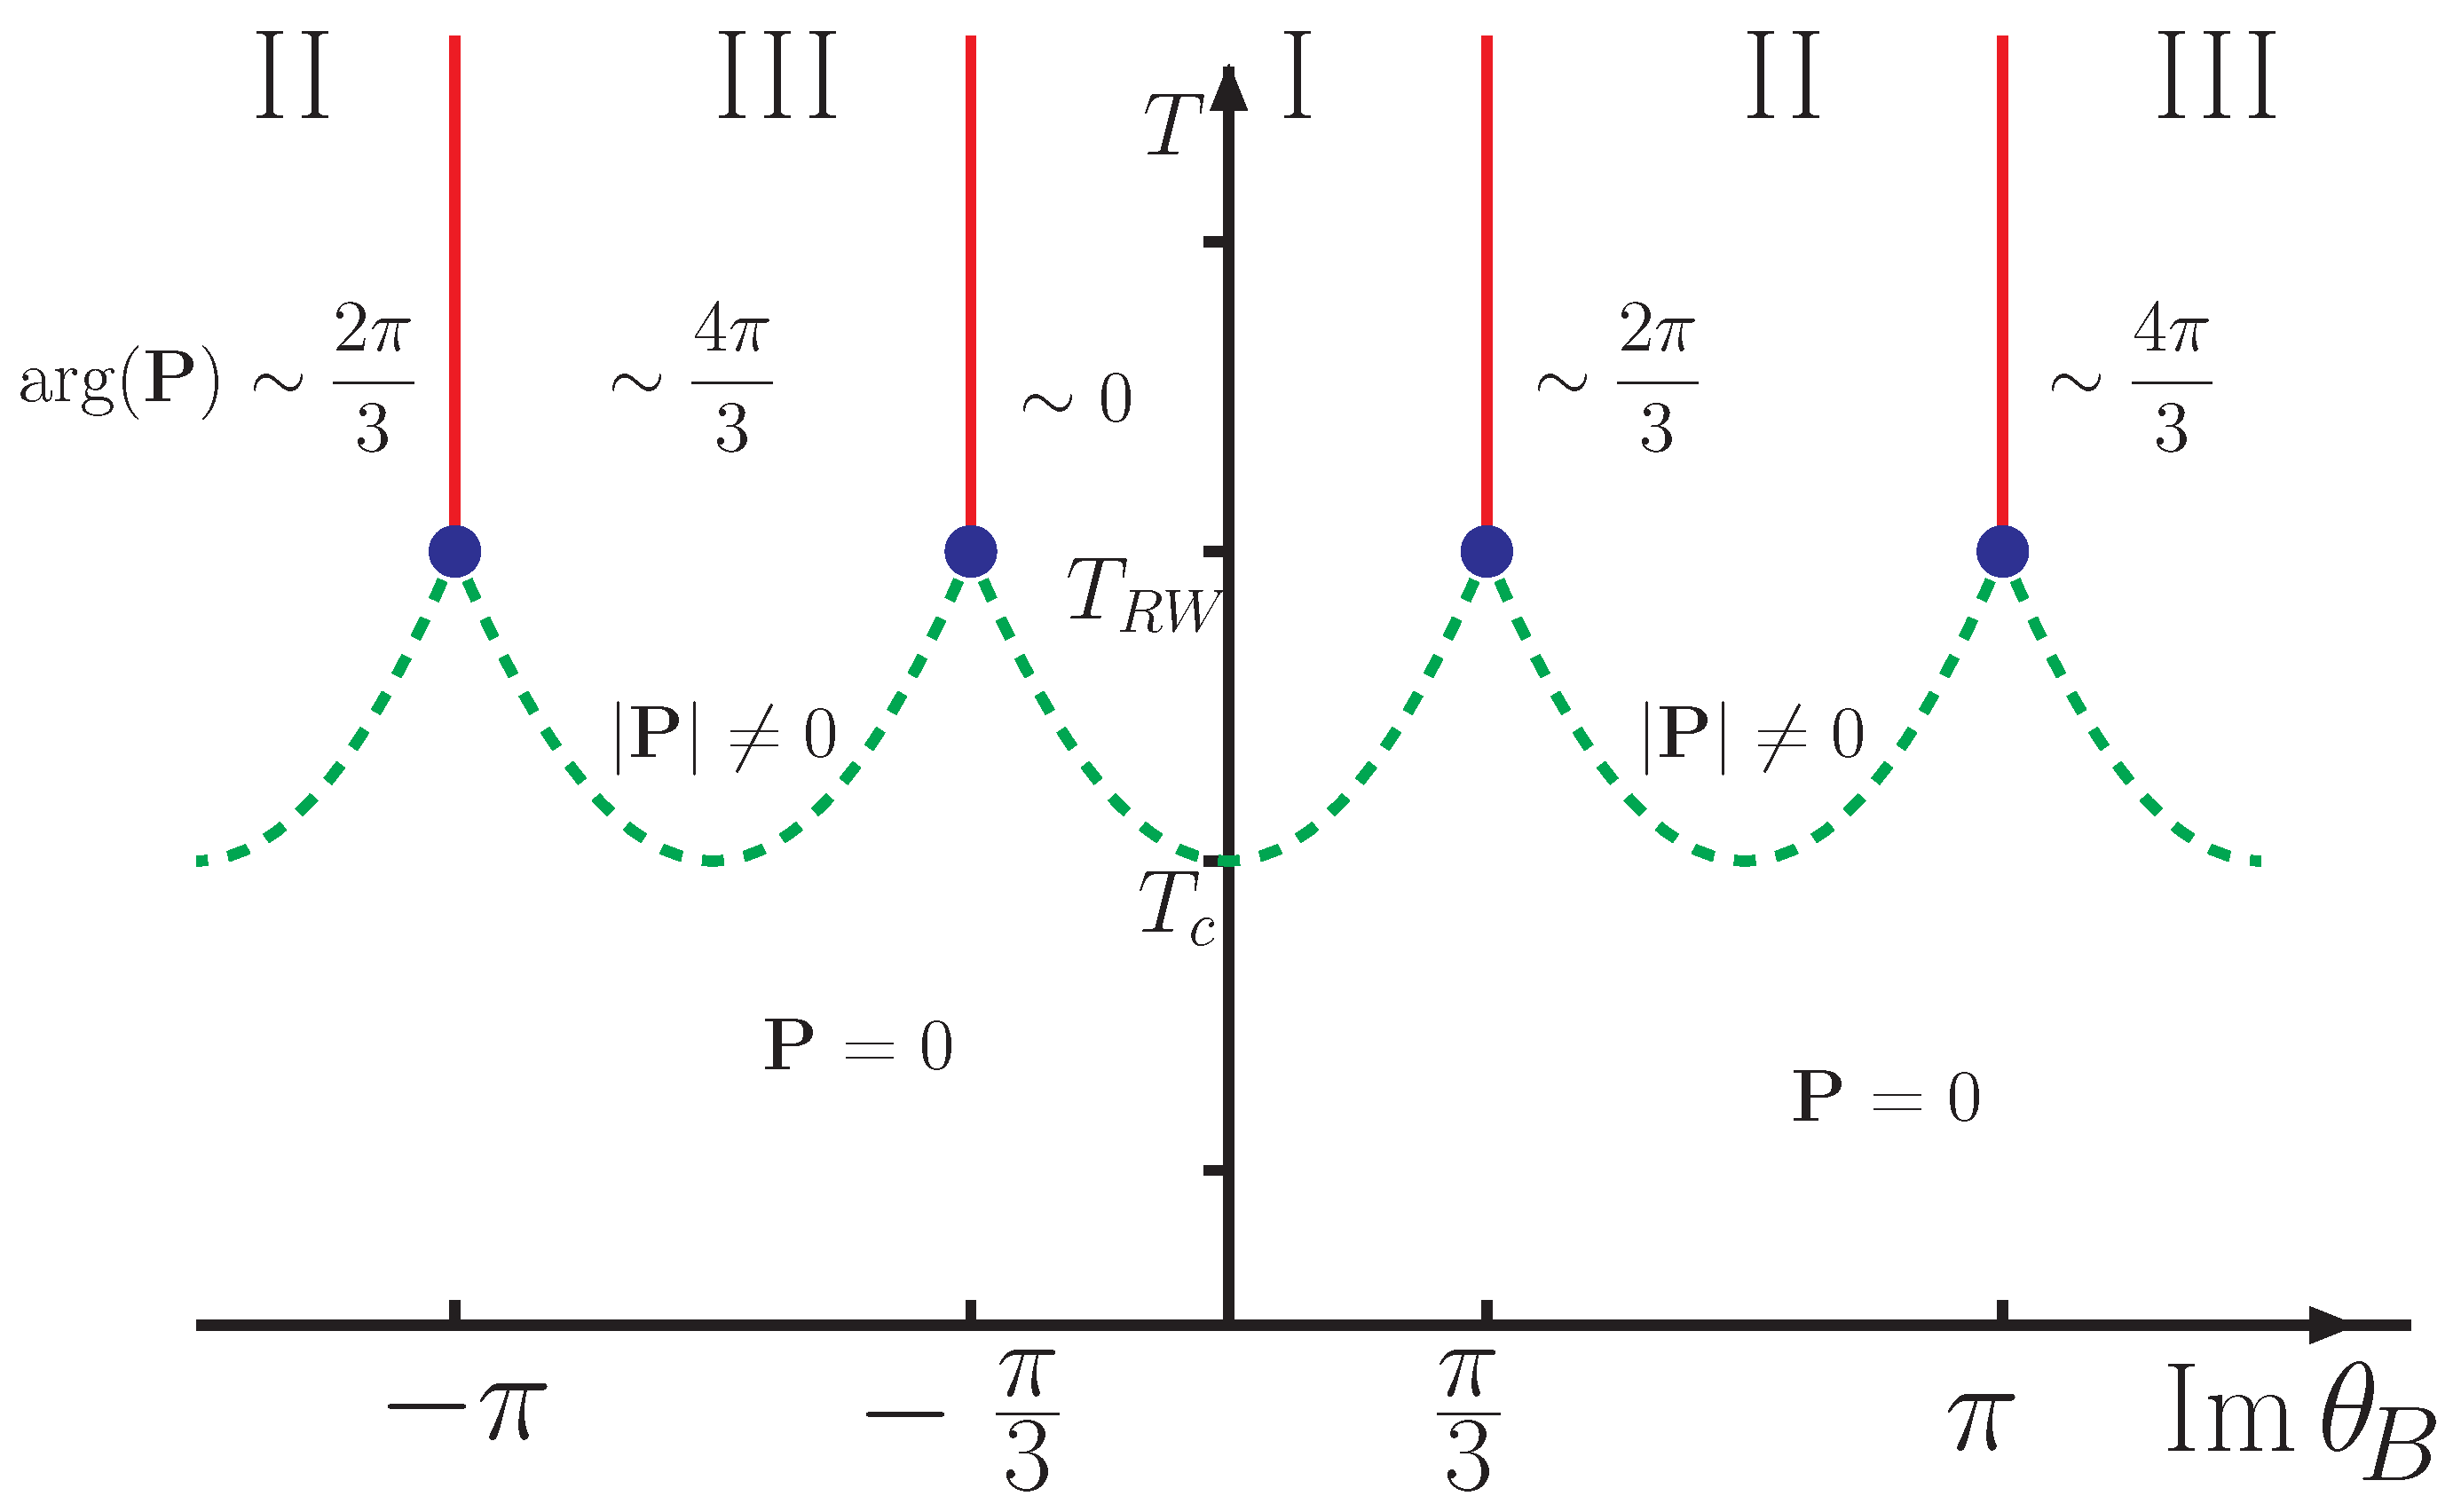
In this work, we consider the cases and , where is the Roberge–Weiss temperature [4] (see Figure 2 illustrating the physical sense of ) and is, strictly speaking, the pseudocritical temperature of the chiral crossover at . The range is omitted for simplicity.
3.1.
It was shown in [3] that one can fit the lattice data for the baryon number density on the segment with a low-degree polynomial. We used the polynomial
in the case where and
in the case where . Formula (14) is the lowest-degree polynomial that fits the data at well. It is interesting to note that it turns into the net-baryon density formula for free massless quarks when and . At , two-parameter polynomial-fit formulas do not provide -values greater than 0.05, whereas the three-parameter fit formulas (Formula (15) and ) give rather good fit quality (). Therefore, the latter formula leads to unphysical behavior at ( and ), and thus we choose the fit Formula (15). We obtain the following values for the fit parameters:
3.2.
At and , the net-baryon number density can be fitted well by the trigonometric series
in which only a few terms survive. The coefficients can be evaluated in some models. It has been shown [3,6,7] that, over the range , the cluster expansion model (CEM) agrees with the lattice data well, and one of the parameters of this model, corresponding to the ratio at , tends to zero as the temperature becomes lower than . We consider temperatures and in the confinement domain in order to study the temperature dependence of the probabilities where the CEM reaches its applicability limit. The values of from [3] are as follows:
Here, are the values of the pressure at evaluated with the formulas from [8]; these values are needed for the EoS. Then, the pressure can be readily determined from by integration with respect to .
4. Equation of State
To derive the EoS in the case , we consider the fit function shown in Formula (14) at both and . Thus, we obtain the EoS at in the parametric form,
where .
In the case , we consider the situation when and employ analytical continuation. Thus, we arrive at
with real values for the baryon chemical potential. In this case, the dependence of the pressure on is given by
From Formulas (17) and (22), we readily obtain the relation
where is the dimensionless pressure corresponding to . This dependence of the pressure of the density at a given temperature furnishes the equation of state (EoS) for interacting quark–gluon matter obtained in lattice QCD for temperatures well below , where only one term in the Fourier expansion of the baryon density survives.
In the case of two-parameter fit, which works at , we obtain the respective EoS in the parametric form (here, ) as follows:
We plot these dependencies in Figure 3.
In the left panel, we see that, at the densities of the order of the saturation density, the dependence of the pressure on the net-baryon number is qualitatively the same over the range , and the values of the pressure at are taken from [8]; the pressure gradually decreases with the temperature. The difference between the EoSs corresponding to the two-parameter fit (Formula (24)) and the one-parameter fit (Formula (23)) at is shown in the right panel. The dark blue solid curve corresponds to the case where in Formula (24) is set equal to zero, and the cyan dashed curve corresponds to the negative value of , as was obtained in lattice simulations. It deflects upwards from the case, which is a consequence of the EoS (Formula (24)) that follows from the expansion shown in Formula (17). The physical reason for such deflection can be explained as follows. In a wide class of statistical models, such as the excluded-volume hadron resonance gas (EV-HRG) model or the CEM, the sign of the coefficients alternates, which is a consequence of the excluded volume, as was shown in [9]. The excluded-volume effect can be formulated in terms of the EoS as follows: the pressure of the gas of finite-volume particles increases with an increase in the density more rapidly than in the case of point-like particles. This is precisely what one sees in the case of a van der Waals gas, as well as in Figure 3.
The (hypothetical) case where is shown for by a dash-dotted curve; the isotherm deflects downwards as compared with the case (corresponding to our data and shown by the green solid curve). It should be noticed that the Fourier expansions of the density with all positive coefficients were obtained in [10] in the Nambu–Jona-Lasinio model, where some evidence for the phase transition was found. The (hypothetical) isotherm of the van der Waals type that would correspond to this phase transition is shown by the dark red dash-dotted line; is the physical segment of this isotherm associated with a two-phase mixed state. Thus, in the right panel, we have outlined a plausible scenario for the phase transition in terms of the isotherms. It is important in what follows that positive higher-order coefficients in the Fourier expansion in Formula (17) are associated with the isotherms that can be naturally deformed to the isotherms of the van der Waals type.
5. Asymptotic Behavior of the Net-Baryon Number Distributions
Given the pressure , we can find the grand canonical partition function,
with imaginary values for the baryon chemical potential and then compute the canonical partition functions using Formula (3). We present the results of the outlined procedure at high and low temperatures separately.
5.1.
First, we consider in detail the case where only and are nonzero. A numerical estimate of based on high-precision computations leads to negative values of at , which is unphysical. Moreover, the series in Formula (2) with the coefficients calculated with Formula (3) using obtained by integration of Equation (8) with the baryon density (Formula (14)) diverges everywhere in the fugacity plane except the unit circle. This divergence stems from the discontinuities of the fit function shown in Formula (14) at and the general properties of Fourier series.
Yet another way to estimate the canonical partition functions associated with the baryon density is to perform an asymptotic expansion of the integral in Formula (3) in the limit where
Such an estimate was performed in [11], where the leading and next-to-leading terms of the asymptotic expansion of the canonical partition function in were taken into account, and it was found that
where
and . At high , we arrive at and
It should be noticed that the canonical partition functions defined by this formula give the series shown in Formula (2), which converges everywhere in the fugacity plane and is periodic in with the period . Therefore, the precision of the approximation of the grand canonical partition function
using the formula associated with the coefficients (Formula (27)) should be investigated in great detail; however, we leave this problem for other research. Here, we only check whether the asymptotic behavior of at defined by Formula (30) corresponds to the asymptotic behavior (Formula (30)) of at .
The estimate of the grand canonical partition function at large associated with the asymptotic behavior of the canonical partition functions (Formula (27)) can be obtained as follows:
where the integral with respect to n is evaluated using the saddle-point approximation. The result is
which is in agreement with Formula (30) (the factor of is associated with the subleading contribution to the pressure). Such agreement gives some evidence for the validity of our conclusion that the asymptotic estimate (Formula (27)) of the canonical partition functions in the limit shown in Formula (26) makes physical sense.
Therefore, of particular importance is the third method of estimating or, more precisely, given that the pressure takes the form
In terms of probability theory, and furnish the second and the fourth cumulants corresponding to the probability mass function to be determined.
To do this, one should begin with finding the moments of the random variable n (net-baryon number), given that only the two cumulants and differ from zero. In view of the general relation between the cumulant-generating function and the moment-generating function (notice that ) , we obtain
where is the Hermite polynomial. Using the asymptotic formula for the Hermite polynomials,
at large n, we arrive at the asymptotic behavior of the moments
According to the Carleman criterion [12], the probability mass function exists and is unique provided that the series diverges. In the case under consideration, , and thus the Carleman criterion is met. Thus, we can use the ansatz
in order to determine the asymptotic behavior of the probability distribution at related to the asymptotic behavior of moments (Formula (36)). We find x and y as follows: we determine the asymptotic behavior of the moments that follows from the ansatz (Formula (37)) using Laplace’s method,
and then compare the obtained formula with Formula (36). The result , coincides with Formula (29).
We consider the asymptotic of the moments of the distribution when the term in Formula (15) does not vanish. From the above reasoning, we arrive at the asymptotic behavior as follows: . In the general case, when the quark density is fitted by a polynomial of degree q, we obtain
As the temperature decreases, the degree of the polynomial needed to fit the quark density at imaginary increases. Therefore, the respective probability mass function decreases with n progressively more slowly as the temperature decreases over the range .
5.2.
With and , the net-baryon number density can be fitted by Formula (17), in which only two (with ) or one (with ) terms survive. First, we consider the case where and employ analytical continuation. Thus, we arrive at with real values for the baryon chemical potential, derive the expression for the pressure (22), and, thus, obtain the grand canonical partition function as well. Then, Formula (3) gives
where is the Infeld function of z, which coincides with the Skellam distribution
with the parameters , .
The HRG model also predicts the Skellam distribution of the net-baryon number [13,14], and our results agree with this prediction provided that b and are the average baryon and antibaryon multiplicities. In this case, our fit parameter is interpreted as follows:
It should be emphasized that the product is independent of . This excellent agreement between lattice and HRG predictions gives some evidence that a “naive” analytic continuation of the grand canonical partition function and other thermodynamical quantities to real values of chemical potential with Formula (22) is valid when T is well below so that the baryon density can be fitted by trigonometric series with a few terms only. Therefore, the dependence of the pressure and baryon density on is rather smooth, implying that there is no transition in the plane at associated with singular behavior for the baryon density.
The agreement of the lattice data for several low-order cumulants with the HRG model was found in [6]; however, our approach demonstrates the agreement of the net-baryon number probability distribution, which is more informative.
The asymptotic behavior of the probabilities at in the case where exactly J coefficients in Formula (17) do not vanish was obtained in [3],
However, this estimate was proven for positive values of J only. In the case of alternating coefficients , the Formula (43) is not justified; however, in the case of alternating coefficients , the probability mass function declines even more rapidly than in the case where .
To justify this statement, one can consider the CEM, the EV-HRG model, etc., where the net-baryon number density at imaginary chemical potentials is described by Formula (17) with an alternating sign for and decreasing as a geometric progression or faster. The probabilities corresponding to such quark densities can be evaluated numerically using the algebraic procedures described in [7], both in the case and in the case of an alternating sign for . Such estimates show that the probabilities in the case of an alternating sign for decrease with n more rapidly than those in the case of a constant sign for .
It should also be noticed that the alternating sign for was obtained in lattice simulations in QC2D at . In [7], it was shown that fitting the CEM-parameterized fit-function to the lattice data on the imaginary part of the net-baryon number density over the segment gives alternating coefficients .
Using expression (43) and assuming the positivity of the coefficients of the Fourier expansion, we find that the second term of the expansion shown in Formula (17) can be neglected as compared with the first term provided that
where . Then, assuming that, for the fireball, and are given by Formula (18) (for ), we find that deviations from the HRG model should be dramatic at , whereas experimental studies deal with [15].
6. Discussion
From Formula (43), it follows that, when we deal with infinite series of positive coefficients , the sequence decreases more slowly than any function of the type , . The positivity of the coefficients of the Fourier expansion of the density obtained in [10] at low temperatures suggests that shows a very slow decrease with n, though the corresponding fugacity expansion converges. It may occur that the cumulants obtained from such slowly decreasing probability mass functions correspond to a large variety of functions; that is, given the complete set of the cumulants, one cannot unambiguously reconstruct the probability mass function. To be more precise, we should indicate the conditions for a unique reconstruction of from its moments , since the moments are readily determined by the cumulants. The Krein criterion [12] states that the problem of moments becomes indeterminate when
where is the probability density function. The rate of decrease in at low temperatures is very close to the line of demarcation between probability mass functions generating determinate and indeterminate moment problems. Therefore, at low temperatures, the problem of reconstruction of the probability distribution of the net-baryon number by the measured cumulants is highly probably an ill-posed problem. In any case, a comprehensive study of possible unambiguity in the reconstruction of the net-baryon number probability distribution is needed.
Therefore, such a distribution should also be measured experimentally. This point of view was advocated in [5], where, on the basis of Formula (4) and the C-parity conservation represented by the relation , a procedure for the measurement of the baryon chemical potential was suggested. Since are experimentally measurable quantities and , one may conclude that theoretical expectations of the quantities
coincide with each other; that is, , provided that thermodynamical equilibrium in the fireball is approached.
Thus, it should be checked experimentally whether the data on considered as a function of n can be fitted by a constant function. If they can, this constant should be interpreted as . Given , one can determine the empirical cumulative distribution function (ECDF) of the net-baryon number at using the formula
Thus, one can combine data obtained at different values of (however, at the same temperature) to increase statistics for the determination of the probability mass function .
7. Conclusions
The results of the analytical continuation of the net-baryon number density evaluated in lattice QCD at imaginary baryon chemical potentials were used to estimate both the equation of state and the asymptotic behavior of the net-baryon number probability distribution when .
It was found that decreases sufficiently fast for the fugacity expansion to converge; however, the rate of decrease becomes gradually slower with the decrease in the temperature.
At low temperatures, the rate of decrease becomes so slow that the respective moment problem may become indeterminate—the used lattice data do not imply a definite conclusion. That is, different probability distributions of the net-baryon number may correspond to the same equation of state provided that at least one of them decreases sufficiently slowly such that the respective moment problem becomes indeterminate.
In any case, the problem of reconstruction of from the respective cumulants is either ill posed, even from the mathematical point of view, or highly sensitive to small variations in higher-order cumulants. For this reason, the analysis of experimental data based on the net-baryon number distribution involves additional information compared to that extracted from the set of cumulants.
The dependence of the equation of state on the temperature and fit parameters has also been used to formulate a possible scenario of emergence of the van der Waals isotherms corresponding to the first-order chiral phase transition. However, a check of this hypothesis, as well as the relation of the ambiguity of the reconstruction of the net-baryon number probability distribution from the cumulants to the first-order phase transition, should be the subject of further studies.
Author Contributions
Conceptualization, R.R.; Methodology, R.R.; Software, V.G.; Formal analysis, R.R.; Investigation, R.R.; Data curation, V.G.; Writing—original draft, R.R.; Writing—review & editing, V.G.; Visualization, V.G.; Supervision, R.R.; Funding acquisition, V.G. All authors have read and agreed to the published version of the manuscript.
Funding
The work of V. Goy is supported by the Russian Science Foundation (grant 23-12-00072).
Acknowledgments
Computer simulations were performed on the FEFU GPU cluster Vostok-1 and the IHEP (Protvino) Central Linux Cluster.
Conflicts of Interest
The authors declare no conflict of interest.
References
- Adam, J.; Adamczyk, L.; Adams, J.R.; Adkins, J.K.; Agakishiev, G.; Aggarwal, M.M.; Ahammed, Z.; Alekseev, I.; Anderson, D.M.; Aparin, A.; et al. Nonmonotonic Energy Dependence of Net-Proton Number Fluctuations. Phys. Rev. Lett. 2021, 126, 092301. [Google Scholar] [CrossRef] [PubMed]
- Braun-Munzinger, P.; Friman, B.; Redlich, K.; Rustamov, A.; Stachel, J. Relativistic nuclear collisions: Establishing a non-critical baseline for fluctuation measurements. Nucl. Phys. A 2021, 1008, 122141. [Google Scholar] [CrossRef]
- Bornyakov, V.G.; Boyda, D.L.; Goy, V.A.; Molochkov, A.V.; Nakamura, A.; Nikolaev, A.A.; Zakharov, V.I. New approach to canonical partition functions computation in Nf = 2 lattice QCD at finite baryon density. Phys. Rev. D 2017, 95, 094506. [Google Scholar] [CrossRef]
- Roberge, A.; Weiss, N. Gauge Theories with Imaginary Chemical Potential and the Phases of QCD. Nucl. Phys. B 1986, 275, 734–745. [Google Scholar] [CrossRef]
- Nakamura, A.; Nagata, K. Probing QCD phase structure using baryon multiplicity distribution. Prog. Theor. Exp. Phys. 2016, 2016, 033D01. [Google Scholar] [CrossRef]
- Bzdak, A.; Koch, V. Net-baryon multiplicity distribution consistent with lattice QCD. Phys. Rev. C 2019, 99, 024913. [Google Scholar] [CrossRef]
- Begun, A.; Bornyakov, V.G.; Gerasimeniuk, N.V.; Goy, V.A.; Nakamura, A.; Rogalyov, R.N.; Vovchenko, V. Quark Density in Lattice QC2D at Imaginary and Real Chemical Potential. arXiv 2021, arXiv:2103.07442. [Google Scholar]
- Bazavov, A.; Bhattacharya, T.; DeTar, C.; Ding, H.T.; Gottlieb, S.; Gupta, R.; Hegde, P.; Heller, U.M.; Karsch, F.; Laermann, E.; et al. Equation of state in (2 + 1)-flavor QCD. Phys. Rev. D 2014, 90, 094503. [Google Scholar] [CrossRef]
- Taradiy, K.; Motornenko, A.; Vovchenko, V.; Gorenstein, M.I.; Stoecker, H. The analytic structure of thermodynamic systems with repulsive interactions. Phys. Rev. C 2019, 100, 065202. [Google Scholar] [CrossRef]
- Wakayama, M.; Nam, S.i.; Hosaka, A. Use of the canonical approach in effective models of QCD. Phys. Rev. D 2020, 102, 034035. [Google Scholar] [CrossRef]
- Bornyakov, V.G.; Gerasimeniuk, N.V.; Goy, V.A.; Korneev, A.A.; Molochkov, A.V.; Nakamura, A.; Rogalyov, R.N. Numerical study of the Roberge-Weiss transition. Phys. Rev. D 2023, 107, 014508. [Google Scholar] [CrossRef]
- Akhiezer, N.I. The Classical Moment Problem and Some Related Questions in Analysis; Society for Industrial and Applied Mathematics: Philadelphia, PA, USA, 2020. [Google Scholar] [CrossRef]
- Braun-Munzinger, P.; Redlich, K.; Stachel, J. Particle Production in Heavy Ion Collisions. In Quark–Gluon Plasma 3; Hwa, R., Wang, X.-N., Eds.; World Scientific: Singapore, 2004; pp. 491–599. [Google Scholar] [CrossRef]
- Braun-Munzinger, P.; Friman, B.; Karsch, F.; Redlich, K.; Skokov, V. Net-charge probability distributions in heavy ion collisions at chemical freeze-out. Nucl. Phys. A 2012, 880, 48–64. [Google Scholar] [CrossRef]
- Abdallah, M.S.; Adam, J.; Adamczyk, L.; Adams, J.R.; Adkins, J.K.; Agakishiev, G.; Aggarwal, I.; Aggarwal, M.M.; Ahammed, Z.; Alekseev, I.; et al. Cumulants and correlation functions of net-proton, proton, and antiproton multiplicity distributions in Au+Au collisions at energies available at the BNL Relativistic Heavy Ion Collider. Phys. Rev. C 2021, 104, 024902. [Google Scholar] [CrossRef]
Figure 1.
QCD phase diagram.
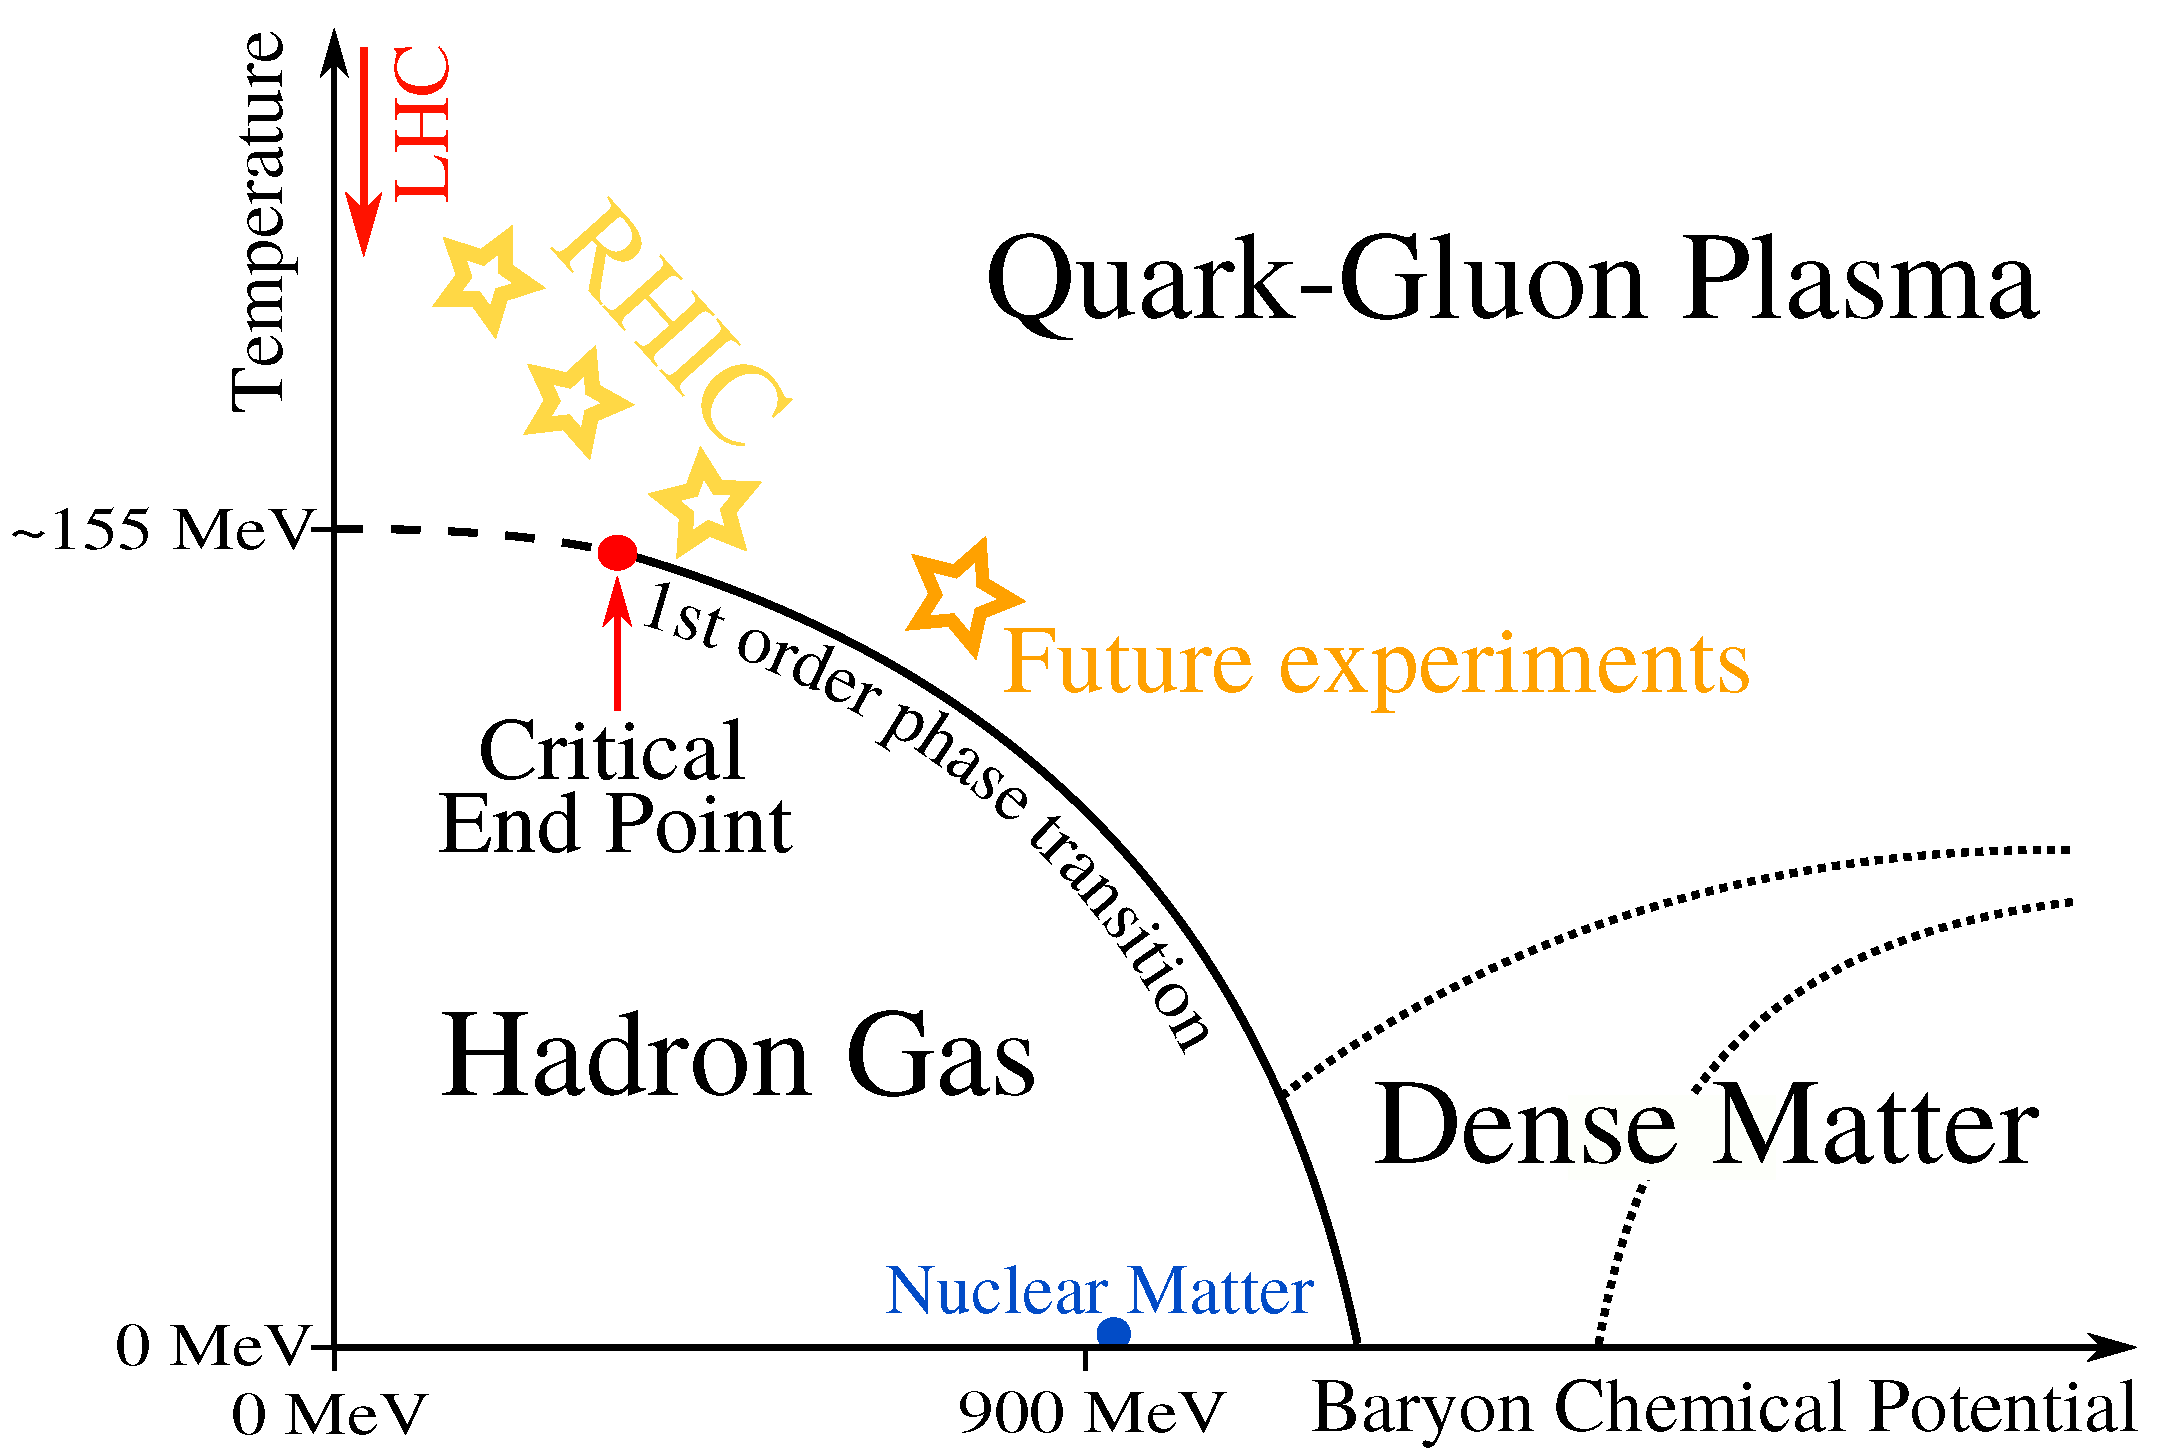
Figure 2.
The QCD phase diagram in the plane. Vertical lines show the first-order Roberge–Weiss phase transition, is the Polyakov loop, and the symbols I, , and label the Polyakov-loop sectors. The dashed line separates phases with finite () and infinite () free energy for an isolated quark. With physical quark masses, it furnishes a crossover transition line.

Figure 3.
(Left panel): isotherms illustrating the EoS at (solid curve) and at (dashed curves). (Right panel): isotherms illustrating Formulas (23) (solid curves) and (24) (dashed curve) for the EoS at temperatures and and various values for the parameters. Dash-dotted curves are not related to lattice data and are explained in the text. fm3 is the nuclear saturation density.

Disclaimer/Publisher’s Note: The statements, opinions and data contained in all publications are solely those of the individual author(s) and contributor(s) and not of MDPI and/or the editor(s). MDPI and/or the editor(s) disclaim responsibility for any injury to people or property resulting from any ideas, methods, instructions or products referred to in the content. |
© 2023 by the authors. Licensee MDPI, Basel, Switzerland. This article is an open access article distributed under the terms and conditions of the Creative Commons Attribution (CC BY) license (https://creativecommons.org/licenses/by/4.0/).
Share and Cite
MDPI and ACS Style
Rogalyov, R.; Goy, V. Net-Baryon Probability Distributions from Lattice Simulations. Particles 2023, 6, 771-783. https://doi.org/10.3390/particles6030049
AMA Style
Rogalyov R, Goy V. Net-Baryon Probability Distributions from Lattice Simulations. Particles. 2023; 6(3):771-783. https://doi.org/10.3390/particles6030049
Chicago/Turabian StyleRogalyov, Roman, and Vladimir Goy. 2023. "Net-Baryon Probability Distributions from Lattice Simulations" Particles 6, no. 3: 771-783. https://doi.org/10.3390/particles6030049