Article

Salt Content of Dairy Farm Effluents as an Indicator of Salinization Risk to Soils

by
Bertha A. Rivas Lucero
1,
Mélida Gutiérrez
2,*,
J. Eduardo Magaña Magaña
1,
Francisco Márquez Salcido
1 and
Walter Márquez Fierro
3
1
Facultad de Ciencias Agrícolas y Forestales, Universidad Autónoma de Chihuahua, Delicias, Chihuahua 33000, Mexico
2
Geography, Geology and Planning Dept. Missouri State University, Springfield, MO 33000, USA
3
Centro Universitario Parral, Universidad Autónoma de Chihuahua, Parral, Chihuahua 33820, Mexico
*
Author to whom correspondence should be addressed.
Soil Syst. 2018, 2(4), 61; https://doi.org/10.3390/soilsystems2040061
Submission received: 21 October 2018 / Revised: 4 November 2018 / Accepted: 6 November 2018 / Published: 8 November 2018

Abstract

:
Water used for irrigation is a leading source of induced salinity in semiarid areas. Within the Irrigation District 005 in northern Mexico, there are more than 100 dairy farms housing over 72,000 dairy cows, 74% of which are concentrated in approximately 30 intensive-operation farms. Dairy farm effluents (DFE) and manure are collected and stored temporarily until they are applied to the land to fertilize pasture and other crops. DFE vary in salt content, depending on specific farm operations. The risk of soil salinization by DFE was estimated by measuring electrical conductivity (EC) of both well water and DFE, and comparing these values with 2.0 mS cm−1, a Mexican guideline for wastewater used in agriculture. Half of the effluents exceeded the EC limit, with values as high as 12.4 mS cm−1, whereas a few exceeded the EC limit in both well and effluent water. The generation of salt and its passing into soils expose a potential for soil salinization, if preventive measures are not taken. A salt load map was created that depicted the areas at higher risk of salinization. The simple technique utilized here can be applied in estimating salinization potential in areas where monitoring of soils, irrigation drains, and shallow groundwater is infrequent.

Graphical Abstract

1. Introduction

Dairy farms produce large quantities of wastewater as a result of the thorough washing of milking and feeding parlors to ensure sanitary conditions. Application of these dairy farm effluents (DFE) to agricultural soils is a widely utilized disposal method due to the benefits that these wastewaters bring to the soil and the accompanying increase in the sustainability of the operations [1,2,3].
Milk production worldwide doubled between 1981 and 2018, with developing countries contributing 75% of this increase [4,5]. Within this time, a shifting from small pastoral operations to intensive dairy has taken place, as well as a tendency to move their locations closer to urban centers to ease the transport of their product and feedstuff. Because of the high water demand and wastewater volume generated by dairy farms, these trends exert a growing pressure on water and soil resources on a regional scale. Among the benefits of land application of DFE, the added organic matter, nutrients, and microbial mass are known to improve soil aggregation, soil fertility, and water holding capacity (Porter 2008), processes that require years to reach equilibrium [1].
In semiarid areas, where water is a prized resource, having a continuous source of water (DFE) is regarded as a benefit to agriculture; however, DFE are an important source of salts to the soil [6,7], especially in areas with high rates of evaporation. Another undesirable outcome includes the runoff of nutrients and persistent organic substances (e.g., some cleaning chemicals, antibiotics) into nearby streams and groundwater.
Ideally, wastewater from animal operations should be applied to the soil at a dosage rate to provide but not exceed the required amount of nutrients (N, P, and K) for the particular crop [5,8], to minimize the loss of nutrients (and profit), and to prevent eutrophication to nearby water bodies [3]. An accurate estimate of the amount and composition of manure excreted by cows is thus important to determine the DFE dosage to the land [9]. Components of DFE that have been studied for their potential impact include salt (measured by electrical conductivity (EC)) [6,10], nutrients [11], heavy metals [10], pathogens [12], and antibiotics [13].
With proper management, the land application of DFE could bring economic benefit to a region; however, these wastes are more often considered a leading cause of water pollution and other environmental problems [4]. A wide variety of dairy farm management strategies for reducing the risk of soil salinity and water contamination have thus been proposed [2,5,14,15].
In intensive operation dairy farms, DFE from the milking and feeding sections contain a large amounts of manure, urine, and chemicals [16]. The washing of the milking parlor produces a large amount of wastewater, whereas the water used to wash the feeding area contains 80% of the daily wastes of fecal matter and urine [17].
The amount of wastewater generated daily in dairy farms has been estimated to be between 350 and 750 L cow−1 [5,14]. Because of the large volumes of wastewater produced, intensive operation farms separate and/or stabilize the wastes in order to reuse water and to minimize the waste. Treatments used in land applications include lagoons and constructed wetlands [8,10,16]. Lagoons and constructed wetland treatments are common because they are inexpensive and easy to operate. However, they require land, plus they accumulate non-volatile chemicals (e.g., nitrates) that pose a threat in the form of groundwater contamination [8,18]. Alternative treatments to lagoons include aerobic and anaerobic biodigestors. The most common type of biodigestors are anaerobic, which consist of tightly closed containers where the organic waste ferments in absence of oxygen, generating a fuel gas composed of about 66% methane and 33% CO2. Solid products of these treatments are either spread over the land as a source of organic fertilizer, or used as a soil conditioner [16,19].
Alternatively, farms may dispose of their wastes without treatment, mixing them to form a slurry to be applied directly to land surface by means of a spreading system, a process known as broadcast application [3,19]. A problem associated with this option is that large suspended solids tend to clog the aspersion or drip irrigation systems.
The Food and Agriculture Organization estimates that 65 million ha worldwide are affected by salinity, of which 34 million ha face severe salinization [20]. The high content of salts in soils causes a decrease in the growth of crops by not allowing plants to take enough water from the root zone [21]. Soil salinity can be evaluated based on several parameters, including EC, sodium absorption ratio (SAR), and boron (B) content [10]. Within the salts, the presence of sodium (Na) will affect not only the plants but will cause a decrease in the hydraulic conductivity of soils by promoting the dispersion of clays and disintegration of soil aggregates [7,22]. These processes result in the hardening of the soil and thus a degradation of soil quality [21].
It is important to mention that a good balance between water and soil salinity will prevent deterioration of soil quality. Evidently, irrigation with water of good quality will contribute to reaching an optimal value of salinity in the root zone, but other factors besides water quality are just as important such as drainage, depth to water table, and evaporation rate. Thus, a soil can become saline after being irrigated with water of good quality, and in contrast, water with moderate salinity can be used in an economic and permanent way under the proper drainage and irrigation management [6,15].
The Irrigation District 005 of northern Mexico houses over 72,000 dairy cows, 74% of which concentrate in intensive-operation dairy farms. The wastes generated by these operations are used to irrigate nearby fields. Although the salinity impact of irrigation drains to the rivers is well known; e.g., Na concentrations in the Rio Conchos increasing from <10 ppm to 250 ppm after the discharge of irrigation drains [23], this region lacks studies that quantify the salt loads produced, their sources, and their change with time.
The objectives of this study were to: (1) document and plot the estimated waste output from intensive operations dairy farms from the Irrigation District 005 in Mexico, (2) assess the salinity of well water and waste effluents using electrical conductivity, and (3) construct a salinization risk map for dairy farm effluents based on generated salt loads.

2. Materials and Methods
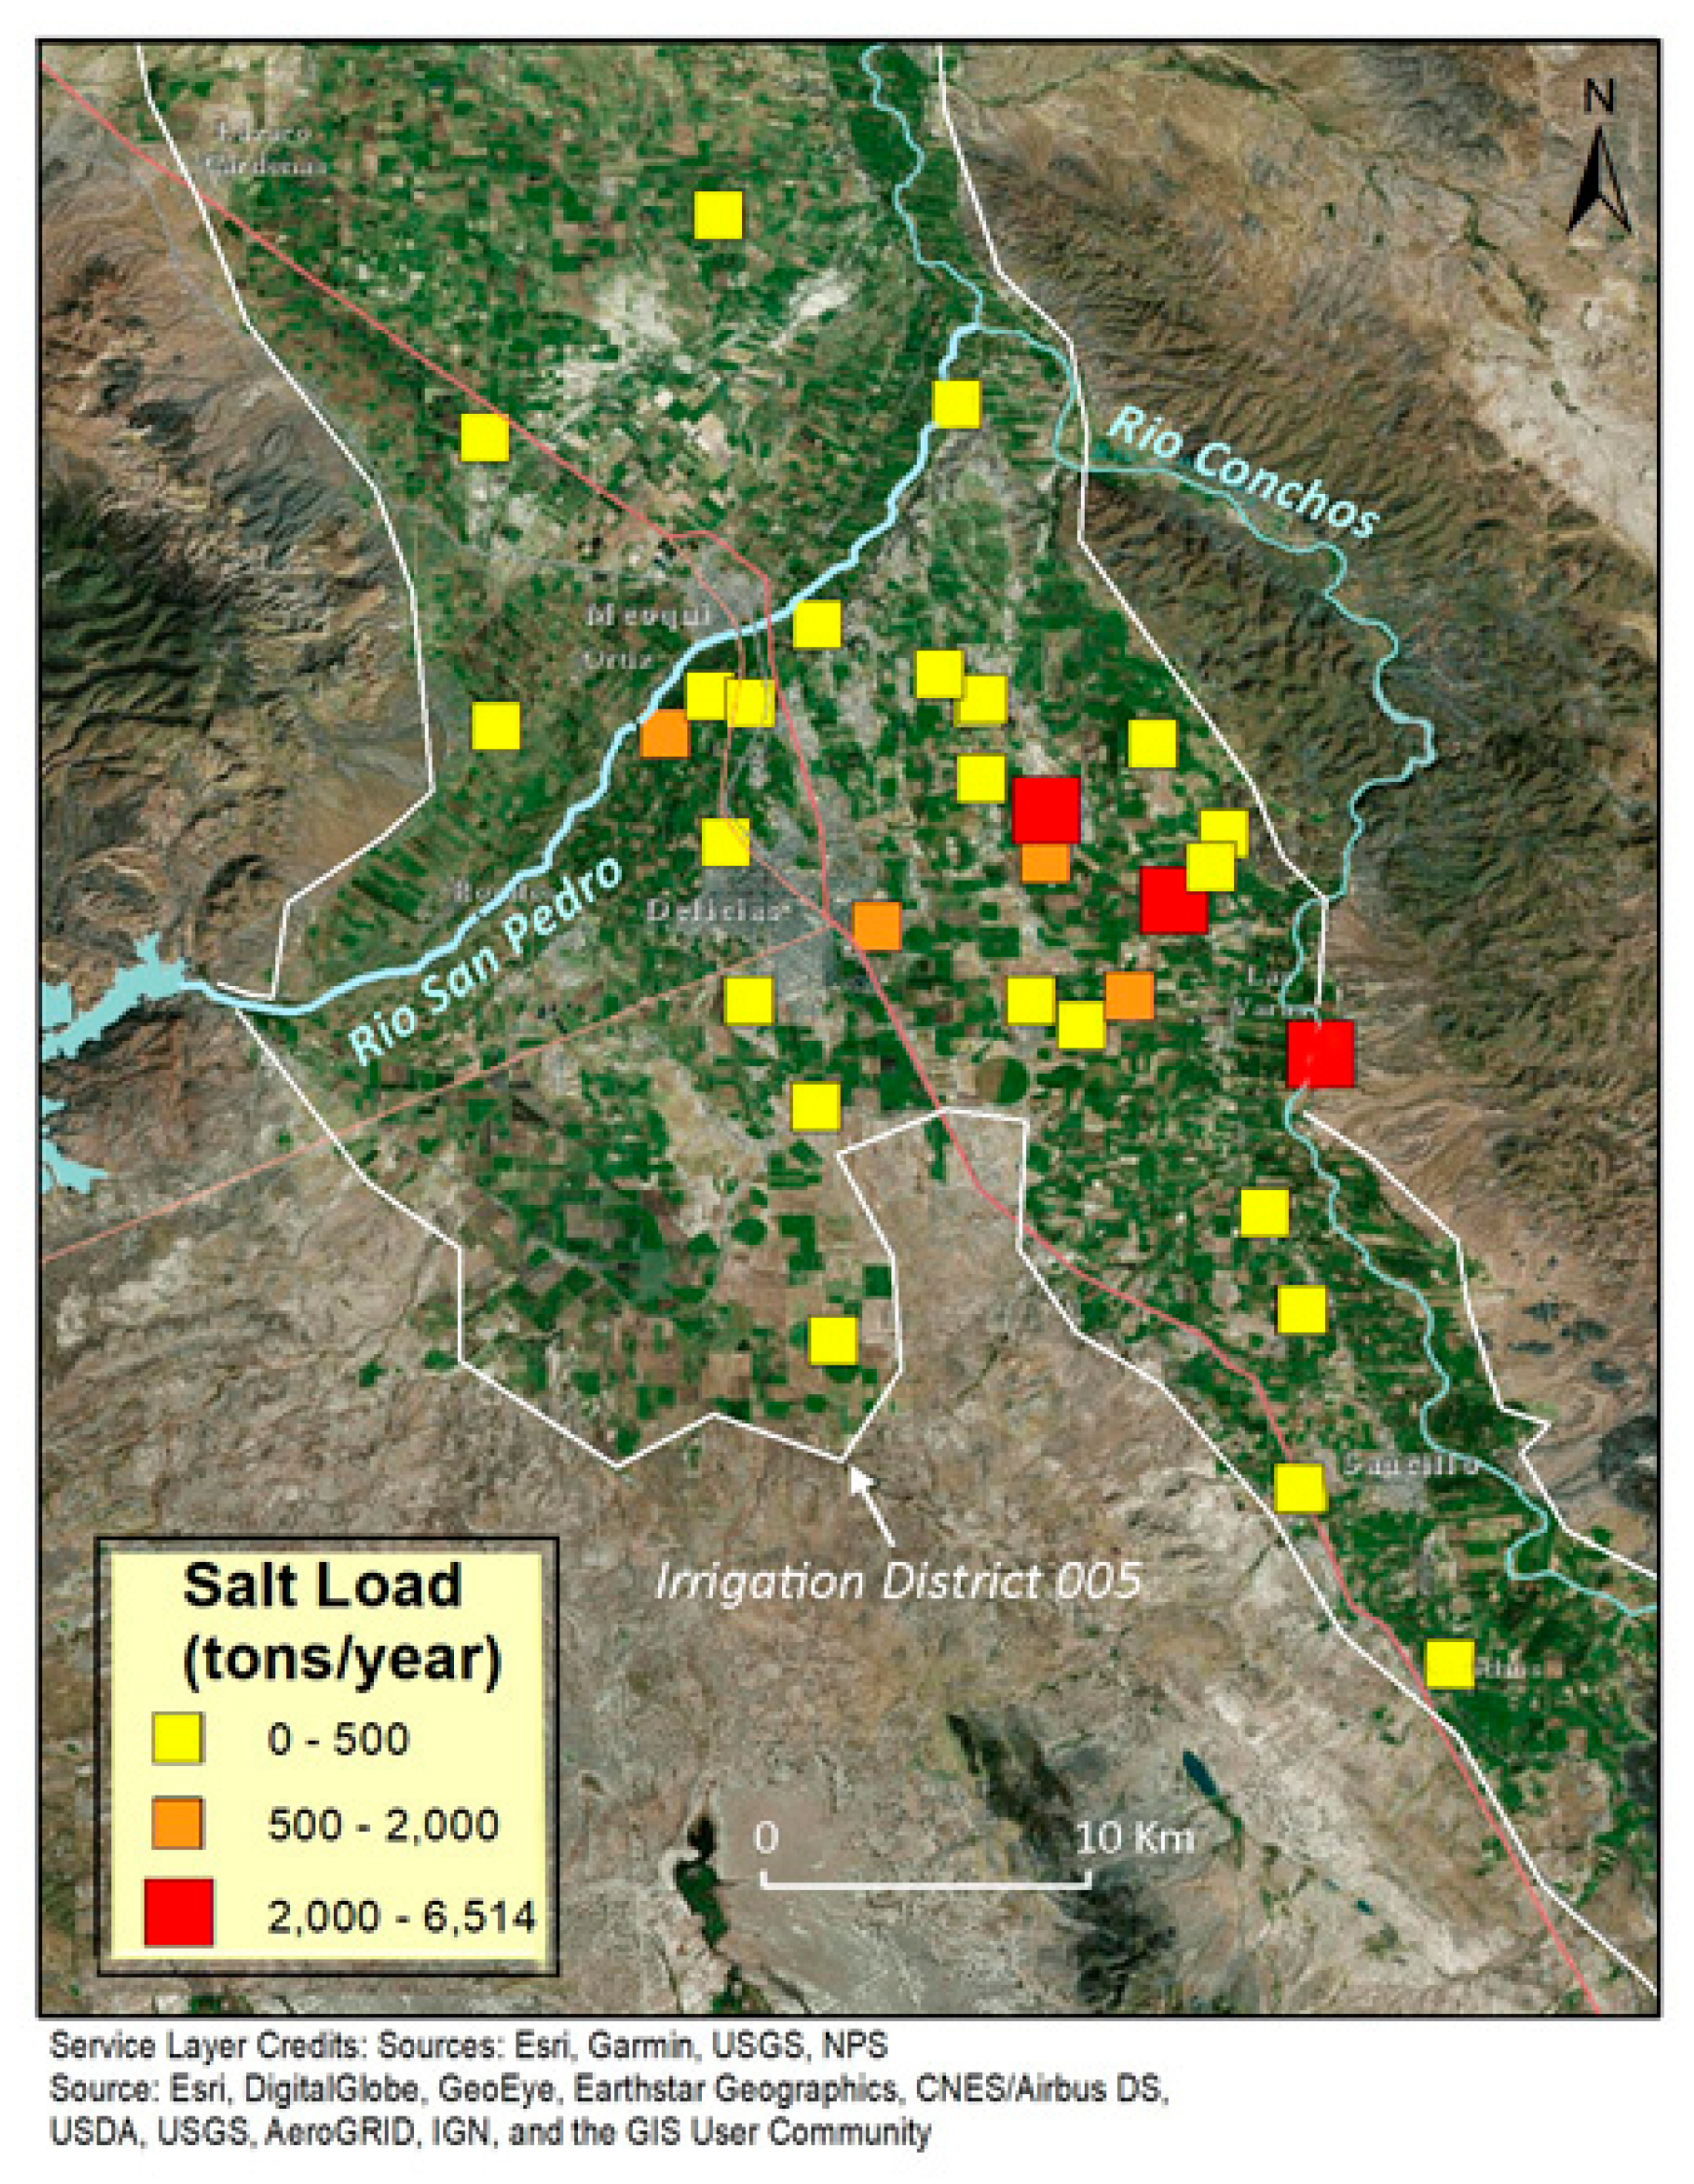
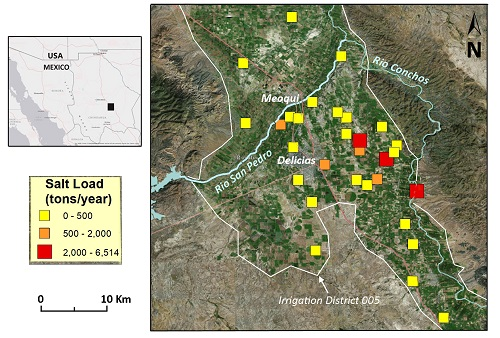
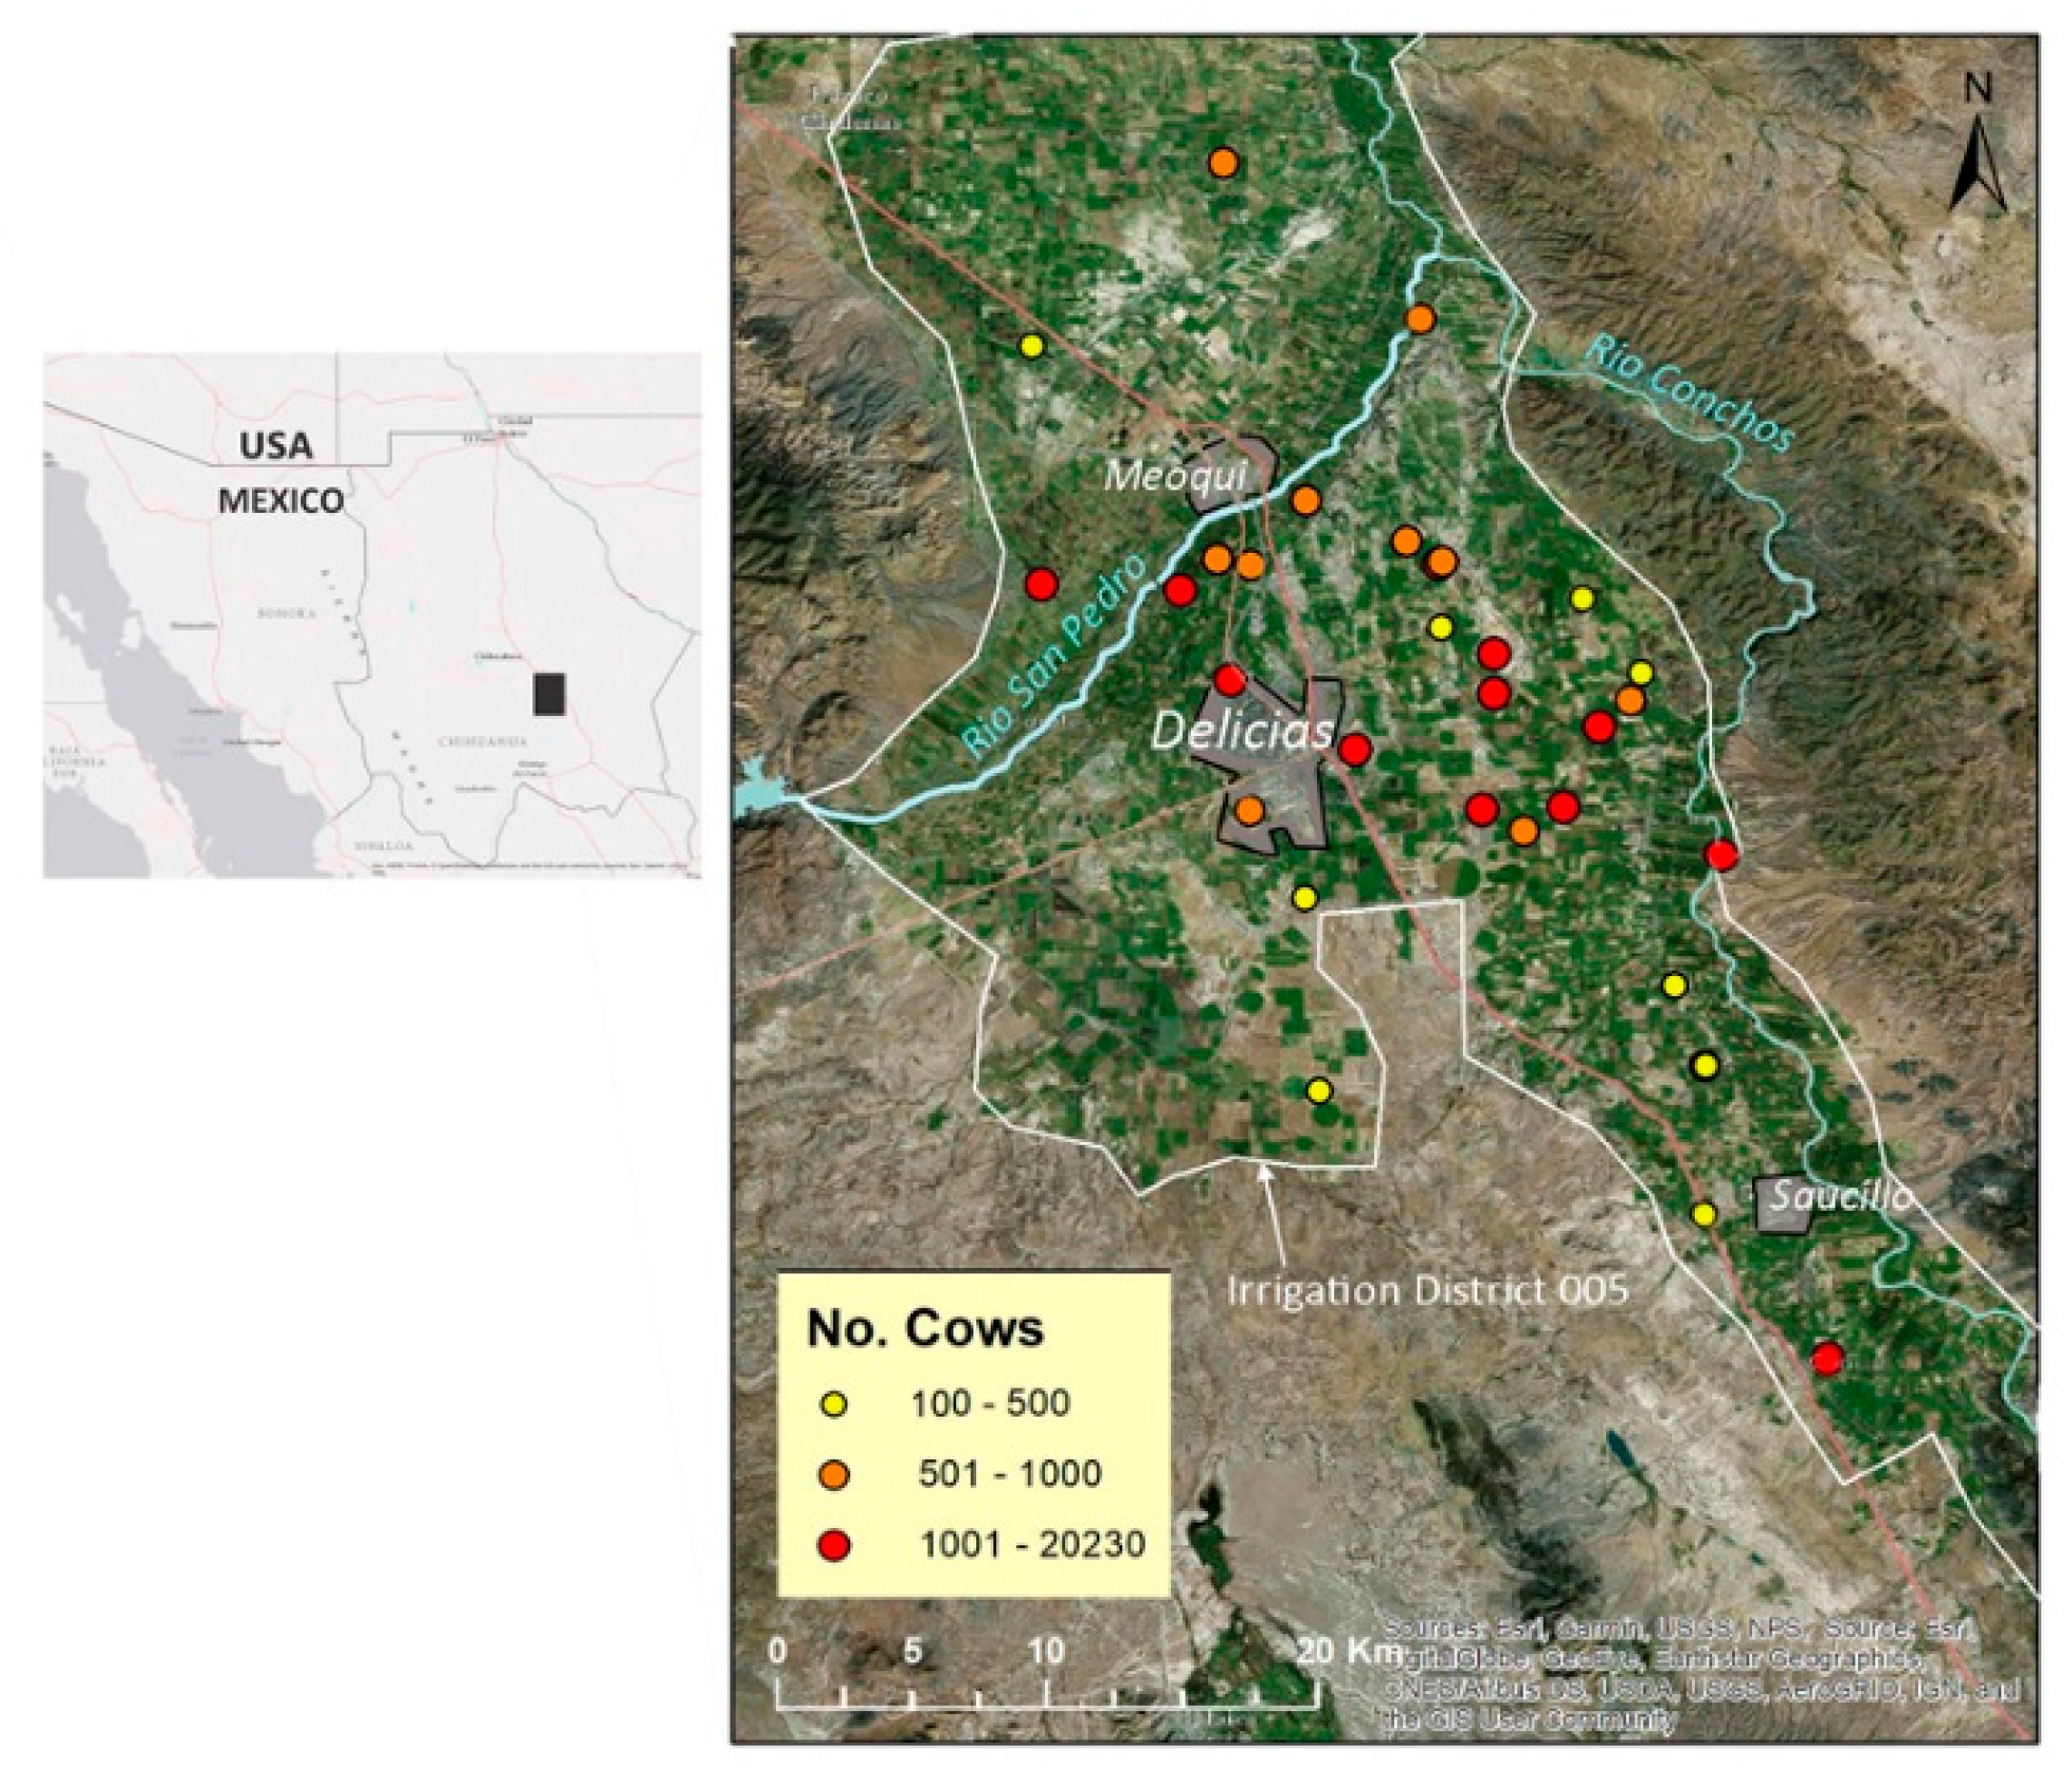
2.1. Study Area

The Irrigation District 005, located in northern Mexico, covers 80,103 ha and has an average altitude of 1200 m.a.s.l. The largest city in this region is Delicias (pop. 148,000) and there are many smaller settlements. This area is encompassed within the Chihuahuan Desert, has a semiarid climate and an annual precipitation of 325 mm. Recurrent droughts are common; the most recent affected the area from 1995 to 2003 [24].
The water used in the Irrigation District 005 comes from two reservoirs, La Boquilla and Francisco I. Madero, and from groundwater withdrawals from the Meoqui-Delicias aquifer, a large alluvial aquifer of variable depth that can be up to 500 m deep. Major crops grown in the irrigation district include alfalfa, corn, sorghum, oats, and pecan nuts.
About 100 dairy farms are located within the Irrigation District. The farms are divided by size into small, medium, and large operations, corresponding to <100, 100 to 500, and >500 dairy cows, respectively. This study concentrates on farms with 100 or more dairy cows, shown in Figure 1. The number of cows in these farms ranged between 106 and 20,230.

2.2. Sampling

This study was designed to provide an overview of the salt load generated by dairy farms and a map showing their spatial distribution in order to identify a subset that can be studied in more detail in the near future. Dairy farms were first inventoried in 2007 for water quality (EC) of both DFE and producing wells [25] with a follow-up visit in 2018. The second visit consisted of observations only, as sample taking was inaccessible. During both visits, information about type of chemicals used in washing the facilities, feed given to cows, number of hectares irrigated with DFE, and type of crops grown in those fields was gathered whenever possible. With a reported 80,000 dairy cows in 2018, the number of cows had increased merely 9% from 2007, with operations in dairy farms remaining approximately the same.

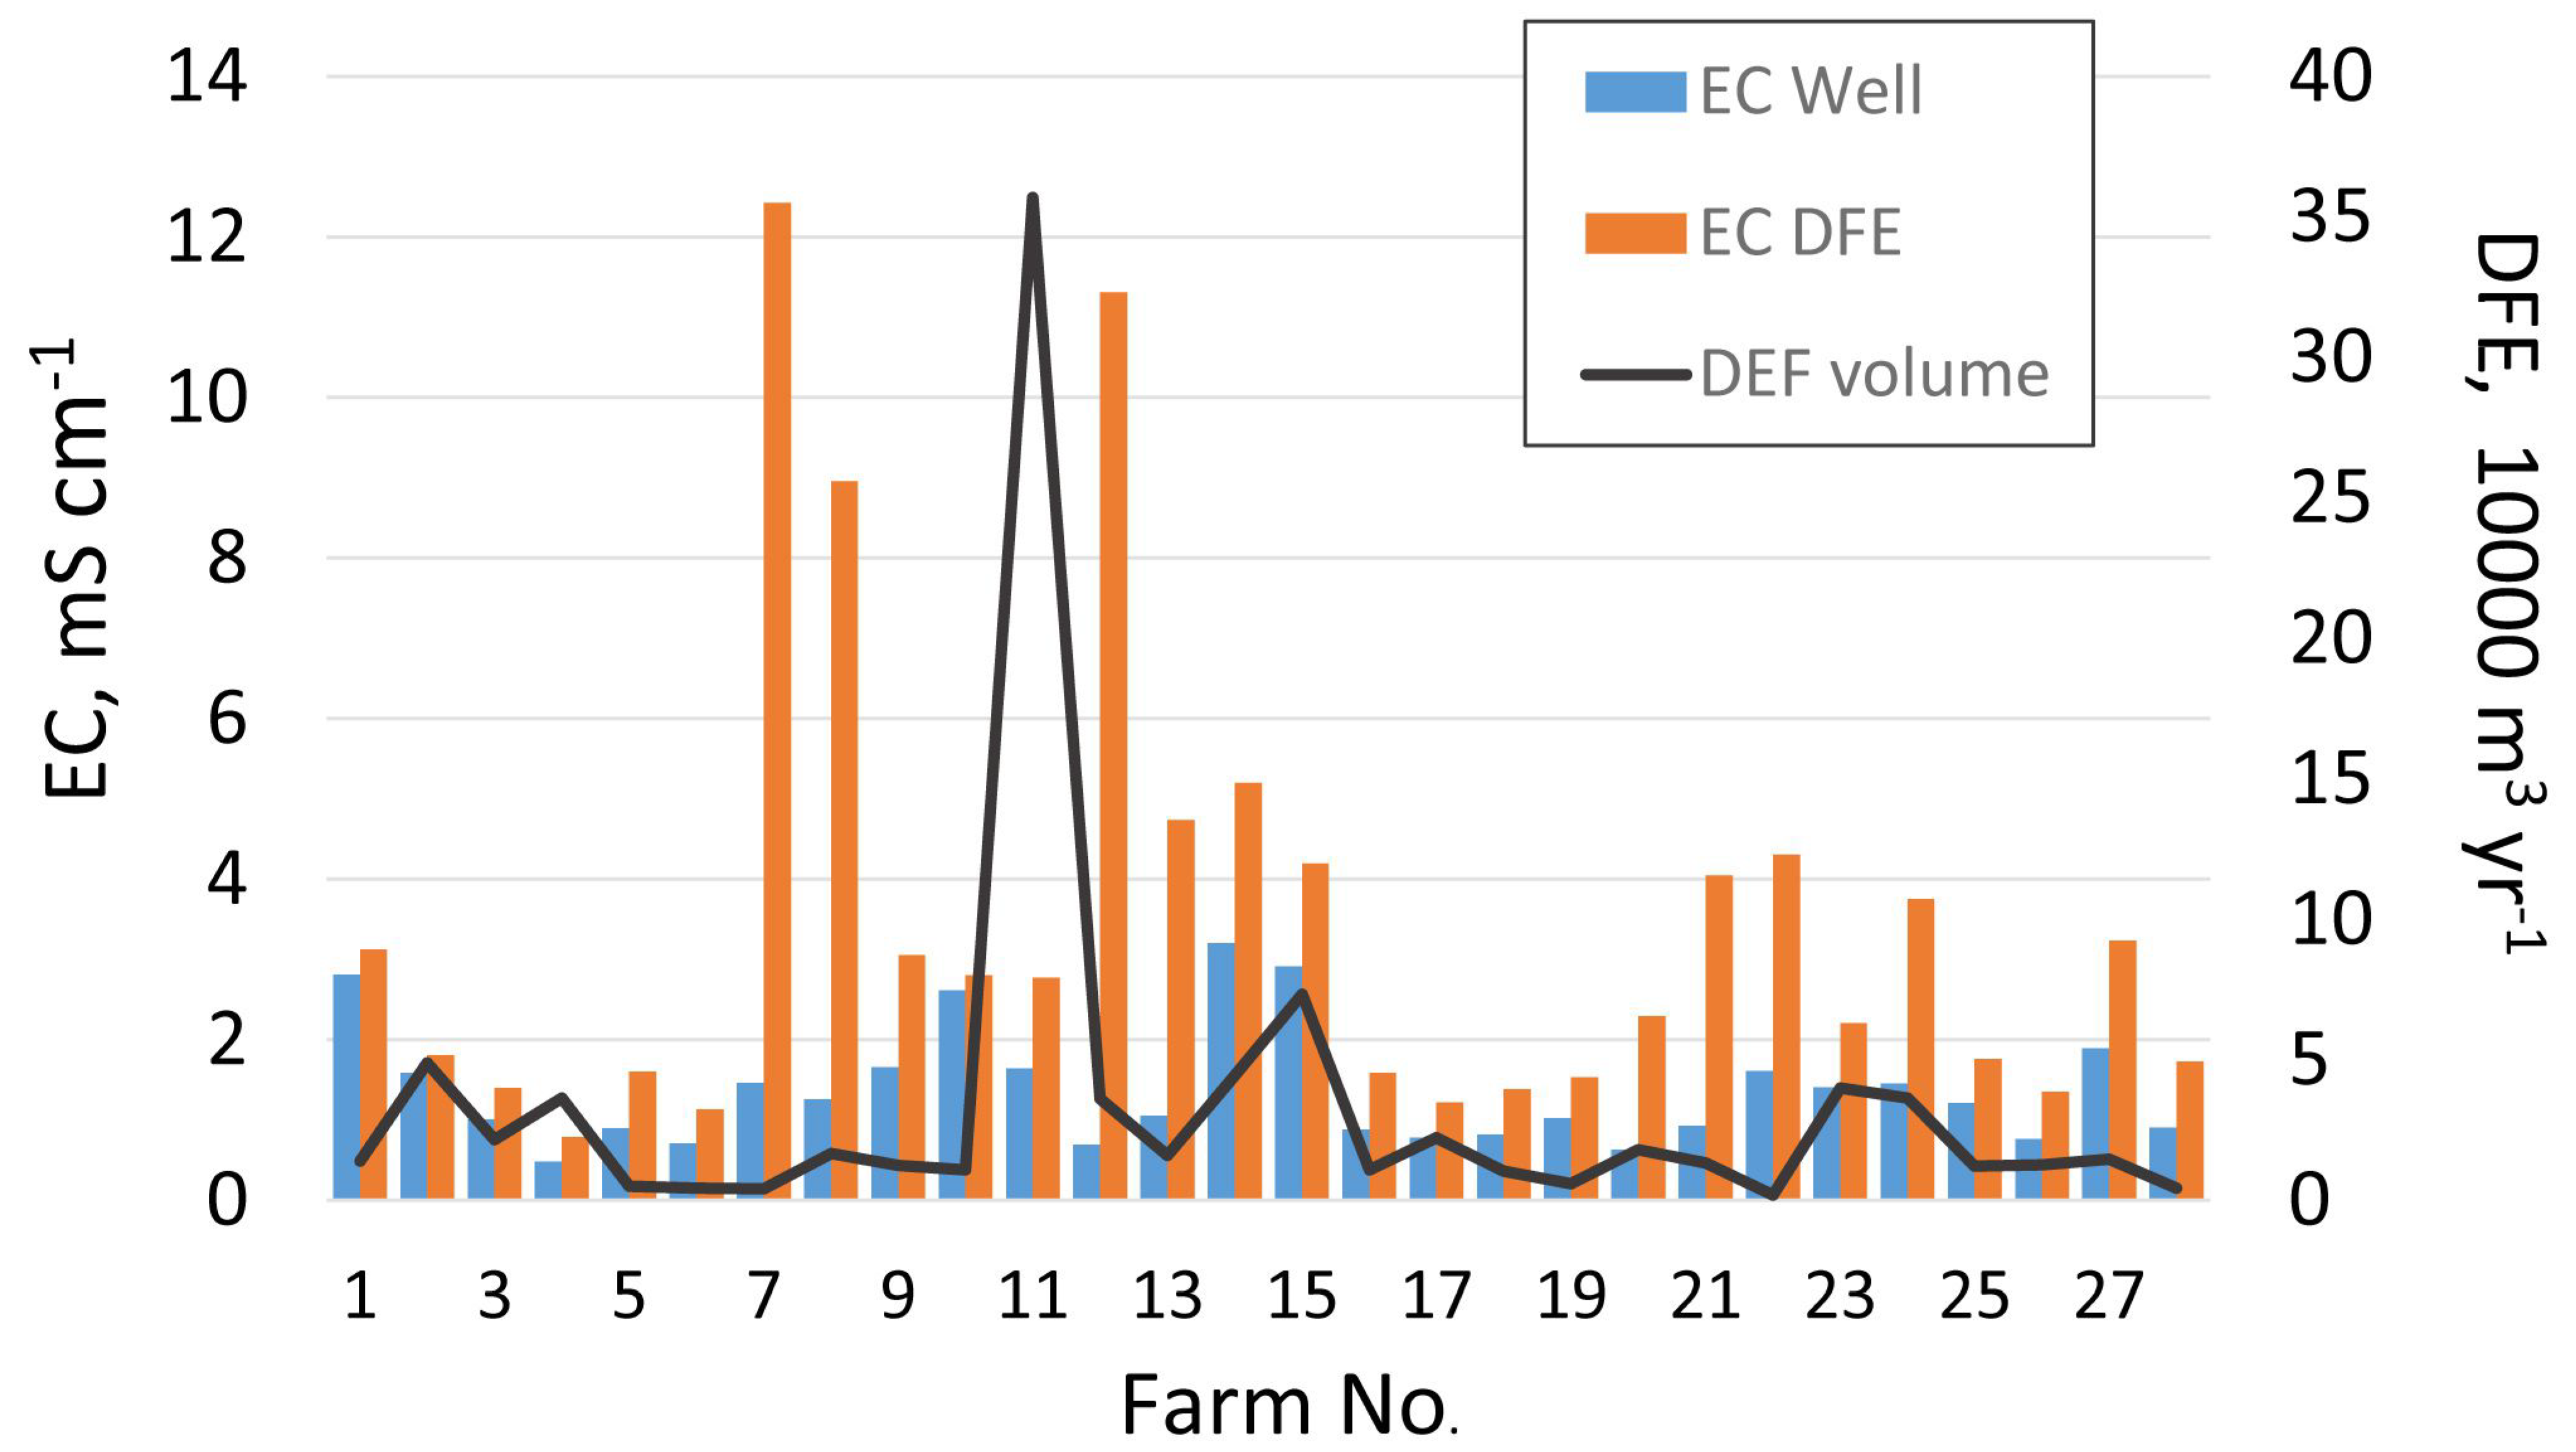
2.3. Salinity, Total Dissolved Solids (TDS), and EC

Most analyses of soil and water quality are time and labor consuming, and some can be costly. In contrast, electrical conductivity (EC) is inexpensive, rapid, and simple to perform [10]. Since EC is related to the amount of ions in solution or dissolved salts, it is one of the most used parameters to determine if water is suitable for irrigation, commonly expressed in mS cm−1.
In many semiarid areas, where monitoring is infrequently conducted, EC offers a great advantage as a reconnaissance tool to check on water and soil salinity. Once the dairy farms with excess salts in their effluents have been identified using EC, the DFE could undergo preventive measures and the affected land could undergo a more systematic study of soil salinity, e.g., determining SAR at various depths [10].
EC was measured in the field using a Hach Drel/2010 conductivity meter until a constant value was obtained (about one minute). The conductivity meter was calibrated daily. The total dissolved solids (TDS, mg L−1) were obtained from EC. TDS in a water sample is obtained by weighing the residue from the total evaporation of a water sample of a known volume. After plotting TDS against EC, the exact factor to relate EC and TDS for a particular region can be obtained [26,27]. However, one has to be careful as the relationship of EC to TDS is not linear, and also the EC varies with temperature and with the particular mixture of ions present. In spite of these limitations, and after verifying that the relationship holds for the range of temperature and water concentration values occurring in the particular area of study, the relationship EC–TDS can be useful.
A common approximation for a relationship of TDS to EC at 25 °C operating in the Chihuahuan Desert area [27]: TDS (mg L−1) = 659 × EC (mS cm−1), if 0.1 < EC (mS cm−1) < 5.

2.4. Waste and Salt Loads

The amount of DFE generated was obtained assuming the most conservative values of 350 L cow−1 day−1 for eight months a year and 750 L cow−1 day−1 during the hot summer months (May to August) [5,14].
Salt loads were obtained by multiplying the DFE by its salt content (as TDS). These were plotted at the site where the salt load was generated, that is, the location of the dairy farm, since the precise location of the land where these wastes are being applied was unavailable. The maps were constructed using ArcMap ver. 10TM.

3. Results

3.1. Waste Generation

The inventory of number of cows, wastewater generated, irrigated surface, and crops grown in plots irrigated with DFE are listed in Table 1. The total wastewater produced amounted to 9.177 × 10⁶ m3 year−1 and the total salt load 19.61 ton year−1.

3.2. Risk of Salinization

The risk of salinization was estimated by comparing the EC of DFE with the Official Mexican Standard on the use of wastewater in agriculture NOM-032-ECOL-1993 of 2.0 mS cm−1. The EC values for well water and waste effluent are plotted in Figure 2. An evident feature is the large variability of EC values between wells, and also among the volume of waste generated (solid line in Figure 2). From Figure 2, it is evident that the EC values vary independently from the DFE volume, suggesting that this variability is caused by differences in operation processes within dairy farms and not by farm size.
Further consideration to the variability of EC values include the feed given to cows, which contains more or less salt depending of the amount of concentrates in the diet, chemicals used as sanitizers like iodine and chlorine, and detergents such as lye (NaOH).
The results show that 16 of the 28 farm effluents (57% of the farms) exceeded the EC guideline of 2 mS cm−1, and four of them exceeded the EC guideline value in both the wastewater effluent and the well water. The high salinity of the latter points to an aquifer likely contaminated by surface wastes.
The salt load was calculated after multiplying the TDS (mg L−1) by the volume of wastewater generated by each farm (Table 1). As with EC values, the salt loads were found to vary widely, from 31 to 6514 tons year−1, which has also been reported in other areas [3]. Salt loads were plotted in a map to show the aerial distribution and magnitude of these potential salt sources (Figure 3). Because of the close proximity of dairy farms and irrigated fields to the Rio San Pedro and Rio Conchos rivers, these rivers are expected to carry much of the excess salts downstream.

4. Discussion

The amount of wastewater and salt loads carried by irrigation water are an important component in the determination of sustainability of soils in intensively irrigated areas [15,23,24,28]. Salt loads, either as ton year−1 or as ton ha−1 year−1, from intensive irrigation regions, such as the Imperial Valley (California) [28] and Ebro River Basin (Spain) [26], were measured in order to conduct a salt balance at a watershed level; these studies also report high variability in salt load values depending on precipitation and groundwater flow. Although the information on surface area irrigated with DFE can be only roughly estimated in this study, some general trends stand out. These include the small percentage (8.6%) of the total hectares irrigated with DFE that were located adjacent to the farm, suggesting that most of the waste has to be hauled away for disposal. However, transportation costs will likely limit the application of waste to fields within the Irrigation District 005. According to the distribution of dairy farms within the irrigation district, the dairy farms scatter in about 70% of the irrigation district’s area, that is 56,000 ha. Assuming a conservative estimate of half of that land, or 28,000 ha, receive DFE from 52,018 cows, an average of 1.86 cow ha−1 is obtained, a number almost twice the values reported for humid regions, for example, 1.16 cow ha−1 reported for Wisconsin farms [3]. The higher value obtained in this study suggests that DFE is applied as a thick layer over the land, or that there is a significant leakage of DFE to irrigation canals or streams. Most likely, and since contamination of irrigation canals was a common sight, this discrepancy results from a combination of both an application of a thicker layer and leakage of waste.
As mentioned above, the second visit to the farms included only visual inspection, however, any changes in salt loads generation during this time are presumed negligible since the number of farms and number of cows remained about the same during these ten years, while precipitation was above average (469 mm year−1 for 2007–2018 compared to historical average of 325 mm year−1) in short-lived events that are typical of monsoon rains [24]. The latter conditions favor the washing away of salt buildup. Also, during the 2007 visits to the farms, the fields adjacent to two farms showed degraded soils, and no crops were growing. The same two fields were still bare during the 2018 visit, but there were no sights of additional unproductive plots. Therefore, even though the operations and amount of wastewater did not significantly change between 2007 and 2018, and in spite of some salt being washed away, the risk of salinization remains, based on the high salt loads produced.
This reconnaissance study identified farms as well as operation practices that need to be improved in order to achieve more profit to the farmers and less harm to the environment; however, this study should be followed up by a more detailed study that would include enough variables to estimate a salt balance of the region. Once the farms with the most impact to salinization have been identified, best practices can be recommended for implementation. These include the selection, among the many designs that are available, of effective treatment and disposal methods to DFE and manure [2,5,16]. A well operated disposal of DFE and manure would not only prevent contamination, but it would increase the farmers’ profit. Farmers seem to be aware of the threatening soil salinity problem, and that an adequate reuse of DFE would lessen the risk of salinization; however, contamination of irrigation canals with wastes indicates that the message about the importance of keeping these valuable resources (manure, nutrients, water) in the fields needs to be strengthened.
A periodic reminder of best practices and water saving procedures seems to be a good first step towards addressing proper disposal of wastes, which have been reported as a condensed list [5] or in a comprehensive report [3]. Selection of drought-resistant, water-efficient crops, e.g., sorghum and some varieties of corn, instead of water-intensive crops that bring short-term profit, and the application of nutrients and water based on need and not on schedule, are best practices that are particularly required in semiarid areas [29].
In sum, many farmers should have a clear idea of how to reuse the nutrients from DFE as fertilizer while increasing crop yields, lowering operational costs, and promoting sustainability (including groundwater quality). For wells or irrigated fields where salinity is a concern, determining salinity parameters such as Na (sodium) concentration, SAR (sodium adsorption ratio), COD (chemical oxygen demand) in addition to EC would more fully assess the impact of DFE applied to the land.

5. Conclusions

The EC measurements were effective in comparing the salinity of both effluent and well water, as well as to calculate salt loads generated by dairy farms. EC is a parameter that is easy to measure is a quick and effective reconnaissance tool for salinity changes. The results showed that about half of the farms had a high concentration of dissolved salts in their effluents, and salinity above guidelines was observed in a few wells. Salt loads were plotted in a map to show their magnitude and spatial distribution.
Diversion of DFE to water bodies represent a loss in both fertilizer cost and irrigation water and thus a loss in profit to the farmer. Monitoring soil and water salinity is an effective tool to identify those farms where efforts should be concentrated. Outreach education programs stressing the benefits of properly disposing of DFE wastes need to be implemented in an effective and assertive way in order to reach all farmers. The methodology outlined in this study could be utilized in other semiarid areas that face similar predicaments.

Author Contributions

Conceptualization, B.A.R.L., J.E.M.M.; methodology, B.A.R.L., J.E.M.M., F.M.S.; software, M.G.; validation, M.G.; formal analysis, J.E.M.M.; investigation, B.A.R.L., J.E.M.M., W.M.F.; resources, F.M.S., J.E.M.M., W.M.F.; writing—original draft preparation B.A.R.L., J.E.M.M.; writing—review and editing, M.G.; visualization n/a; supervision, n/a.; project administration, n/a; funding acquisition, n/a.

Funding

This research received no external funding.

Conflicts of Interest

The authors declare no conflict of interest.

References

  1. Barkle, G.F.; Stenger, R.; Singleton, P.L.; Painter, D.J. Effect of regular irrigation with dairy farm effluent on soil organic matter and soil microbial mass. Aust. J. Soil Res. 2000, 38, 1087–1097. [Google Scholar] [CrossRef]
  2. USDA. Agricultural Waste Characteristics. In Agricultural Waste Management Field Handbook; United States Department of Agriculture, Natural Resource Conservation Service: Washington, DC, USA, 2008; pp. 4.1–4.14. [Google Scholar]
  3. Veltman, K.; Rotz, C.A.; Chase, L.; Cooper, J.; Ingraham, P.; Izaurralde, R.C.; Jones, C.D.; Gaillard, R.; Larson, R.A.; Ruark, M.; et al. A quantitative assessment of beneficial Management Practices to reduce carbon and reactive nitrogen footprints and phosphorous losses on dairy farms in the US Greal Lakes region. Agric. Syst. 2018, 166, 10–25. [Google Scholar] [CrossRef]
  4. Mateo-Sagasta, J.; Turral, H. Water pollution from agriculture. In More People, More Food, Worse Water? Mateo-Sagasta, J., Marjani Zadeh, S., Turral, H., Eds.; Food and Agriculture Organization of the United Nations and International Water Management Institute: Rome, Italy, 2018; pp. 93–102. [Google Scholar]
  5. Porter, J.C. Water Conservation and Use on Dairy and Livestock Farms. New Hampshire Extension. 2008, pp. 1–3. Available online: https://extension.unh.edu/resources/files/Resource000005_Rep4.pdf (accessed on 20 October 2018).
  6. Rengasamy, P. Soil processes affecting crop production in salt-affected soils. Funct. Plant Biol. 2010, 37, 613–620. [Google Scholar] [CrossRef]
  7. Tilbrook, J.; Roy, S. Salinity tolerance. In Plant Abiotic Stress, 2nd ed.; Jenks, M.A., Hasegawa, P.M., Eds.; Wiley-Blackwell: Hoboken, NJ, USA, 2014; pp. 133–161. ISBN 978-1-118-41217-6. [Google Scholar]
  8. Ali, I.; Morin, S.; Barrington, S.; Whalen, J.; Bonnell, R.; Martinez, J. Surface irrigation of dairy farm effluent, Part I: Nutrient and bacterial load. Biosyst. Eng. 2006, 95, 547–556. [Google Scholar] [CrossRef]
  9. Nennich, T.D.; Harrison, J.H.; VanWleringen, L.M.; Meyer, D.; Heinrichs, A.J.; Weiss, W.P.; St-Pierre, N.R.; Kincaid, R.L.; Davidson, D.L.; Block, E. Prediction of manure and nutrient excretion from dairy cattle. J. Dairy Sci. 2005, 88, 3721–3733. [Google Scholar] [CrossRef]
  10. Corwin, D.L.; Raza Ahmad, H. Spatio-temporal impacts of dairy lagoon water reuse on soil: Heavy metals and salinity. Environ. Sci.-Proc. Impacts 2015, 17, 1731–1748. [Google Scholar] [CrossRef] [PubMed]
  11. Hawke, R.M.; Summers, S.A. Effects of land application of farm dairy effluent on soil properties: A literature review. N. Z. J. Agric. Res. 2006, 49, 307–320. [Google Scholar] [CrossRef] [Green Version]
  12. Ravva, S.; Sarreal, C. Survival of Salmonella enterica in aerated and nonaerated wastewaters from dairy lagoons. Int. J. Environ. Res. Public Health 2014, 11, 11249–11260. [Google Scholar] [CrossRef] [PubMed]
  13. Dungan, R.S.; McKinney, C.W.; Leytem, A.B. Tracking antibiotic resistance genes in soil irrigated with dairy wastewater. Sci. Total Environ. 2018, 1477–1483. [Google Scholar] [CrossRef] [PubMed]
  14. Sukias, J.; Tanner, C. Ponds for livestock wastes. In Pond Treatment Technology; Shilton, A., Ed.; IWA Publishing: London, UK; International Water Association: London, UK, 2006; pp. 408–429. ISBN 9781843390206. [Google Scholar]
  15. Wichelns, D.; Quadir, M. Achieving sustainable irrigation requires effective management of salts, soil salinity, and shallow groundwater. Agric. Water Manag. 2015, 157, 31–38. [Google Scholar] [CrossRef]
  16. Liu, Y.; Haynes, R. Origin, nature, and treatment of effluents from dairy and meat processing factories and the effects of their irrigation on the quality of agricultural soils. Crit. Rev. Environ. Sci. Technol. 2011, 41, 1531–1599. [Google Scholar] [CrossRef]
  17. Hamoda, M.F.; Al-Awadi, S.M. Wastewater management in a dairy farm. Water Sci. Technol. 1996, 32, 1–11. [Google Scholar] [CrossRef]
  18. Gutiérrez, M.; Biagioni, R.N.; Alarcón-Herrera, M.T.; Rivas-Lucero, B.A. An overview of nitrate sources and operating processes in arid and semiarid aquifer systems. Sci. Total Environ. 2018, 624, 1513–1522. [Google Scholar] [CrossRef] [PubMed]
  19. Hairston, J.E. Animal Waste Management to Protect Water Quality: Land Application of Animal Wastes. Alabama Cooperative Extension System, ANR-790-4.6.4. 1995, pp. 1–5. Available online: www.aces.edi/pubs/docs/A/ANR-0790/WQ4.6.4.pdf (accessed on 20 October 2018).
  20. Mateo-Sagasta, J.; Albers, J. Salts. In More People, More Food, Worse Water? Mateo-Sagasta, J., Marjani Zadeh, S., Turral, H., Eds.; Food and Agriculture Organization of the United Nations and International Water Management Institute: Rome, Italy, 2018; pp. 93–98. [Google Scholar]
  21. Ayers, R.S.; Westcot, D.W. Water Quality for Agriculture; Irrigation and Drainage Paper; Food and Agriculture Organization of the United Nations (FAO): Rome, Italy, 1985; pp. 2.1–2.4.7. ISBN 92-5-102263-1. [Google Scholar]
  22. Cameron, K.C.; Di, H.J.; Anwar, M.R. The “critical” ESP value: Does it change with land application of dairy Factory effluent? N. Z. J. Agric. Res. 2003, 46, 147–154. [Google Scholar] [CrossRef]
  23. Gutiérrez, M.; Borrego, P. Water quality assessment of the Rio Conchos, Chihuahua, Mexico. Environ. Int. 1999, 25, 573–583. [Google Scholar] [CrossRef]
  24. González Villela, R.; Montero Martínez, M.J.; Santana Sepúlveda, J.S. La Cuenca del río Conchos: Una Mirada Desde las Ciencias Ante el Cambio Climático; Montero, M.J., Ibáñez, O.F., Eds.; Instituto Mexicano de Tecnología del Agua: Jiutepec, Mexico, 2017; pp. 109–156. ISBN 78-607-9368-90-0.
  25. Rivas-Lucero, B.A.; Segovia-Lerma, A.; Morales-Morales, H.A.; Hermosillo-Nieto, J.G.; Magaña-Magaña, J.E. Plan de Gestión Para el Desarrollo Sostenible de Explotaciones Lecheras de la Cuenca de Delicias; Tecnociencia Chihuahua: Chihuahua, Mexico, 2008; pp. 41–55. [Google Scholar]
  26. Causapé, J.; Quílez, D.; Aragués, R. Assessment of irrigation and environmental quality at the hydrological basin level II. Salt and nitrate loads in irrigation return flows. Agric. Water Manag. 2004, 70, 221–228. [Google Scholar] [CrossRef]
  27. Miyamoto, S.; Fenn, L.B.; Swietlik, D. Flow, Salts, and Trace Elements in the Rio Grande: A Review; Texas Agricultural Experiment Station, Texas Water Institute: College Station, TX, USA, 1995; pp. 1–30.
  28. Grismer, M.E. Leaching fraction, soil salinity, and drainage efficiency. Calif. Agric. 1990, 44, 24–26. [Google Scholar] [CrossRef]
  29. Kort, W. Climate Change Impacts on Agriculture in the Rio Grande River Basin. Center for Water Policy, University of Wisconsin-Madison. 2013, pp. 1–5. Available online: uwm.edu/centerforwaterpolicy/wp-content/uploads/sites/170/2013/10Rio-Grande_Agriculture_Final.pdf (accessed on 20 October 2018).
Figure 1. Location of large dairy farms within the Irrigation District 005 of northern Mexico.
Soilsystems 02 00061 g001
Figure 2. Electrical conductivity (EC) of Dairy farm effluents (DFE) (orange), well water (blue), and volume of DEF generated at each farm. The guideline EC value for irrigation purposes is 2.0 mS cm−1.
Soilsystems 02 00061 g002
Figure 3. Distribution of salt loads generated by large dairy farms within the Irrigation District 005.
Soilsystems 02 00061 g003
Table 1. Number of dairy cows and estimated wastewater and salt load produced in intensive operation farms. n/a = not available.
FarmNo. CowsWastewater 1000 m3 year−1Salt Load, tons year−1Ha. IrrigatedCrops
OnsiteAway
1795140.3288.411480Corn, alfalfa, soy beans
22776489.7584.18500Alfalfa, corn, triticale
31223215.8199.19750oats, corn
42067364.7189.825117n/a
528049.452.1213Alfalfa, corn
624142.531.71080Corn
723942.2345.1211Alfalfa, corn
8946166.9985.4n/an/an/a
9705124.4250.0436Corn, pecan
10620109.4201.8515Alfalfa, corn
1120,2303568.96514.8150350Pecan
122047361.12691.62.5350Alfalfa, corn, triticale, oats
13907160499.82.5400Alfalfa, corn, triticale, oats
142513443.31519.214181Oats, alfalfa, barley
154162734.22032.2n/an/an/a
16620109.4114.6n/an/an/a
171265223.2179.48360Wheat, oats, corn, alfalfa
18585103.293.9n/a360Alfalfa
1933058.258.7340Alfalfa
201023180.5272.48192Corn, alfalfa, pecan
21750132.3353.1n/an/an/a
2210618.753.1n/an/aAlfalfa, corn
232260398.7580.7n/an/an/a
242061363.6898.58n/aPecan
25688121.4140.8n/an/an/a
26720127.0113.0n/an/an/a
27836147.5313.92n/an/a
2825044.150.3n/an/an/a
2928650.5n/an/an/an/a
3026747.1n/a14n/a
3122038.8n/a230Alfalfa, corn

