Abstract
Soils are an important carbonyl sulphide (COS) sink. However, they can also act as sources of COS to the atmosphere. Here we demonstrate that variability in the soil COS sink and source strength is strongly linked to the available soil inorganic nitrogen (N) content across a diverse range of biomes in Europe. We revealed in controlled laboratory experiments that a one-off addition of ammonium nitrate systematically decreased the COS uptake rate whilst simultaneously increasing the COS production rate of soils from boreal and temperate sites in Europe. Furthermore, we found strong links between variations in the two gross COS fluxes, microbial biomass, and nitrate and ammonium contents, providing new insights into the mechanisms involved. Our findings provide evidence for how the soil–atmosphere exchange of COS is likely to vary spatially and temporally, a necessary step for constraining the role of soils and land use in the COS mass budget.
Keywords:
COS production; COS uptake; Carbonic anhydrase; nitrate; ammonium; sulfur; microbial community 1. Introduction
Carbonyl sulphide (COS) is the most abundant sulphur gas in the atmosphere [1,2]. Recent interest in the seasonal and spatial variability of atmospheric COS has intensified its use as an atmospheric tracer of global primary productivity [3,4,5,6]. Indeed, the enzyme carbonic anhydrase (CA), present in plants, catalyses both the hydration of CO2 and the hydrolysis of COS during leaf gas exchange [3,7,8,9]. Because CO2 hydration is the first step of photosynthesis, this COS hydrolysis by plants is expected to be proportional to the plant gross primary productivity [5,6,10]. The terrestrial biosphere is estimated to be a strong sink of COS, with around 0.24–1.4 TgS year−1 being taken up by plants [6,11,12,13]. Because soil micro-organisms also contain the enzyme CA [14,15,16,17], oxic soils have been estimated to take up a further 0.13–0.5 TgS year−1 from the atmosphere [6,11,12,13]. These estimates, however, are based on soil COS flux datasets that are restricted to just a few studies that are focused on certain biomes and land use management. To address this problem in spatial representation, new datasets covering a large range of biomes have been collected, leading to clearer spatial patterns of soil COS fluxes at continental scales [18,19,20,21]. In particular, agricultural soils have been shown to be strong net emitters of COS [19,20,21,22,23], and consequently their behaviour is now being described differently from natural soils within global COS budgets [6]. These new recent datasets also helped explain why some oxic soils have shifted from being COS sinks to COS sources, and how the magnitude of the COS production and uptake varied with soil types [20,21,23], but they also emphasised that the uncertainty on the contribution of soils in atmospheric COS budgets had been largely underestimated.
Thanks to advances made in the partitioning of soil COS uptake and production rates [20,21,23,24], it is now possible to study the drivers of these two opposite fluxes in isolation. It is known that temperature and moisture are important drivers, and that they can partially explain the observed spatial and temporal variability in soil COS uptake [24,25]. Theoretical considerations have hypothesized that CA concentration and the associated gross COS uptake were proportional to the size of the microbial community estimated from measurements of microbial biomass [24]. This hypothesis is supported by recent findings on a range of soils sampled across Europe [21]. In the case of COS production, the drivers are still under hot debate [10], with contrasting evidence supporting either the abiotic degradation of COS precursors, such as S-containing amino acids [19,20,26,27] and/or biotic [19,21] mechanisms leading to COS production. In the latter case, the microbial decomposition of organic sulphur compounds are known to produce COS through different metabolic pathways, including the oxidation of carbon disulphide, thiosulfate [28,29], thiocyanate (SCN−; [30]), and isothiocyanate [31]. In addition many of these pathways are linked to nitrogen cycling in soils. For example, some of these pathways use nitrate and produce ammonium, whilst SCN− and isothiocyanate are also known to be inhibitors of nitrification [32,33,34] and CA [35]. Interestingly, a recent finding to emerge from a meta-analysis of European soils indicates that soil N content and mean annual precipitation are the strongest spatial predictors of COS production rates across ecosystems [21], reinforcing the idea that a temperature sensitive coupling between nitrogen and sulphur transformation in soils is driving the magnitude of COS production from soils.
This study set out to test whether the spatial pattern of COS production and consumption observed across land use and biomes was related to the total inorganic N content of soils, and whether this result could be replicated in a laboratory manipulation using N fertiliser. Based on our previous findings, we hypothesised that, by increasing the inorganic N content of soils, COS production would become an increasingly larger contribution to the net soil COS flux. We also hypothesised that available inorganic N would be positively correlated to the rate of COS production and the net COS flux. Finally, because it is also known that NO3− can bind to the active site of CA and cause a reduction in CA activity in a range of organisms [36,37,38], we also hypothesised that N fertilisation would reduce the soil COS hydrolysis rate.
2. Materials and Methods
2.1. Soil Microcosm Gas Exchange
To test these hypotheses, we collected the first 10 centimetres of soil from 27 different locations encompassing a range of biomes and land uses within Europe during the summer of 2016 (Table S1). Re-packed soil microcosms for each site (n = 3) consisting of 200–300 g of well-mixed sieved dry soil were incubated in 850 mL glass jars under controlled conditions for two weeks at 23 °C, and 30% of maximum water holding capacity (additional details in Kaisermann et al. [21]).
After two weeks, net COS fluxes were measured at three atmospheric COS concentrations (1111 ± 29 ppt, 557 ± 10 ppt or 124 ± 8 ppt) in order to partition the COS uptake and production, following the method described in [21]. Briefly, each microcosm was sealed with a gas-tight glass cap equipped with two stainless steel fittings to connect to the inlet and outlet lines of the measurement system. Dry synthetic air was adjusted to the desired COS mixing ratios, and the inlet and outlet airstreams of each microcosm were analysed sequentially using a mid-infrared quantum cascade laser spectrometer (QCLS, Aerodyne Research Inc., Billerica, MA, USA). The net COS flux can be estimated as:
where u (m3 s−1) is the volumetric flow of air through the microcosm, S (m2) is the soil surface area inside the microcosm, and Cin and Ca (pmol mol−1) are the COS mixing ratios in the inlet and outlet lines of the microcosm. Because the air space inside the microcosm is assumed to be well-mixed, Ca is also considered as the COS mixing ratio above the soil surface.
On a theoretical point of view, the net COS flux from the soil can also be written as:
where F0 (pmol m−2 s−1) is the gross flux of COS production; i.e., the flux F when Ca = 0, and Vd0 (m s−1) is the COS deposition velocity onto the soil surface that would occur in the absence of COS production (i.e., if F0 = 0). The gross flux of COS uptake is calculated by subtracting F0 from the net COS flux F.
From Equation (2), Kaisermann et al. [21] showed that by performing steady-state COS flux measurements (F) at different COS concentrations (Ca), it is possible to estimate simultaneously Vd0 and F0 from the slope and the intercept of a 3-point linear regression between the two variables, leading to the determination of F0 and Vd0. These two variables can further be expressed in terms of a first-order COS hydrolysis rate (k, s−1), a COS diffusivity across the soil matrix (D, m2 s−1), and a COS production rate (P, pmol m−3 s−1) [21,24]:
where ρb (kg m−3) is soil bulk density, B (m3 m−3) denotes the temperature-dependent COS solubility in water [39], θ (m3 m−3) is the volumetric soil water content, and zmax (m) is the depth of the soil microcosm. The COS effective diffusivity D is estimated using the empirical formulation of [40] for repacked soils. Then, the value of k that satisfies Equation (3b) is obtained using an iterative numerical method (fzero function in the Pracma Package; Brochers, 2017). Finally, this k value is introduced into Equation (3a) to estimate P from F0.
2.2. Soil Physico-Chemical Properties Analysis
At the end of each gas exchange measurement, the soils were analysed for a range of physico-chemical properties. Microbial biomass for carbon (MBC) and nitrogen (MBN) were estimated as the difference of dissolved C and N contents between fumigated (24 h of chloroform fumigation) and non-fumigated soil extracts consisting of 10 g of soil mixed with 40 mL of 0.5 M of K2SO4 and shaken for 30 min). We also measured water extractable carbon (DOC) and nitrogen (DN) in these extracts. We assessed dissolved inorganic N (NH4+ and NO3−) in extracts consisting of 10 g of dry soil mixed with 50 mL of KCl 1 M and shaken for 1 hr. All these measurements were performed using standard procedures at INRA (https://www6.hautsdefrance.inra.fr/las).
2.3. Soil Nitrogen Fertilisation Manipulation
A selection of nine out of the 27 soils measured in the previous experiment were selected to determine the response of soil N addition on COS flux rates (Table S1). For each site, a set of three microcosms containing ambient N levels (no N added) and three microcosms fertilised with 5 mg N in the form of NH4NO3, (equivalent to adding 125 g N m−2 to a 50 cm soil profile as in Ramirez et al. [41]) were prepared and incubated for two weeks under the same conditions as described above. During gas exchange measurement runs, each site and treatment were always completed on paired microcosms, and a blank microcosm was always included to check that no artefact from the chamber materials occurred.
2.4. Statistical Analysis
All data processing and graphs were performed using the R software (Version 3.3.3; R core Team, 2015). For all linear mixed effect models, visual inspection of the residual plots did not reveal any obvious deviations from homoscedasticity or normality. To avoid pseudo-replication in linear models and analysis of variance (ANOVA) tests, we averaged the three replicates by site and used the mean as the response or explanatory variables.
Then, we investigated the relative importance of each soil property in explaining the three COS flux variables (the net COS flux F, the COS production rate P and the COS hydrolysis rate k) across the 27 European soils using linear mixed effect models with maximum likelihood estimations (lme function of R package nlme, [42]), taking replicate measurements as random effects and soil properties as fixed effects. Prior to that, all soil data were standardised with z-score transformations to avoid the excessive influence of magnitude differences between scales. In addition, the normality of each variable was tested using the quantile–quantile plot and Shapiro–Wilk test, and the Box–Cox power transformation was used to select the appropriate transformation prior to analysis [43]. First, we evaluated the goodness of models’ fit for every single soil property (Table S2). To that end, the explanatory power of each soil properties for the three COS fluxes was measured with the marginal R2 value, and the significance of correlations was tested with an analysis of variance [44]. Then, we used a multimodel inference approach with the MuMIn package [45] to test all possible combinations of the predictive models. As we had a total of 81 samples, we included a maximum of four predictors in the models. We used the Akaike’s Information Criterion corrected for small sample size (AICc) to estimate the statistical likelihood of each model, and ranked the models using the ‘dredge’ command in the MuMIn package. The AIC is used to estimate the relative amount of information that was lost for a given statistical model, in order to compare a range of model choices, and to select the model that minimizes information loss. Presented with a choice of different models, that with the lowest AIC value would be the preferred model. The null models were lme without predictors. Following Murtaugh [46], two models with a delta AICc of less than 2 were considered to be statistically equivalent. When multiple equally feasible models were found in the candidate models tested, we used model averaging to produce the averaged parameter estimates (average R2 value), and the relative importance of each predictor was reported. When two predictors were strongly correlated (correlation coefficient greater than 0.8), only the one generating the lowest AICc was retained in the final best model [43,45].
We performed analysis of covariance (ANCOVA) to test if the slopes of the linear models describing the COS hydrolysis rate (k) as a function of microbial biomass C were significantly different, depending on the nitrate content and pH. First we performed an ANCOVA with the three groups depending on the nitrate content and pH, then we performed a further ANCOVA to compare the groups two-by-two.
The effect of ammono-nitrate addition was estimated as the percentage difference of the COS fluxes and soil parameters between each treatment and their control.
3. Results
3.1. Variations in Soil COS Fluxes with Inorganic Nitrogen across Europe
Our results from 27 sampling sites showed that the net COS flux became less negative when soil inorganic N content (i.e., NH4+ and NO3−) increased across European soils (Figure 1a and Table S2), in support of our first hypothesis. Generally, the weakest net sinks for COS were predominantly found in NO3−-rich soils also containing high concentrations of NH4+ (Figure 2a). Partitioning of the net COS fluxes into gross COS production (P) and hydrolysis rate (k) indicated a good correlation between P and k, with all soil properties related to N (Table S2). Results showed that the increase in soil inorganic N content simultaneously increased the COS production (Figure 1b and Figure 2b), whilst at the same time, it decreased the capacity of soil to hydrolyse COS (Figure 1c and Figure 2c).
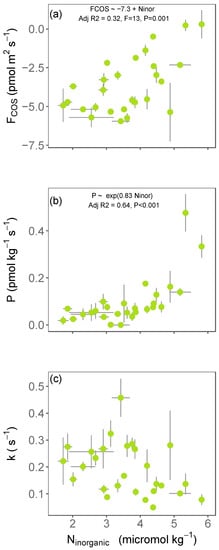
Figure 1.
Variations in the (a) net carbonyl sulphide (COS) flux, (b) the COS production rate (P), and (c) COS hydrolysis rate (k) with soil inorganic N content (NO3− and NH4+ contents, expressed in log) across the 27 soils in Europe. Each point represents the mean flux ± standard deviation for each soil (n = 3). Best statistical models were found comparing the adjusted R2 and the Akaike’s Information Criterion (AIC) of each models with the easynls package [47].
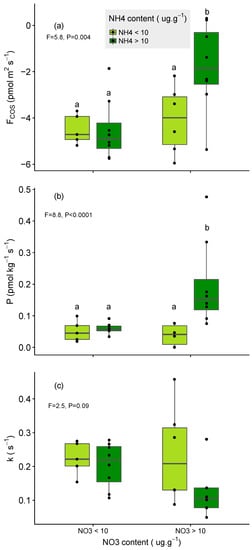
Figure 2.
Variations in the (a) net COS flux, (b) the COS production rate (P), and (c) the COS hydrolysis rate (k) with soil nitrate (NO3−) and ammonium (NH4+) contents across 27 soils in Europe. The two levels of NO3− and NH4+ content are below and above 10 μg g−1 of N–NO3− and N–NH4+ respectively. Each black point represents the replicate means (n = 3) for one soil. Letters represents results of TukeyHSD test when analysis of variance (ANOVA) was significant.
The best model explaining COS production across European soils included NO3− content, pH, and their interaction (Table 1). In particular, we observed an increase in COS production with an increase in NO3− content, but modulated by pH, as alkaline soils always had low COS production (Figure 3a). However alkaline soils are highly correlated with very low NH4+ content; consequently, four of the six alkaline soils were very limited by NH4+ content, and therefore we cannot exclude an NH4+ content effect at a high nitrate content for COS production. The best model explaining the COS hydrolysis rate equally included microbial biomass C (and its co-linear microbial biomass N), NO3− content, and pH (Table 1). Results showed that the COS hydrolysis rate constant k increased linearly with microbial biomass C, but exhibited different slopes or intercepts that were dependent on the soil NO3− contents and pH (Figure 3b, Table S3). The hydrolysis rates were larger on soils with low NO3− content than those with high NO3− content, while for soils with high NO3− content, the hydrolysis rates were larger on alkaline soils than on acidic soils.

Table 1.
Final model statistics explaining the net COS fluxes (F), the COS production (P), and the COS hydrolysis rate (k) across 27 European soils using linear mixed effect models with a maximum likelihood estimation. Bold numbers indicate p-value < 0.05.
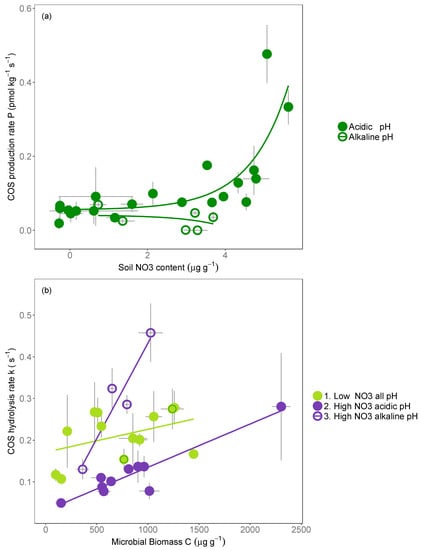
Figure 3.
Plots of the best model explaining (a) the COS production (P) and (b) the COS hydrolysis rate constant (k) measured at 23 °C on 27 European soils. Each point represents the mean ± standard deviation for each soil (n = 3). Dark-green circles represent the two alkaline soils with low nitrate content. MBC represents the microbial biomass C, and NO3 is the soil N–NO3− content (in log). The grey areas indicate the 85% confidence intervals for the exponential (a) and linear (b) models. Low (respectively High) NO3− contents correspond to concentrations below (respectively above) 10 μg g−1 of N–NO3−. Acidic (respectively alkaline) pH corresponds to pH below (respectively above) 7. Linear model coefficients and statistical analysis are presented in Table S3.
3.2. Impact of N Fertilisation on Partitioned Soil COS Fluxes
A few soils collected from sites with long-term field manipulations of N inputs (Rosinedal, a boreal forest soil and Laqueuille, a grazed grassland) consistently showed higher COS production rates and lower COS consumption rates in the field-fertilised plots (Figure 4a–c). The interaction between soil N inorganic content and COS flux rates were further tested in the laboratory by incubating a subset of nine European soils with a single ammono-nitrate addition (corresponding to an extra 125 gN m−2). This experiment clearly indicated that the one-off addition of N fertiliser on soils systematically decreased the net COS sink strength of soils (Figure 4d), increased the production of COS (Figure 4e), and decreased the capacity of soils to take up COS (Figure 4f). Future studies tracking the temporal response of partitioned COS fluxes to N would be desirable to evaluate the amplitude and the duration of this COS and N interaction.
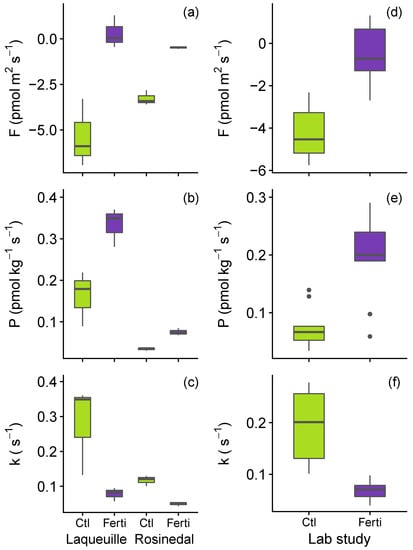
Figure 4.
Effect of N fertilization (ANOVA p-value < 0.05) at two field sites (Laqueuille and Rosinedal, n = 3) and in the lab study across nine soils (addition of ammono-nitrate, n = 27) in the (a,d) net COS flux (F); (b,e) the COS production rate (P) and (c,f) COS hydrolysis rate (k).
For both COS production and hydrolysis rate, the relative changes with the N addition depended on the initial inorganic N content of the soil prior to fertilisation, and they were often linked to a loss of microbial biomass C (Figure 5a,b). The effect of fertilisation on the component COS fluxes was strongest when the decrease in biomass was strongest. However, this was clearly not the case for the boreal soil from the Rosinedal site, which in contrast, displayed an increase in microbial biomass C alongside a relatively strong decrease in the hydrolysis rate, but a relatively small increase in the COS production rate when fertilised (Figure 5a,b). In general, the relative changes in the COS production and hydrolysis rates were:
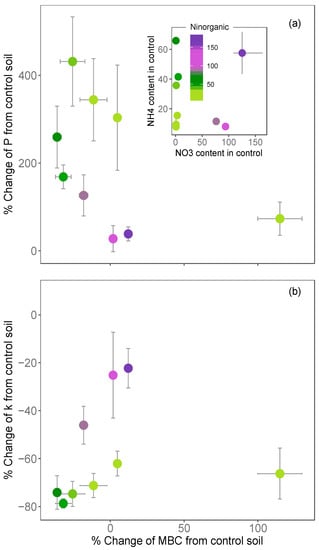
Figure 5.
Relationships between the percentage change in (a) COS production P and (b) COS hydrolysis rate k and the percentage change in microbial biomass C following ammono-nitrate addition. Each point represents the mean ± standard deviation for each soil type (n = 3). The colour represents the total N inorganic content (Ninorganic, in μg g−1) before N addition (i.e., in the control soils), that is the sum of the nitrate (NO3−) and ammonium (NH4+) contents (see inset subplot in (a)).
- larger for soils that were poor in NO3− relative to those rich in NO3− (for the same level of NH4+);
- larger for soils that were poor in NH4+ relative to those rich in NH4+ (for the same level of NO3−) and;
- limited in soil that were initially rich in both NH4+ and NO3− (Figure 5a,b).
4. Discussion
Overall, for the three different scales in our study (field sampling, field fertilisation, and lab fertilisation), we demonstrated that high total inorganic N levels consistently reduced the net COS sink capacity of soils. This is also consistent with the study of Melillo and Steudler [26], who reported a significant shift in net COS fluxes after nitrate additions, resulting in COS emissions to the atmosphere in two forest soils within a Harvard forest. In contrast, a study by Simmons et al. [48] on boreal forest soils showed that N fertilisation could also result in an increase of the soil net COS uptake rate. However, because gas exchange measurements were performed nearly 16 months after the N fertilisation, it is not entirely clear whether the legacy effect of N additions would be apparent after such a long period, as substantial turnovers and losses of N fertilisers may have occurred over this period, through leaching and the reduction of nitrate.
4.1. Mechanisms Inhibiting the COS Hydrolysis Rate
Currently, the gross uptake of COS in soil is hypothesised to be driven by the enzyme family of carbonic anhydrases and other homologous enzymes (e.g., COS hydrolase [49] and CS2 hydrolase [29]). This hypothesis has recently attained some gravity from a novel metatranscriptome analysis on seven soils outside Europe measured under similar climatic conditions to those made in this study [23]. Meredith et al. (2018b) showed that the putative CA activity of COS was correlated with the presence of β-CA genes (clade D), the dominant class of CA found in all the sampled soils. They also found that CA activity was strongly correlated with soil total N content and C:N ratio, consistent with this study and others [21,50]. In this context, laboratory experiments have previously revealed that the activity of CA in a range of different organisms (stripped Commelina communis leaves [37], humans [36], fungi [51], methanoarchaeon [52], and insects such as mosquitos [38]) becomes inhibited as NO3− concentration increases. This is because anions such as nitrate can bind to the active site of CA, and thus inhibit the rate of CO2 hydration [53]. Our results from the field sampled soils support the hypothesis that the NO3− applied in the form of ammono-nitrate may have inhibited COS hydrolysis in a similar manner to that of CO2 in the above studies.
Although the inhibition of COS hydrolysis by nitrate content in the 27 field-sampled soils was significant, a major factor influencing the COS hydrolysis rate was also microbial biomass C (and its co-linear microbial biomass N (Table S3)). Soils with high microbial biomass contents generally exhibited higher CA activities (Figure 3b). This was further supported with the results of the lab fertilisation experiment that showed that when the COS hydrolysis rate was systematically reduced by N fertilisation (Figure 4f), especially in soils initially poor in nitrates (Figure 5b), the soils also exhibited a decrease in microbial biomass C (and its co-linear microbial biomass N (data not shown)) content (Figure 5b). This result supports the current assumption in soil COS uptake models that the concentration of CA in soils is approximately proportional to microbial biomass [24]. However, it is worth noting that the boreal soil from the Rosinedal site appears to be an exception to this trend, as it exhibited an increase in microbial biomass upon fertilisation. The reason for this behaviour is unclear, but this soil was the poorest in inorganic N and it was characterised by the lowest microbial biomass and total soil N content of all the sites (Table S1). In addition, the absolute changes in microbial biomass were very small, and they may be within the measurement error of the fumigation method used. Overall this outlier may indicate that further studies are required on very low microbial biomass soils to establish the impact of N fertilisation on community size and structure. However, from studies already published, nitrogen fertilisation has been shown to reduce the amount of microbial biomass [41,54], and especially the relative abundance of mycorrhizal fungi and methanogenic archaea [55], as well as extracellular enzyme activities [41]. In this context, recent studies have also demonstrated that fungal communities can be important drivers of net soil COS fluxes [20,23,56,57,58]. In particular, Sauze et al. [58] showed that decreases in soil fungal abundance correlated significantly with a decrease in the net uptake of COS. Therefore, any decrease in fungal abundance caused by an increase in soil N content would also be consistent with the observed reduction in COS hydrolysis rates in this study. To summarise, N fertilisation had a direct negative effect on CA enzyme activity, and an indirect negative effect on the amount of CA in the soil caused by a general reduction in the size of the microbial community (biomass) and putatively community diversity (loss of fungi) upon N fertilisation.
Finally our study highlighted that it may also be important to account for pH when trying to explain the impact of N fertilisation on the variation of COS hydrolysis (Figure 2b). We found that the four alkaline soils that were rich in NO3− exhibited higher hydrolysis rates than nitrate-rich acidic soils (Figure 2b). This suggests that additional mechanisms linked to soil pH must be involved. It has been known that CA activity, at least with regard to CO2 hydration, is often reduced in acidic buffer solutions, as the presence of protons in the solution slows down the re-activation of the active site [59], and also modifies the molecular structure of CA [60,61]. However, most micro-organisms have the ability to buffer their internal pH to a value that is close to neutral [62], so that soil pH should affect only marginally CA-catalysed COS uptake rates. Another possibility is that, for the same amount of microbial biomass, CA requirements are higher in alkaline environments, thus explaining the higher COS hydrolysis rate constants. More detailed kinetic studies on the COS hydrolysis response of different CAs to soil pH alongside comparative metatranscriptomic studies investigating the community differences in CA gene diversity and abundance between low and high pH soils across different N treatments would be needed to provide detailed answers on the interplay between microbial biomass, soil pH, and N content. Future genomic studies investigating the variability in soil community composition may also provide insights on whether particular microbial networks or ‘keystone’ organisms regulate the soil–atmosphere exchange of COS. For example, Meredith et al. [23] recently showed that Actinobacteria, and in particular, Mycobacteria were highly correlated with the CA activity derived from both CO2 and COS gas exchange measurements. Altogether, our results already indicate a promising opportunity to predict COS hydrolysis rates from easily measured soil properties, including microbial biomass, soil total N, and NO3− content and pH.
4.2. COS Production Is Most Closely Linked to Soil Nitrate Availability
Our study demonstrated that variations in soil inorganic N content were positively correlated with COS production rates at the European scale, between field plots at the same site, and between microcosms manipulated in the lab. We previously showed that the variability of COS production was well correlated with total soil N content [21]. In this study, we demonstrated that the labile fraction of N, i.e., NO3−, and NH4+, was strongly related to COS production. First, we observed an increase in COS production with an increase in NO3− content across European soils (Figure 3a), but modulated by pH and/or NH4+ content, as the effect was significant only at acidic pH (Figure 3a) and high NH4+ content (Figure 2). In addition, our lab study also suggested that NO3− was the dominant N species affecting COS production rate: the relative change in the COS production was strongly dependent on the initial N status of the soil prior to fertilisation (Figure 5a), with soils with low initial NO3− content responding relatively stronger to the same amount of N addition than those soils already containing high NO3− contents before fertilisation. This is consistent with the studies described above showing that soils became large COS emitters with N fertilisation [26]. This may also help to interpret why agricultural soils might be more likely to emit COS to the atmosphere [19,20,22,23,57].
4.3. Mechanisms Promoting the Production of COS
Currently, an intriguing debate exists on the mechanism(s) underlying the production of COS in oxic soils [10]. At 23 °C, the magnitude of soil COS production is relatively small, compared to the rate of COS uptake observed for the same soil [21]. However, COS production is also more responsive to an increase in temperature than COS uptake [19,21]. Thus, in soils that experience relatively high surface temperatures, such as those in the Mediterranean regions, COS emissions could rapidly shift soils from being net COS sinks to sources during hot summer months, especially as the rate of COS production in soils was recently shown to be invariable to soil moisture status [21], and it may also increase with light [20,27,58,63]. We add to this debate by showing clearly that the rate of COS production is also dependent on the soil NO3− and/or NH4+ content.
Unfortunately, our study was not designed to test specifically whether the exact mechanism driving COS production was abiotic or biotic. Nonetheless, our study does indicate a strong coupling between N and S cycling that might provide some insights on the two main mechanisms that have been recently proposed [10,20]. The first of these mechanisms involves the abiotic or biotic degradation of organic sulphur compounds, in particular, the S-containing amino acids cysteine and methionine, and to a lesser extent, the biomolecule glutathione, which have been identified previously as COS precursors (see Table 1 of Meredith et al. [20] for a review). The amino acids cysteine and methionine are also known to represent a large fraction of the total soil S pool, at around 11–31% [64].
Using a novel metatranscriptomics approach, Meredith et al. [20] showed that variations in the COS production rate across a range of soils was strongly correlated to the number of cysteine and methionine synthesis genes present in the soils. In order to reconcile this with our study, we would need to hypothesise that the potential amount of amino acids synthesised in the soil community would be dependent on the amount of available inorganic N. This is plausible because microbial biomass S is directly related to microbial biomass C and total soil organic S [65]. Thus, in moist active soils with more inorganic N, this would potentially lead to an increased pool of total and S-containing amino acids, and subsequently COS precursors that would form the source of either abiotic or biotic COS production. This hypothesis would be entirely consistent with our observations that COS emissions increased with increasing inorganic N content. Future studies should be designed to test this hypothesis directly, and to determine how the size of this precursor pool changes with N additions.
Microbial decomposition of organic sulfur compounds can also produce COS through a range of different metabolic pathways, including the oxidation of carbon disulphide and thiosulfate [28,29], thiocyanate (SCN−; [30]), and isothiocyanate [31]. Currently, the SCN− pathway is the most popular hypothesis, as it has been demonstrated in a number of different microorganisms [30,66,67,68,69,70]. In addition, Kelly et al. [71] showed that bacteria oxidising SCN− can use NO3− as an oxidant for their N supply, whilst Broman et al. [72] further demonstrated that the consumption of SCN− was correlated to NO3− consumption in continuous culture bioreactors. This finding may indicate that the removal of NO3− limitation (with N fertilisation) in N poor soils might lead to the use of SCN−. Although NO3− is used by many different members of the soil microbial community for processes related exclusively to the N cycle, Kraft et al. [73] showed that a significant portion (25%) of NO3− respired in marine microbial communities comes from “cryptic” sulfur cycling. In addition, several bacteria exhibiting significant ecological connections between the C, N, and S cycles that can use SCN− for providing S and N to the cell have been identified. For example, Tv. Thiocyanodenitrificans is capable of growth by denitrification with either thiosulfate or SCN− [74]. Conversely, Thiohalophilus thiocyanoxidans oxidise SCN− and produce COS [66], and are additionally capable of assimilatory nitrate reduction [67]. Further support for COS production from SCN− comes from the study of Kantor et al. [69], who demonstrated in bioreactors that microbial communities were able to degrade SCN− while expressing genes for ammonium oxidation and denitrification. Furthermore, Berben et al. [75] recently showed that Tv. Thiocyanodenitrificans contains genes that code for SCN− dehydrogenase in addition to the genes necessary for denitrification. Taken together, this evidence indicates that the oxidation of SCN− (and therefore the production of COS) and reduction of assimilatory NO3− can be potentially realised by the same soil microorganisms. This is supported by the results of Behrendt et al. [76], showing co-variations in the abundance of soil community genes related to N cycling with net COS flux. Therefore, in soils with low NO3− contents, the conversion of SCN− to COS could be limited by NO3− availability, and this could help to explain why the production of COS is low when NO3− concentrations are low, and high in nitrate-rich soils, as observed in our experiments when NH4+ concentrations are similar. Thus, based on our results, we could hypothesise that the production of soil COS depends on the ratio of NO3− to SCN−. Future studies combining comparative meta-genomic and -transcriptomic analyses across gradients of soil inorganic N content and COS production will be able to test this hypothesis by exploring whether shifts in the abundances of certain taxa identified above are found, and whether the ratio of genes identified for SCN− oxidation and nitrate reduction also vary in soil communities. The first steps in using such an approach were recently made by Meredith et al. [20] to obtain insights on the production rates of COS and genes for S cycling, with results lending support for the abiotic degradation of S-containing amino acids. This does not necessarily exclude the production of COS from SCN−, as this precursor can also be produced through the transformation of S-containing amino acids [77]. For example, cyanide ions can react with cysteine in Bacillus megaterium to yield SCN− [77], and also cyanide produced in vivo can be converted in part to SCN− by sulfurtransferase systems present in several microorganisms, including the same organisms that are capable of SCN-oxidation to produce COS [77,78,79]. Thus, as hypothesised above, an increase in amino acids with N leading to a larger pool of precursors of COS, including SCN−, would be compatible with our results.
5. Conclusions
In conclusion, our study reveals a strong and consistent relationship between soil COS exchange and soil nitrogen status. Such fertilisation-induced changes in soil gross COS fluxes are currently not implemented in COS modelling efforts at the global scale [6,12]. However, the most recent model inversions recognised that the production of COS by agricultural soils should be accounted for explicitly, although it remained unclear as to why agricultural soils behaved differently from previous studies. Our analysis provides empirical evidence that the important role of N status across soils requires assimilation into the next generation of global COS models. However, capturing the impact of point-source N fertilisation events will prove to be a modelling challenge for capturing its impact on the atmosphere. Finally, it is highly likely that increased fertilisation over the past century has reduced the capacity of some soils to take up atmospheric COS. Nonetheless, the results from this study, combined with further recent publications in this field, have increased our understanding of how COS fluxes vary across space, and how they should facilitate more robust predictions of the exchange of COS between soils and the atmosphere, leading to more robust predictions of global primary productivity using the variability of COS in the atmosphere.
Supplementary Materials
The following are available online at http://www.mdpi.com/2571-8789/2/4/62/s1. Table S1: Characteristics of sites sampled for soil gas exchange. Table S2: Explanatory power of each soil properties for the three COS fluxes across the 27 European soils. Table S3: Statistical analysis to test if the slopes are significantly different on Figure 3b.
Author Contributions
Conceptualization, A.K., L.W. and S.P.J.; Methodology, A.K., L.W. and J.O.; Software, S.W.; Validation, A.K., S.P.J., S.W. and L.W.; Formal Analysis, A.K.; Investigation, A.K. and S.P.J.; Resources, A.K., S.P.J. and L.W.; Data Curation, A.K.; Writing—Original Draft Preparation, A.K. and L.W.; Writing—Review & Editing, S.P.J. and J.O.; Visualization, A.K.; Supervision, L.W.; Project Administration, L.W.; Funding Acquisition, L.W. and J.O.
Funding
This project has received research funding from the European Research Council (ERC) under the European Union’s Seventh Framework Programme (FP7/2007-2013) grant agreement No. 338264, awarded to L.W., and the Agence Nationale de la Recherche (ANR) grant number ANR-13-BS06-0005-01 awarded to J.O.
Acknowledgments
We are grateful to all of the scientific teams across Europe and Israel that provided their valuable time to collect soils from their local experimental sites for this study, especially Jorge Curiel-Yuste, Alexandria Correia, Jean-Marc Ourcival, Jukka Pumpanen, Huizhong Zhang, Carmen Emmel, Nina Buchmann, Sabina Keller, Irene Lehner, Anders Lindroth, Andreas Ibrom, Jens Schaarup Sorensen, Dan Yakir, Fulin Yang, Michal Heliasz, Susanne Burri, Penelope Serrano Ortiz, Maria Rosario Moya Jimenez, Jose Luis Vicente, Holger Tulp, Per Marklund, John Marshall, Nils Henriksson, Raquel Lobo de Vale, Lukas Siebicke, Bernard Longdoz, Pascal Courtois, Katja Klumpp. We also would like to thank Nicolas Fanin for the discussion.
Conflicts of Interest
The authors declare no conflict of interest.
References
- Crutzen, P.J. The Possible Importance of CSO for the Sulfate Layer of the Stratosphere. Geophys. Res. Lett. 1976, 3, 73–76. [Google Scholar] [CrossRef]
- Andreae, M.O.; Crutzen, P. Atmospheric Aerosol: Biogeochemical Sources and Role in Atmospheric Chemistry. Science 1997, 276, 1052–11058. [Google Scholar] [CrossRef]
- Sandoval-Soto, L.; Stanimirov, M.; von Hobe, M.; Schmitt, V.; Valdes, J.; Wild, A.; Kesselmeier, J. Global Uptake of Carbonyl Sulfide (COS) by Terrestrial Vegetation: Estimates Corrected by Deposition Velocities Normalized to the Uptake of Carbon Dioxide (CO2). Biogeosci. Discuss. 2005, 2, 183–201. [Google Scholar] [CrossRef]
- Montzka, S.A.; Calvert, P.; Hall, B.D.; Elkins, J.W.; Conway, T.J.; Tans, P.P.; Sweeney, C.S. On the Global Distribution, Seasonality, and Budget of Atmospheric Carbonyl Sulfide (COS) and Some Similarities to CO2. J. Geophys. Res. Atmos. 2007, 112, 1–15. [Google Scholar] [CrossRef]
- Liuzzi, G.; Masiello, G.; Serio, C.; Venafra, S.; Camy-Peyret, C. Physical inversion of the full IASI spectra: Assessment of atmospheric parameters retrievals, consistency of spectroscopy and forward modelling. J. Quant. Spectrosc. Radiat. 2016, 182, 128–157. [Google Scholar] [CrossRef]
- Campbell, J.E.; Berry, J.A.; Seibt, U.; Smith, S.J.; Montzka, S.A.; Launois, T.; Belviso, S.; Bopp, L.; Laine, M. Large Historical Growth in Global Terrestrial Gross Primary Production. Nature 2017, 544, 84–87. [Google Scholar] [CrossRef] [PubMed]
- Protoschill-Krebs, G.; Kesselmeier, J. Enzymatic Pathways for the Metabolization of Carbonyl Suphide (COS) by Higher Plants. Bot. Acta 1992, 105, 206–212. [Google Scholar] [CrossRef]
- Protoschill-Krebs, G.; Wilhelm, C.; Kesselmeier, J. Consumption of Carbonyl Sulphide (COS) by Higher Plant Carbonic Anhydrase (CA). Atmos. Environ. 1996, 30, 3151–3156. [Google Scholar] [CrossRef]
- Stimler, K.; Berry, J.A.; Yakir, D. Effects of Carbonyl Sulfide and Carbonic Anhydrase on Stomatal Conductance. Plant Physiol. 2012, 158, 524–530. [Google Scholar] [CrossRef] [PubMed]
- Whelan, M.E.; Lennartz, S.T.; Gimeno, T.E.; Wehr, R.; Wohlfahrt, G.; Wang, Y.; Kooijmans, L.M.J.; Hilton, T.W.; Belviso, S.; Peylin, P.; et al. Reviews and Syntheses: Carbonyl Sulfide as a Multi-Scale Tracer for Carbon and Water Cycles. Biogeosciences 2018, 15, 3625–3657. [Google Scholar] [CrossRef]
- Kettle, A.J.; Kuhn, U.; Von Hobe, M.; Kesselmeier, J.; Andreae, M.O. Global Budget of Atmospheric Carbonyl Sulfide: Temporal and Spatial Variations of the Dominant Sources and Sinks. J. Geophys. Res. Atmos. 2002, 107, 1–16. [Google Scholar] [CrossRef]
- Berry, J.; Wolf, A.; Campbell, J.E.; Baker, I.; Blake, N.; Blake, D.; Denning, A.S.; Kawa, S.R.; Montzka, S.A.; Seibt, U.; et al. A Coupled Model of the Global Cycles of Carbonyl Sulfide and CO2: A Possible New Window on the Carbon Cycle. J. Geophys. Res. Biogeosci. 2013, 118, 842–852. [Google Scholar] [CrossRef]
- Launois, T.; Peylin, P.; Belviso, S.; Poulter, B. A New Model of the Global Biogeochemical Cycle of Carbonyl Sulfide—Part 2: Use of Carbonyl Sulfide to Constrain Gross Primary Productivity in Current Vegetation Models. Atmos. Chem. Phys. 2015, 15, 9285–9312. [Google Scholar] [CrossRef]
- Kesselmeier, J.; Teusch, N.; Kuhn, U. Controlling Variables for the Uptake of Atmospheric Carbonyl Sulfide by Soil. J. Geophys. Res. 1999, 104, 11577–11584. [Google Scholar] [CrossRef]
- Smith, K.S.; Ferry, J.G. Prokaryotic Carbonic Anhydrases. FEMS Microbiol. Rev. 2000, 24, 335–366. [Google Scholar] [CrossRef] [PubMed]
- Wingate, L.; Ogée, J.; Cuntz, M.; Genty, B.; Reiter, I.; Seibt, U.; Yakir, D.; Maseyk, K.; Pendall, E.G.; Barbour, M.M.; et al. The impact of soil microorganisms on the global budget of delta18O in atmospheric CO2. Proc. Natl. Acad. Sci. USA 2009, 106, 22411–22415. [Google Scholar] [CrossRef] [PubMed]
- Supuran, C.T.; Capasso, C. An Overview of the Bacterial Carbonic Anhydrases. Metabolites 2017, 7, 56. [Google Scholar] [CrossRef] [PubMed]
- Van Diest, H.; Kesselmeier, J. Soil Atmosphere Exchange of Carbonyl Sulfide (COS) Regulated by Diffusivity Depending on Water-Filled Pore Space. Biogeosci. Discuss. 2008, 4, 3701–3722. [Google Scholar] [CrossRef]
- Whelan, M.E.; Hilton, T.W.; Berry, J.A.; Berkelhammer, M.; Desai, A.R.; Elliott Campbell, J. Carbonyl Sulfide Exchange in Soils for Better Estimates of Ecosystem Carbon Uptake. Atmos. Chem. Phys. 2016, 16, 3711–3726. [Google Scholar] [CrossRef]
- Meredith, L.K.; Boye, K.; Youngerman, C.; Whelan, M.; Ogée, J.; Sauze, J.; Wingate, L. Coupled Biological and Abiotic Mechanisms Driving Carbonyl Sulfide Production in Soils. Soil Syst. 2018, 2, 37. [Google Scholar] [CrossRef]
- Kaisermann, A.; Ogée, J.; Sauze, J.; Wohl, S.; Jones, S.P.; Gutierrez, A.; Wingate, L. Disentangling the Rates of Carbonyl Sulfide (COS) Production and Consumption and Their Dependency on Soil Properties across Biomes and Land Use Types. Atmos. Chem. Phys. 2018, 18, 9425–9440. [Google Scholar] [CrossRef]
- Maseyk, K.; Berry, J.A.; Billesbach, D.; Campbell, J.E.; Torn, M.S.; Zahniser, M.; Seibt, U. Sources and Sinks of Carbonyl Sulfide in an Agricultural Field in the Southern Great Plains. Proc. Natl. Acad. Sci. USA 2014, 111, 9064–9069. [Google Scholar] [CrossRef] [PubMed]
- Meredith, L.K.; Ogée, J.; Boye, K.; Singer, E.; Wingate, L.; von Sperber, C.; Sengupta, A.; Whelan, M.; Pang, E.; Keiluweit, M.; et al. Soil Exchange Rates of COS and CO18O Shift with the Diversity of Microbial Communities and Their Carbonic Anhydrase Enzymes. ISME J. 2018. in review. [Google Scholar] [CrossRef] [PubMed]
- Ogée, J.; Sauze, J.; Kesselmeier, J.; Genty, B.; Van Diest, H.; Launois, T.; Wingate, L. A New Mechanistic Framework to Predict OCS Fluxes from Soils. Biogeosciences 2016, 13, 2221–2240. [Google Scholar] [CrossRef]
- Sun, W.; Maseyk, K.; Lett, C.; Seibt, U. Litter Dominates Surface Fluxes of Carbonyl Sulfide in a Californian Oak Woodland. J. Geophys. Res. G Biogeosci. 2016, 121, 438–450. [Google Scholar] [CrossRef]
- Melillo, J.M.; Steudler, P.A. The Effect of Nitrogen Fertilization on the COS and CS2 Emissions from Temperature Forest Soils. J. Atmos. Chem. 1989, 9, 411–417. [Google Scholar] [CrossRef]
- Whelan, M.E.; Rhew, R.C. Carbonyl Sulfide Produced by Abiotic Thermal and Photodegradation of Soil Organic Matter from Wheat Field Substrate. J. Geophys. Res. Biogeosci. 2015, 120, 54–62. [Google Scholar] [CrossRef]
- Smith, N.A.; Kelly, D.P. Oxidation of Carbon Disulphide as the Sole Source of Energy for the Autotrophic Growth of Thiobacillus Thioparus Strain TK-M. Microbiology 1988, 134, 3041–3048. [Google Scholar] [CrossRef]
- Smeulders, M.J.; Barends, T.R.M.; Pol, A.; Scherer, A.; Zandvoort, M.H.; Udvarhelyi, A.; Khadem, A.F.; Menzel, A.; Hermans, J.; Shoeman, R.L.; et al. Evolution of a New Enzyme for Carbon Disulphide Conversion by an Acidothermophilic Archaeon. Nature 2011, 478, 412–416. [Google Scholar] [CrossRef] [PubMed]
- Katayama, Y.; Naraharas, Y.; Inoues, Y.; Amanon, F.; Kanagawa, T.; Kuraishi, H. A Thiocyanate Hydrolase of Thiobacillus Thioparus. A Novel Enzyme Catalyzing the Formation of Carbonyl Sulfide from Thiocyanate. J. Biol. Chem. 1992, 267, 9170–9175. [Google Scholar] [PubMed]
- Welte, C.U.; Rosengarten, J.F.; De Graaf, R.M.; Jetten, M.S.M. SaxA-Mediated Isothiocyanate Metabolism in Phytopathogenic Pectobacteria. Appl. Environ. Microbiol. 2016, 82, 2372–2379. [Google Scholar] [CrossRef] [PubMed]
- Gleen, H. Microbiological Oxidation of Ammonium and Thiocyanate Ions in Soil. Nature 1951, 168, 117–118. [Google Scholar] [CrossRef] [PubMed]
- Bending, G.D.; Lincoln, S.D. Inhibition of Soil Nitrifying Bacteria Communities and Their Activities by Glucosinolate Hydrolysis Products. Soil Biol. Biochem. 2000, 32, 1261–1269. [Google Scholar] [CrossRef]
- Brown, P.D.; Morra, M.J. Brassicaceae Tissues as Inhibitors of Nitrification in Soil. J. Agric. Food Chem. 2009, 57, 7706–7711. [Google Scholar] [CrossRef] [PubMed]
- Davenport, H. The Inhibition of Carbonic Anhydrase and of Gastric Acid Secretion by Thiocyanate. Am. J. Physiol. 1940, 129, 505–514. [Google Scholar] [CrossRef]
- Mangani, S.; Hakansson, K. Crystallographic Studies of the Binding of Protonated and Unprotonated Inhibitors to Carbonic Anhydrase Using Hydrogen Sulphide and Nitrate Anions. Eur. J. Biochem. 1992, 210, 867–871. [Google Scholar] [CrossRef] [PubMed]
- Peltier, G.; Cournac, L.; Despax, V.; Dimon, B.; Fina, L.; Genty, B.; Rumeau, D. Carbonic Anhydrase Activity in Leaves as Measured in Vivo by 18O Exchange between Carbon Dioxide and Water. Planta 1995, 196, 732–739. [Google Scholar] [CrossRef]
- Vullo, D.; Syrjänen, L.; Kuuslahti, M.; Parkkila, S.; Supuran, C.T. Anion Inhibition Studies of a Beta Carbonic Anhydrase from the Malaria Mosquito Anopheles Gambiae. J. Enzym. Inhib. Med. Chem. 2018, 33, 359–363. [Google Scholar] [CrossRef] [PubMed]
- Wilhelm, E.; Battino, R.; Wilcock, R.J. Low-Pressure Solubility of Gases in Liquid Water. Chem. Rev. 1977, 2, 219–262. [Google Scholar] [CrossRef]
- Moldrup, P.; Yoshikawa, S.; Olesen, T.; Komatsu, T.; Rolston, D.E. Gas Diffusivity in Undisturbed Volcanic Ash Soils: Test of Soil-Water-Charactieristic-Based Prediction Models. Soil Sci. Soc. Am. J. 2003, 67, 41–51. [Google Scholar] [CrossRef]
- Ramirez, K.S.; Craine, J.M.; Fierer, N. Consistent Effects of Nitrogen Amendments on Soil Microbial Communities and Processes across Biomes. Glob. Chang. Biol. 2012, 18, 1918–1927. [Google Scholar] [CrossRef]
- Pinheiro, J.; Bates, D.; DebRoy, S.; Sarkar, D.; Team, R.-C. Nlme: Linear and Nonlinear Mixed Effects Models; R Package Version 3.1-131; The R Foundation: Vienna, Austria, 2017. [Google Scholar]
- Nakagawa, S.; Cuthill, I.C. Effect Size, Confidence Interval and Statistical Significance: A Practical Guide for Biologists. Biol. Rev. 2007, 82, 591–605. [Google Scholar] [CrossRef] [PubMed]
- Nakagawa, S.; Schielzeth, H. A General and Simple Method for Obtaining R2 from Generalized Linear Mixed-Effects Models. Methods Ecol. Evol. 2013, 4, 133–142. [Google Scholar] [CrossRef]
- Barton, K. MuMIn: Multi-Model Inference; R Package Version 1.40.4; The R Foundation: Vienna, Austria, 2018; Available online: https://CRAN.R-project.org/package=MuMIn (accessed on 10 July 2018).
- Murtaugh, P.A. In Defense of P Values. Ecology 2014, 95, 611–617. [Google Scholar] [CrossRef] [PubMed]
- Baty, F.; Ritz, C.; Charles, S.; Flandrois, J.-P.; Delignette-Muller, M.-L. A toolbox for nonlinear regression in R: The package nlstools. J. Stat. Softw. 2015, 66, 1–21. [Google Scholar] [CrossRef]
- Simmons, J.S.; Klemedtsson, L.; Hultberg, H.; Hines, M.E.; Banwart, K. Consumption of Atmospheric Carbonyl Sulfide by Coniferous Boreal Forest Soils. J. Geophys. Res. 1999, 104, 11569–11576. [Google Scholar] [CrossRef]
- Ogawa, T.; Noguchi, K.; Saito, M.; Nagahata, Y.; Kato, H.; Ohtaki, A.; Nakayama, H.; Dohmae, N.; Matsushita, Y.; Odaka, M.; et al. Carbonyl Sulfide Hydrolase from Thiobacillus thioparus Strain THI115 Is One of the β-Carbonic Anhydrase Family Enzymes. J. Am. Chem. Soc. 2013, 135, 3818–3825. [Google Scholar] [CrossRef] [PubMed]
- Li, W.; Yu, L.J.; Yuan, D.X.; Wu, Y.; Zeng, X.D. A Study of the Activity and Ecological Significance of Carbonic Anhydrase from Soil and Its Microbes from Different Karst Ecosystems of Southwest China. Plant Soil 2005, 272, 133–141. [Google Scholar] [CrossRef]
- Del Prete, S.; Vullo, D.; Osman, S.M.; Alothman, Z.; Capasso, C.; Supuran, C.T. Anion Inhibition Studies of the Dandruff-Producing Fungus Malassezia Globosa β-Carbonic Anhydrase MgCA. Bioorg. Med. Chem. Lett. 2015, 25, 5194–5198. [Google Scholar] [CrossRef] [PubMed]
- Innocenti, A.; Zimmerman, S.; Ferry, J.; Scozzafava, A.; Supuran, C. Carbonic Anhydrase Inhibitors. Inhibition of the Beta-Class Enzyme from the Methanoarchaeon Methanobacterium Thermoautotrophicum (Cab) with Anions. Bioorg. Med. Chem. Lett. 2004, 14, 4563–4567. [Google Scholar] [CrossRef] [PubMed]
- Rowlett, R.S. Structure and Catalytic Mechanism of the Beta-Carbonic Anhydrases. Biochim. Biophys. Acta Proteins Proteom. 2010, 1804, 362–373. [Google Scholar] [CrossRef] [PubMed]
- Janssens, I.A.; Dieleman, W.; Luyssaert, S.; Subke, J.A.; Reichstein, M.; Ceulemans, R.; Ciais, P.; Dolman, A.J.; Grace, J.; Matteucci, G.; et al. Reduction of Forest Soil Respiration in Response to Nitrogen Deposition. Nat. Geosci. 2010, 3, 315–322. [Google Scholar] [CrossRef]
- Leff, J.W.; Jones, S.E.; Prober, S.M.; Barberán, A.; Borer, E.T.; Firn, J.L. Consistent Responses of Soil Microbial Communities to Elevated Nutrient Inputs in Grasslands across the Globe. Proc. Natl. Acad. Sci. USA 2015, 112, 10967–10972. [Google Scholar] [CrossRef] [PubMed]
- Masaki, Y.; Ozawa, R.; Kageyama, K.; Katayama, Y. Degradation and Emission of Carbonyl Sulfide, an Atmospheric Trace Gas, by Fungi Isolated from Forest Soil. FEMS Microbiol. Lett. 2016, 363, 1–7. [Google Scholar] [CrossRef] [PubMed]
- Bunk, R.; Behrendt, T.; Yi, Z.; Andreae, M.O.; Kesselmeier, J. Exchange of Carbonyl Sulfide (OCS) between Soils and Atmosphere under Various CO2 Concentrations. J. Geophys. Res. Biogeosci. 2017, 122, 1343–1358. [Google Scholar] [CrossRef]
- Sauze, J.; Ogée, J.; Maron, P.-A.; Crouzet, O.; Nowak, V.; Wohl, S.; Kaisermann, A.; Jones, S.P.; Wingate, L. The Interaction of Soil Phototrophs and Fungi with pH and Their Impact on Soil CO2, CO18O and OCS Exchange. Soil Biol. Biochem. 2017, 115, 371–382. [Google Scholar] [CrossRef] [PubMed]
- Rowlett, R.S.; Tu, C.; McKay, M.M.; Preiss, J.R.; Loomis, R.J.; Hicks, K.A.; Marchione, R.J.; Strong, J.A.; Donovan, G.S.; Chamberlin, J.E. Kinetic Characterization of Wild-Type and Proton Transfer-Impaired Variants of β-Carbonic Anhydrase from Arabidopsis Thaliana. Arch. Biochem. Biophys. 2002, 404, 197–209. [Google Scholar] [CrossRef]
- Cronk, J.D.; Endrizzi, J.A.; Cronk, M.R.; Neill, J.W.O. Crystal Structure of E. Coli B-Carbonic Anhydrase, an Enzyme with an Unusual pH-Dependent Activity. Protein Sci. 2001, 10, 911–922. [Google Scholar] [CrossRef] [PubMed]
- Ferraroni, M.; Del Prete, S.; Vullo, D.; Capasso, C.; Supuran, C.T. Crystal Structure and Kinetic Studies of a Tetrameric Type II β-Carbonic Anhydrase from the Pathogenic Bacterium Vibrio Cholerae. Acta Crystallogr. Sect. D Biol. Crystallogr. 2015, 71, 2449–2456. [Google Scholar] [CrossRef] [PubMed]
- Krulwich, T.A.; Sachs, G.; Padan, E. Molecular Aspects of Bacterial pH Sensing and Homeostasis. Nat. Rev. Microbiol. 2011, 9, 330–343. [Google Scholar] [CrossRef] [PubMed]
- Kitz, F.; Gerdel, K.; Hammerle, A.; Laterza, T.; Spielmann, F.M.; Wohlfahrt, G. In Situ Soil COS Exchange of a Temperate Mountain Grassland under Simulated Drought. Oecologia 2017, 183, 851–860. [Google Scholar] [CrossRef] [PubMed]
- Morra, M.; Dick, W. Production of Thiocysteine (Sulfide) in Cysteine Amended Soils. Soil Sci. Soc. Am. J. 1985, 49, 882–886. [Google Scholar] [CrossRef]
- Banerjee, M.; Chapman, S.J. The Significance of Microbial Biomass Sulphur in Soil. Biol. Fertil. Soils 1996, 22, 116–125. [Google Scholar] [CrossRef]
- Bezsudnova, E.Y.; Sorokin, D.Y.; Tikhonova, T.V.; Popov, V.O. Thiocyanate Hydrolase, the Primary Enzyme Initiating Thiocyanate Degradation in the Novel Obligately Chemolithoautotrophic Halophilic Sulfur-Oxidizing Bacterium Thiohalophilus thiocyanoxidans. Biochim. Biophys. Acta Proteins Proteom. 2007, 1774, 1563–1570. [Google Scholar] [CrossRef] [PubMed]
- Sorokin, D.Y.; Tourova, T.P.; Bezsoudnova, E.Y.; Pol, A.; Muyzer, G. Denitrification in a Binary Culture and Thiocyanate Metabolism in Thiohalophilus thiocyanoxidans Gen. Nov. Sp. Nov.—A Moderately Halophilic Chemolithoautotrophic Sulfur-Oxidizing Gammaproteobacterium from Hypersaline Lakes. Arch. Microbiol. 2007, 187, 441–450. [Google Scholar] [CrossRef] [PubMed]
- Hussain, A.; Ogawa, T.; Saito, M.; Sekine, T.; Nameki, M.; Matsushita, Y.; Hayashi, T.; Katayama, Y. Cloning and Expression of a Gene Encoding a Novel Thermostable Thiocyanate-Degrading Enzyme from a Mesophilic alphaproteobacteria Strain THI201. Microbiology 2013, 159, 2294–2302. [Google Scholar] [CrossRef] [PubMed]
- Kantor, R.S.; van Zyl, A.W.; van Hille, R.P.; Thomas, B.C.; Harrison, S.T.L.; Banfield, J.F. Bioreactor Microbial Ecosystems for Thiocyanate and Cyanide Degradation Unravelled with Genome-Resolved Metagenomics. Environ. Microbiol. 2015, 17, 4929–4941. [Google Scholar] [CrossRef] [PubMed]
- Watts, M.P.; Moreau, J.W. New Insights into the Genetic and Metabolic Diversity of Thiocyanate-Degrading Microbial Consortia. Appl. Microbiol. Biotechnol. 2016, 100, 1101–1108. [Google Scholar] [CrossRef] [PubMed]
- Kelly, D.P.; Baker, S.C. The Organosulfur Cycle: Aerobic and Anaerobic Processes Leading to Turnover of C1-Sulfur Compounds. FEMS Microbiol. Rev. 1990, 87, 241–246. [Google Scholar] [CrossRef]
- Broman, E.; Jawad, A.; Wu, X.; Christel, S.; Ni, G.; Lopez-Fernandez, M.; Sundkvist, J.E.; Dopson, M. Low Temperature, Autotrophic Microbial Denitrification Using Thiosulfate or Thiocyanate as Electron Donor. Biodegradation 2017, 28, 287–301. [Google Scholar] [CrossRef] [PubMed]
- Kraft, B.; Tegetmeyer, H.E.; Sharma, R.; Klotz, M.G.; Ferdelman, T.G.; Hettich, R.L.; Geelhoed, J.S.; Strous, M. The Environmental Controls That Govern the End Product of Bacterial Nitrate Respiration. Science 2014, 345, 676–679. [Google Scholar] [CrossRef] [PubMed]
- Sorokin, D.Y.; Tourova, T.P.; Antipov, A.N.; Muyzer, G.; Kuenen, J.G. Anaerobic Growth of the Haloalkaliphilic Denitrifying Sulfur-Oxidizing Bacterium Thialkalivibrio thiocyanodenitrificans sp. Nov. with Thiocyanate. Microbiology 2004, 150, 2435–2442. [Google Scholar] [CrossRef] [PubMed]
- Berben, T.; Overmars, L.; Sorokin, D.Y.; Muyzer, G. Comparative Genome Analysis of Three Thiocyanate Oxidizing Thioalkalivibrio Species Isolated from Soda Lakes. Front. Microbiol. 2017, 8, 254. [Google Scholar] [CrossRef] [PubMed]
- Behrendt, T.; Catão, E.C.; Bunk, R.; Yi, Z.; Schwer, E.; Trumbore, S. Microbial Community Responses Determine How Soil-Atmosphere Exchange of Carbonyl Sulfide, Carbon Monoxide and Nitric Oxide Respond to Soil Moisture. SOIL Discuss. 2018, 1–42. [Google Scholar] [CrossRef]
- Kumar, R.; Saha, S.; Dhaka, S.; Kurade, M.B.; Kang, C.U.; Baek, S.H.; Jeon, B.H. Remediation of Cyanide-Contaminated Environments through Microbes and Plants: A Review of Current Knowledge and Future Perspectives. Geosyst. Eng. 2017, 20, 28–40. [Google Scholar] [CrossRef]
- Cipollone, R.; Ascenzi, P.; Tomao, P.; Imperi, F.; Visca, P. Enzymatic Detoxification of Cyanide: Clues from Pseudomonas aeruginosa Rhodanese. J. Mol. Microbiol. Biotechnol. 2008, 15, 199–211. [Google Scholar] [CrossRef] [PubMed]
- Gupta, N.; Balomajumder, C.; Agarwal, V.K. Enzymatic Mechanism and Biochemistry for Cyanide Degradation: A Review. J. Hazard. Mater. 2010, 176, 1–13. [Google Scholar] [CrossRef] [PubMed]
© 2018 by the authors. Licensee MDPI, Basel, Switzerland. This article is an open access article distributed under the terms and conditions of the Creative Commons Attribution (CC BY) license (http://creativecommons.org/licenses/by/4.0/).