Article

Optimization of Data Processing Minimizes Impact of Self-Absorption on Phosphorus Speciation Results by P K-Edge XANES

by
Luis Carlos Colocho Hurtarte
1,*,
Luiz Francisco Souza-Filho
2,
Wedisson Oliveira Santos
3,
Leonardus Vergütz
4,
Jörg Prietzel
1 and
Dean Hesterberg
5
1
Lehrstuhl für Bodenkunde, Research Department Ecology and Ecosystem Management, Technische Universität München, Emil-Ramann-Straße 2, 85354 Freising, Germany
2
Centro Multidisciplinar do Campus de Barra, Universidade Federal do Oeste da Bahia, Barra, BA 47100-000, Brazil
3
Institute of Agricultural Sciences, Universidade Federal de Uberlândia, Uberlândia, MG 38.400-902, Brazil
4
Department of Soil Science, Universidade Federal de Viçosa (UFV), Viçosa, MG 36570-000, Brazil
5
Department of Soil Science, North Carolina State University, P.O. Box 7619, Raleigh, NC 27695, USA
*
Author to whom correspondence should be addressed.
Soil Syst. 2019, 3(3), 61; https://doi.org/10.3390/soilsystems3030061
Submission received: 30 June 2019 / Revised: 30 August 2019 / Accepted: 4 September 2019 / Published: 6 September 2019
(This article belongs to the Special Issue Using Synchrotron Radiation to Perform Phosphate Speciation in Soils)

Abstract

:
Bulk soil phosphorus speciation by X-ray absorption spectroscopy (XAS) using fluorescence yield-mode measurements is an important tool for phosphorus research because of the low soil P contents. However, when measuring in fluorescence mode, increasing the concentration of the absorbing atom can dampen the XAS spectral features because of self-absorption and affect the linear combination (LC) fitting results. To reduce the self-absorption for samples of high P contents, thick boron nitride diluted samples are produced, yet the effects of self-absorption on P speciation results via LC fitting of P K-edge XANES spectroscopy, and the possible benefits of data processing optimization are unknown. Toward this end, we produced a series of ternary standard mixtures (calcium-iron-aluminum phosphates) and an example soil sample both diluted using boron nitride over a range from 1 to ~900 mmol kg−1 for the soil sample and up to ~6000 mmol kg−1 for the standard mixture. We show that by optimizing background subtraction and normalization values, consistent results with less than 10% error can be obtained for samples with up to 300 mmol kg−1 P. Our results highlight the applicability of optimized P K-edge XANES fitting across a wide range of concentrations encountered in natural environments.

1. Introduction

X-ray absorption fine structure (XAFS) spectroscopy refers to the oscillatory structure in the x-ray absorption coefficient μ ( E ) , just above an absorption edge of an element. From the oscillations present in a spectrum, it is possible to extract information on the local atomic structure surrounding the X-ray absorbing atom, enabling unique insights into important geochemical reactions or the determination of specific mineral phases [1,2]. Over the past decades, a significant increase in the application of XAFS in phosphorus (P) research has been seen [3,4,5,6,7]. Most of these investigations are based on X-ray absorption near edge structure (XANES) spectroscopy, which provides speciation information on the element of interest. It is often aimed in geosciences to study P within a soil, plant tissue, fertilizers, or sediment matrix. Under these conditions, the concentration of P is commonly very low, making transmission-mode XANES spectroscopy analysis very difficult, because of the low absorption coefficient [µx(E)] of P relative to the total absorption coefficient µtotal(E) for the sample. Therefore, μ ( E ) of P is more commonly probed indirectly by measuring the fluorescence yield as:
μ ( E )     I f ( E ) / I 0 ( E )
where I f is the monitored intensity of a fluorescence line associated with the absorption process and I 0 is the x-ray intensity incident on a sample [8]. However, the accuracy of P K-edge spectra obtained in fluorescence mode is often limited by distortions because of self-absorption. Self-absorption is the systematic, energy dependent reduction in the experimentally measured fluorescence amplitude [9]. Often the path of the fluoresced X-rays from the P atoms within the sample into the detector (escape depth) is much longer than the penetration depth of the incoming X-rays. This phenomenon increases the probability that interactions with the sample from the fluorescent photons in their way back through the sample into the detector dampen its intensity. Thus, the fluorescence intensity can be better defined as:
I f = I 0   Ω 4 π   μ x ( E )   { 1     e   [ μ t o t ( E ) s i n θ   +   μ t o t ( E f ) s i n ϕ ]   t } μ t o t ( E ) s i n θ   +   μ t o t ( E f ) s i n ϕ .
where is the fluorescence efficiency, ∆Ω is the solid angle of the detector, E f is the energy of the fluorescent x-ray, θ is the incident angle (between incident x-ray and sample surface), φ is the exit angle (between fluoresced x-ray and sample surface), μ x ( E ) is the absorption from the element of interest, and μ t o t ( E ) is the total absorption in the sample. The total absorption [ μ t o t ( E ) ] is the sum of the absorption of the element of interest [ μ x ( E ) ] and the absorption by other elements in the matrix [ μ o t h e r ( E ) ] [8,10].
Previous studies on self-absorption have developed mathematical algorithms and solutions aiming to correct the fluorescence yield distortions based mostly on Equation (2). Yet, most of these approaches rely on knowledge of sample stoichiometry, measurements of multiple angles, or exact knowledge of the energy dependence of the absorption coefficients [10,11,12,13]. These conditions are hard to meet in environmental samples, thus it is recommended to avoid self-absorption effects rather than attempting to correct them [14]. Approaches used to reduce self-absorption aim to modify the components of the term μ t o t ( E ) . This can be done while preparing the sample by reducing the grain size of the sample and then either approaching a thin or a diluted thick sample limit. The thickness to which we refer is the optical path though one element. The maximum acceptable thickness of an undiluted sample is known as the “thin limit,” while when a diluted sample’s optical path approaches infinity, it is said to be at the “thick limit” [15]. Samples that approach the thin sample limit are prepared by applying a non-diluted powdered sample to a thin carbon-based tape and removing the excess by manual shake or tapping. On the other hand, the thick limit is approached by forming hydraulic pressed pellets of the sample, that can be diluted with a matrix which has a low absorption coefficient μ ( E ) in the energy range that will be used. Boron nitride (BN) is a standard diluent because of it is composed by of low-Z elements (B and N) having low μ ( E ) , and is both stable and inert [14,16].
Sample preparation approaching the thin sample limit is better for samples with low concentration, as it is reproducible and yields very robust results [17,18,19,20,21]. However, often the P speciation of fertilizers, agronomical fields trials, or lithogenic P rich soils is also necessary [22,23,24]. The common knowledge is that for samples with high P concentration a dilution to 0.2 to 5% w/w in Boron nitride BN is necessary [25,26]. In this concentration range the self-absorption is thought to be diminished and easily done when preparing thick diluted samples. Nevertheless, at present, it is not clear what is the optimal concentration of P to collect data in X-rays fluorescence mode at the thick diluted limit (i.e., pellets) at which spectra and consequently LC fitting results are not significantly influenced by self-absorption. Moreover, it is unknown if recent improvements in data processing optimization [18], may also improve the LC fitting results even when self-absorption is present. In this paper, we aim to address these questions by comparing the results of LC fitting in two matrices, where the P concentration was varied from 1 to ~6000 mmol kg−1. The two samples were a diluted soil matrix and a mixture of commonly encountered P species standards (calcium phosphate, iron phosphate, and aluminum phosphate). We analyzed the samples using both non-optimized and optimized background and normalization values for each sample and compared consistency and accuracy of the results across the increasing concentration range between the true composition and between the LC fitting approaches.

2. Materials and Methods

2.1. Ternary Standard Mixtures and Soil Sample

A simple matrix sample was produced by mixing and homogenizing three phosphate standard compounds commonly used in LC fitting exercises of soil samples from agricultural fields [27,28]. The standards (Table S1 and Figure S3) were purchased from Sigma-Aldrich® and mixed as follow: 33% calcium hydrogen phosphate (CAS Number: 7757-93-9), 33% aluminum phosphate (CAS Number: 7784-30-7), and 33% iron(III) phosphate (CAS Number: 13463-10-0). The final phosphorus concentration of the mixture was 6487.56 mmol kg−1. The standard mixture was finely ground and then diluted in boron nitride (CAS Number: 10043-11-5) using a Wig-L-Bug® grinder/mixer to achieve the following final concentrations: 1, 6.25, 12.5, 25, 50, 75, 100, 200, 300, 400 and 1000 mmol kg−1.
Additionally, we analyzed a soil sample diluted to the same P concentrations as the standard mixtures up to 900 mmol kg−1, to achieve this a soil sample with high phosphorus content was chosen. The sampled profile was located in the district of Lapão, State of Bahia, Northeast region of Brazil (UTM 187881 and 8736316, zone 24S), inside the Irecê Plateau. The soil is an Inceptisol (Soil Taxonomy, 1999), classified as a Cambissolo Háplico Ta eutrófico latossólico according to the Brazilian System of Soil Classification (SiBCS, 2006). From this soil we chose a subsurface layer (90–140 cm deep) with 947.92 mmol kg−1 of total phosphorus, by diluting the soil with BN. The natural high P content of this soil is due to the calcareous rocks that were deposited during the Neoproterozoic (Precambrian) in the Irecê Plateau. These rocks occur in association with phosphatic rocks and sulfide mineralization of Fe, Zn, and Pb in many gossans formations, originating from hydrothermalism [29]. A general characterization of the sample performed by Paiva [29] is shown in Table S2 and the results of a Headley fractionation are shown in Table S3. All dilutions were analyzed for its total P content by digestion with H2SO4. Briefly, 500 mg of the sample was dissolved with 10 mL of H2SO4 (1:1) in a 250 mL flask and digested for 30 min under a reflux condenser. Thereafter, the volume was completed with water and filtrated. The total P of the filtrated solution was measured using ICP-OES.

2.2. Phosphorus K-Edge XANES Data Collection and Analysis

All XANES spectra were collected at the Brazilian Synchrotron Light Laboratory (LNLS) using the soft X-ray spectroscopy beamline (SXS) in fluorescence mode using an AMPTEK® X-ray Spectrometer Detector (model X-123) to record the X-ray fluorescence. The storage ring had an energy of 1.37 GeV with a maximum electron beam current of 250 mA. The photon energy was scanned by a Si (111) double-crystal monochromator, which is best suited for high energy resolution measurements. The state and energy resolution of the monochromator was previously checked by measuring a rocking-curve from −35 to 5 arcsec (Figure S1). The size of the beam at the sample was 0.6 × 1.2 mm2 (FWHM). The beamline was calibrated with a freshly prepared elemental phosphorus standard (Red phosphorus—CAS-No. 7723-14-0) at 2145.5 eV, and the calibration was checked periodically after every beam injection by scanning across the edge of a freshly daily prepared elemental phosphorus standard (Figure S2). No significant movement of the edge energy (E0) was observed though our experiment.
All samples were prepared in pellet form with 13 mm diameter using 120 mg of each sample and 800 kg pressure for the pellets production. Then, the samples were mounted on a stainless-steel sample holder and covered with a 4-µm ultralene thin window film (Spex SamplePrep, Metuchen, NJ, USA). The soil samples and the standards were mounted at the beamline, under vacuum to decrease X-ray absorption by the environment around the sample. The detector was placed at a solid angle of 45° from the incident monochromatic beam to increase the fluorescence signal. Data were collected across an energy range of −35 to +210 eV relative to the calibration energy of elemental P (E0 = 2145.5 eV). Scans were divided into three regions with the following relative energy ranges and energy-step sizes: −35 to −15 eV (1 eV step); −15 to 55 eV (0.2 eV step), 55 to 210 eV (1 eV step). Dwell time for each step across all energy regions was 2 s. Three to seven scans were collected from each sample.
Data processing was performed using both Athena for data preprocessing and the package LCF for background subtraction, normalization, and LC fitting [18,30]. Data preprocessing consisted in visual evaluation of the spectrum for inconsistency (e.g., glitches, drifts, and noise) between replicates of the same spectra and merging of the scans. Thereafter, samples were all E0 calibrated to the zero crossing of the second derivative of the absorption for each sample. To estimate the range where self-absorption affects the linearity of white line increase, we tested the correlation of total P content with the area of the XANES spectra from 2137 to 2186 eV, prior to normalization. This was done by integrating the abovementioned range using the Simpson method for integration in R.
For the standard mixtures and the soil sample, two different approaches for baseline subtraction and normalization were followed: First we applied a consistent baseline subtraction and normalization range across all samples and standards (−36 to −15 eV and +37 to +58 eV from E0—values represent the average value of the range used for optimization) and compared it to the fitting results from applying an optimized background subtraction and normalization values from a variable range. The parameters for the LC fitting optimization using the LCF package were based on the values obtained by [18] as follows: pre-edge background subtraction: between −43 eV to −30 eV and −19 eV to −9 eV and normalization values: between +34 eV to +40 eV and +50 eV to +65 eV, with respect to E0. The standards used for LC fitting were composed of two different sets, and all diluted to 50 mmol kg−1 in BN. The first set was used to fit for the standard mixtures (Set A—Figure S3) and was composed of calcium phosphate (Figure S3a), aluminum phosphate (Figure S3b), and iron phosphate (Figure S3c). The second set (Set B—Figure S4) was used to fit the soil sample, the standards were chosen on the basis of the chemical and mineralogical characterization of the sample by Paiva [29]. Based on his results, the sample should be composed majorly of iron phosphates (either as minerals or as sorbed P to goethite) and calcium phosphates (either as hydroxyapatite or as weathering products of apatite, such as β-tricalcium phosphate [31,32]); thus we assembled a data set of standards (Table S1) comprising of (Figure S4a) β-tricalcium phosphate, (Figure S4b), hydroxyapatite, (Figure S4c) orthophosphate bounded to goethite, (Figure S4d) orthophosphate bounded to kaolinite, and (Figure S4e) strengite. The orthophosphate bounded to kaolinite and to goethite were produced according to Khare et al. [33]. In summary, a stock solid suspension containing 1.50 g kg−1 was prepared by shaking a sample of each mineral in a KCl 0.01 mol L−1 solution for two hours. While vigorously mixing with a magnetic stirrer, 1 g of the stock suspension was weighed into 50-mL centrifuge tubes, and an appropriate aliquot of 0.01 mol L−1 KH2PO4 was slowly added to each vigorously stirred sample in random chronological order using a micropipette. The pH was adjusted to pH 6.0 using 0.01 mol L−1 HCl or 0.01 mol L−1 KOH. Samples were shaken for 42 h on a reciprocating water bath shaker at a rate of 0.5 s−1 and 22 °C. At the end of the experiments, the suspensions were centrifuged at approximately 20000× g for 15 min and filtered through 0.2-µm Millipore filters. The air-dried residues were scraped from the filters with a spatula and homogenized for acquisition of XANES spectra. Deviations, means, regressions, and graphs were also done using R [34].

3. Results

3.1. Analysis of P Content of the Standard Mixtures and Soil Sample

Samples analyzed for total P confirmed that the standard mixtures and diluted soil samples had been diluted to the proposed P concentrations. We found also no P in the BN used for dilution, when scanning a sample of pure BN through the P energy range at the synchrotron. We corrected the sample P concentrations according to the concentrations of the standard mixtures and soil sample as obtained by ICP-OES presented in Table 1 and Table 2.

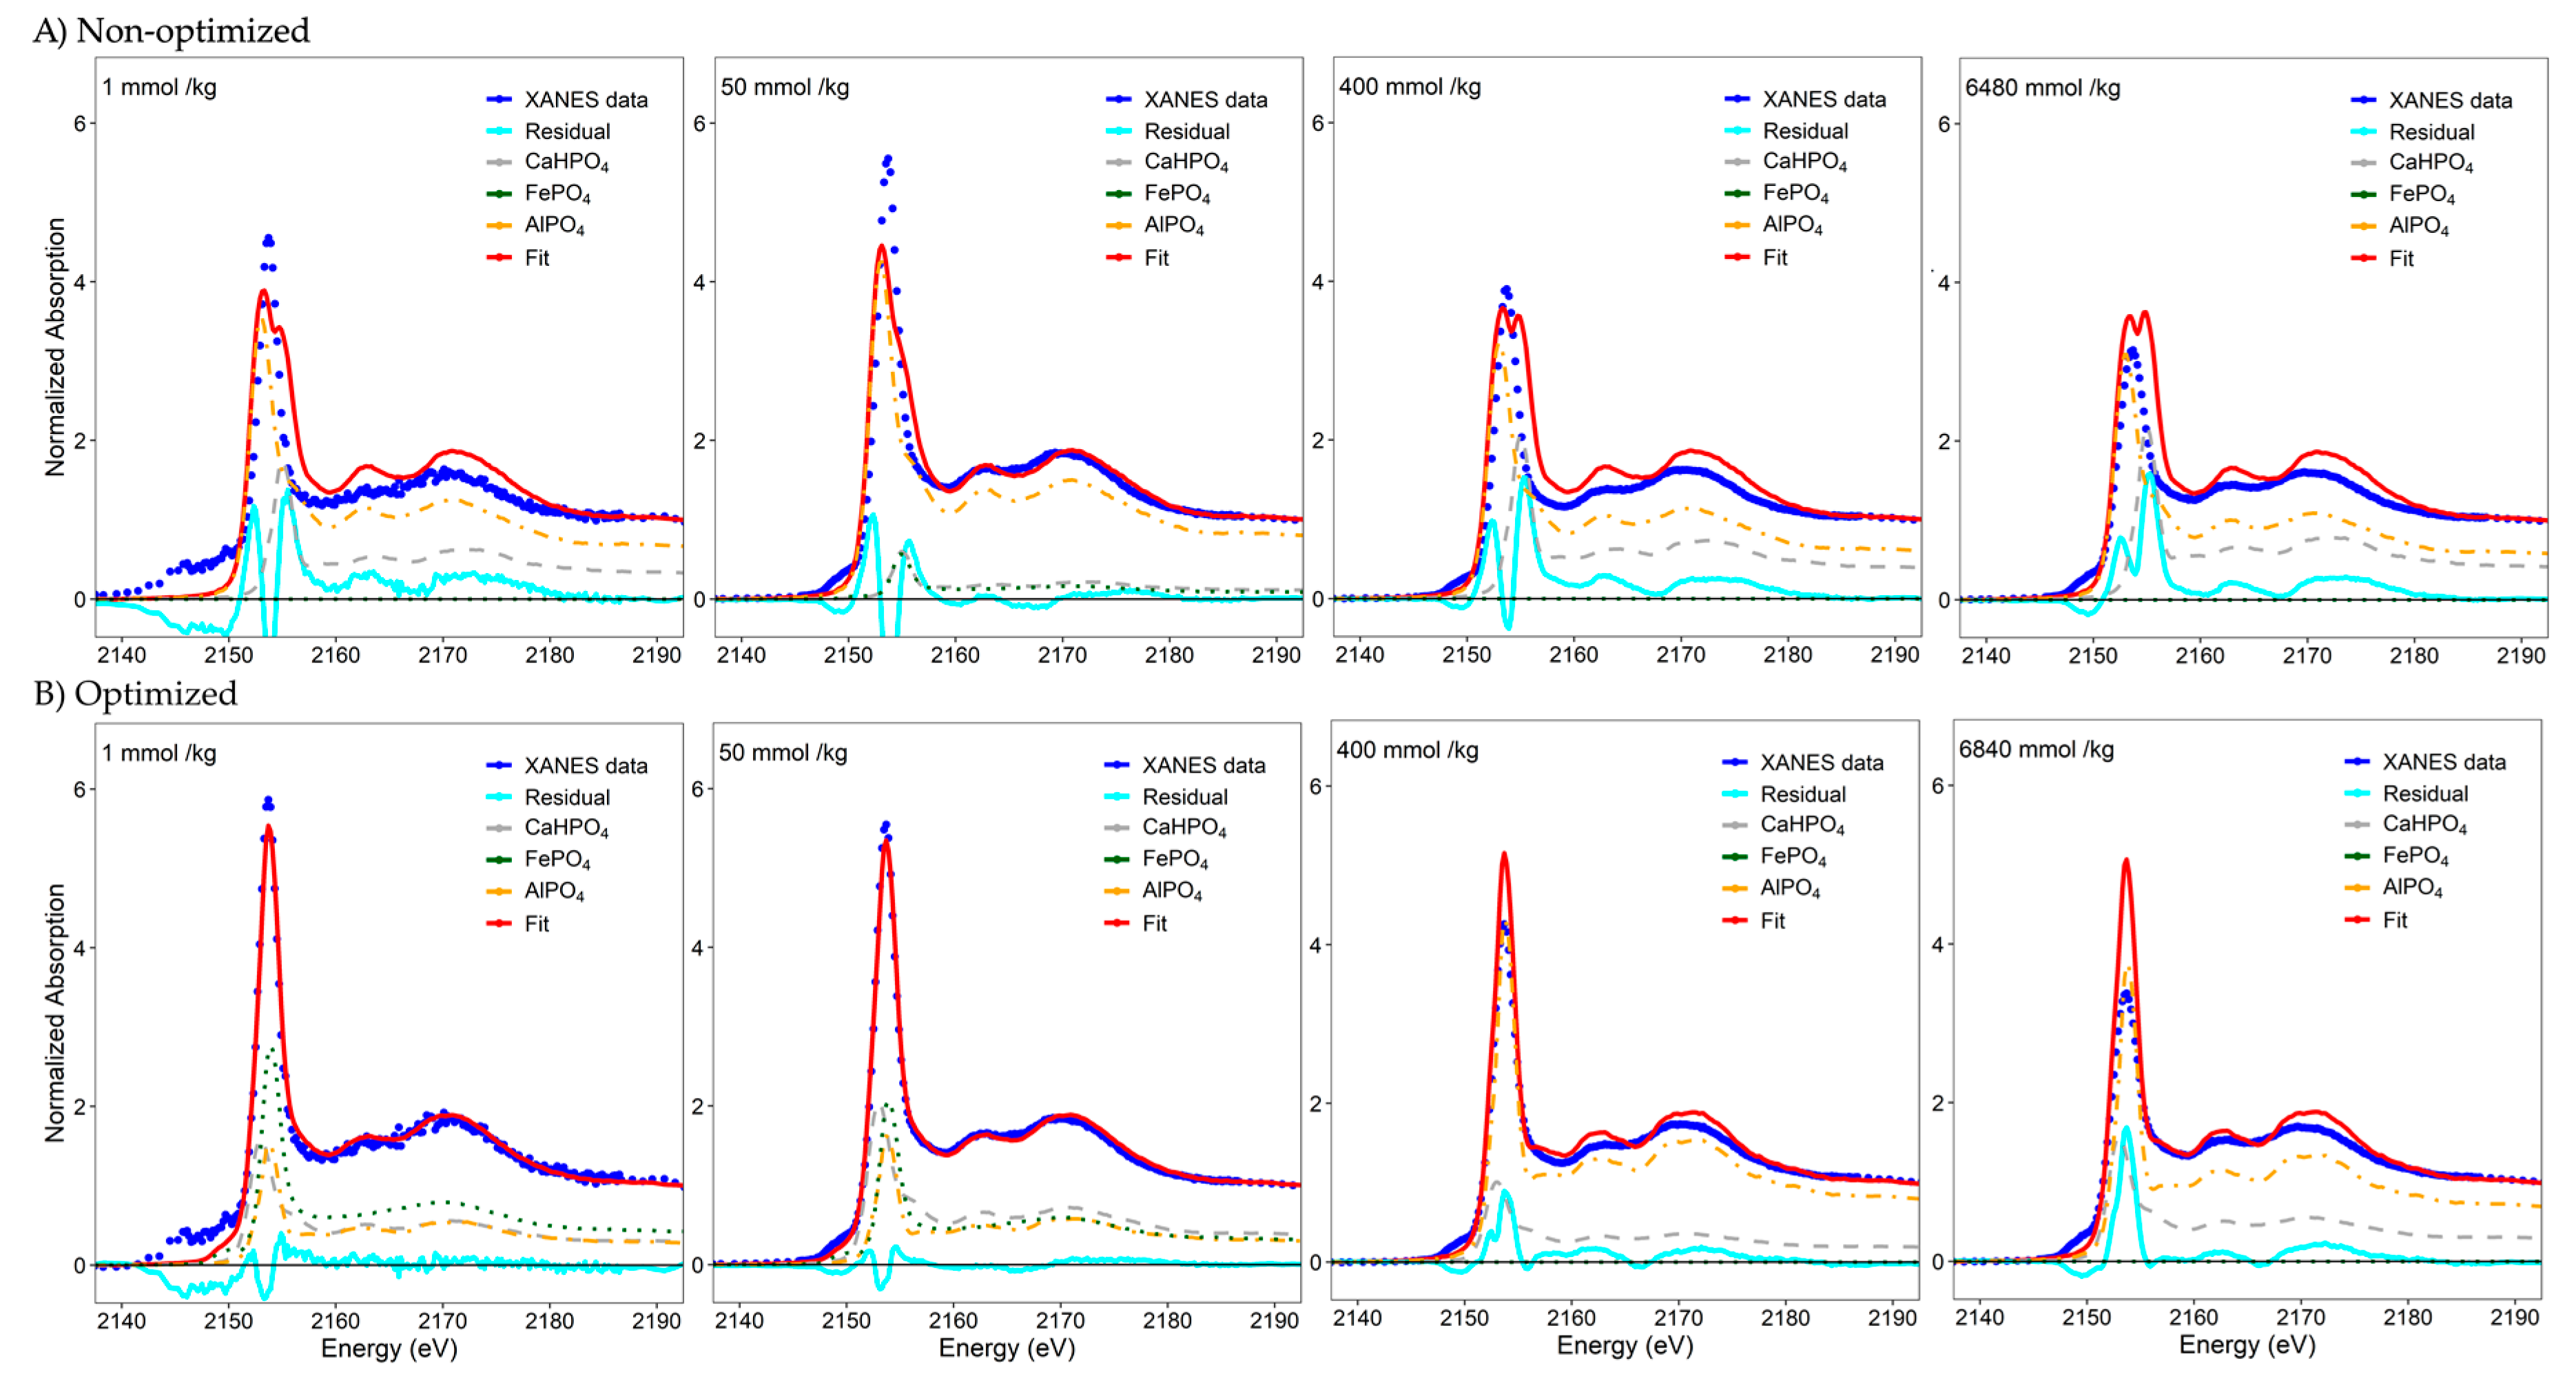
3.2. Self-Absorption Effects on LC Fitting of Standard Mixtures and Soils
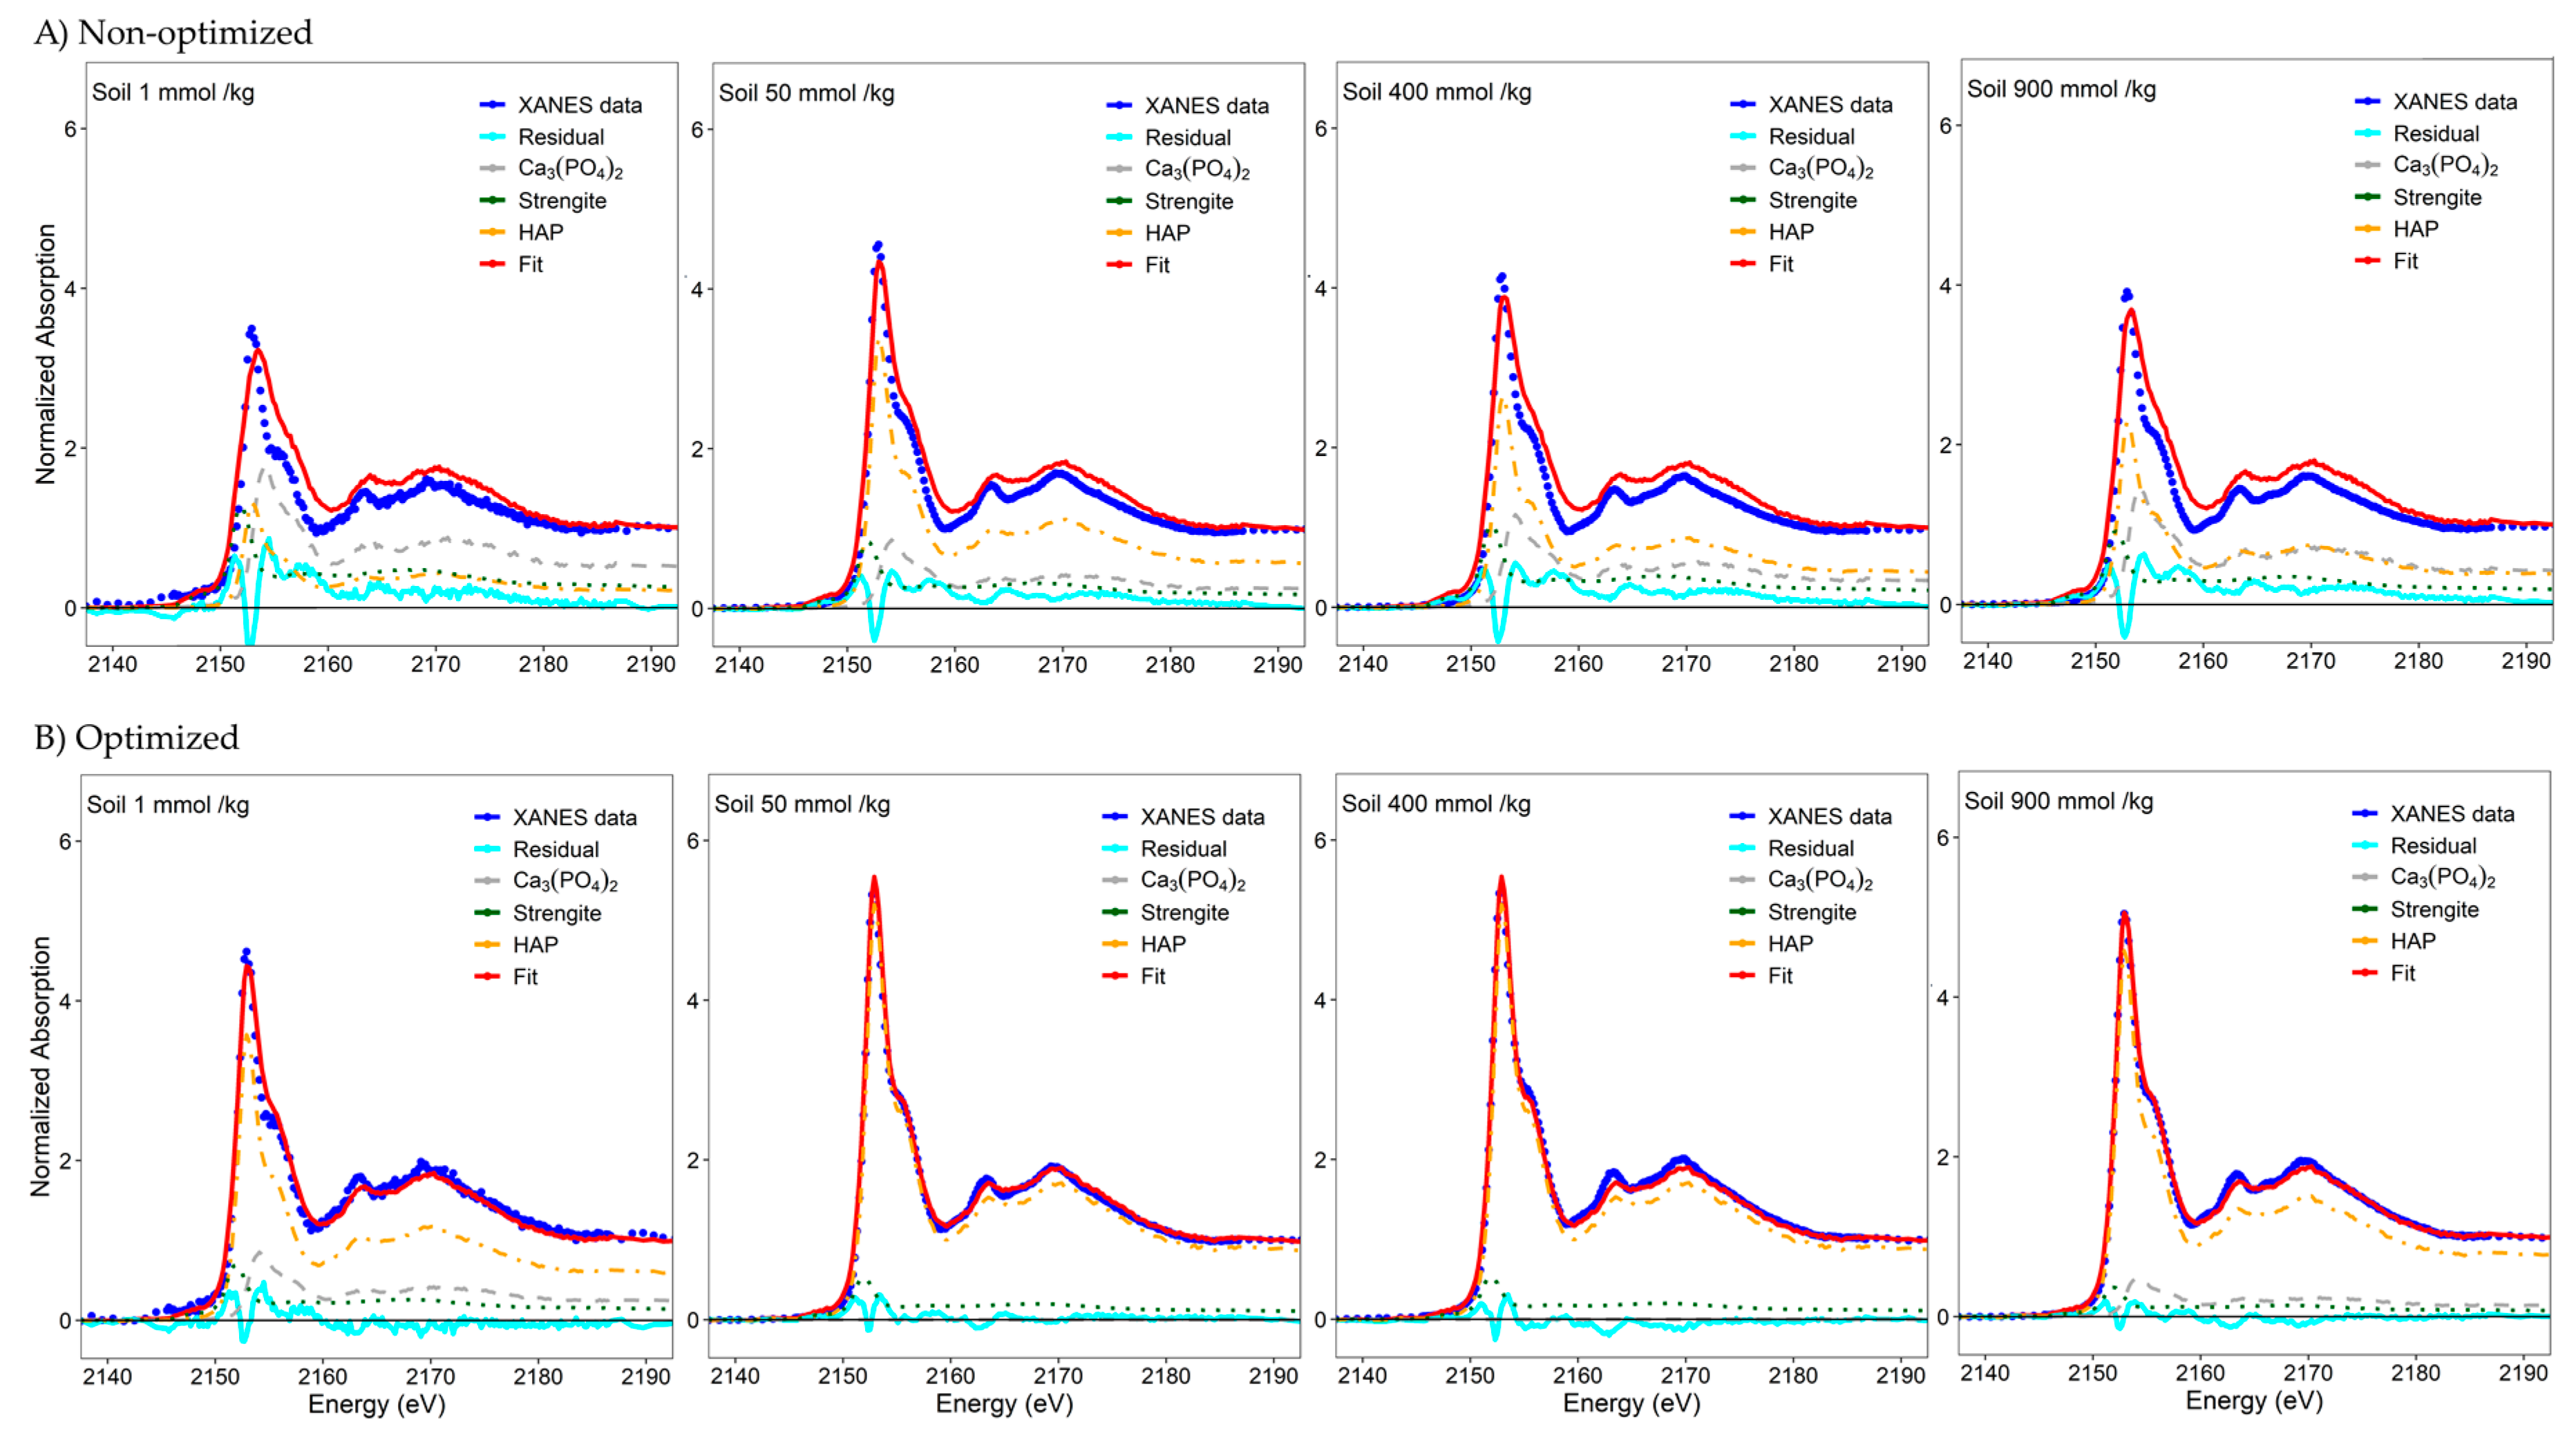
The analysis of standard mixtures by XANES spectroscopy is a very common approach when testing the suitability of a fitting method [18,26]. We started our analysis by testing the correlation of total P content with the area of the XANES spectra from 2137 to 2186 eV, prior to normalization in an approach similar to [35,36]. Our results show a high correlation (R = 0.96; R2 = 0.9188, Figure 1) of the total area with that of the total P concentration up to 75 mmol kg−1 of P. Above that concentration, the damping because of self-absorption breaks the correlation between the signal and the P concentration of the sample. This effect indicates that, in our samples, above 75 mmol kg−1 of P self-absorption occurs in such a manner that the total area of the P K-edge spectrum of the given sample does not reflect anymore the P concentration of that sample.
Prior to LC fitting, we normalized all spectra to an absorption edge of 1, using both a fixed and a variable range for background subtraction and normalization. Both methods show the effects of self-absorption, as decrease of white line intensity at concentrations as low as 75 mmol kg−1 P (Figure 2A,B). Moreover, P concentrations above 75 mmol kg−1 of P, showed distinctive features for FePO4, AlPO4, and CaPO4 that were visibly dampened and distorted (Figure 2A). Our results show that using a consistent background and normalization value for all concentrations yielded less precise and consistent results than when using optimized values. This is confirmed by both the mean deviation from the expected percentage across all concentrations (18% vs. 23% for FePO4, 53% vs. 44% for AlPO4, and 29% vs. 33% for CaHPO4, Table 1) and the mean R-factor values (0.0171 vs. 0.0076). The accuracy from the optimized preprocessing results was indicated by <4% deviation from the expected result when only those concentrations lower than 300 mmol kg−1 are considered, whereas the mean difference from non-optimized values is still above 10%. Moreover, using the conventional approach to P K-edge XANES LC fitting the deviation increases heavily above 75 mmol kg−1, where self-absorption already dampens the spectrum.
In Table 1, several results must be highlighted for instance, the LC fits for concentrations <12.5 mmol kg−1, where the noise level heavily compromises the spectral features of the XANES data, also showed fitting results that increasingly deviated from the known values in these mixtures. Using our detector configuration, results below 10 mmol kg−1 had up to 9% deviation from the true species percentages (FePO4), when using optimized preprocessing values. This problem became much more evident when using non-optimized baseline subtraction and normalization, where the deviation of reported from true species percentage was up to 100% in some cases (e.g., FePO4 at 1 mmol kg−1). Overall, aluminum and iron phosphates had a higher variance on its LC fitting results both when considering the whole concentration range analyzed (22% vs. 16% for FePO4, 32% vs. 21% for AlPO4) and also when considering only up to 300 mmol kg−1 (22% vs. 8% for FePO4, 32% vs. 9% for AlPO4). Calcium phosphate LC fitting results were more resilient for both the overall concentration (10% vs. 6% for CaHPO4) and when considering up to 300 mmol kg−1 (10% vs. 4% for CaHPO4).

3.3. Soil Sample

The Irecê soil sample contains high concentrations of CaCO3(~110 g kg−1), crystalline iron oxides (~6.17 dag kg−1), silicate clay minerals (~13.5 dag SiO2 kg−1) and phosphorus (~950 mmol kg−1) (Table S2). The P-fractionation revealed a high percentage (94.5%) of P extractable with acid (Table S3). The XRD patterns of the different size fractions of the sample revealed an enrichment of iron phosphate minerals (phosphoferrite, plumbogummite, data not shown), these minerals were identified by Paiva [29] using only one d-spacing for each of the minerals, which puts doubt into the real mineral from which this peaks are coming. Nevertheless, with this information we were led to choose Ca and Fe bearing P standards for LC fitting. We had no access to phosphoferrite or plumbogummite pure minerals, thus we used strengite as iron phosphate mineral, hydroxyapatite, and β-tricalcium phosphate as calcium phosphate proxies; moreover we tested other possible standards like phosphate bonded to goethite, kaolinite with no avail. The use of strengite as an iron phosphate, was also not the optimum choice, as the mineral identified by XRD is fosfoferrite which contains Fe(II) and not Fe(III). The fact that fosfoferrite could be potentially identified in the XRD, leads us to believe that Fe(II) phosphate could be responsible for a larger percent of the total P, of at least 10%.
Yet, our results using optimized preprocessing values were highly consistent across all concentrations; an average of 83% of hydroxyapatite, 8% strengite, and 8% β-tricalcium phosphate (Table 2). On the other hand, using consistent values on the soil sample yielded a similar trend, that is a high portion of the sample was fit with calcium phosphate and a minimal part of iron phosphate. Nevertheless, when using non-optimized values calcium phosphate was partitioned between hydroxyapatite and β-tricalcium phosphate. Both fitting methods yielded, surprisingly seemingly consistent results even at higher P concentrations. Yet, the optimized values had across all concentrations a lower R-factor (Figure 3). We could also confirm that a concentration of 1 mmol kg−1, because of a high noise level, also showed LC fitting results that were very different than those for LC fitting results between 6.5 mmol kg−1 and 300 mmol kg−1. In essence, using optimized values for background subtraction and normalization in the soil sample, yielded overall a lower R-factor (0.0019 vs. 0.02) and more consistent LC fitting results with low variation across the concentration range evaluated.
Combining our results, we have determined that the range which allows accurate LC fitting results is from 1 to 300 mmol kg−1 P. Although self-absorption occurs within the determined range, with our data optimization protocol we can reach accurate results with variation across different concentrations. At this range, the data optimization protocol yields results with less than 10% deviation from the expected result (Figure 4A). Furthermore, although in the soil sample the results have similar variance across the different concentrations. The R-factor was constantly lower in the optimized results (Table 2), when using the same standards, which indicates at the most a mathematically better answer.

4. Discussion

4.1. Analysis of P Content of the Standard Mixtures and Soil Sample

Adequate sample preparation prior to XANES analysis is pivotal for a successful experiment [37]. Here we tested the use of thick diluted samples for fluorescence measurements and the effects of self-absorption on the LC fitting results. Whereas thin diluted samples are also a possibility, the use of pellets for XANES measurements to minimize self-absorption effects is widely recommended and suitable when concentrations are deemed too high [5]. So far, no study has been carried out to determine the concentration threshold above which self-absorption would seriously confound the LC fitting results. Earlier studies have empirically established a concentration as 800 mmol kg−1 as a possible threshold [3], and concentrations around 400 mmol kg−1 [5,38] or within 0.3 to 5% (w/w) have also been recommended [25,26]. Our results (Figure 1) showed that above 75 mmol kg−1 self-absorption already occurs and that above 300 mmol kg−1 it is impossible to avoid a large influence of self-absorption on LC fitting results (Table 1). This result contrasts with most of the above-mentioned recommended threshold values, but shows that samples with P concentrations below 0.3% (w/w) are on the safe end. Moreover, we showed that by optimizing the background subtraction and normalization values it is possible to not only obtain accurate results while varying the composition of the sample as shown by Werner et al. [18], but we can also improve accuracy across different concentrations even when self-absorption is seriously confounding the fluorescence signal of the sample.
Although the specific effects of self-absorption on the accuracy of the results differed among analyzed samples and on various P species, a trend could be observed in the ternary standard mixtures: In general, LC fitting quantification results for aluminum phosphate and iron phosphate were more sensitive to the increasing self-absorption effect, than those for calcium-phosphates (Table 1). This could be due to resilience of the shoulder feature at the high end of the white-line in calcium phosphates to be dampened even at high P concentrations. On the other hand, small spectral features like the pre-edge peak of iron phosphate disappeared at larger P concentrations. This conclusion seems to hold also for the soil, as the reported proportion of apatite was relatively constant for all P concentrations while the iron phosphate fraction varied more. A similar situation was encountered by Ajiboye et al. [26], who concluded that when samples are composed of small pre-edge spectral features (iron phosphate) mixed with strong post-edge spectral features (calcium phosphates), the detection of the former was damped. While Ajiboye et al. [26] used a concentration of 5% w/w, far above what we would recommend based on our results, and thus their iron phosphate features could have been already damped, our results show that spectral features above the edge seems to be less prone to distortion, and strong features such as the shoulder of calcium phosphates seem to be unaffected by self-absorption. This highlights the importance of avoiding distortions of the P K-edge spectra by self-absorption, as spectra differ only by subtle pre-edge and post edge peaks rather than pronounced features [39].
Soils, contrary to standard mixtures, may contain a myriad of P forms within their matrices, yet all forms are commonly fit by 3 to 5 standards as proxies used in the LC fitting. Using P K-edge XANES spectroscopy to probe the inorganic P fraction is a recurrent strategy in P research, at best combining it with 31P NMR spectroscopy and/or sequential fractionation for analysis of the organic P fraction [4,40,41]. In our study, we analyzed a sample of the BC horizon (90–140 cm) lithogenically enriched with phosphorus (95% of total P was extractable by H2SO4). This ensured a low contribution of organic P in the spectra, which would have increased the uncertainty of the LC fitting. We expected to find higher proportions of iron phosphates, as identified in the XRD by Paiva [29], yet they were consistently lower than 10%. This was more in accordance to the chemical fractionation results. We attribute the low percentage of identified iron phosphates to two possible sources of error: the XRD and/or the model standards used. The XRD could be a source of bias because Paiva [29] identified the iron phosphate minerals using only one d-spacing value for each mineral, which is highly unreliable. The other option is that our choice of standards was incorrect, as phosphorite is composed of Fe(II) and not Fe(III), the absence of the pre-edge feature in Fe (II) compounds [16,42] like phosphorite could have masked its presence. This also exemplifies the potential weakness of LC fitting, as the fitting of the model can be improved unknowingly by applying incorrect standards. Nevertheless, our results showed consistent results even at high P concentrations (Figure 1), especially those from mineral standards (hydroxyapatite and strengite). We attribute this to the strong spectral features of both standards, which are less prone to dampening. Yet, this also indicates that when dominating, these features could mask weaker or less significant components, as suggested by Seiter et al. [43].

4.2. Implications and Caveats for P Speciation

Recent advances in self-absorption correction theory claim that it is now possible to correct self-absorption effects without extra measurements [10]. However, such algorithms have not yet been implemented in common software packages for spectral processing like Athena, Larch, or LCF, and thus we did not test them. However, as soils around the world have mean P contents of 16 mmol kg−1 (varying between 48.5 mmol kg−1 and 7.9 mmol kg−1 for tundra regions and tropical forests) [44], our results clearly demonstrate that P speciation using XANES on soils under these boundaries yields consistent results.
We recommend that in samples where P speciation using K-edge XANES is done, the P concentration should not be above 300 mmol kg−1 P. Below this value, sample preparation should follow the thin sample limit approach, and if P concentration is above 300 mmol kg−1 samples should be diluted in BN and pelleted, while keeping the beam size large as to cover a wide area of the sample. Our results, although with broad application for the XANES community, are not to be translated into concentrations for EXAFS analysis, as the analysis range and modifiable variables affecting the results of the EXAFS fitting considerably exceed those of XANES fitting. Moreover, we have shown that under the appropriate conditions these limits can be surpassed when applying modern data processing algorithms, yet care must be taken as to which standards are chosen and that strong spectral features are present for the standards and samples. If so, diluting the sample to the recommended concentrations is best. We have shown that by optimizing the baseline and normalization values prior LC fitting of XANES P K-edge spectra, reliable models of possible inorganic P species present in soils are produced, while the organic P speciation still remains a challenge. Yet, with the increasing modernization of synchrotron facilities, solving the remaining challenges of P K-edge spectroscopy seems more at hand. For instance, specialized beamlines using new detectors now are able to access P concentrations at the ppm range [45], while on others the coupling of complementary X-ray techniques (such as X-ray emission spectroscopy) could open doors to a complete analysis of different P species in soils [46].

Supplementary Materials

The following are available online at https://www.mdpi.com/2571-8789/3/3/61/s1, Table S1: Chemical characteristics of the standards that compose the ternary known-mixtures. Table S2: Irecê P7 soil sample classification and physical-chemical characteristics. Table S3: Irecê soil sample phosphorus fractions according to the sequential Hedley phosphorus fractionation and percentage of each fraction from the total soil phosphorus. Figure S1: Rocking-curve from −35 to 35 arcsec at the SXS beamline at the LNLS. Figure S2: P K-edge XANES spectrum of a daily prepared elemental P powder used for energy calibration. Figure S3: P K-edge XANES spectra of the standards ((a) aluminum phosphate, (b) calcium hydrogen phosphate, and (c) iron phosphate). Figure S4: P K-edge XANES spectra of the standards ((a) β-tricalcium phosphate, (b) hydroxyapatite, (c) orthophosphate bounded to goethite, (d) orthophosphate bounded to kaolinite, and (e) strengite).

Author Contributions

Conceptualization: L.F.S.-F., W.O.S., L.V.; data measurement L.F.S.-F., W.O.S., D.H.; data analysis L.C.C.H., J.P.; writing—original draft preparation L.C.C.H., J.P.; writing—review and editing L.F.S.-F., W.O.S., L.V., D.H., L.C.C.H., and J.P.

Funding

L.C.C.H. and J.P. recieve funding from the German Research Foundation - DFG within the framework of Priority Program SPP 1685 “Ecosystem Nutrition: Forest Strategies for Limited Phosphorus Resources” by the German Research Foundation (DFG). L.V., D.H., and L.F.S.-F receive founding from the Brazilian agency CAPES (Coordination for the Improvement of Higher Education Personnel-project CAPES-A105/2013) whithin the project “APPLICATION OF SYNCHROTRON BASED X-RAY ABSORPTION ESPECTROSCOPY TECHNIQUES TO THE GEOSCIENCE FIELD”.

Acknowledgments

This research used resources of the Brazilian Synchrotron Light Laboratory (LNLS), an open national facility operated by the Brazilian Centre for Research in Energy and Materials (CNPEM) for the Brazilian Ministry for Science, Technology, Innovations and Communications (MCTIC). The SXS beamline staff is acknowledged for the assistance during the experiments. The authors also thank Arlicélio Paiva from State University of Santa Cruz, Bahia State, Brazil, for providing the soil sample used in this study.

Conflicts of Interest

The authors declare no conflict of interest.

References

  1. Stern, E.A. Structure determination by X-ray absorption. Contemp. Phys. 1978, 19, 289–310. [Google Scholar] [CrossRef]
  2. Rehr, J.J.; Ankudinov, A.L. Progress in the theory and interpretation of XANES. Coord. Chem. Rev. 2005, 249, 131–140. [Google Scholar] [CrossRef]
  3. Hesterberg, D.; Zhou, W.; Hutchison, K.J.; Beauchemin, S.; Sayers, D.E. XAFS study of adsorbed and mineral forms of phosphate. J. Synchrotron Radiat. 1999, 6, 636–638. [Google Scholar] [CrossRef] [PubMed]
  4. Kruse, J.; Leinweber, P. Phosphorus in sequentially extracted fen peat soils: A K-edge X-ray absorption near-edge structure (XANES) spectroscopy study. J. Plant Nutr. Soil Sci. 2008, 171, 613–620. [Google Scholar] [CrossRef]
  5. Eveborn, D.; Gustafsson, J.P.; Hesterberg, D.; Hillier, S. XANES speciation of P in environmental samples: An assessment of filter media for on-site wastewater treatment. Environ. Sci. Technol. 2009, 43, 6515–6521. [Google Scholar] [CrossRef]
  6. Prietzel, J.; Klysubun, W.; Werner, F. Speciation of phosphorus in temperate zone forest soils as assessed by combined wet-chemical fractionation and XANES spectroscopy. J. Plant Nutr. Soil Sci. 2016, 179, 168–185. [Google Scholar] [CrossRef]
  7. Abdala, D.B.; Northrup, P.A.; Vicentin, F.C.; Sparks, D.L. Residence time and pH effects on the bonding configuration of orthophosphate surface complexes at the goethite/water interface as examined by Extended X-ray Absorption Fine Structure (EXAFS) spectroscopy. J. Colloid Interface Sci. 2015, 442, 15–21. [Google Scholar] [CrossRef] [PubMed]
  8. Newville, M. Fundamentals of XAFS. Rev. Miner. Geochem. 2014, 78, 33–74. [Google Scholar] [CrossRef]
  9. Rehr, J.J.; Albers, R.C. Theoretical approaches to x-ray absorption fine structure. Rev. Mod. Phys. 2000, 72, 621–654. [Google Scholar] [CrossRef]
  10. Trevorah, R.M.; Chantler, C.T.; Schalken, M.J. Solving self-absorption in fluorescence. IUCrJ 2019, 6, 1–17. [Google Scholar] [CrossRef]
  11. Tröger, L.; Arvanitis, D.; Baberschke, K.; Michaelis, H.; Grimm, U.; Zschech, E. Full correction of the self-absorption in soft-fluorescence extended x-ray-absorption fine structure. Phys. Rev. B 1992, 46, 3283–3289. [Google Scholar] [CrossRef]
  12. Booth, C.H.; Bridges, F. Improved SelfAbsorption Correction for Fluorescence Measurements of Extended XRay Absorption FineStructure. Phys. Scr. 2005, 2005, 202. [Google Scholar] [CrossRef]
  13. Goulon, J.; Goulon-Ginet, C.; Cortes, R.; Dubois, J.M. On experimental attenuation factors of the amplitude of the EXAFS oscillations in absorption, reflectivity and luminescence measurements. J. Phys. 1982, 43, 539–548. [Google Scholar] [CrossRef]
  14. Kelly, S.D.; Hesterberg, D.; Ravel, B. Analysis of Soils and Minerals Using X-ray Absorption Spectroscopy. In Methods of Soil Analysis Part 5—Mineralogical Methods; Ulery, A.L., Drees, L.R., Eds.; Soil Science Society of America: Madison, WI, USA; pp. 387–464. ISBN 978-0-89118-857-5.
  15. Meitzner, G.D.; Fischer, D.A. Distortions of fluorescence yield X-ray absorption spectra due to sample thickness. Microchem. J. 2002, 71, 281–286. [Google Scholar] [CrossRef]
  16. Hesterberg, D. Macroscale Chemical Properties and X-Ray Absorption Spectroscopy of Soil Phosphorus; Elsevier Masson SAS: Amsterdam, The Netherlands, 2010; Volume 34, ISBN 9780444532619. [Google Scholar]
  17. Prietzel, J.; Harrington, G.; Häusler, W.; Heister, K.; Werner, F.; Klysubun, W. Reference spectra of important adsorbed organic and inorganic phosphate binding forms for soil P speciation using synchrotron-based K-edge XANES spectroscopy. J. Synchrotron Radiat. 2016, 23, 532–544. [Google Scholar] [CrossRef] [PubMed]
  18. Werner, F.; Prietzel, J. Standard Protocol and Quality Assessment of Soil Phosphorus Speciation by P K-Edge XANES Spectroscopy. Environ. Sci. Technol. 2015, 49, 10521–10528. [Google Scholar] [CrossRef] [PubMed]
  19. Ajiboye, B.; Akinremi, O.O.; Hu, Y.; Flaten, D.N. Phosphorus Speciation of Sequential Extracts of Organic Amendments Using Nuclear Magnetic Resonance and X-ray Absorption Near-Edge Structure Spectroscopies. J. Environ. Qual. 2007, 36, 1563. [Google Scholar] [CrossRef]
  20. Toor, G.S.; Hunger, S.; Peak, J.D.; Sims, J.T.; Sparks, D.L. Advances in the Characterization of Phosphorus in Organic Wastes: Environmental and Agronomic Applications. Adv. Agron. 2006, 89, 1–72. [Google Scholar]
  21. Pierzynski, G.M.; Logan, T.J.; Traina, S.J.; Bigham, J.M. Phosphorus Chemistry and Mineralogy in Excessively Fertilized Soils: Descriptions of Phosphorus-rich Particles. Soil Sci. Soc. Am. J. 1990, 54, 1583. [Google Scholar] [CrossRef]
  22. Ajiboye, B.; Akinremi, O.O.; Hu, Y.; Jürgensen, A. XANES Speciation of Phosphorus in Organically Amended and Fertilized Vertisol and Mollisol. Soil Sci. Soc. Am. J. 2008, 72, 1256. [Google Scholar] [CrossRef]
  23. Siebers, N.; Kruse, J.; Leinweber, P. Speciation of phosphorus and cadmium in a contaminated soil amended with bone char: Sequential fractionations and XANES spectroscopy. Water. Air. Soil Pollut. 2013, 224, 1564. [Google Scholar] [CrossRef]
  24. Prietzel, J.; Prater, I.; Colocho Hurtarte, L.C.; Hrbáček, F.; Klysubun, W.; Mueller, C.W. Site conditions and vegetation determine phosphorus and sulfur speciation in soils of Antarctica. Geochim. Cosmochim. Acta 2019, 246, 339–362. [Google Scholar] [CrossRef]
  25. Kruse, J.; Abraham, M.; Amelung, W.; Baum, C.; Bol, R.; Kühn, O.; Lewandowski, H.; Niederberger, J.; Oelmann, Y.; Rüger, C.; et al. Innovative methods in soil phosphorus research: A review. J. Plant Nutr. Soil Sci. 2015, 178, 43–88. [Google Scholar] [CrossRef] [Green Version]
  26. Ajiboye, B.; Akinremi, O.O.; Jürgensen, A. Experimental Validation of Quantitative XANES Analysis for Phosphorus Speciation. Soil Sci. Soc. Am. J. 2007, 71, 1288. [Google Scholar] [CrossRef]
  27. Alvarez, R.; Evans, L.A.; Milham, P.J.; Wilson, M.A. Effects of humic material on the precipitation of calcium phosphate. Geoderma 2004, 118, 245–260. [Google Scholar] [CrossRef]
  28. Güngör, K.; Jürgensen, A.; Karthikeyan, K.G. Determination of Phosphorus Speciation in Dairy Manure using XRD and XANES Spectroscopy. J. Environ. Qual. 2007, 36, 1856. [Google Scholar] [CrossRef]
  29. de Queiroz Paiva, A. Solos Carbonático-Fosfáticos do Platô de Irecê, BA: Genese, Mineralogia e Geoquimica; Universidade Federal de Vicosa: Viçosa-MG, Brazil, 2010. [Google Scholar]
  30. Ravel, B.; Newville, M. ATHENA, ARTEMIS, HEPHAESTUS: Data analysis for X-ray absorption spectroscopy using IFEFFIT. J. Synchrotron Radiat. 2005, 12, 537–541. [Google Scholar] [CrossRef]
  31. Demirkiran, H.; Hu, Y.; Zuin, L.; Appathurai, N.; Aswath, P.B. XANES analysis of calcium and sodium phosphates and silicates and hydroxyapatite-Bioglass®45S5 co-sintered bioceramics. Mater. Sci. Eng. C 2011, 31, 134–143. [Google Scholar] [CrossRef]
  32. Sato, S.; Neves, E.G.; Solomon, D.; Liang, B.; Lehmann, J. Biogenic calcium phosphate transformation in soils over millennial time scales. J. Soils Sediments 2009, 9, 194–205. [Google Scholar] [CrossRef]
  33. Khare, N.; Hesterberg, D.; Beauchemin, S.; Wang, S.-L. XANES Determination of Adsorbed Phosphate Distribution between Ferrihydrite and Boehmite in Mixtures. Soil Sci. Soc. Am. J. 2004, 68, 460. [Google Scholar] [CrossRef]
  34. Team, R.C. R: A Language and Environment for Statistical Computing. R Foundation for Statistical Computing: Vienna, Austria, 2018. Available online: https://www.r-bloggers.com/its-easy-to-cite-and-reference-r/ (accessed on 6 September 2019).
  35. Leri, A.C.; Hay, M.B.; Lanzirotti, A.; Rao, W.; Myneni, S.C.B. Quantitative determination of absolute organohalogen concentrations in environmental samples by X-ray absorption spectroscopy. Anal. Chem. 2006, 78, 5711–5718. [Google Scholar] [CrossRef] [PubMed]
  36. Le Guillou, C.; Bernard, S.; De La Pena, F.; Le Brech, Y. XANES-Based Quantification of Carbon Functional Group Concentrations. Anal. Chem. 2018, 90, 8379–8386. [Google Scholar] [CrossRef] [PubMed]
  37. Calvin, S. XAFS for Everyone; CRC Press Taylor and Francis: Boca Raton, FL, USA, 20 May 2013; ISBN 9781439878644. [Google Scholar]
  38. Khare, N.; Martin, J.D.; Hesterberg, D. Phosphate bonding configuration on ferrihydrite based on molecular orbital calculations and XANES fingerprinting. Geochim. Cosmochim. Acta 2007, 71, 4405–4415. [Google Scholar] [CrossRef]
  39. Beauchemin, S.; Hesterberg, D.; Chou, J.; Beauchemin, M.; Simard, R.R.; Sayers, D.E. Speciation of Phosphorus in Phosphorus-Enriched Agricultural Soils Using X-Ray Absorption Near-Edge Structure Spectroscopy and Chemical Fractionation. J. Environ. Qual. 2003, 32, 1809. [Google Scholar] [CrossRef] [PubMed]
  40. Liu, J.; Hu, Y.; Yang, J.; Abdi, D.; Cade-Menun, B.J. Investigation of Soil Legacy Phosphorus Transformation in Long-Term Agricultural Fields Using Sequential Fractionation, P K-edge XANES and Solution P NMR Spectroscopy. Environ. Sci. Technol. 2015, 49, 168–176. [Google Scholar] [CrossRef] [PubMed]
  41. Bauke, S.L.; von Sperber, C.; Siebers, N.; Tamburini, F.; Amelung, W. Biopore effects on phosphorus biogeochemistry in subsoils. Soil Biol. Biochem. 2017, 111, 157–165. [Google Scholar] [CrossRef]
  42. Egger, M.; Jilbert, T.; Behrends, T.; Rivard, C.; Slomp, C.P. Vivianite is a major sink for phosphorus in methanogenic coastal surface sediments. Geochim. Cosmochim. Acta 2015, 169, 217–235. [Google Scholar] [CrossRef] [Green Version]
  43. Seiter, J.M.; Staats-Borda, K.E.; Ginder-Vogel, M.; Sparks, D.L. XANES Spectroscopic Analysis of Phosphorus Speciation in Alum-Amended Poultry Litter. J. Environ. Qual. 2008, 37, 477. [Google Scholar] [CrossRef]
  44. Xu, X.; Thornton, P.E.; Post, W.M. A global analysis of soil microbial biomass carbon, nitrogen and phosphorus in terrestrial ecosystems. Glob. Ecol. Biogeogr. 2013, 22, 737–749. [Google Scholar] [CrossRef]
  45. Klysubun, W.; Tarawarakarn, P.; Thamsanong, N.; Amonpattaratkit, P.; Cholsuk, C.; Lapboonrueng, S.; Chaichuay, S.; Wongtepa, W. Upgrade of SLRI BL8 beamline for XAFS spectroscopy in a photon energy range of 1–13 keV. Radiat. Phys. Chem. 2019. [Google Scholar] [CrossRef]
  46. Petric, M.; Bohinc, R.; Bučar, K.; Žitnik, M.; Szlachetko, J.; Kavčič, M. Chemical state analysis of phosphorus performed by X-ray emission spectroscopy. Anal. Chem. 2015, 87, 5632–5639. [Google Scholar] [CrossRef] [PubMed]
Figure 1. Linear correlation between the total P concentration in the standard mixtures (from 1 to 75 mmol kg−1) and the absolute area of the spectrum until 2186 eV (colored area). After 75 mmol kg−1 the correlation between concentration and area is not linear anymore, indicating that the spectra were damped by self-absorption.
Soilsystems 03 00061 g001
Figure 2. Exemplary P K-edge XANES spectra, linear combination (LC) fits and residuals using (A) non-optimized and (B) optimized background subtraction and normalization parameters of the standard mixtures. Samples were diluted with BN to the following concentrations: 1, 50, 400, and 6480 mmol kg−1. All fits were selected by the least R factor of a fitting procedure, according to Werner et al. [18]. Note the lower residuals of the background subtraction and normalization optimized spectra.
Soilsystems 03 00061 g002
Figure 3. Exemplary P K-edge XANES spectra, LC fits and residuals using (A) non-optimized and (B) optimized background subtraction and normalization parameters of the Irece soil sample. Samples were diluted with BN to the following concentrations: 1, 50, 400, and 900 mmol kg−1. All fits were selected by the least R factor of a fitting procedure, according to Werner et al. [18]. Note the lower residuals and more consistent results of the background subtraction and normalization optimized spectra.
Soilsystems 03 00061 g003
Figure 4. Comparison between the LC fit results across the concentrations between 1 to 300 mmol kg−1 P on the (A) standard mixtures and on the (B) Irecê soil sample. The selected range includes both a region where self-absorption is neglectable (1 to 75 mmol kg−1 P) and above the optimum concentration. Note that the results given by the optimized LC fitting are less variable across the different concentrations.
Soilsystems 03 00061 g004
Table 1. Comparison of results from linear combination fitting and its relative deviation from the expected total P proportions using non-optimized and optimized values for background subtraction and normalization on a 1:1:1 ternary mixture of aluminum phosphate (Al–P, 33%), iron phosphate (Fe–P, 33%), and calcium hydrogen phosphate (Ca–P, 33%) diluted in boron nitride from 1 to 6840 mmol kg−1. Absolute means and standard deviation of each component are presented.
P Content (mmol kg−1)Non-Optimized ValuesRelative Deviation from Total PR-FactorOptimized ValuesRelative Deviation from Total PR-Factor
FeP *AlP *CaP *FePAlPCaP FePAlPCaPFePAlPCaP
% %
108317−33+50−160.0283422930+9−4−30.0067
6.25195327−14+20−60.0044422434+9−9+10.0030
12.557043+24−33+100.0196293139−4−2+60.0041
2553047+20−33+140.0048342442+1−9+90.0031
50313138−2−2+50.0016313138−2−2+50.0016
75323434−1+1+10.001233333400+10.0012
10066925−27+36−80.0020254431−8+11−20.0009
30007426−33+41−70.0036184834−15+15+10.0011
40008515−33+52−180.035708119−33+48−140.0132
100007624−33+43−90.015907129−33+38−40.0041
684007525−33+42−80.070307129−33+38−40.0435
Mean:185329 234433
SD:223210 16216
FeP *: iron(III) phosphate; AlP *: aluminum phosphate; CaP *: calcium hydrogen phosphate.
Table 2. Comparison of results from linear combination fitting using non-optimized and optimized values for background subtraction and normalization on a BN diluted soil sample from Lapão, Bahia, Brazil (initial P content 947.92 mmol kg−1). Concentrations ranging from 1 to 947.92 mmol kg−1 P.
P Content (mmol kg−1)Non-Optimized ValuesR-FactorOptimized ValuesR-Factor
TCP *ApatiteStrengiteTCP *ApatiteStrengite
% %
15123270.0382832461140.004991
6.252858130.01388909460.001992
12.52266120.007424010000.000994
25177490.005962010000.000927
502458180.014383089110.001857
754041190.022008177390.001701
1003746170.020679187480.002005
2003248200.023714089110.001978
3003944170.020381197380.001511
4003345220.023067089110.001858
9004239190.027448147880.001190
Mean:334917 8838
SD:10145 10114
* TCP: β-tricalcium phosphate.

