Article

Effect of Cover Crop on Carbon Distribution in Size and Density Separated Soil Aggregates

by
Michael V. Schaefer
1,2,
Nathaniel A. Bogie
3,4,
Daniel Rath
5,
Alison R. Marklein
1,6,
Abdi Garniwan
1,
Thomas Haensel
1,
Ying Lin
7,
Claudia C. Avila
1,
Peter S. Nico
6,
Kate M. Scow
5,8,
Eoin L. Brodie
6,9,
William J. Riley
6,
Marilyn L. Fogel
7,10,
Asmeret Asefaw Berhe
3,
Teamrat A. Ghezzehei
3,
Sanjai Parikh
5,
Marco Keiluweit
11 and
Samantha C. Ying
1,12,*
1
Department of Environmental Sciences, University of California, Riverside, CA 92521, USA
2
Pacific Basin Research Center, Soka University of America, Laguna Hills, CA 92656, USA
3
Environmental System, University of California, Merced, CA 95343, USA
4
Geology Department, San Jose State University, San Jose, CA 95192, USA
5
Department of Land, Air, and Water Resource, University of California, Davis, CA 95616, USA
6
Earth and Environmental Sciences, Lawrence Berkeley National Laboratory, Berkeley, CA 94720, USA
7
Environmental Dynamics and GeoEcology Institute, University of California, Riverside, CA 92521, USA
8
Agricultural Sustainability Institute, University of California, Davis, CA 95616, USA
9
Department of Environmental Science, Policy and Management, University of California, Berkeley, CA 94720, USA
10
Department of Earth and Planetary Sciences, University of California, Riverside, CA 92521, USA
11
School of Earth & Sustainability and Stockbridge School of Agriculture, University of Massachusetts, Amherst, MA 01003, USA
12
California Agriculture and Food Enterprise Institute, University of California, Riverside, CA 92521, USA
*
Author to whom correspondence should be addressed.
Soil Syst. 2020, 4(1), 6; https://doi.org/10.3390/soilsystems4010006
Submission received: 19 October 2019 / Revised: 21 December 2019 / Accepted: 8 January 2020 / Published: 15 January 2020
(This article belongs to the Special Issue Soil Organic Matter Dynamics)

Abstract

:
Increasing soil organic carbon (SOC) stocks in agricultural soils can contribute to stabilizing or even lowering atmospheric greenhouse gas (GHG) concentrations. Cover crop rotation has been shown to increase SOC and provide productivity benefits for agriculture. Here we used a split field design to evaluate the short-term effect of cover crop on SOC distribution and chemistry using a combination of bulk, isotopic, and spectroscopic analyses of size-and density-separated soil aggregates. Macroaggregates (>250 µm) incorporated additional plant material with cover crop as evidenced by more negative δ13C values (−25.4‰ with cover crop compared to −25.1‰ without cover crop) and increased phenolic (plant-like) resonance in carbon NEXAFS spectra. Iron EXAFS data showed that the Fe pool was composed of 17–21% Fe oxide with the remainder a mix of primary and secondary minerals. Comparison of oxalate and dithionite extractions suggests that cover crop may also increase Fe oxide crystallinity, especially in the dense (>2.4 g cm−3) soil fraction. Cover crop δ13C values were more negative across density fractions of bulk soil, indicating the presence of less processed organic carbon. Although no significant difference was observed in bulk SOC on a mass per mass basis between cover and no cover crop fields after one season, isotopic and spectroscopic data reveal enhanced carbon movement between aggregates in cover crop soil.

1. Introduction

Efforts to sequester carbon (C) in soil, such as the four per mille soil carbon campaign [1], utilize agricultural soil management practices to increase soil organic C (SOC) stocks and offset some portion of greenhouse gas (GHG) emissions. Central to this strategy is planting cover crop (CC), which may increase SOC stocks and is estimated to potentially compensate for up to 8% of direct agricultural GHG emissions [2]. Recent calculations show that agricultural land management, of which CC plays a key role, has the potential to lower Earth’s surface temperatures by 0.1–0.26 °C under various implementations and climate projection scenarios [3].
A critical component of overall soil health, and especially increasing SOC storage, is soil aggregation. Aggregation affects the capacity of soils to retain carbon, nutrients, and water, and CC rotation is one strategy to promote soil aggregation and structure while providing C inputs to soil [4]. For example, growth of CC has been shown to increase wet soil aggregate mean weight diameter (MWD) by 55% (0–10 cm) after four years in no-till corn fields [5]. Previous studies of aggregation and CC have largely focused on changes in the distribution of size-defined water stable aggregates following a change in management. For example, winter wheat and dandelion led to similar increases in water stable soil aggregates compared to fallow soil after a single season of CC [6], and two seasons of grass CC led to decreased slaking of macroaggregates [7]. However, little is known about the mechanisms and time frames of aggregate formation, destruction, and reformation or how CC or other management practices impact this cycle.
Carbon addition to soil with CC is achieved both through increased root growth and incorporation of above-ground biomass into soil during tillage. A study using 13C-labeled hairy vetch showed that root-C contributed >10 times more C to soil than residue-C at the end of the growing season [8]. A subsequent study highlighted the importance of microbial communities and their microenvironments (e.g., soil aggregate size) on rhizodeposition of C [9].
Carbon and iron (Fe) are essential soil nutrients that play key roles in formation and stability of soil aggregates [10,11]. For example, organic matter associated with poorly crystalline Fe minerals has been shown to be more resistant to microbial degradation [12], and poorly crystalline Fe oxides are more effective than crystalline oxides at stabilizing soil aggregates [13]. The concentrations and chemical composition of C and Fe species in different soil aggregate fractions and their role in driving aggregate formation and stability remain poorly understood, especially in agricultural soils where CC, especially CC roots, may provide a “pipeline” for C incorporation into soil.
If cover crops support C incorporation into aggregates, it may serve as an efficient C sink because decomposition rates of C are reduced within aggregates [14]. However, root addition has also been shown to destroy protective mineral-organic associations [15]. Therefore, the objective of this study was to analyze the chemical distribution and composition of C and Fe in soil aggregates from a short-term (1 year) field experiment that differed only by the presence of CC. Samples in this study were taken prior to CC incorporation to isolate the effect of CC roots on SOC and aggregate changes.

2. Materials and Methods

2.1. Field Setting and Sample Collection

Soil samples were collected at the Russell Ranch Sustainable Agricultural Facility from fields developed on Rincon silty clay loam (fine, montmorillonitic, thermic Mollic Haploxeralf). Fields were irrigated using subsurface drip application and planted with processing tomatoes in 2015, left fallow, then planted with processing tomatoes again in 2016. Following harvest in 2016, the field was divided so that half was left fallow and the other half planted with cover crop consisting of a mix of vetch (Vicia villosa), bell bean (Vicia faba), and Austrian pea (Pisum sativum). Planting cover crop resulted in an additional mechanical disturbance compared to no cover crop. Soil samples were collected from the top 10 cm of both fallow and cover crop fields in March 2017 prior to incorporation of cover crop. Four locations in each field were selected for sampling, and at each location four soil cores were composited to create a single field replicate sample at each location. The two treatments are referred to as NCC (no cover crop) and CC (cover crop). Soil pH measured at the time of soil collection was 7.04 ± 0.02 for CC and 7.43 ± 0.02 for NCC.

2.2. Aggregate Size Separation

Samples were separated into size classes of water stable aggregates following the method of Six [16]. Briefly, field-moist samples were passed through an 8 mm sieve to remove gravel and large plant material then air dried before aggregate size separation. Subsamples of field fresh samples were weighed and oven dried to obtain their water contents. Aggregates were then submerged (slaked) and moved in and out of water at a rate of 25 cycles min−1 for two minutes in a 2 mm sieve. The process was then repeated using 250 µm and 53 µm sieves on the soil that passed through the 2 mm sieve. Fractions retained on sieves were dried in an oven at 50 °C, weighed to determine mass proportions of each size fraction, and stored in glass vials for further analysis. Mass recovery as calculated by comparing the sum of fraction masses to the initial soil mass was typically 98–100%.

2.3. Aggregate Density Separation

Bulk soil samples and micro-(<53 and 53–250 µm) and macro-aggregates (250–2000 µm) from the 0–10 cm sampling interval were separated into density fractions of <1.65, 1.65–2.4, and >2.4 g cm−3 using sodium polytungstate (SPT) solutions [17,18,19]. Briefly, 3 g of sample was suspended in 12 mL of 1.65 g cm−3 SPT solution and gently dispersed on a shaker table operating at 60 rpm for 2 h. The suspension was then centrifuged at 2000 × g for 30 min. The material that did not settle (i.e., material with a density <1.65 g cm−3) and the solution were removed with a transfer pipette and filtered through a pre-weighed mixed cellulose ester (MCE) filter (pore size 0.45 micron) using a vacuum filtration apparatus. Each sample was washed with >40 mL of DI water to remove excess SPT. The remaining material (density >1.65 g cm−3) was resuspended in 12 mL of SPT solution with density of 2.4 g cm−3, shaken at 60 rpm for 2 h, and centrifuged at 2000 × g. The non-settling fraction was removed, filtered, and washed. The settled fraction (2.4 g cm−3) was washed three times with DI water to remove excess SPT. Fractions were then freeze dried and weighed to determine mass distribution in each fraction. The particles separated into these fractions are termed “light”, “intermediate”, and “heavy” fractions and represent free particulate organic matter (POM), OM co-precipitated with metal (hydr) oxides, and OM coated on mineral surfaces, respectively [17,18,19,20,21].

2.4. Elemental and Isotopic Analysis

Bulk elemental analysis for samples with sufficient mass available was determined using energy dispersive X-ray fluorescence (ED-XRF) spectroscopy (Spectro XEPOS). A finely ground sample (~2 g) was placed in a plastic cup fitted with a thin layer of polypropylene Prolene film (Chemplex). X-rays were generated with a 50-watt X-ray tube and fluorescent X-rays were detected on five energy targets to cover the elemental range from sodium to uranium. Measurements were performed in a He atmosphere to minimize X-ray attenuation between the sample and target. Bulk elemental abundance was calculated based on the intensity of the characteristic fluorescent X-rays of each element.
Carbon and nitrogen content and δ13C and δ13N values of samples were determined by combusting the finely ground sample using a Costech ECS 4010 CHNSO Analyzer coupled to a Thermo Scientific Delta V Advantage Isotope Ratio Mass Spectrometer at the UC Riverside EDGE Institute stable isotope laboratory. Depending on the carbon content of the soil, 10 to 25 mg of sample was weighed into 5 × 9 mm tin capsules and measured relative to acetanilide, glycine, peach leaves (NIST1547) and an internal soil laboratory standard as reference materials. The stable isotope ratios are presented using the δ notation (per mill, ‰) as δ13C and δ15N calculated as: δ = [(R_sample − R_standard)⁄R_standard] × 1000‰; where R is ratio of 13C⁄12C for δ13C, and 15N⁄14N for δ15N. The international measurement standards used in the δ notation are atmospheric N2 for δ15N and Vienna Pee Dee Belemnite (VPDB) for δ13C. Precisions for δ15N and δ13C are 0.2 and 0.1 ‰, respectively.

2.5. X-ray Absorption Spectroscopy

Bulk C 1s near edge X-ray absorption fine structure (NEXAFS) spectra were collected at the high resolution spherical grating monochromator (SGM) beamline (11ID-1) at the Canadian Light Source (CLS) [22]. Subsamples of dried material (<50 mg) were suspended in ~1 mL of deionized water in a microcentrifuge tube and briefly mixed on a vortex mixer. Following homogenization, 10–30 µL of the suspension was dropped onto gold-coated Si wafers and allowed to dry. Samples were affixed to an aluminum holder using carbon tape and inserted into the beamline under vacuum (~10−7 torr). Samples were scanned from 270 to 320 eV in continuous (fast) scan mode. Each scan lasted 60 s and typically 30 scans were collected per sample. The beam was moved to a fresh area of the sample between each scan to minimize data artifacts associated with beam damage to the sample [23]. Fast scan data were averaged and binned into 1 eV steps using macros (SGMPy) developed at SGM implemented in NeXpy software (http://nexpy.github.io/nexpy/). Effects of X-ray scattering were removed by normalizing to the scattering spectrum of a blank gold-coated Si wafer, and energy was calibrated to the carboxylic peak of citric acid set to 288.5 eV. Spectra were normalized to an edge jump of unity by fitting functions to pre-and post-edge regions of the spectra in Athena Software [24]. Spectral deconvolution was performed on normalized spectra by fitting an arctangent function with fixed height of 1 to the ionization threshold at 290 eV, and fitting Gaussian peaks to spectral features with known energies. Gaussian energy positions and full width at half maximum (FWHM) values were fixed, and only peak height was allowed to float. Fits were optimized by minimizing the residual least-squares function within these constraints.
Bulk Fe K-edge extended x-ray absorption fine structure (EXAFS) spectroscopy was performed at the Stanford Synchrotron Radiation Lightsource (SSRL) Beamline 4-1. Energy was calibrated to the first inflection point of Fe foil and set to 7112 eV. A small amount of finely ground sample was packed into an aluminum sample plate between two pieces of 0.5 mil Kapton tape and placed at 45 degrees relative to the beam path under liquid nitrogen cryostat conditions (~77 K and 10−7 torr). Spectra were collected in 5 eV steps below the edge (6802–7092 eV), in 0.25 eV steps at the edge (7092–7142 eV), and in steps equivalent to 0.05 Å–1 above the edge to k = 13 Å–1. Fluorescent X-rays were detected with a passivated implanted planar silicon (PIPS) detector. Soller slits and a 3 absorption length Mn filter were used to reduce scattering and background signal.
Pre-and post-edge features were fit with linear and 3rd order functions, respectively, and background was fit using the Autoback function in Athena software. Data were transformed into k-space, weighted by k3, and fit in the range 3–12 Å−1. Experimental data were fit using a linear combination of standard spectra to minimize the least squares error. An initial set of 24 standards was used including Fe in oxides, hydroxides, oxyhydroxides, and sulfides; primary and secondary silicates, siderite (FeCO3) and vivianite (FePO4), and ferrous oxalate (FeC2O4). Non-relevant standards were eliminated from analysis step-wise and fits for each sample converged on a set of five common standards: goethite (α-FeOOH, synthesized), hornblende (amphibole, Stanford Mineral Collection), nontronite (Fe-rich smectite, NAu-2, Source Clay Repository), phlogopite (magnesium mica, Stanford Mineral Collection), and vermiculite (2:1 clay mineral, typical weathering product of phlogopite, Stanford Mineral Collection).

2.6. Chemical Extractions

Citrate-bicarbonate-dithionite (CBD) and ammonium oxalate extractions [25] were performed on bulk soil as well as size and density fractions. CBD extractions were performed by mixing 6.75 mL of 1 M NaHCO3 and 0.75 mL of 0.3 M NaC6H7O7 with 0.15 g of soil in a 15 mL Falcon centrifuge tube. Samples were mixed on a shaker table at 90 rpm and then equilibrated in a water bath at 80 °C. Samples were briefly removed from the bath to add 0.15 g of Na2S2O4 then placed back in the bath for 15 min with periodic mixing. This step was repeated with an additional 0.15 g of Na2S2O4 and mixed for 10 min. Samples were then cooled and centrifuged, and supernatant was filtered through 0.22-μm filter prior to analysis on ICP-OES.
Oxalate extractions were performed using ~0.25 g sample mixed with 10 mL of 0.2 M oxalate solution adjusted to pH 3 using 0.2 M oxalic acid. Samples were briefly mixed on a vortex agitator then placed on a rotary shaker (90 rpm) for 4 h in the dark. Samples were then centrifuged and supernatant filtered (0.22-μm) prior to analysis on ICP-OES.
Extractable Fe concentrations were determined using ICP-OES. Measured aqueous concentrations were converted to soil extractable mass concentrations and reported as mg Fe per kg dry soil. Analyses of bulk soil and size fractions were performed in triplicate. Density fraction samples were extracted in triplicate when sufficient sample was available, and duplicate when sample mass was limiting. Precision is reported as standard error of the mean.

2.7. Statistics

We performed the Shapiro-Wilk and Bartlett tests to determine normality and heteroskedasticity, respectively, for all data except spectroscopy data. For all analyses, the conditions for using parametric tests were not met, so we used the non-parametric Wilcoxon signed rank sum test to compare between the CC and NCC treatments.

3. Results

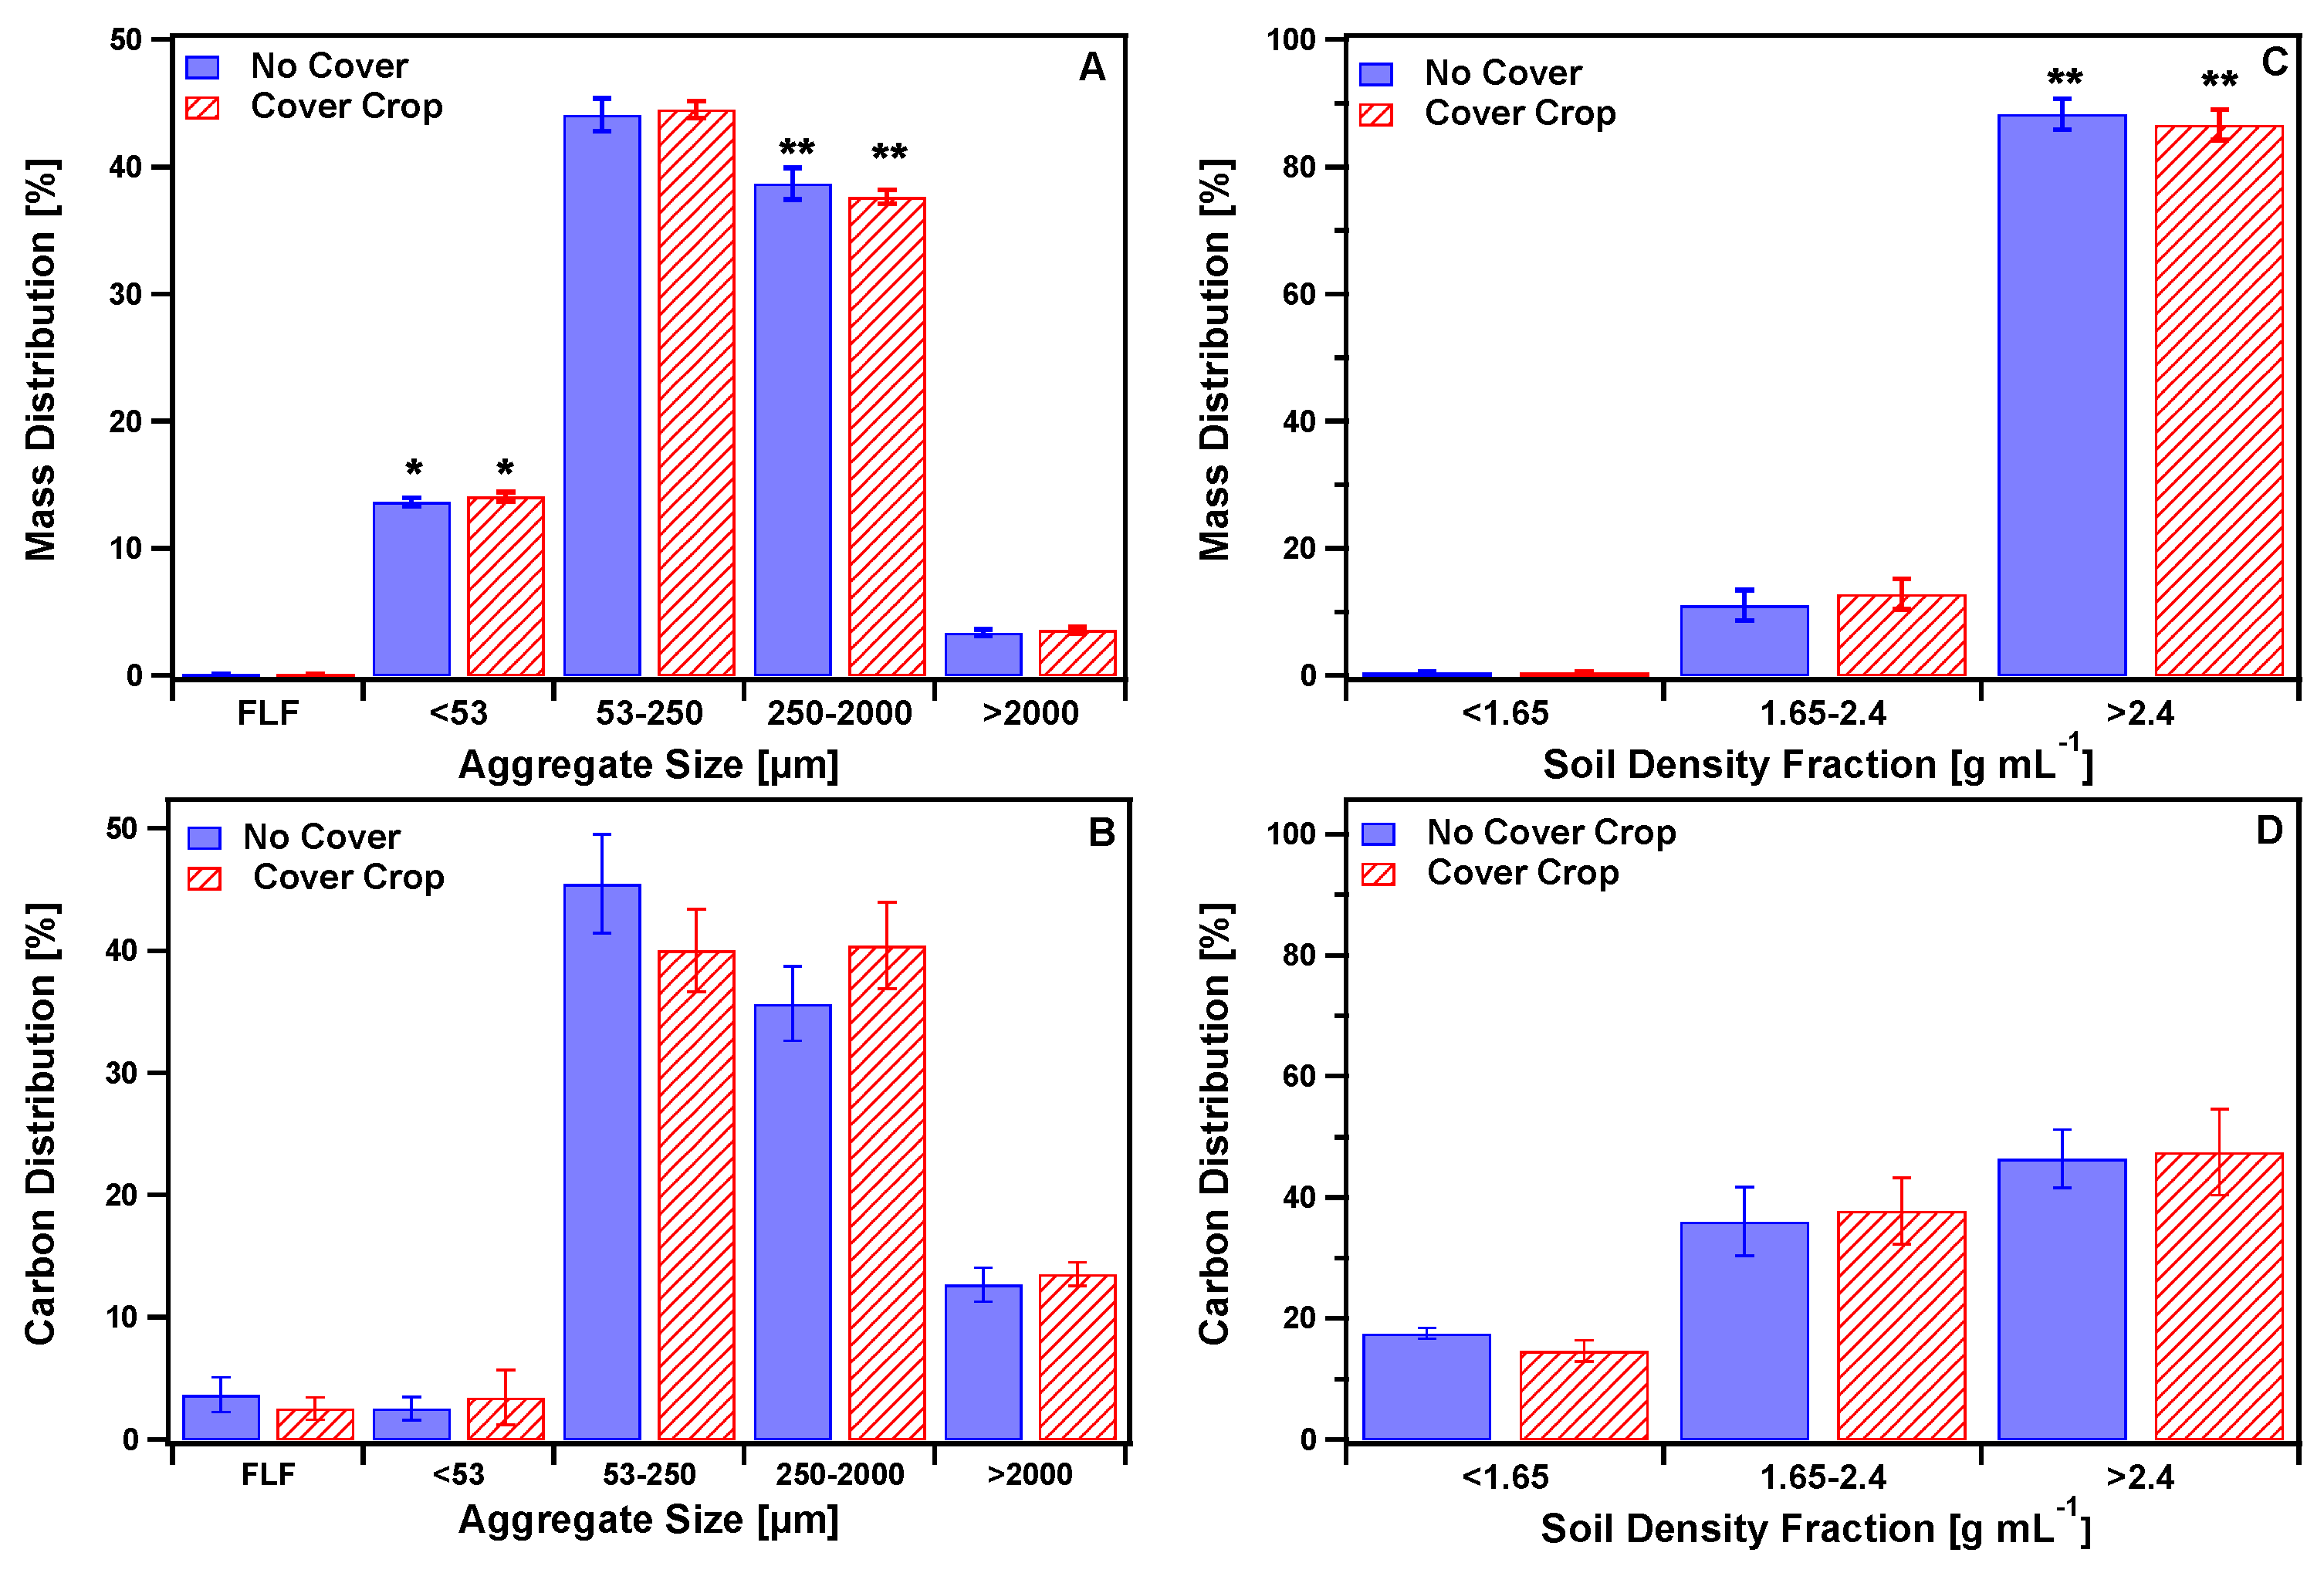
3.1. Mass, Carbon, and Nitrogen Distribution in Aggregates

3.1.1. Size Separated Aggregates

The mass distribution of size separated (wet sieved) soil aggregates was significantly different between CC and NCC only in the 250–2000 µm (p < 0.05) and <53 µm (p < 0.1) size fractions (Figure 1A). In the top 10 cm, soil was mainly composed of larger microaggregates (53–250 µm; 43.8% total, 44.5% CC and 43.0% NCC; p = 0.48) and smaller macroaggregates (250–2000 µm; 39.4% total; 37.7% CC and 41.1% NCC; p = 0.03). About 13% of soil mass was in microaggregates (<53 µm; 14.1% CC, 12.7% NC, 13.4% total; p = 0.057), ~3% in large macroaggregates (>2000 µm; 3.6% for CC; 3.0% for NCC; and 3.3% total; p = 0.34) and ~0.1% in the floating light fraction (Figure 1A; 0.1% CC; 0.1 NCC; 0.1% total; p = 0.88).
Carbon distribution was similar to mass distribution, with the majority of C contained in aggregates between 53 and 2000 µm (Figure 1C). Carbon distribution was not significantly different between NCC and CC treatments when comparing within an aggregate size fraction (Figure 1C). The C proportion of NCC was significantly different between 53 to 250 µm and 250 to 2000 µm but no difference in C allocation was observed between these two fractions with CC (Figure 1C). The free light fraction (FLF) and large macroaggregates (>2000 µm) had higher C content (mass percentage basis, Table 1) than small microaggregates (<53 µm), and thus even the small masses of the >2000 µm and FLF (Figure 1A) substantially contributed to the total C pool (Figure 1C). There were no significant differences between the %C in any of the size fractions or in the bulk soil between CC and NCC treatments (p > 0.1).
C:N ratios were not significantly different between CC and NCC soil for any aggregate size class or bulk soil (p > 0.1; Table 1). C:N ratios in the FLF were >20, indicating dominance of less degraded plant material, while the C:N ratio of all aggregate size fractions ranged between 9.8 and 12.7, indicating relatively processed organic matter compared to FLF.
Soil bulk chemical composition was similar between CC and NCC soils. Elemental composition was typical for this soil type with ~24% Si and 5% Fe and Al (Table 1). Elemental composition generally had little variation between aggregate sizes except for S content, which increased as aggregate size decreased (Table 1).

3.1.2. Density Separated Aggregates

The dense fraction (>2.4 g cm−3) contributed >80% of soil mass in both NCC and CC soils (Figure 1B) while the remainder of the soil mass was dominated by intermediate density aggregates with little mass in the light density fraction. The C content (mass C per mass dry soil basis) decreased as density fraction increased from light (26–38% C) to intermediate (2–7% C) to heavy (0.4–0.6% C) (Table 2). The light fraction contributed 15–18% of total soil C pool (Figure 1D) despite making up only ~0.5% of the soil mass (Figure 1C).

3.1.3. Sequential Size-Density Separation

Size-separated aggregate fractions were subsequently separated by density to determine C associations with mineral fractions within each aggregate size class. The mass distribution between density separations was similar across samples with <1% in the light fraction, 7–20% in the intermediate fraction, and 79–93% in the dense fraction (Table 2).
Carbon content of bulk soil was ~400 mg kg−1 higher in CC than in NCC, but this difference was not statistically significant (Table 1). The C content of the light density fraction of each size fraction was higher in CC than in NCC except for the <53 µm size fraction (Table 2). In the <53 µm size fraction, the intermediate density fraction had 7.2% in CC compared to 5.0% C in NCC (Table 2). Density separation was not performed on >2000 µm samples due to small mass recovery from wet sieving.

3.2. Carbon and Nitrogen Isotopes

Bulk soil under CC had more negative δ13C (−25.6‰) compared to NCC (−25.2‰) (p < 0.05, Table 1). Although δ13C become more similar between NCC and CC as aggregate size decreases, δ13C in CC remains lower than NCC in all size fractions, and is significantly different in the 250–2000 µm fraction (p < 0.05, Table 1). In the FLF, soil with CC had δ13C 4.8‰ lower than NCC soil (Table 1) but due to small sample recovery this value was determined based on a composite of replicate samples, and thus statistical tests do not provide additional information. In density separated bulk soil, δ13C of CC soil was lower (more negative) than NCC soil in all three density fractions; however, the δ13C values became more similar as density increased from 1.1‰ in <1.65 g cm−3 fraction to 0.5‰ in the 1.65–2.4 g cm−3 fraction to 0.1‰ in the >2.4 g cm−3 fraction (Table 2).
δ13C, δ15N, and C:N ratio were significantly different between CC and NCC in the 1.65–2.4 g cm−3 fraction of small microaggregates (<53 µm) (Table 2). Cover crop resulted in a δ13C value 0.3‰ more negative compared to NCC, an increase of 0.1‰ in δ15N, and an increase in C:N ratio of 1.1.
Lower δ15N values are consistent with an N fixation signal that could be attributed to the presence of legumes in CC. However, in the 1.65–2.4 g cm−3 fraction of small microaggregates (<53 µm) and >2.4 g cm−3 fraction of bulk soil, δ15N values were higher in CC than NCC soils (Table 2). Within a set of density fractions, δ15N values always increased with increasing density (Table 2).

3.3. X-ray Absorption Spectroscopy

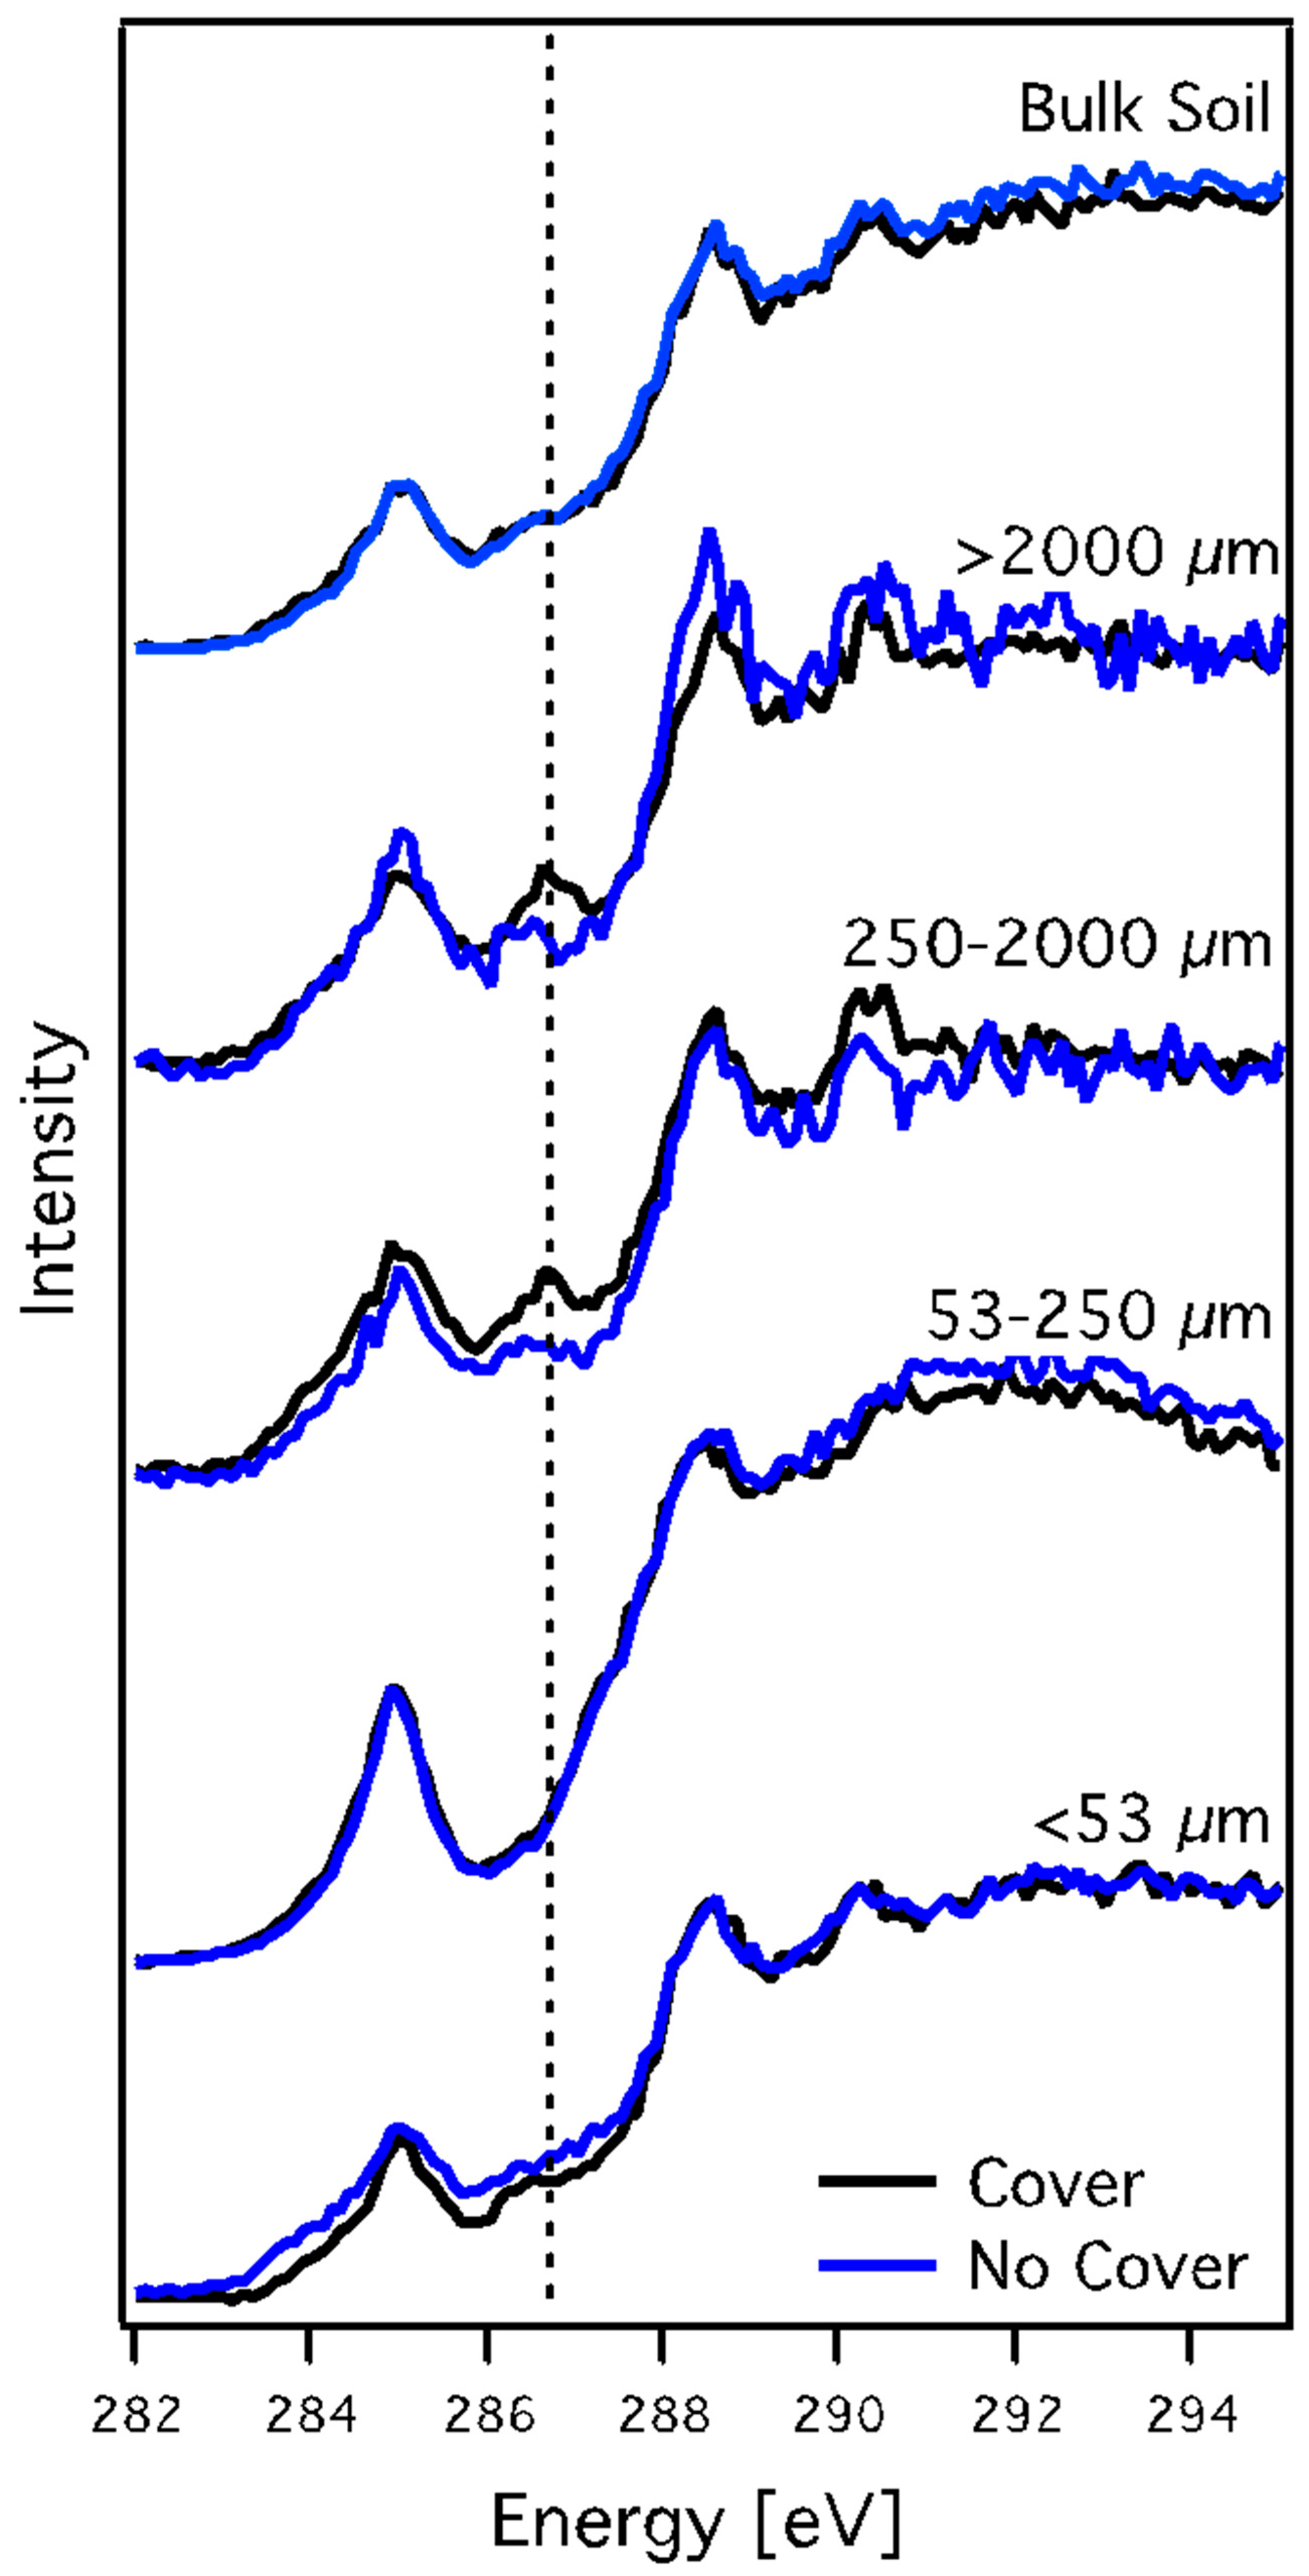
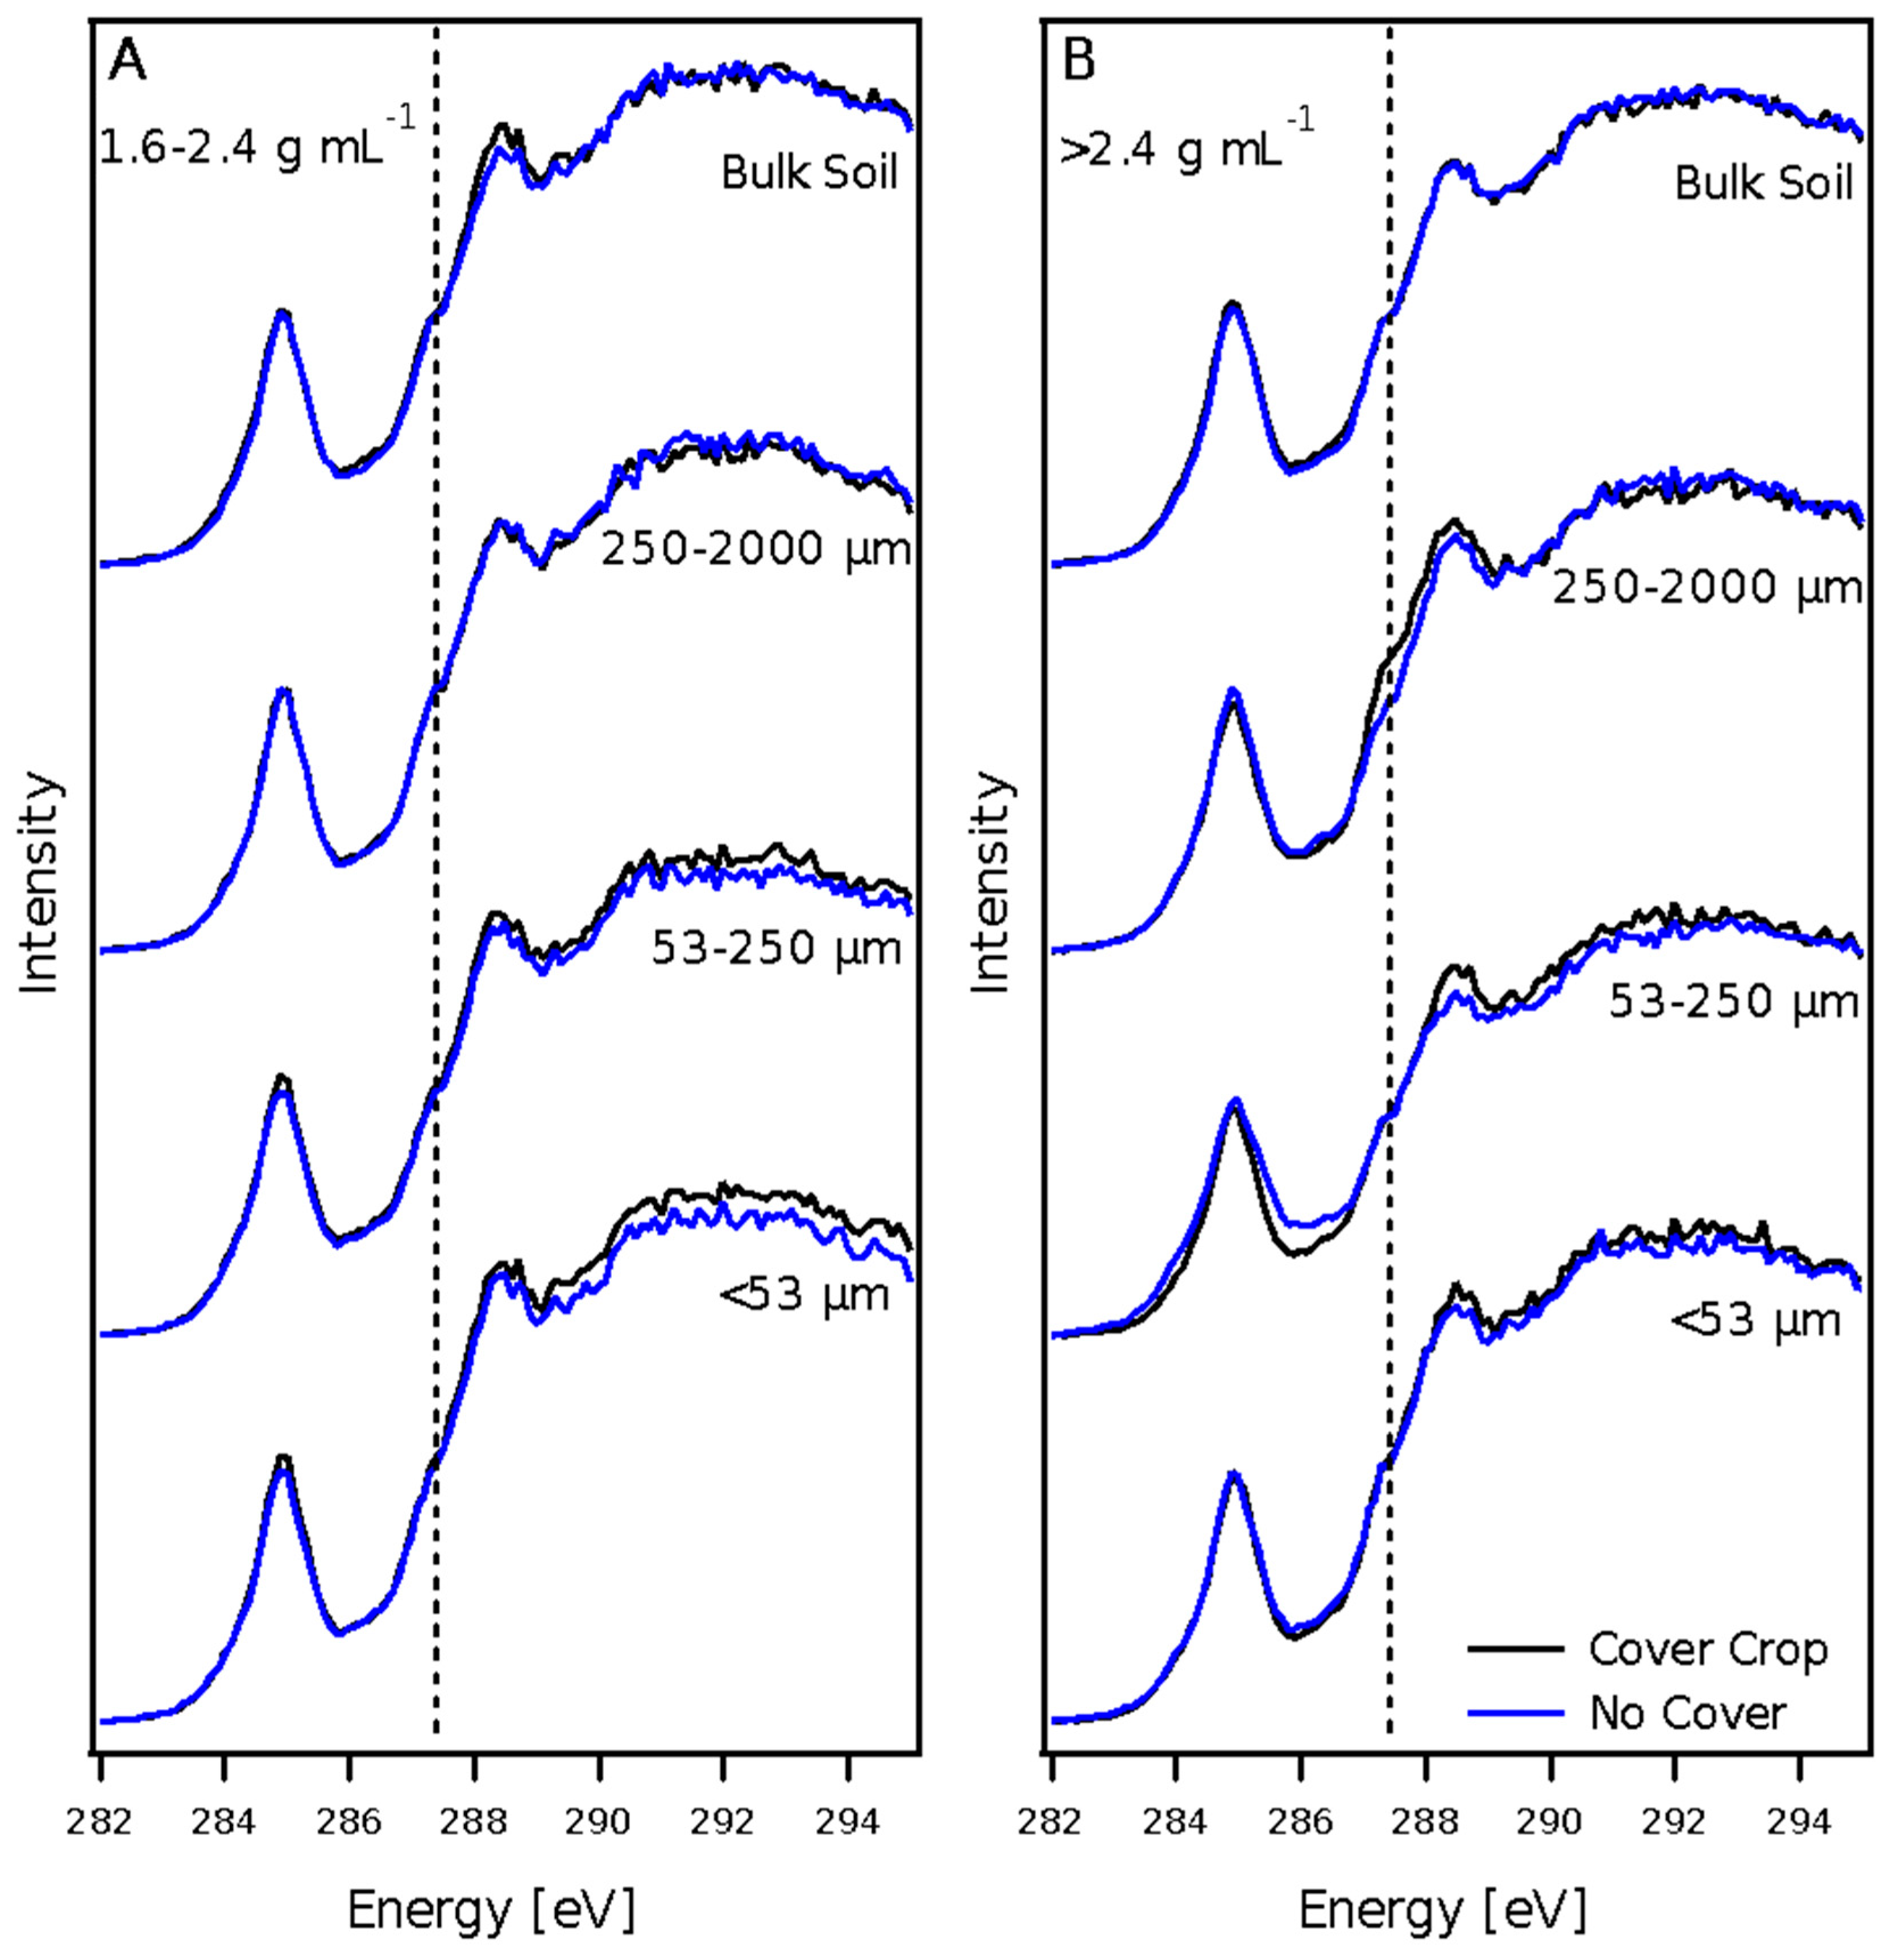
3.3.1. Carbon NEXAFS Spectroscopy

Carbon K-edge NEXAFS spectra of CC and NCC bulk soil were characterized by strong aromatic (285 eV) and carboxyl (288.5 eV) resonances, and also contained some carbonate signal (290.2 eV) (Figure 2). Spectra collected on size-separated microaggregates (<53 and 53–250 µm size fractions) are similar between CC and NCC soils and also exhibited strong aromatic and carboxyl resonances with a small carbonate peak in the <53 µm fraction (Figure 2). In both macroaggregate size fractions, a shifted and more intense phenolic (286.7 eV) resonance is observed in CC compared to NCC samples in addition to similar aromatic and carboxyl peaks (Figure 2).
Intermediate and heavy density fractions of bulk soil and stepwise size-density fractionated soil had similar C NEXAFS spectra between CC and NCC treatments (Figure 3). Compared to bulk soil samples, the intermediate density samples showed a stronger aliphatic resonance at 287.4 eV (Figure 2 and Figure 3). In the dense fraction of the 250–2000 µm size fraction, CC resulted in a stronger aliphatic resonance relative to NCC (Figure 3).

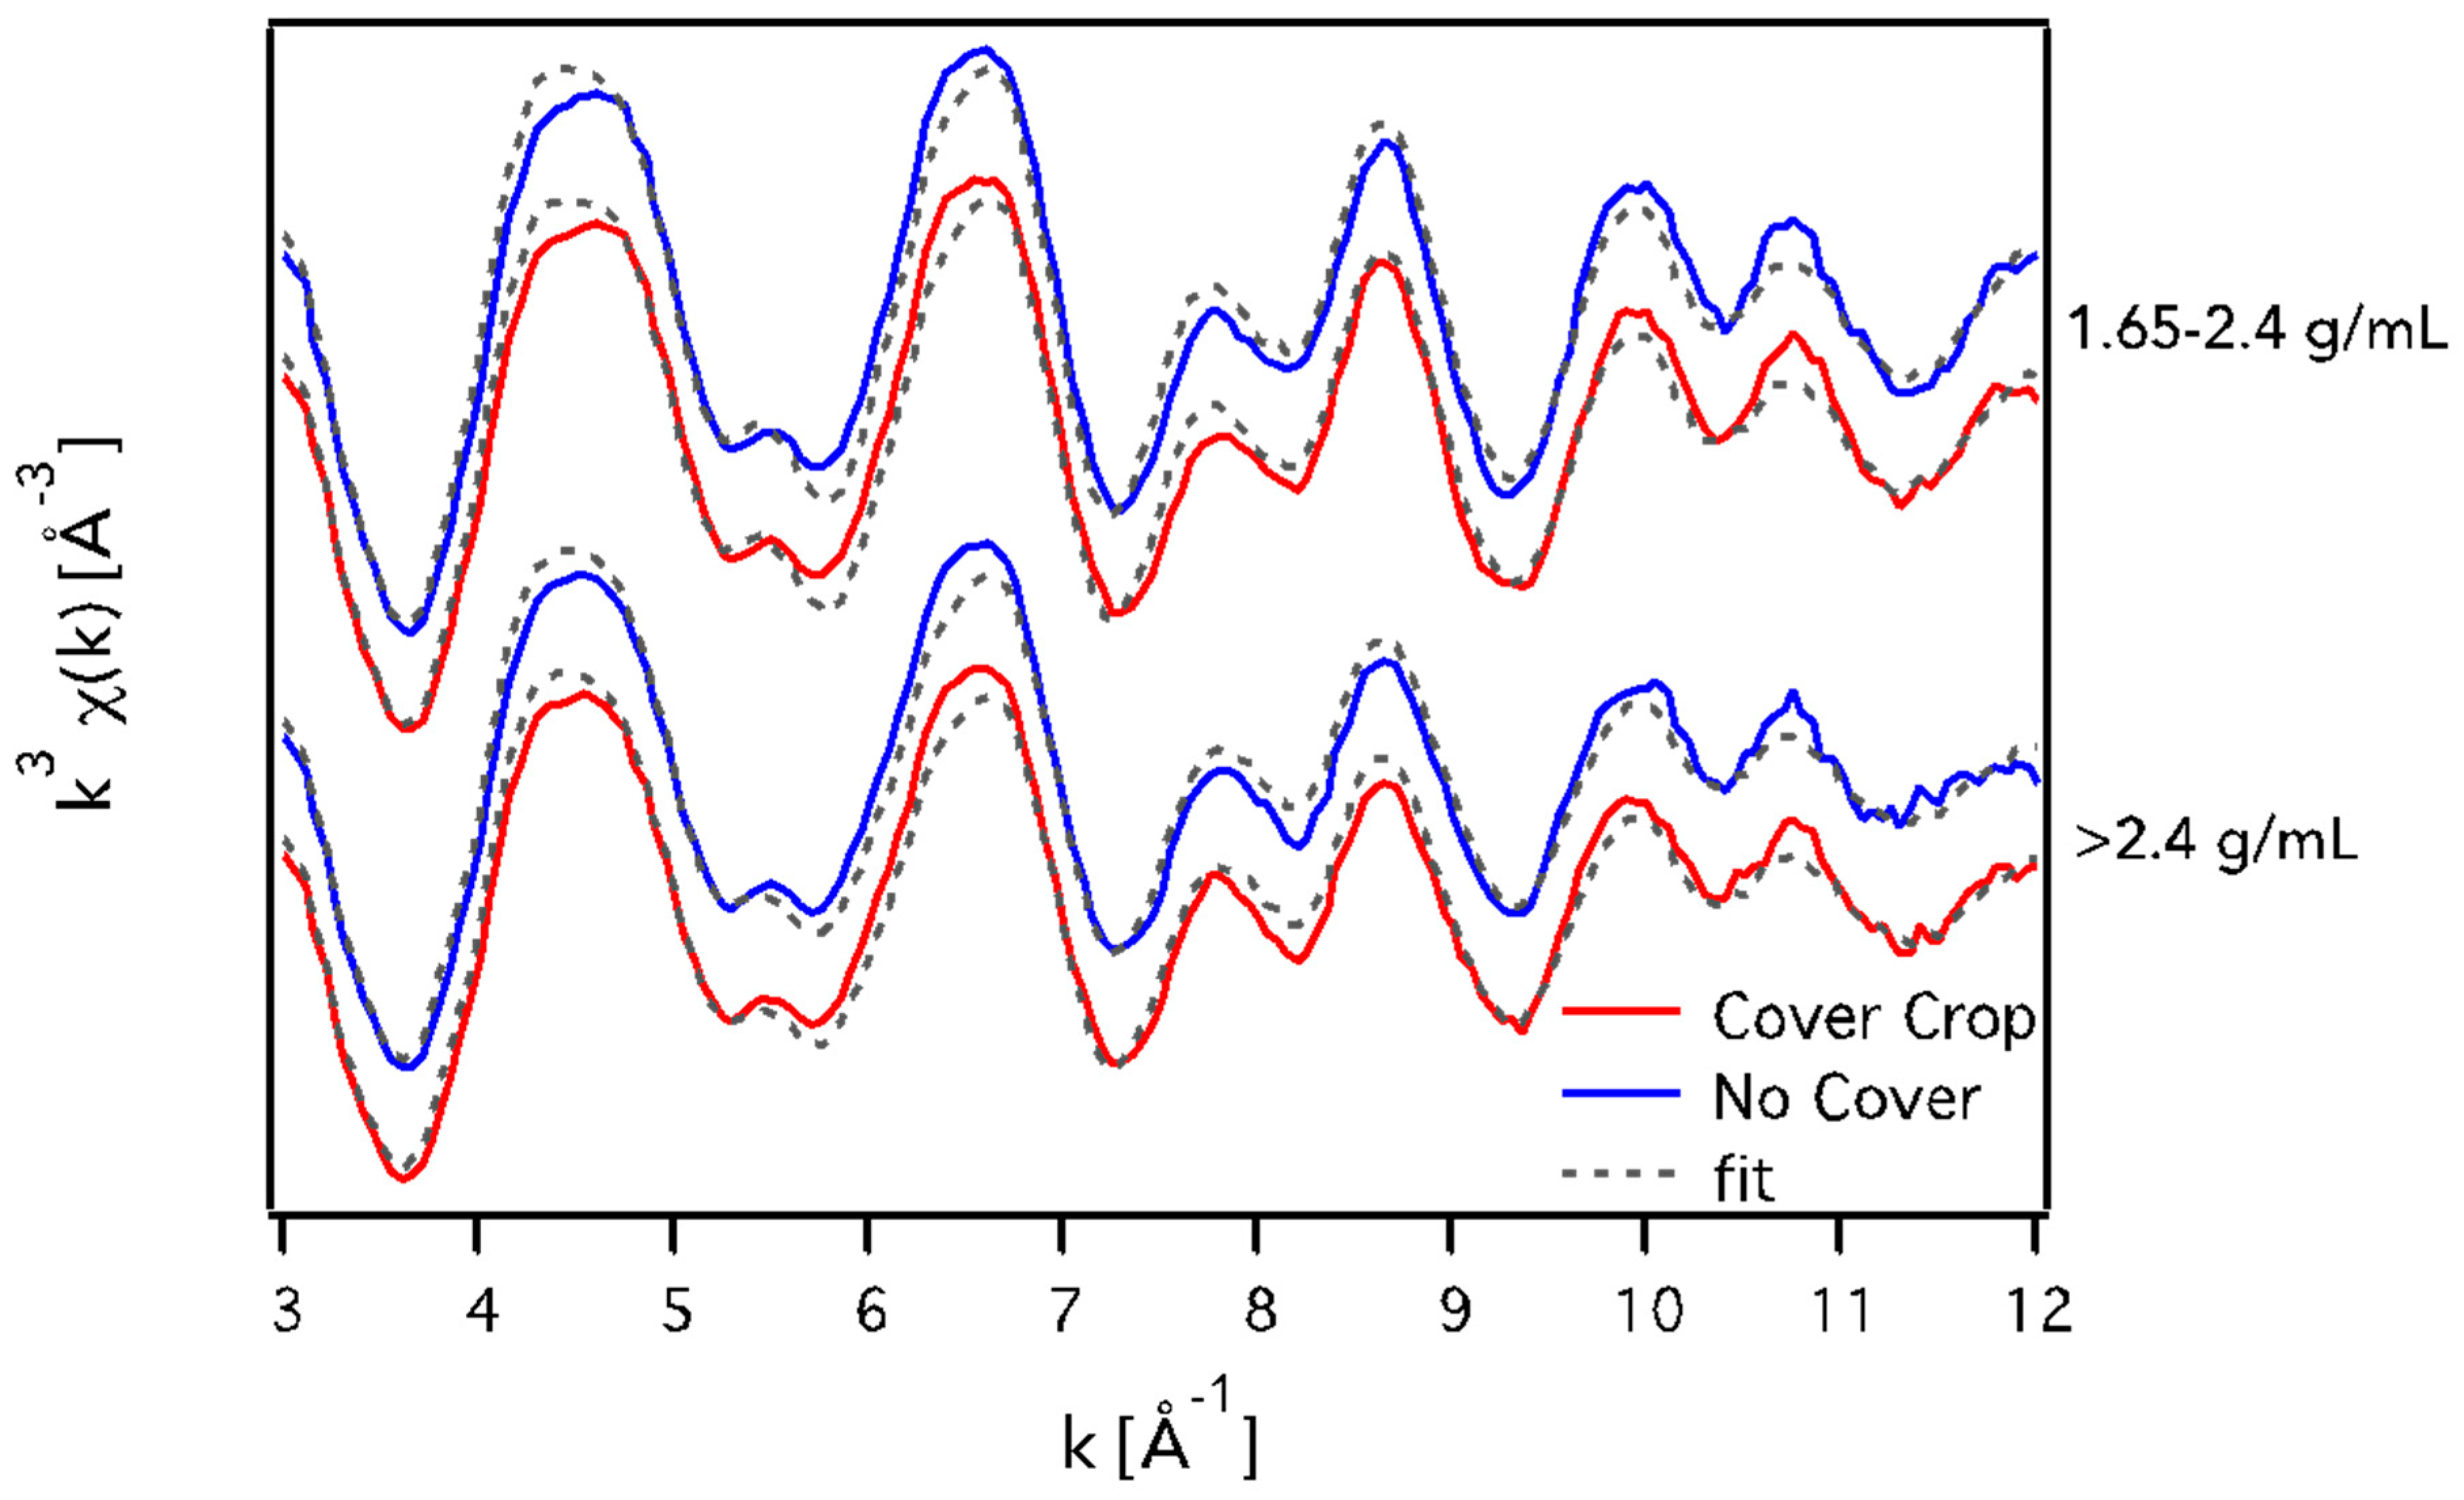
3.3.2. Fe K-Edge EXAFS Spectroscopy

Iron EXAFS spectra of intermediate and heavy density fractions of bulk soil from CC and NCC soils show that Fe mineralogy is similar (Figure 4, Table 3). The Fe pool is composed of 17–21% oxide (fit with goethite standard) across samples (Table 3), while Fe in silicate minerals makes up the remainder of the Fe pool. Intermediate density fractions contain Fe in minerals more similar to nontronite (Fe-rich smectite) and phlogopite (Mg-rich mica) than the heavy density fraction, which has Fe in minerals more similar to hornblende (amphibole) and vermiculite (swelling, partially weathered phlogopite and/or biotite) (Table 3). However, the presence of cover crop had little effect on Fe mineralogy as observed by Fe K-edge EXAFS during the time period of this experiment.

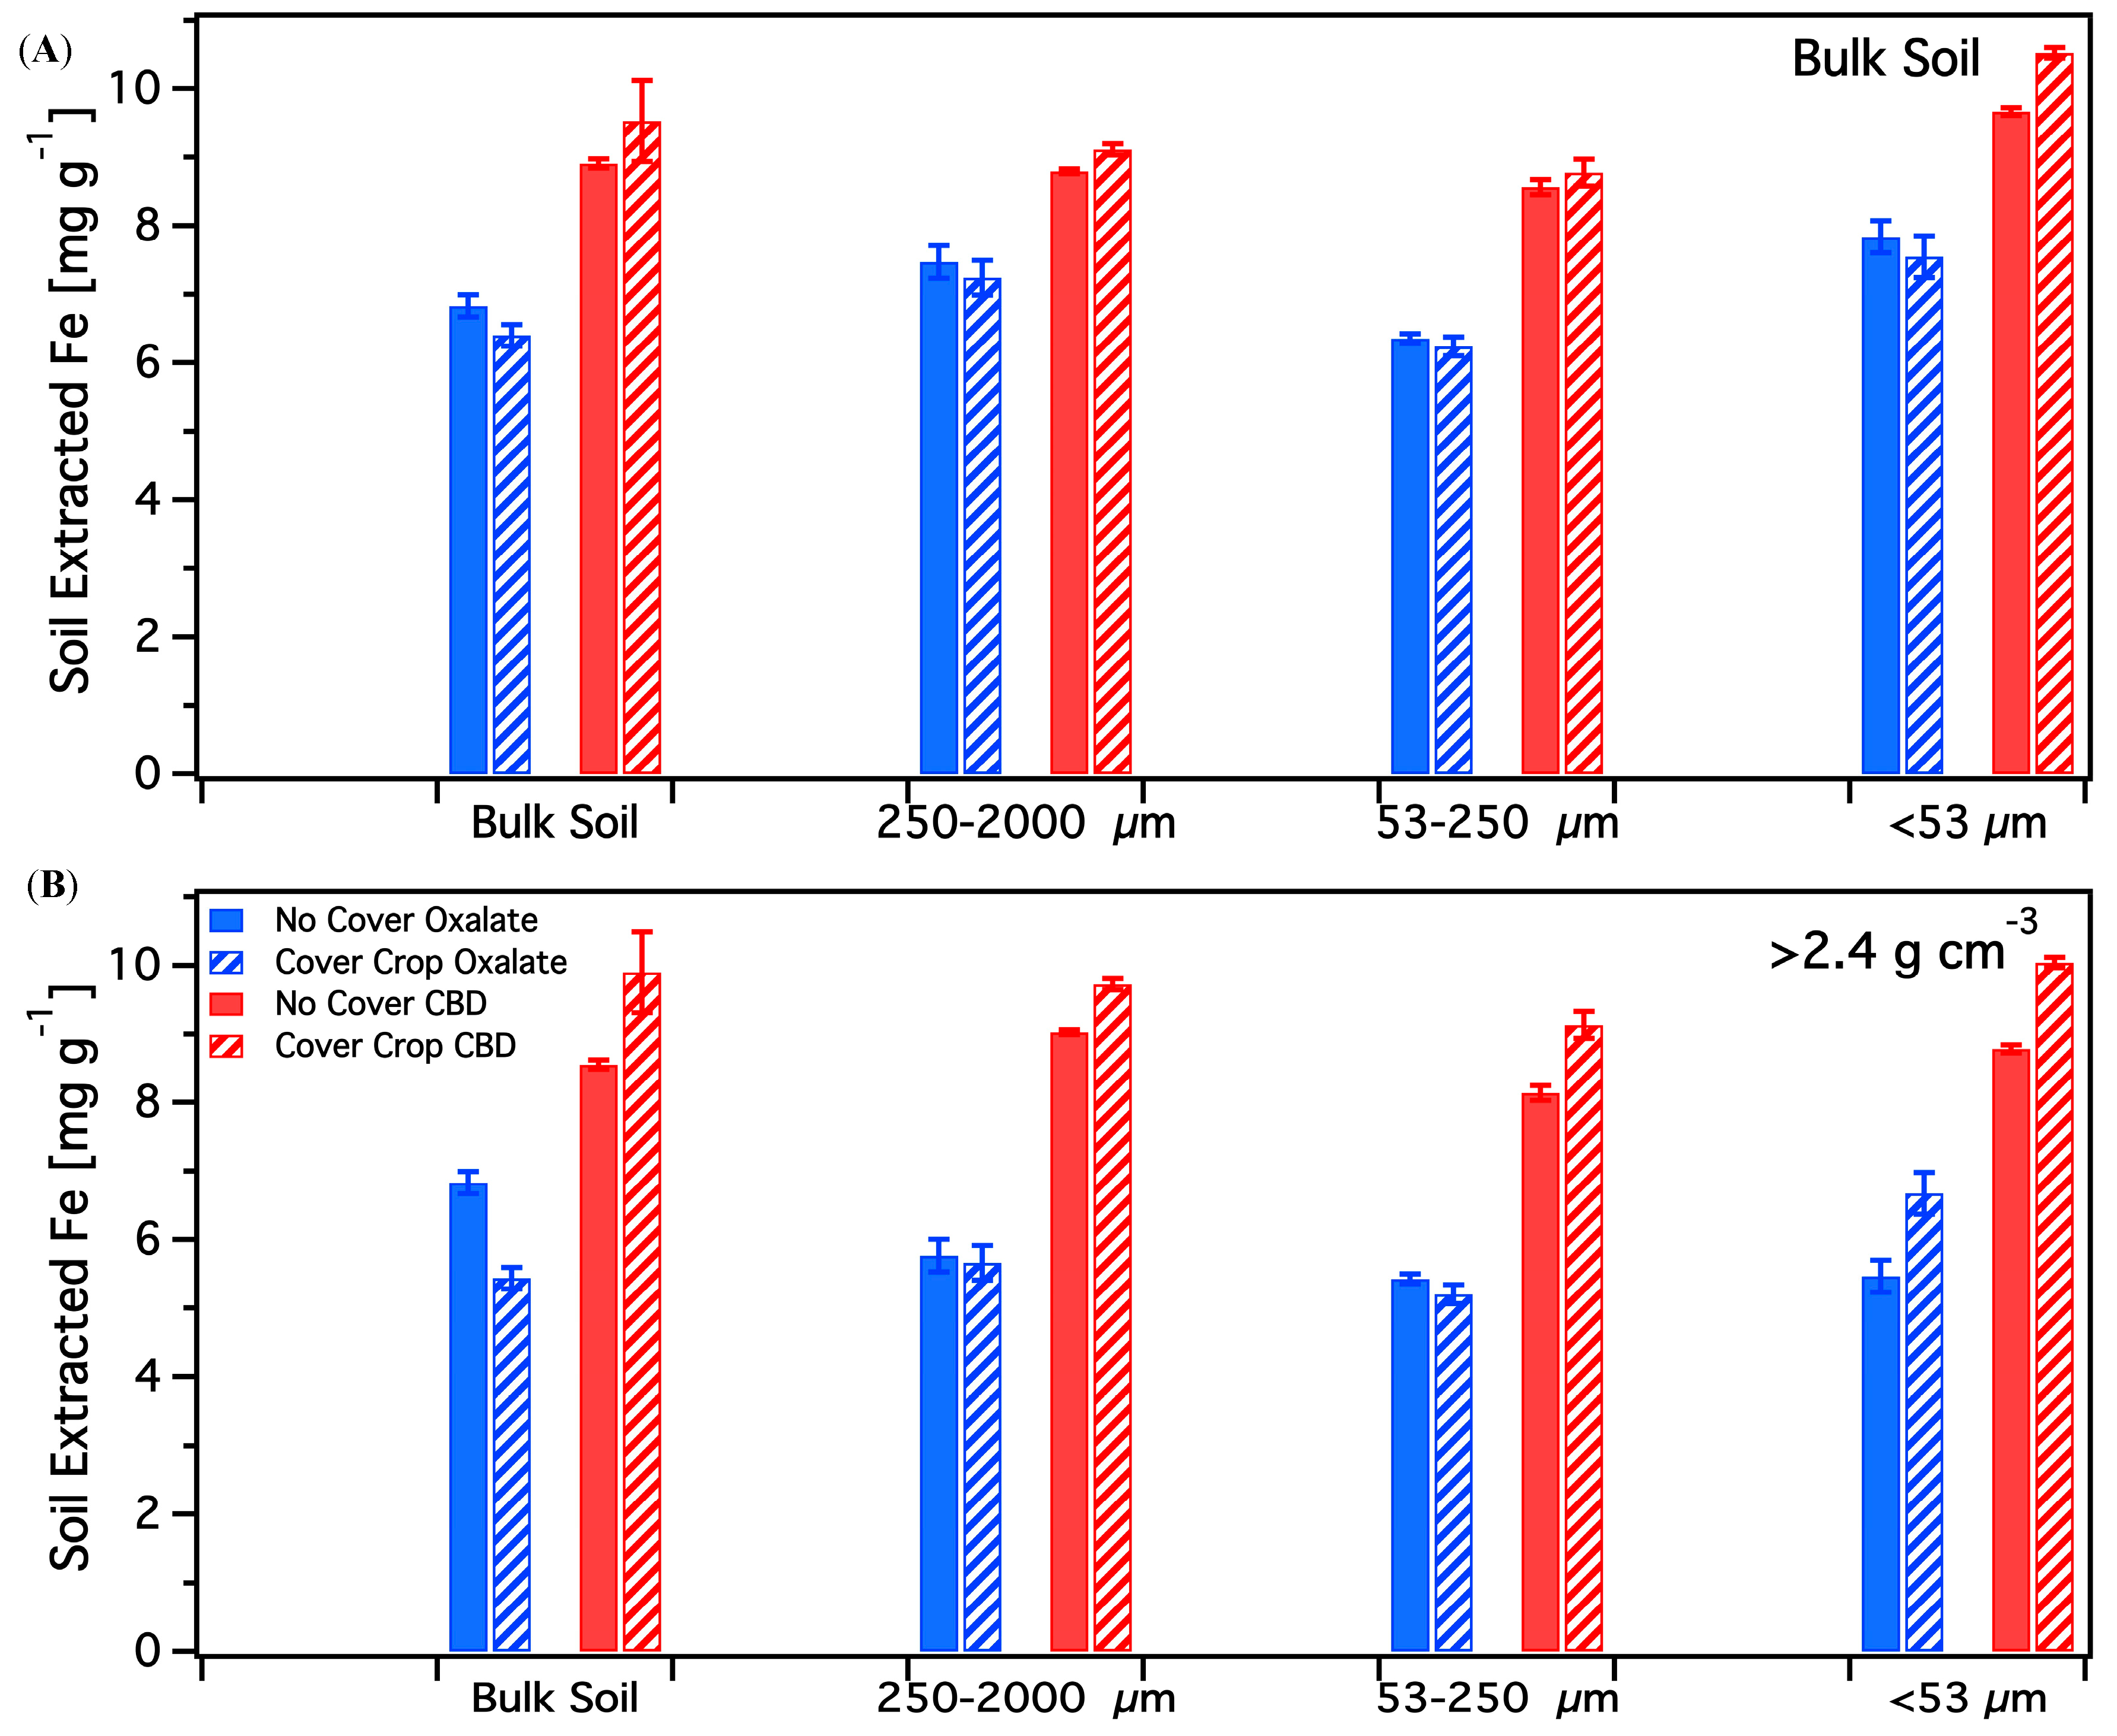
3.4. Chemical Extractions

3.4.1. Acid Ammonium Oxalate

Oxalate extractable Fe was 6.4 and 6.8 mg Fe (g soil)−1 for CC and NCC soils, respectively, representing 12–13% of the total soil Fe pool (Table 1, Figure 5A). Oxalate extractable Fe was highest in the <53 µm size fraction in both CC and NCC treatments and lowest in the 53–250 µm size fraction, but ranged between 6 and 8 mg Fe (g soil)−1 for all size separated samples (Figure 5A). In dense fractions (>2.4 g cm−3) oxalate extractable Fe was higher in NCC bulk soil, lower in NCC <53 µm, and similar between NCC and CC in the 53–250 and 250–2000 µm size fractions (Figure 5B). Oxalate extractions were not performed on intermediate fractions due to lack of available sample.

3.4.2. Citrate-Bicarbonate-Dithionite

Citrate-bicarbonate-dithionite (CBD) extractable Fe was 9.5 and 8.9 mg Fe (g soil)−1 for CC and NCC bulk soils, respectively. Aggregate size fractions had higher CBD extractable Fe in CC compared to NC soils. Dense fraction CBD extractable Fe was higher in CC compared to NC soils in bulk soil and every size fraction (Figure 5).

4. Discussion

4.1. Cover Crop Effect on Carbon Inputs

The gross results suggest that the average C content of CC bulk soil was ~400 mg kg−1 higher than NCC in the top 10 cm measured during a single season of CC (Table 1), but this difference was not statistically significant. We hypothesized that new C inputs from CC would, at least initially, be incorporated into macroaggregates, which are less stable and have faster turnover times than microaggregates [8]. Multiple lines of evidence point to dynamic C cycling in both micro-and macroaggregates in our site, despite a relatively small and statistically insignificant difference in bulk SOC content or aggregate distribution (Figure 1). This pattern may be explained by the multiple influences of plant roots on soil aggregate destruction and formation which have been extensively reviewed [26,27,28].
Large macroaggregate (>2000 µm) bulk SOC content and the C:N ratio were higher and δ13C was more negative in CC compared to NC (Table 1). Although these differences were not statistically significant at the p < 0.1 level, together they indicate that fresh plant inputs in CC are stabilized in macroaggregates. Carbon NEXAFS data indicated that CC macroaggregates had increased phenolic character relative to NCC (Figure 3), providing spectroscopic evidence for the impact of CC on SOC in macroaggregates. Plant roots both destroy aggregates [29] and provide root fragments, mucin, and exudates that act as nucleation points and binders for aggregate formation [30,31]; thus they are likely a major contributor of additional plant material into CC macroaggregates. Higher frequency drying-wetting cycles due to increased transpiration in CC could also increase macroaggregate turnover rate compared to NCC [32]. Importantly, the effects of plant roots are also dependent on soil mineralogy [33], but this was not varied in the experiment. Overall it appears that CC roots promoted faster macroaggregate turnover but with limited net change in aggregation or C content over a short time period of CC.
The small macroaggregate fraction (250–2000 µm) had lower δ13C in CC compared to NCC (p < 0.05), indicating incorporation of less processed organic matter (Table 1). Increased phenol resonance in the C NEXAFS spectrum of CC compared to NCC (Figure 3) further indicated that although the amount of C did not significantly change with CC, the C pool was actively cycled and C chemical composition changed to reflect more plant-like character in small macroaggregates.

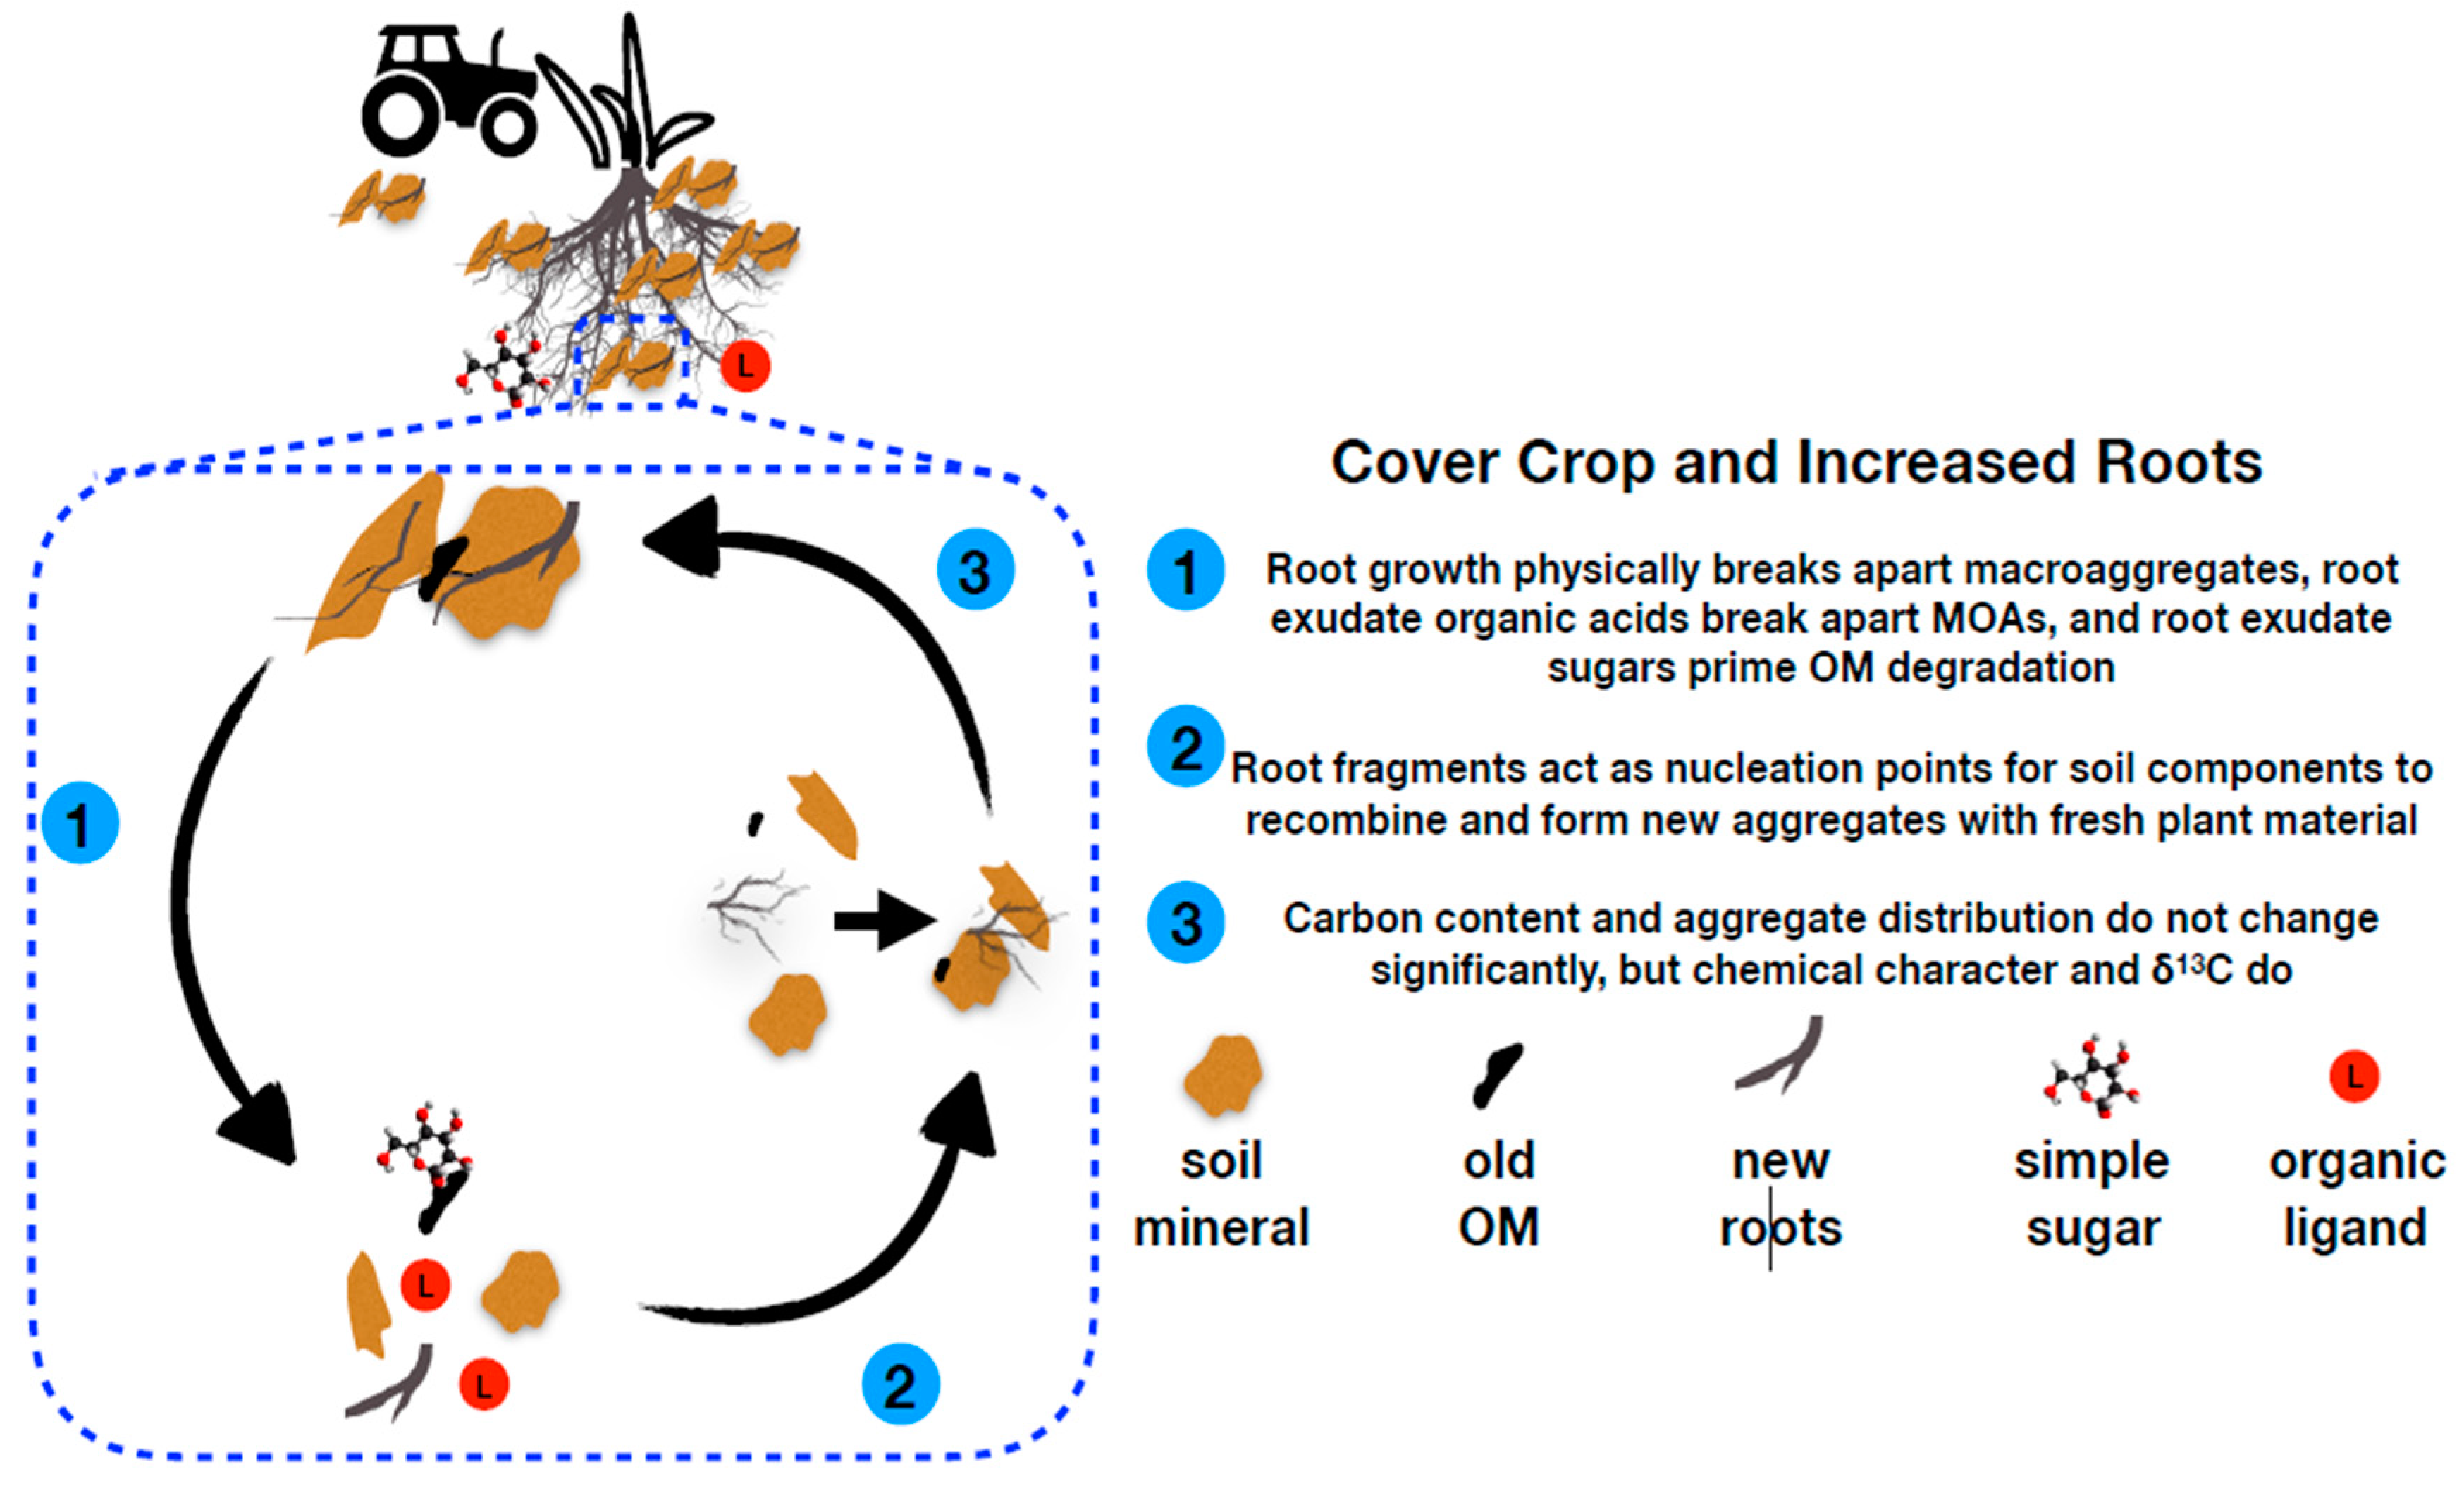
4.2. Aggregate Dynamics

These results are consistent with the aggregate hierarchy framework where macroaggregates are sensitive to management, especially root growth [4,14] and possibly mechanical soil disturbances related to planting CC. Our results provide direct spectroscopic evidence that macroaggregates (>250 µm) incorporated plant material within a single cover cropping season (Figure 2). Interestingly, little variation in C chemical composition was observed in density fractions across bulk soil, macroaggregates, and microaggregates (Figure 3). Thus, we propose that, at least initially, changes in C chemical composition following CC are largely a function of incorporation of particulate C into macroaggregates and not alteration of C in mineral fractions. Rapid incorporation of particulate C into macroaggregates is further supported by the similarity in the mass of FLF and <1.65 g cm−3 fractions between CC and NCC despite additional plant inputs with CC (Table 1, Table 2).
Cover crop roots also may alter Fe mineralogy in bulk soil and aggregates through production of organic acids [15] or polysaccharides [34]. In bulk soil samples, CC slightly increased total extractable Fe content (CBD extraction) in the bulk soil and <53 µm microaggregates while no change was observed in the poorly crystalline (oxalate extraction) Fe pool (Figure 5A). In the dense fraction (>2.4 g cm−3), CBD-extractable Fe was higher in bulk soil and all stepwise size-density fractions (Figure 5B). However, the dense fraction oxalate-extractable Fe was lower with CC in bulk soil and higher in the dense fraction of small microaggregates (Figure 5B). The decrease in oxalate-extractable (poorly crystalline) Fe minerals with CC could be due to dissolution from additional root exudates with CC [24] or due to the presence of more recent aggregates with fewer organic-Fe complexes and less weathered primary minerals. The CBD extractable Fe content compares well with Fe EXAFS data, indicating that the soil Fe pool is comprised of ~18% Fe-oxides. Changes in Fe mineral crystallinity or extractability could be affected by increased organic acids interacting with Fe minerals [15,35,36]. Extractable Fe increased with CC in the dense fraction of bulk soil and both macroaggregates and microaggregates, perhaps due to an increase in polysaccharide production in the dense fraction [34].
The impact of CC on C composition in aggregates was detected after only a single season of CC. Based on this work, we propose a conceptual model of SOC replacement within aggregates driven by plant roots (Figure 6). The presence of additional roots drives aggregate turnover through physical aggregate breakup and increased C mineralization due to root exudate sugars and ligands [15]. However, root fragments and fungal hyphae also provide nuclei for aggregate reformation [37]. During macroaggregate reformation following tillage and root growth but before the introduction of summer irrigated tomato crop, bulk SOC content increased slightly in the >2000 µm macroaggregates under CC (Table 1), and δ13C, C:N ratios (Table 1 and Table 2), and C NEXAFS (Figure 2) results all show a dynamic C pool where some C is replaced with plant root inputs. This idea is supported by the preferential retention of root compared to aboveground OM [8]. Density fractionation and δ13C results show that changes in bulk soil and macroaggregate C are primarily particulate (<1.65 g cm−3) and, to a lesser extent, mineral-associated (1.65–2.4 g cm−3), but no change in the dense fraction δ13C was observed (Table 2).

5. Conclusions

Size-separated microaggregates (53–250 and <53 µm) had similar C content between CC and NCC soils, and δ13C values were lower in bulk soil and 250–2000 µm size fractions with CC (Table 1). Carbon NEXAFS spectra showed similar C chemical composition in CC and NC microaggregates (Figure 3). Based only on examining size-separated aggregates, little incorporation of new C occurred with CC relative to NCC soil. Stepwise size-density separation, however, provides a more detailed view of C dynamics in microaggregates. In all density fractions of bulk soil δ13C values were significantly lower in CC compared to NCC soils. One explanation for these responses is that CC root exudates [15] may liberate particulate C from minerals, enriching C content in the light fraction of CC soil while providing potential for mineral (re)precipitation with fresh C to produce higher C content intermediate density fractions. This explanation is further supported by extraction results, where the proportion of poorly crystalline Fe (oxalate/CBD extractable) was 77% in NC bulk soil compared to 67% in CC bulk soil, indicating that CC may lead to increased Fe oxide crystallinity, likely through a combination of selective dissolution of less crystalline Fe oxides by root exudates (e.g., oxalate) and recrystallization through dissolution and precipitation reactions [38,39,40]. However, this explanation would require exudate transport into aggregates either through advection or diffusion, or root/hyphae penetration into aggregates.

Author Contributions

Conceptualization, M.V.S., N.A.B., D.R., K.M.S., P.S.N., S.C.Y., S.P. and E.L.B.; Methodology, M.K., Y.L., T.A.G. and P.S.N.; Investigation, M.V.S., N.A.B., D.R., A.G., T.H., A.R.M. and C.C.A.; Statistical Analyses, A.R.M., Y.L.; Resources, M.L.F., K.M.S., and S.C.Y.; Writing-Original Draft Preparation, M.V.S.; Writing-Review and Editing, M.V.S., P.S.N., W.J.R., N.A.B., S.C.Y., A.R.M., Y.L., T.A.G.; Visualization, M.V.S.; Supervision, P.S.N., S.C.Y.; Project Administration, S.C.Y.; Funding Acquisition, S.C.Y., P.S.N., E.L.B., K.M.S., A.A.B. All authors have read and agreed to the published version of the manuscript.

Funding

This research was funded by the University of California Office of the President CATALYST award and the EDGE Institute at UC Riverside.

Acknowledgments

We thank members of the UC CATALYST DroCaM team for help with sample collection. We also thank Sharon Bone, Ryan Davis, Matthew Lattimer, and Erik Nelson at SSRL, and Jay Dynes, Adam Gillespie, and Tom Regier at CLS for support at synchrotron beamlines. Portions of this research were carried out at the Stanford Synchrotron Radiation Lightsource, a Directorate of SLAC National Accelerator Laboratory and an Office of Science User Facility operated for the U.S. Department of Energy Office of Science by Stanford University. The project was funded by the UCOP Presidential Catalyst Award (CA-16–377706). Work at Lawrence Berkeley National Laboratory was supported by the U.S. Department of Energy, Office of Science, under Contract Number DE-AC02–05CH11231. S. Ying is supported by USDA NIFA Hatch Project CA-R-ENS-5151-H. Research described in this paper was performed at the Canadian Light Source, which is supported by the Canada Foundation for Innovation, Natural Sciences and Engineering Research Council of Canada, the University of Saskatchewan, the Government of Saskatchewan, Western Economic Diversification Canada, the National Research Council Canada, and the Canadian Institutes of Health Research.

Conflicts of Interest

The authors declare no conflict of interest. The funders had no role in the design of the study; in the collection, analyses, or interpretation of data; in the writing of the manuscript; or in the decision to publish the results.

References

  1. Minasny, B.; Malone, B.P.; McBratney, A.B.; Angers, D.A.; Arrouays, D.; Chambers, A.; Chaplot, V.; Chen, Z.-S.; Cheng, K.; Das, B.S.; et al. Soil carbon 4 per mille. Geoderma 2017, 292, 59–86. [Google Scholar] [CrossRef]
  2. Poeplau, C.; Don, A. Carbon sequestration in agricultural soils via cultivation of cover crops—A meta-analysis. Agric. Ecosyst. Environ. 2015, 200, 33–41. [Google Scholar] [CrossRef]
  3. Mayer, A.; Hausfather, Z.; Jones, A.D.; Silver, W.L. The potential of agricultural land management to contribute to lower global surface temperatures. Sci. Adv. 2018, 4, eaaq0932. [Google Scholar] [CrossRef] [PubMed] [Green Version]
  4. Tisdall, J.M.; Oades, J.M. Organic matter and water-stable aggregates in soils. J. Soil Sci. 1982, 33, 141–163. [Google Scholar] [CrossRef]
  5. Rorick, J.D.; Kladivko, E.J. Cereal rye cover crop effects on soil carbon and physical properties in southeastern Indiana. J. Soil Water Conserv. 2017, 72, 260–265. [Google Scholar] [CrossRef] [Green Version]
  6. Kabir, Z.; Koide, R.T. The effect of dandelion or a cover crop on mycorrhizal inoculum potential, soil aggregation and yield of maize. Agric. Ecosyst. Environ. 2000, 78, 167–174. [Google Scholar] [CrossRef]
  7. Roberson, E.B.; Firestone, M.K.; Sarig, S. Cover Crop Management of Polysaccharide-Mediated Aggregation in an Orchard Soil. Soil Sci. Soc. Am. J. 1991, 55, 734–739. [Google Scholar] [CrossRef]
  8. Kong, A.Y.Y.; Six, J. Tracing Root vs. Residue Carbon into Soils from Conventional and Alternative Cropping Systems. Soil Sci. Soc. Am. J. 2010, 74, 1201–1210. [Google Scholar] [CrossRef] [Green Version]
  9. Kong, A.Y.Y.; Six, J. Microbial community assimilation of cover crop rhizodeposition within soil microenvironments in alternative and conventional cropping systems. Plant Soil 2012, 356, 315–330. [Google Scholar] [CrossRef]
  10. Berhe, A.A.; Suttle, K.B.; Burton, S.D.; Banfield, J.F. Contingency in the direction and mechanics of soil organic matter responses to increased rainfall. Plant Soil 2012, 358, 371–383. [Google Scholar] [CrossRef]
  11. Hall, S.J.; Berhe, A.A.; Thompson, A. Order from disorder: Do soil organic matter composition and turnover co-vary with iron phase crystallinity? Biogeochemistry 2018, 140, 93–110. [Google Scholar] [CrossRef] [Green Version]
  12. Eusterhues, K.; Neidhardt, J.; Hädrich, A.; Küsel, K.; Totsche, K.U. Biodegradation of ferrihydrite-associated organic matter. Biogeochemistry 2014, 119, 45–50. [Google Scholar] [CrossRef]
  13. Duiker, S.W.; Rhoton, F.E.; Torrent, J.; Smeck, N.E.; Lal, R. Iron (Hydr)Oxide Crystallinity Effects on Soil Aggregation. Soil Sci. Soc. Am. J. 2003, 67, 606–611. [Google Scholar] [CrossRef]
  14. Oades, J.M. Soil organic matter and structural stability: Mechanisms and implications for management. Plant Soil 1984, 76, 319–337. [Google Scholar] [CrossRef]
  15. Keiluweit, M.; Bougoure, J.J.; Nico, P.S.; Pett-Ridge, J.; Weber, P.K.; Kleber, M. Mineral protection of soil carbon counteracted by root exudates. Nat. Clim. Chang. 2015, 5, 588–595. [Google Scholar] [CrossRef]
  16. Six, J.; Paustian, K.; Elliott, E.T.; Combrink, C. Soil Structure and Organic Matter I. Distribution of Aggregate-Size Classes and Aggregate-Associated Carbon. Soil Sci. Soc. Am. J. 2000, 64, 681–689. [Google Scholar] [CrossRef]
  17. Sollins, P.; Swanston, C.; Kleber, M.; Filley, T.; Kramer, M.; Crow, S.; Caldwell, B.A.; Lajtha, K.; Bowden, R. Organic C and N stabilization in a forest soil: Evidence from sequential density fractionation. Soil Biol. Biochem. 2006, 38, 3313–3324. [Google Scholar] [CrossRef] [Green Version]
  18. Moni, C.; Derrien, D.; Hatton, P.J.; Zeller, B.; Kleber, M. Density fractions versus size separates: Does physical fractionation isolate functional soil compartments? Biogeosciences 2012, 9, 5181–5197. [Google Scholar] [CrossRef] [Green Version]
  19. Hatton, P.-J.; Kleber, M.; Zeller, B.; Moni, C.; Plante, A.F.; Townsend, K.; Gelhaye, L.; Lajtha, K.; Derrien, D. Transfer of litter-derived N to soil mineral–organic associations: Evidence from decadal 15N tracer experiments. Org. Geochem. 2012, 42, 1489–1501. [Google Scholar] [CrossRef]
  20. Golchin, A.; Oades, J.; Skjemstad, J.; Clarke, P. Study of free and occluded particulate organic matter in soils by solid state 13C Cp/MAS NMR spectroscopy and scanning electron microscopy. Soil Res. 1994, 32, 285–309. [Google Scholar] [CrossRef]
  21. Golchin, A.; Oades, J.M.; Skjemstad, J.O.; Clarke, P.; Golchin, A.; Oades, J.M.; Skjemstad, J.O.; Clarke, P. Soil structure and carbon cycling, Soil structure and carbon cycling. Soil Res. Soil Res. 1994, 32, 1043–1068. [Google Scholar] [CrossRef]
  22. Regier, T.; Krochak, J.; Sham, T.K.; Hu, Y.F.; Thompson, J.; Blyth, R.I.R. Performance and capabilities of the Canadian Dragon: The SGM beamline at the Canadian Light Source. Nucl. Instrum. Methods Phys. Res. Sect. A Accel. Spectrometers Detect. Assoc. Equip. 2007, 582, 93–95. [Google Scholar] [CrossRef]
  23. Gillespie, A.W.; Phillips, C.L.; Dynes, J.J.; Chevrier, D.; Regier, T.Z.; Peak, D. Chapter One—Advances in Using Soft X-Ray Spectroscopy for Measurement of Soil Biogeochemical Processes. In Advances in Agronomy; Sparks, D.L., Ed.; Academic Press: Cambridge, MA, USA, 2015; Volume 133, pp. 1–32. [Google Scholar]
  24. Ravel, B.; Newville, M. Athena, Artemis, Hephaestus: Data analysis for X-ray absorption spectroscopy using IFEFFIT. J. Synchrotron Radiat. 2005, 12, 537–541. [Google Scholar] [CrossRef] [PubMed] [Green Version]
  25. McKeague, J.A.; Day, J.H. Dithionite and oxalate extractable Fe and Al as in differentiating various classes of soils. Can. J. Soil. Sci. 1966, 46, 13–22. [Google Scholar] [CrossRef]
  26. Degens, B.P. Macro-aggregation of soils by biological bonding and binding mechanisms and the factors affecting these: A review. Soil Res. 1997, 35, 431–460. [Google Scholar] [CrossRef]
  27. Angers, D.A.; Caron, J. Plant-induced Changes in Soil Structure: Processes and Feedbacks. Biogeochemistry 1998, 42, 55–72. [Google Scholar] [CrossRef]
  28. Six, J.; Bossuyt, H.; Degryze, S.; Denef, K. A history of research on the link between (micro)aggregates, soil biota, and soil organic matter dynamics. Soil Tillage Res. 2004, 79, 7–31. [Google Scholar] [CrossRef]
  29. Helal, H.M.; Sauerbeck, D.R. Influence of plant roots on C and P metabolism in soil, Developments in Plant and Soil Sciences. In Biological Processes and Soil Fertility; Tinsley, J., Darbyshire, J.F., Eds.; Springer: Dordrecht, The Netherlands, 1984; pp. 175–182. [Google Scholar]
  30. Gale, W.J.; Cambardella, C.A.; Bailey, T.B. Root-Derived Carbon and the Formation and Stabilization of Aggregates. Soil Sci. Soc. Am. J. 2000, 64, 201–207. [Google Scholar] [CrossRef]
  31. Daynes, C.N.; Field, D.J.; Saleeba, J.A.; Cole, M.A.; McGee, P.A. Development and stabilisation of soil structure via interactions between organic matter, arbuscular mycorrhizal fungi and plant roots. Soil Biol. Biochem. 2013, 57, 683–694. [Google Scholar] [CrossRef]
  32. Denef, K.; Six, J.; Bossuyt, H.; Frey, S.D.; Elliott, E.T.; Merckx, R.; Paustian, K. Influence of dry–wet cycles on the interrelationship between aggregate, particulate organic matter, and microbial community dynamics. Soil Biol. Biochem. 2001, 33, 1599–1611. [Google Scholar] [CrossRef]
  33. Denef, K.; Six, J. Clay mineralogy determines the importance of biological versus abiotic processes for macroaggregate formation and stabilization. Eur. J. Soil Sci. 2005, 56, 469–479. [Google Scholar] [CrossRef]
  34. Banfield, J.F.; Barker, W.W.; Welch, S.A.; Taunton, A. Biological impact on mineral dissolution: Application of the lichen model to understanding mineral weathering in the rhizosphere. Proc. Natl. Acad. Sci. USA 1999, 96, 3404–3411. [Google Scholar] [CrossRef] [PubMed] [Green Version]
  35. Easterwood, G.W.; Sartain, J.B. Clover Residue Effectiveness in Reducing Orthophosphate Sorption on Ferric Hydroxide Coated Soil. Soil Sci. Soc. Am. J. 1990, 54, 1345–1350. [Google Scholar] [CrossRef]
  36. Gerke, J. Phosphate adsorption by humic/Fe-oxide mixtures aged at pH 4 and 7 and by poorly ordered Fe-oxide. Geoderma 1993, 59, 279–288. [Google Scholar] [CrossRef]
  37. Miller, R.M.; Jastrow, J.D. Mycorrhizal Fungi Influence Soil Structure. In Arbuscular Mycorrhizas: Physiology and Function; Kapulnik, Y., Douds, D.D., Eds.; Springer: Dordrecht, The Netherlands, 2000; pp. 3–18. [Google Scholar]
  38. Schwertmann, U. Solubility and dissolution of iron oxides. Plant Soil 1991, 130, 1–25. [Google Scholar] [CrossRef]
  39. Schwertmann, U.; Friedl, J.; Stanjek, H. From Fe(III) Ions to Ferrihydrite and then to Hematite. J. Colloid Interface Sci. 1999, 209, 215–223. [Google Scholar] [CrossRef]
  40. Hansel, C.M.; Benner, S.G.; Fendorf, S. Competing Fe(II)-induced mineralization pathways of ferrihydrite. Environ. Sci. Technol. 2005, 39, 7147–7153. [Google Scholar] [CrossRef]
Figure 1. (A) Mass distribution in size separated aggregates; (B) carbon distribution in size separated aggregates; (C) mass distribution in density separated aggregates; (D) carbon distribution in density separated aggregates. Error bars represent ± standard error. FLF is the free light fraction. Asterisk represent p values according to the following: * (p < 0.1); ** (p < 0.05).
Soilsystems 04 00006 g001
Figure 2. Carbon NEXAFS spectra of bulk soil and size-separated aggregates from soil with (black lines) and without (blue lines) cover crop. Dashed line at 286.7 eV highlights the more intense and shifted phenolic peak in macroaggregates from cover crop soil.
Soilsystems 04 00006 g002
Figure 3. Carbon NEXAFS spectra of (A) intermediate density (1.65–2.4 g/mL−1) and (B) heavy density (>2.4 g/mL−1) fractions of bulk soil and sequential size-density separated samples. Black lines indicate the soil with the cover crop, and blue lines indicate no cover crop.
Soilsystems 04 00006 g003
Figure 4. Fe K-edge k3 weighted EXAFS spectra of intermediate (1.65–2.4 g/mL−1) and heavy (>2.4 g/mL−1) soil density fractions from no cover (blue lines) and cover crop (red lines) treatments. Grey dashed lines indicate the least squares best fit for each sample (see Table 3 for fit results).
Soilsystems 04 00006 g004
Figure 5. Acid ammonium oxalate (blue bars) and citrate-bicarbonate-dithionite (red bars) extractable Fe for no cover crop (solid bars) and cover crop (dashed bars) soils. Values are expressed as mg Fe per g dry soil mass for (A) bulk soil and aggregate size fractions, and (B) the heaviest density fraction (>2.4 g cm−3) of bulk soil and aggregate size fractions. Error bars represent ± standard error. Differences between cover crop and no cover crop were significant for the CBD extraction of 250–2000 µm size fraction (p = 0.1) and for the oxalate extraction of bulk soil and bulk >2.4 g cm−3 density fraction (p = 0.01).
Soilsystems 04 00006 g005
Figure 6. Conceptual model of the influence of cover crop roots on fresh carbon incorporation into macroaggregates. Root growth (and potentially the act of planting cover crop) physically breaks apart macroaggregates while organic acids disrupt mineral-organic associations (MOAs). These processes, combined with organic matter decomposition stimulated by root sugars, lead to enhanced carbon turnover in cover crop soil. However, carbon loss due to root exudates is balanced and slightly exceeded by input of additional root biomass. Although bulk carbon contents do not significantly change, cover crop accelerates carbon turnover in soil macroaggregates.
Soilsystems 04 00006 g006
Table 1. Elemental and isotopic composition of size separated aggregates from 0 to 10 cm depth of cover crop and no cover crop fields.
Cδ13CNδ15NC/NMgAlSiPSKCaMnFe
%% %%%%Ppm%%Ppm%
Bulk SoilNCC 11.00(2) 3−25.2 **0.114.1(2)11.13.45.324.10.02701.30.810105.2
CC 21.04(4)−25.6 **0.113.811.3(5)3.65.424.60.12801.30.810305.2
>2000 µmNCC1.28(6)−25.7(4)0.154.2(6)9.8(2)2.94.821.70.02501.20.89205.0
CC1.81(29)−26.7(4)0.19(2)4.1(3)11.1(6)3.14.721.00.02601.10.79004.8
250–2000 µmNCC1.24(5)−25.1 **0.126.5(6)12.2(2)1.84.019.50.02891.10.89515.4
CC1.25(4)−25.4 **0.125.9(3)12.6(2)3.25.022.30.02501.20.89495.5
53–250 µmNCC0.94(2)−25.10.096.8(5)11.7(2)3.15.022.20.04191.20.89184.9
CC1.01(2)−25.30.16.1(4)12.3(3)3.14.821.70.04031.20.89094.8
<53 µmNCC1.09(4)−25.30.135.1(4)9.9(2)3.45.924.10.16211.20.811685.5
CC1.07−25.40.134.6(5)10.0(2)3.15.522.10.16011.20.811635.5
FLFNCC27.3−22.41.381.223.2
CC26.0−27.21.22−0.225.8
1 No cover crop; 2 Cover crop; 3 Values in parentheses indicate standard error of the last digit, no parentheses indicate an error of unity; * denotes that NCC and CC are significantly different at p < 0.1 while ** denotes that NCC and CC are significantly different at p < 0.05.
Table 2. Mass distribution, carbon and nitrogen abundance, and isotopic composition of sequential size-density separated aggregates from 0 to 10 cm depth of cover crop and no cover crop soils.
Starting MaterialDensity 1
g cm−3
C
%
δ13C
N
%
δ15N
C/N
NCC 2Bulk Soil<1.6527(2) 4−24.6(5) *1.41.6(4)21.8 *
1.65–2.44.6(6)−24.8 **0.4(2)2.812.4(2)
>2.40.5−24.9 **0.14.1(2) **7.7 *
CC 3Bulk Soil<1.6526(2)−25.7(2) *1.61.2(2)19.5(6) *
1.65–2.44.3(7)−25.3 **0.42.912.6
>2.40.5−25.0 **0.14.3 **7.7 *
NCC250–2000 µm<1.652623.71.50.820.5
1.65–2.42.6−24.90.23.012.8
>2.40.6−24.80.14.59.9
CC250–2000 µm<1.6532−24.91.90.219.4
1.65–2.42.5−25.50.22.612.4
>2.40.6−25.00.14.09.8
NCC53–250 µm<1.6529−24.11.61.921.5
1.65–2.42.1−24.90.23.112.1
>2.40.4−24.70.14.78.6
CC53–250 µm<1.6538−24.02.0−0.822.2
1.65–2.42.3−25.20.22.912.3
>2.40.4−24.90.13.48.3
NCC<53 µm<1.6536−25.31.72.421.7(4)
1.65–2.45.0(7)−25.1 **0.43.0 **13.7(2) **
>2.40.5−24.90.14.27.2
CC<53 µm<1.6528(6)−25.6(4)1.3(3)1.3(8)25.3(4)
1.65–2.47(1)−25.4 **0.63.1 **14.8(2) **
>2.40.5−24.90.14.4(2)7.3
1 Density separation performed using sodium polytungstate; 2 No cover crop; 3 Cover crop; 4 Values in parentheses indicate standard error, no parentheses indicate an error of unity. * NCC and CC are significantly different at p < 0.1; ** NCC and CC are significantly different at p < 0.05. Statistical significance was determined using a Wilcoxon test.
Table 3. Fe EXAFS linear combination fit results.
TreatmentDensity (g cm−3)GoethiteHornblendeNontronitePhlogopiteVermiculitex2
No Cover1.65–2.417%23%43%12%6%0.43
Cover Crop1.65–2.418%25%40%14%4%0.38
No Cover>2.421%32%27%4%16%0.33
Cover Crop>2.419%28%31%3%19%0.31

