The Influences of Magnesium upon Calcium Phosphate Mineral Formation and Structure as Monitored by X-ray and Vibrational Spectroscopy


1
Department of Earth Sciences, University of Waterloo, Waterloo, ON N2L 3G1, Canada
2
Department of Soil Science, University of Saskatchewan, Saskatoon, SK S7N 5A8, Canada
*
Author to whom correspondence should be addressed.
Soil Syst. 2020, 4(1), 8; https://doi.org/10.3390/soilsystems4010008
Submission received: 18 December 2019
/
Revised: 16 January 2020
/
Accepted: 18 January 2020
/
Published: 29 January 2020
(This article belongs to the Special Issue Using Synchrotron Radiation to Perform Phosphate Speciation in Soils)
Abstract
:Calcium phosphate minerals are typically the solubility-limiting phase for phosphate in calcareous soils. Magnesium (Mg), despite being present in high concentrations in calcareous soils, has been largely neglected in the study of formation and stabilization of soil phosphate minerals due to the high solubility of pure Mg phosphate phases. In this study, a series of four common calcium and magnesium phosphate minerals, hydroxyapatite/bobierrite and brushite/newberyite were synthesized in the presence of widely varying Mg concentrations to examine the effects of Mg substitution upon the local bonding environment and overall structure of the precipitates. Phosphorus K-edge X-Ray absorption near edge structure (XANES) and attenuated total reflectance Fourier transform infrared (ATR-FTIR) provide insight into the local coordination environment, whereas synchrotron powder X-Ray diffraction (SP-XRD) and transmission electron microscopy (TEM) were used for structural analysis. In acidic to neutral pH, Mg-bearing brushite phases formed over a wide range of Ca:Mg ratios. In neutral to high pH systems, a short-range order amorphous calcium phosphate (ACP) with a local structure analogous with hydroxyapatite precipitated for a wide range of Ca to Mg ratios. It can be inferred that the presence of Mg in soils leads to stabilization of metastable phases: via cation substitution in brushite and via poisoning of crystal growth propagation for hydroxyapatite.
1. Introduction
Phosphorous (P) is a macronutrient for plant and microbial growth and is integral to all life and is thus tightly coupled to global food demands. However, overapplication of phosphate to soils can also lead to environmental consequences such as eutrophication and algal blooms when soil P forms are mobilized via leaching, erosion, and runoff. There is a need to fully understand the chemical fate of P minerals in the environment to not only enhance bioavailability for crops but also to minimize losses to surface waters. To be effective in P nutrient stewardship, scientists require detailed information about the chemical forms of soil P so that they can link speciation to not only plant uptake but also environmental fate.
In temperate soil ecosystems, the solubility-limiting solid-phase phosphate mineral is often predicted to be hydroxyapatite (HAP; Ca5(PO4)3OH). A number of analogues exist with varying degrees of crystallinity and solubility: amorphous, calcium deficient, and carbonate substituted [1]; all are strongly favored to form at neutral to basic pH system and a Ca:P ratio greater than 1.67:1. In more acidic systems (pH < 7) with less Ca (1–1.5:1 Ca:P), dicalcium phosphate dihydrate, or brushite (DCPD; CaHPO4·2H2O) is stable. Interestingly, brushite has been observed in fertilized calcareous soils [2,3,4] and there is established and mounting evidence, chiefly in the biomedical field, that brushite is an important HAP precursor for many different geochemical conditions [5,6].
Magnesium is a potentially significant cation for complexation and precipitation reactions with P that has largely been omitted from soil P speciation due to the observation that pure Mg phases are much more soluble than Ca-P minerals [4,7]. Nonetheless, magnesium phosphate minerals, such as newberyite (NBTE; MgHPO4·3H2O) and bobierrite (BOB; Mg3(PO4)2·8H2O) have been identified in systems where there is an abundance of Mg due to amendment applications or parent material [4,8,9,10]. In biomaterial studies, and more recently in soil chemistry, Mg has been shown to strongly inhibit the formation of crystalline minerals such as hydroxyapatite [4,11,12,13,14,15], whereas more soluble phases like brushite are minimally affected by Mg [11,12]. Specifically, it has been observed in basic solutions that HAP precipitation is inhibited by 10% or higher Mg substitution for Ca, and amorphous calcium phosphate (ACP) or whitlockite, the Mg polymorph of β-tri-calcium phosphate, forms instead [4,15,16,17]. As both of these Mg-bearing products are nanoparticles, it has been difficult to differentiate these phases from a truly amorphous material with many spectroscopic techniques or chemical fractionation [3].
It is somewhat surprising that missing components in the fate of soil phosphate persist, given its importance to the fate of phosphate in terrestrial ecosystems. One explanation for this knowledge gap is that direct P speciation in soils is analytically challenging. In soil systems, Nuclear Magnetic Resonance, X-Ray Diffraction, and infrared techniques all have significant issues due to the need for sample extraction to overcome matrix effects and also due to low concentration of P within soils [18]. Phosphorus K-edge X-ray absorption near edge spectroscopy (XANES) is an established technique [19,20,21,22] for direct solid-state P speciation in soils that has matured as the accessibility of suitable synchrotron radiation sources and beamlines has increased [23,24,25,26]. However, the utility of P XANES spectroscopy is limited in many cases by the breadth and quality of spectral reference libraries that are used in semi-quantitative analysis. Spectral libraries are available, notably that of Ingall et al., (2011), [27] but most studies have utilized highly crystalline minerals and focused towards acidic, weathered systems where Fe and Al phosphates dominate. A review of XANES features of calcium phosphates has been recently attempted to determine (a) optimized data reduction approaches and (b) diagnostic peak height ratios for a range of calcium phosphate minerals [28], but this approach relied upon compilation of data collected by many researchers rather than a systematic synthesis approach followed by uniform sample dilutions. Furthermore, such studies are not able to readily determine whether phosphate mineralogy may shift in mixed Ca:Mg conditions that are more typical of calcareous soils. Accordingly, this study focused on systematically varying Mg substitution into two common calcium phosphate minerals that are common in acidic and neutral conditions; i.e., brushite and hydroxyapatite.
The objective of this study was to determine the controls upon Mg substitution into brushite and HAP, and then produce XANES spectra of mixed Ca-Mg phases to develop a more complete XANES spectral library for earth science researchers. We hypothesize that inclusion of Mg can result in changes in the XANES spectra of phosphate minerals that are more representative of soil systems and as a result may lead to more accurate phosphate speciation and thus not only improved agricultural fertilizer use efficiencies but also environmental protection.
2. Materials and Methods
2.1. Mineral Synthesis
A summary of the conditions used to produce pure and Mg-substituted phosphate minerals is tabulated in Table 1. More details of synthesis for brushite, newberyite, hydroxyapatite, and bobierrite minerals are detailed below.
2.1.1. Brushite (CaHPO4·2H2O) and Related Mixed Species Synthesis
Pure brushite was synthesized by the dropwise mixing of equimolar CaCl2 and Na2HPO4 [29]. Briefly, 50 mmol CaCl2 were slowly dripped into 50 mmol Na2HPO4 while stirring at 25 °C with unregulated pH. A series of Mg-bearing brushite was created using the same method but using MgCl2·6H2O in the proportions of 100:0, 75:25, 68.75:31.25, 62.50:37.50, 56.25:43.75, 50:50, 25:75, and 0:100 (Ca:Mg molar ratio). Samples were vacuum filtered with 40 µm filter paper, washed with double deionized (DDI) H2O, and dried at 80 °C overnight. The precipitate was referenced in all measurements by a commercially acquired equivalent (calcium phosphate dibasic dihydrate, Sigma Aldrich (Oakville, ON, Canada).
2.1.2. Newberyite (MgHPO4·3H2O) and Related Mixed Species Synthesis
Newberyite was synthesized by the dropwise mixing of MgCl2·6H2O and H3PO4 with a slight modification of the method of Aramendia et al., (1999) [30]. Phosphoric acid was neutralized to pH 7.0 with concentrated NaOH before the reaction to prevent over acidification. Reaction conditions were 25 °C between pH 6.0 and 7.4, and 0.067 M MgCl2·6H2O and 0.1 M H3PO4. Three additional precipitation reactions with mixed Ca:Mg solutions were performed. Calcium substitution was performed through the replacement of MgCl2·6H2O with CaCl2 in molar ratios of 12.5:87.5, 25:75, and 50:50 (Ca:Mg). As per the cited source, the precipitate was separated from the supernatant by vacuum filtration with a 40 µm cellulose filter then washed several times with DDI H2O to remove entrained ions. The sample was then dried at 80 °C. The precipitate was referenced in all measurements by a commercially acquired equivalent (Magnesium hydrogen phosphate trihydrate, Alfa Aesar (Haverhill, MA, USA)).
2.1.3. Hydroxyapatite (Ca5(PO4)3(OH)) and Related Mixed Species Synthesis
Hydroxyapatite was synthesized by the methods of Riman et al., (2007) [31]. Two solutions, one of 16.7 mM Ca(CH3COO)2·H2O and the other of 10.0 mM of H3PO4, are rapidly mixed then stirred and reacted for 1hr with pH adjusted to 9.0 using 1.0 M NaOH. Nitrogen gas was bubbled through the system during the reaction to minimize carbonate substitution. Magnesium substitution was performed via replacing a portion of the Ca(CH3COO)2·H2O with Mg(CH3COO)2·4H2O in molar proportions of 100:0, 95:5, 90:10, and 80:20. This amount of substitution was chosen based upon previous studies [32,33]. Precipitates were vacuum filtered through 40 µm cellulose filters, washed with DDI H2O, and dried at 110 °C. The precipitate was referenced in all measurements by a commercially acquired equivalent (Calcium phosphate tribasic, Alfa Aesar).
2.1.4. Bobierrite (Mg3(PO4)2·8H2O) and Related Mixed Species Synthesis
Synthesis of bobierrite minerals was based on European Patent method 0 113 153 (Sherif, 1987). The formation of bobierrite occurs in two stages: a rapid room temperature mixing of 5.00 mmol of concentrated H3PO4 with 2.50 mmol of Mg(OH)2 to form a 100 mL “newberyite like” suspension followd by stepwise addition of this acidic newberyite solution into a 5 mM MgOH2 slurry. The second reaction occurs at 50 °C over 5 h. As our study sought to form bobierrite with increasing amounts of Ca substitution, we used calcium hydroxide (Ca(OH)2) to replace Mg(OH)2 as a reagent in the second reaction step in proportions of 0:100, 12.5:87.5, 25:75, and 50:50 (Ca:Mg molar ratio), with the hope this would result in increasing cation substitution. Precipitates were vacuum filtered, washed with DDI H2O, and oven dried at 80 °C overnight. The precipitate was referenced in all measurements by a commercially acquired equivalent (Magnesium phosphate tribasic octahydrate—Sigma Aldrich).
2.2. Synchrotron Powder X-Ray Diffraction
Synchrotron Powder X-ray Diffraction (SP-XRD) patterns of the Ca and Mg minerals were collected at the Canadian Light Source (CLS) on the Canadian Macromolecular Crystallography Facility 2 beamline CMCF-BM (08B1-1). The incident energy was 18 keV with a wavelength of 0.6888 angstroms and the detector distance set at 250 mm. The precipitates were finely ground and packed into polyamine tubing of 0.215 mm diameter. Collected patterns were calibrated to LaB6 diffraction patterns, corrected via subtraction of a polyamine tubing blank, and integrated from diffraction rings to peak patterns using GSAS II [34]. HIGHSCORE (PANalytical, Almelo, Netherlands) and GSAS I were used in phase identification of the patterns [35,36].
2.3. Attenuated Total Reflectance Fourier Transform Infrared (ATR-FTIR) Spectroscopy
All powdered samples were analyzed with ATR-FTIR spectroscopy using a Bruker Equinox 55 FTIR spectrometer with a single bounce accessory equipped with diamond-coated ZnSe optics and a liquid nitrogen cooled Mercury-Cadmium-Tellurium (MCT) detector. Desiccated samples were ground with a mortar and pestle before analysis to ensure a firm pressing on the diamond surface and measured in the mid-infrared region between 4000 and 400 cm−1 with 4 cm−1 resolution.
2.4. Elemental Analysis
Samples were dissolved in a solution of 37% HCl and 65% HNO3 then microwave digested via EPA method 3051. Magnesium and Ca measured with an Agilent Microwave Plasma Atomic Emission Spectrograph 4100 (MP-AES) (Agilent Technologies, Mississauga, ON, Canada).
2.5. Transmission Electron Microscopy (TEM)
The pure and cation substituted phases were suspended in H2O and deposited on a copper mesh grid with a pipette. Samples were imaged with a Philips CM10 (1990, Philips Electron Optics, Eindhoven, The Netherlands) TEM with an accelerating voltage of 80 kV which has a resolution of 0.5 nm at a point and 0.34 nm on the line with a magnification of 20,000–450,000. Images were processed with Adobe Photoshop.
2.6. Phosphorus K-Edge XANES Spectroscopy
All P K-edge XANES spectra were collected in partial fluorescence (PFY) mode at the Canadian Light Source (CLS) at beamline 06B1-1, the Soft X-Ray Micro-characterization Beamline (SXRMB). The storage ring of the facility operates at an energy of 2.96 GeV and a stored current between 225–150 mA. Spectra were collected using an InSb (111) monochromator (Δ E/E = 3.3 × 10⁻⁴) and a four-element Si-drift fluorescence detector (Bruker). Samples were diluted to 1% wt. P with BN to minimize self-absorption effects associated with PFY. Powders were ground with an agate mortar and pestle to minimize particle size effects on XANES intensities, thinly spread on double-sided carbon tape, and mounted on a copper plate. A minimum of two spectra were collected for each mineral sample, which were then averaged. A check of beamline resolution and stability was performed after every storage ring injection by measuring a BN diluted ZnPO4 standard. Samples were scanned from 2120 to 2220 eV, with a step size of 0.5 eV from 2140–2190 eV and a larger step pre and post edge.
3. Results
Brushite/Newberyite mineral series: Synchrotron-based XAS and XRD (Figure 1) and laboratory-based FTIR and TEM (Figure 2) were used to examine different aspects of structural changes due to cationic substitution into the structure of the MeHPO4. H2O mineral series. Brushite with increasing Mg substitution was synthesized with starting pH of 5.4, whereas newberyite synthesis with increasing Ca substitution occurred at pH 6.0–7.0. (Results from the newberyite series is found in Supplemental Information). In both cases, identifiable differences in the minerals formed as a function of initial solution Ca:Mg composition occurred in low (0%–25% denoted by orange spectra in Figure 1 and Figure 2), medium (25%–75% denoted by green spectra in Figure 1 and Figure 2), and high levels (87.5%–100% denoted by blue spectra in Figure 1 and Figure 2) of substituent cation present.
Brushite/Newberyite, low Mg2+: In this study, low levels of Mg in solution, <25%, have little effect on the structure of the brushite formed. There is a slight discrepancy in XRD patterns as the relative peak intensities of lower d-spacings are skewed relative to published parameters and Miller indices, but all diffractograms are consistent with a pure brushite phase [37]. The local structure of these minerals, based on P K-edge XANES spectra, are also unaffected by Mg incorporation (Figure 1, left-orange). Diagnostic spectral features such as the white line intensity and energy position, post edge shoulder, and oxygen oscillations at 2162 and 2170 eV are consistent with unsubstituted brushite. Corroborating evidence is presented in the ATR-FTIR spectra (Figure 2A). Infrared spectra of pure and 25% Mg-bearing brushite are consistent with standard spectra from commercially acquired minerals, primarily based on the diagnostic close triplet of peaks around 1000 cm−1. These features are located at (ν1PO) 983, (ν3PO) 1043, and (ν3PO) 1115 cm−1 associated with PO vibrations (Figure 2A). A shift of 5–10 cm−1 to higher wavenumber occurs in the ν3 PO vibration with the addition of 25% Mg in solution, (ν1PO 983 cm−1, ν3PO 1054 cm−1, and ν3PO 1120 cm−1). This shift indicates there is a change in the local environment, but there is no lack of definition or peak broadening to indicate that there are multiple bonding environments or significant strain (Figure S4 in Supplemental Materials). Morphologically (Figure 2D), brushite formed in exclusively Ca solution is aggregated in rod crystals where the length is much greater than the width, on the order of 1000 nm in length and 100 nm in width. A noticeable change is identifiable with Mg inclusion in the formation solution. The crystallites of brushite containing low levels of Mg in solution are smaller, spherical or ovoid in shape, and appear to be much less uniform. These minerals are all heavily aggregated, either from sample preparation or solution conditions, which makes identification of specific particle dimensions difficult but are approximately 200 × 150 nm.
Brushite/Newberyite, medium Mg2+: In solutions that are roughly equimolar in respect to Ca and Mg, and range in pH from 5.4 to 7.0, a precipitate was produced that is consistent with brushite that has a strained local structure. The overall crystal lattice is largely the same, but the local bonding environment is altered, chiefly observed via P K-edge XANES spectra that are much more altered from pure brushite than is the XRD pattern (Figure 1, green). The crystal lattice of these minerals are not different from a pure brushite phase. The chief difference is a raised background through 4° to 25° that is consistent with increased amorphous content and/or disorder in the structure of the mineral [38]. This is plausible, since Mg substitution into the brushite crystal lattice will result in strain due to the smaller atomic radius of Mg [11]. The ATR-FTIR and P K-edge XANES spectra are more sensitive to the local structure and show a more dramatic change in spectral features. The most apparent change in the XANES spectra is the loss of definition of the post edge shoulder, which decreases from a 1 eV “ledge” to smaller feature (Figure 1); the intensity of the oscillation at 2162 eV is also decreased. As these spectral features are diagnostic of calcium phosphates and have a positive correlation with the crystallinity of these minerals [20], it can be inferred that these phases are less crystalline than pure Ca-only phase but that are still essentially a mineral with the same structure. Similarly, the ATR-FTIR spectra are heavily modified in equimolar cation solutions. In systems with moderate concentrations of Mg relative to Ca (Figure 2B), the spectra have very broadened features: the triplet of PO around 1050 cm−1 is not present. Instead, there is one broad peak centered at 1049 cm−1, a 1647 cm−1 vibration due to H-O-H bending that is present but broadened, and a νOH− stretch at 3300 cm−1. This peak broadening and loss of features are also consistent with the strain that Mg causes on the crystal structure, resulting in a range of slightly different bond distances and symmetries all with slightly different IR stretches that appear as a broad peak. Transmission Electron Microscopy images are not largely different than those of 25% substituted brushite and show precipitates with smaller dimensions, spherical or ovoid in shape, less uniform and heavily aggregated in Figure 2E. The particle size is smaller with moderate Mg substitution, on the order of 120 × 80 nm, rather than 200–150 nm in low Mg substitution.
Brushite/Newberyite, high Mg2+: At high Mg concentrations (above 1:8), the solution exclusively orms newberyite, a neutral/acidic magnesium phosphate phase. These phases have little to no Ca inclusion, with XRD consistent with newberyite patterns (Figure 1). This pattern may appear to be a mixture, but newberyite is of the low symmetry triclinic space group which produces many diffraction peaks. Phosphorus K-edges XANES spectra of these minerals are not rich with spectral features but are distinct from calcium phosphate phases. The white line intensities of magnesium phosphate phases are shifted slightly (~0.5 eV) to higher energy and have no post edge shoulder or oscillation at 2162 eV. There is a very slight peak at 2155 eV that is more pronounced in some newberyite standard compounds than in the mixed phases produced in this study. The local bonding environment is also (>1:8 Ca:Mg) consistent with newberyite when measured using ATR-FTIR (Figure 2C). The PO stretches are present in a prominent peak located at 1016 cm−1, and lesser peaks located at 1156 cm−1 and 883 cm−1. There is also a relatively strong absorbance band at 3250 cm−1. The crystallites formed in solutions with 0% Ca have a wide size distribution, but a rough average particle dimensions are 500 × 400 nm based upon TEM (Figure 2F). The particles of newberyite containing 12.5% Mg in solution are aggregated, roughly ovoid particles with a rough dimension of 150 × 130 nm.
Hydroxyapatite and Bobierrite Mineral Series
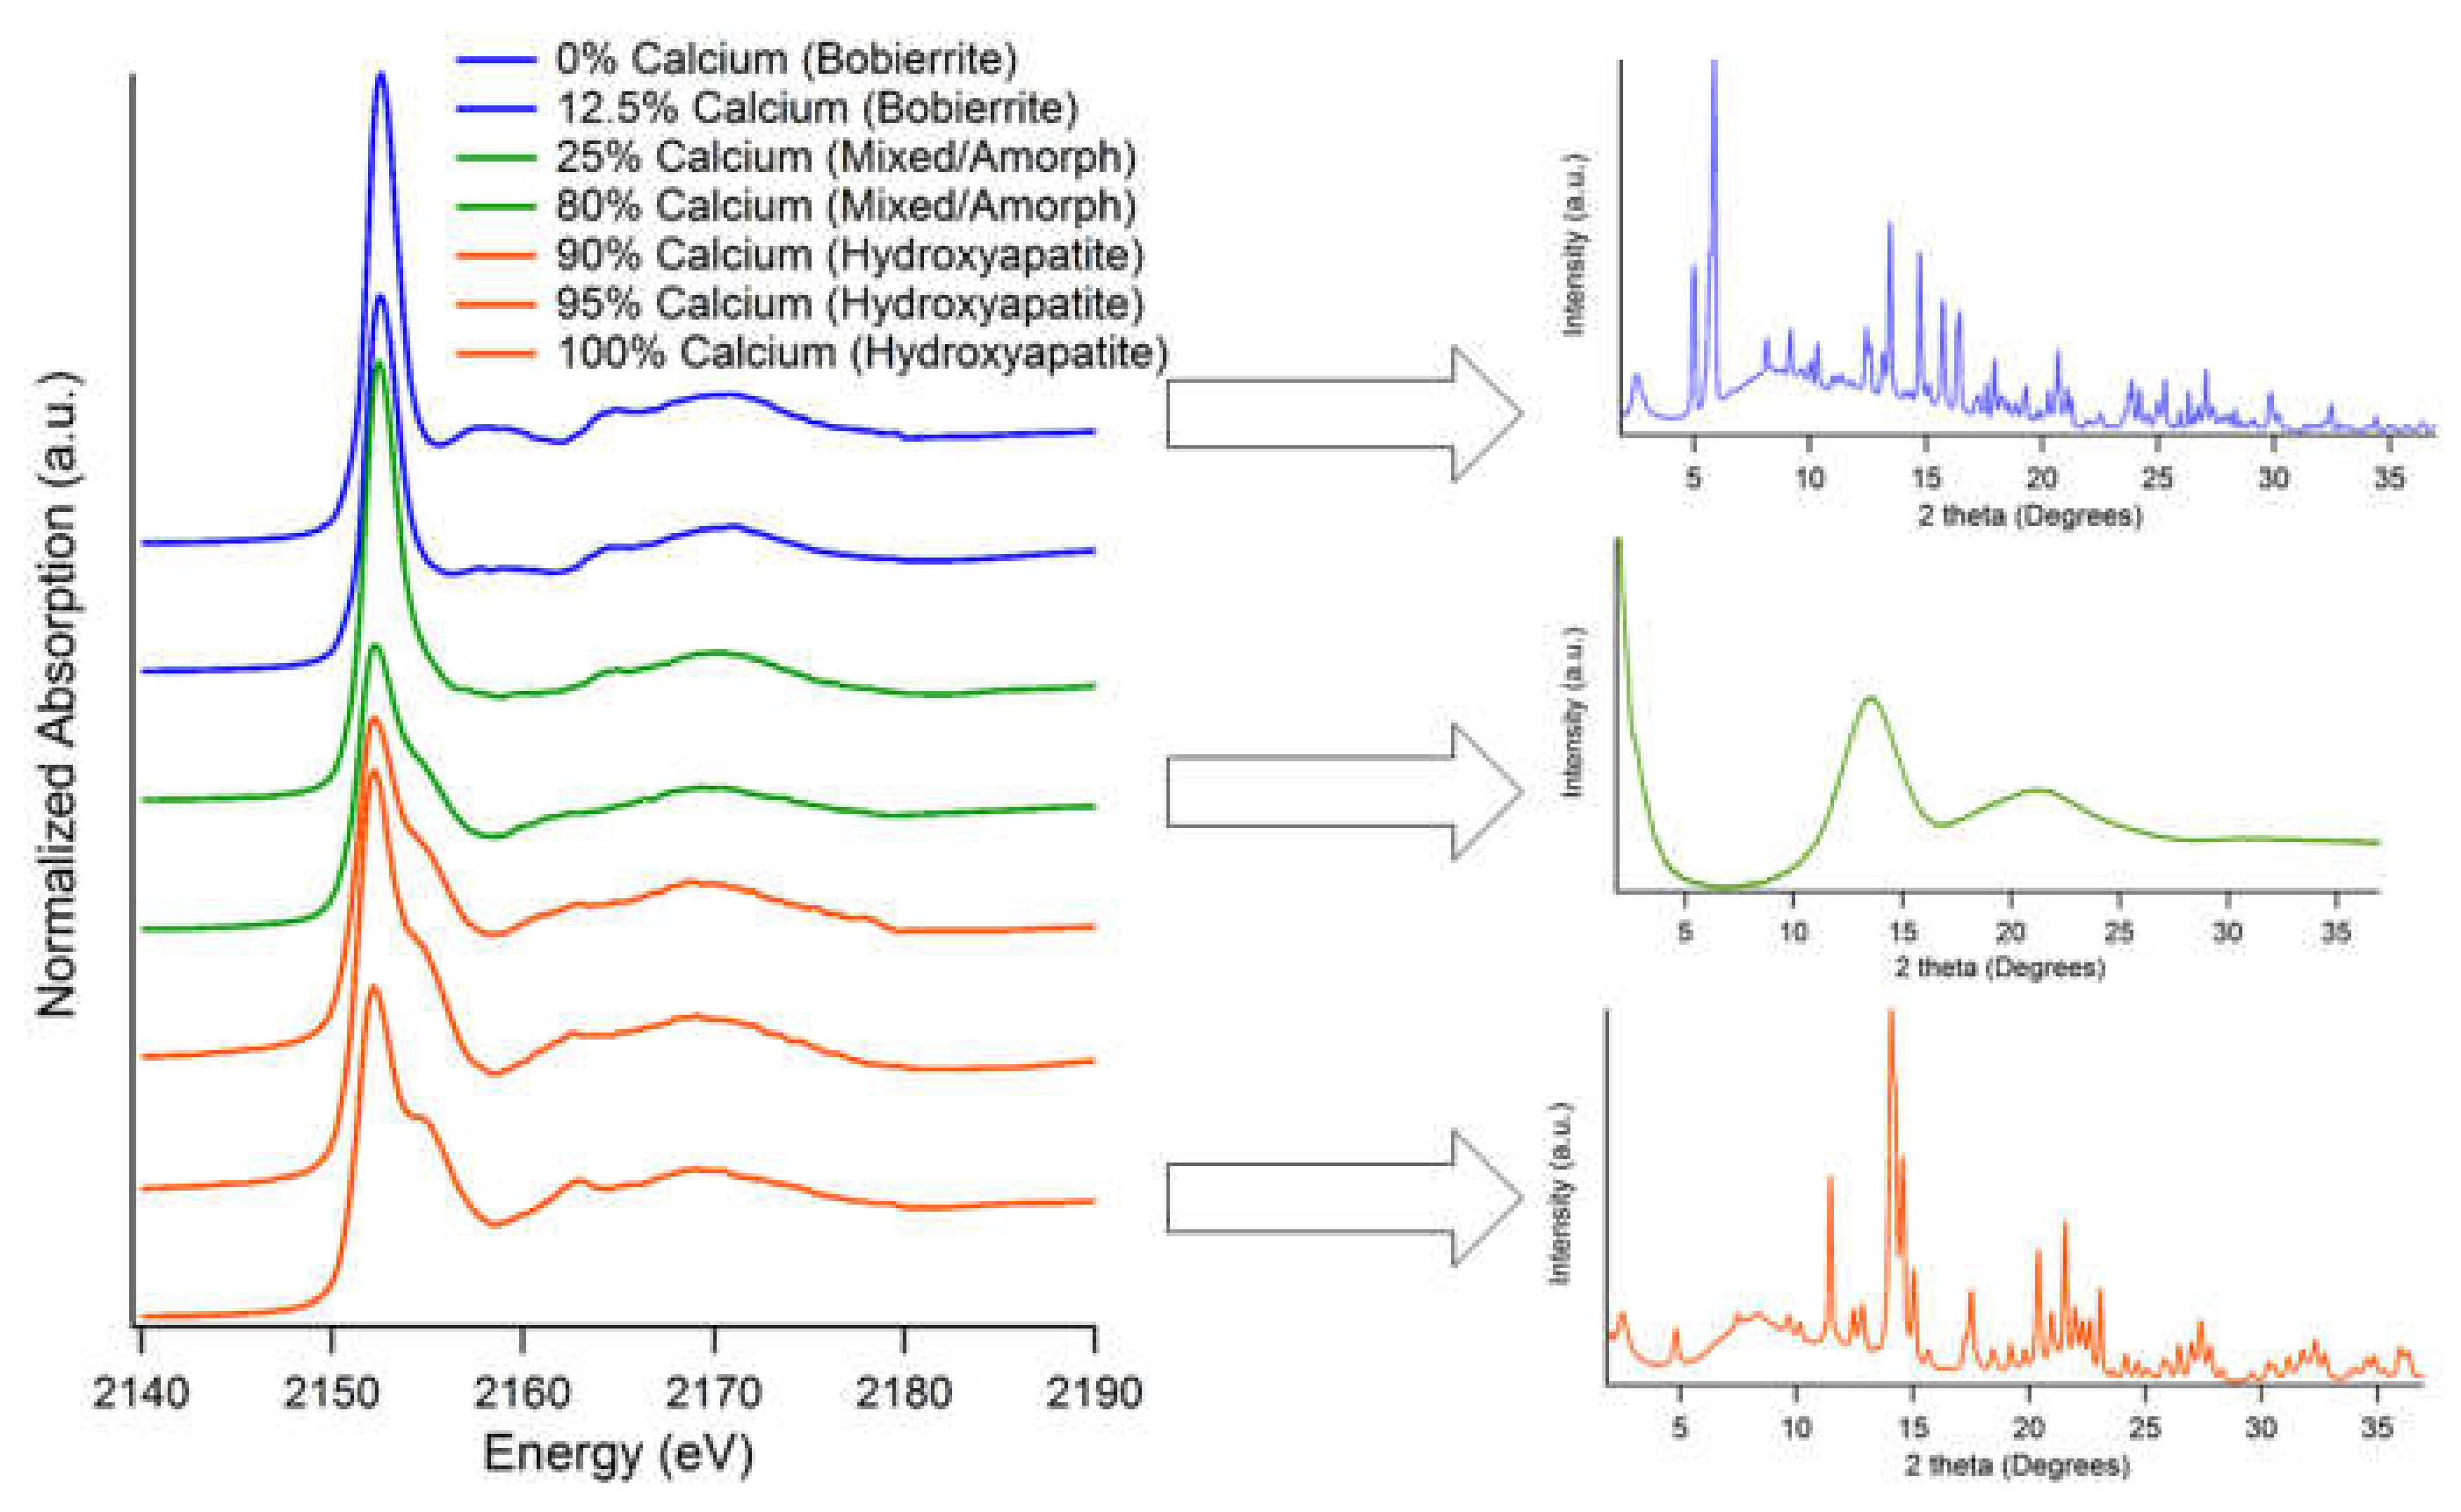
Hydroxyapatite/Bobierrite, low Mg2+: Solutions containing a very high proportion of Ca to Mg, 20:1, produce a precipitate structurally similar to pure hydroxyapatite mineral. There is a decrease in Ca in the mineral (Table 1) but no corresponding increase in Mg inclusion. The Ca:Mg ratio associated with this mineral is less than 0.02, which may be entirely due to surface adsorption rather than incorporation. Based on this information, it can speculated that the mineral is a calcium-deficient hydroxyapatite (CDHA) [1], with local bonding environment that is not drastically different from pure hydroxyapatite. Phosphorus K-edge XANES and ATR-FTIR spectra exhibit the diagnostic features that are associated with HAP with several differing spectral characteristics (Figure 3 and Figure 4A). The 20:1 mineral features the “wide” post-edge shoulder located at 2155 eV in the P K-edge XANES spectra associated with crystalline Ca-P phases. In the ATR-FTIR spectra, a ν3PO peak is located at 1027 cm−1 with slight peaks/shoulders for (ν3PO) at 1087 cm−1 and (ν1PO) 962 cm−1. It is worth noting that, in contrast with CDHA, there does not appear to be the inclusion of water in the crystal structure that is associated with amorphous calcium phosphate (ACP). Water inclusion is exhibited by defined peaks, such as those found in brushite (Figure 3) or bobierrite (Figure 4C) in the 3200–3400 cm−1 region. The broad, relatively low intensity absorbance band at 3300 cm−1 found in the 20:1 mineral corresponds to H2O, but not inclusion in the structure. Full dehydration requires high temperature, which increases crystallinity and forms the β-tricalcium phosphate analog whitlockite if Mg is present [15,39]. On the “macro” scale, the mineral (Figure S5 in Supplemental Materials) is considerably different than a pure phase HAP. When analyzed with TEM, the mineral was difficult to de-aggregate but is clearly not composed of the thin, platy sheets approximately 200 × 50 nm that were found in pure HAP.
Hydroxyapatite/ bobierrite, 5%–75% Mg2+: Precipitates formed in solutions comprising of 10 to 50% Mg are similar to HAP in regard to local bonding environment but are structurally distinct. (Table 1) The Ca:P ratio of these minerals falls within the range of what is considered ACP: 1.41 in the 5:1 mineral to 1.34 in 1:1 mineral [1]. There is no corresponding increase in Mg content that would indicate significant cationic substitution; the 5:1 ratio synthesized mineral is only 6.0% Mg in the solid-state. The XRD patterns of these phases are amorphous, with no defined peaks and only two broad, low-intensity features located at 14 and 22° 2θ (Figure 3). The P K-edge XANES of these “amorphous” substituted phases are consistent with slightly altered hydroxyapatite spectra, where the post edge shoulder and 2162 eV oscillations are less defined. Similarly, the ATR-FTIR spectra are altered, with the intensity of the peak at 1027 cm−1 (ν3PO with carbonate) being decreased, the band at 962 cm−1 (ν1PO) becoming more prominent, and the shoulder of 1087 cm−1 (ν3PO) absent. The relative intensity of the ν OH- stretch at 3300 cm−1 is of greater magnitude, though this is possibly due to a decrease in the intensity of the main PO4 absorbance. However, particles of these precipitates are strikingly different when examined via TEM (Figure 4D–F). The 5:1 mineral is composed of chains of spherical/ovoid individuals with a binary size distribution. The larger crystallites within this binary distribution are approximately 125 nm in width and while the smaller particles are 30 nm in dimensions.
Hydroxyapatite/bobierrite, 75%–100% Mg2+: Magnesium-rich alkaline conditions will form a mineral precipitate that is consistent with bobierrite from XRD (Figure 3). The local bonding environment of bobierrite is not affected by the mixed cation solution. Phosphorus K-edge XANES spectra feature the diagnostic features of bobierrite: white line energy and a twin set of oxygen oscillations shifted to higher energy (by ~1eV) relative to the XANES spectra of calcium phosphate minerals. The ATR-FTIR spectrum of concentrated Mg systems is unchanged from the pure bobierrite phase and distinct from systems which are predominantly Ca due to more prominent ν3PO vibrations, located at 1010, 1041, and 1066 cm−1. There is also a large spectral contribution in the 3500 to 3100 cm−1 region that are associated with the νOH− stretches of water, which is expected since the structure of this mineral contains eight different crystallographic positions for water molecules. Synthesized 0% Ca-bobierrite is composed of particles of varying size and morphology. These particles are generally composed of straight lines and angles as opposed to being curved or ovoid in nature with a wide range of crystals from 275 × 175 nm to 630 × 430 nm. These particles are not observed in mixed cation solutions of 1:4 and 1:8; instead aggregated spherical or ovoid crystals that are under 200 nm in diameter and as small as 60 nm are found.
4. Discussion
For brushite/newberite, there is a threshold Ca:Mg ratio of approximately 3:1; if Mg is less than this value, brushite forms without its crystal structure being substantially altered. Magnesium does have some impact on mineral formation in this substitution range, as the crystallite macrostructure of low Mg brushite differs from pure Ca brushite in TEM (Figure 2E). Low Mg substitution does not induce localized structural changes: X-ray absorption near edge spectroscopy, ATR-FTIR, and XRD spectra and patterns are all in agreeance with a structure that is unchanged from a pure Ca brushite mineral. The only obvious change upon low Mg incorporation is a decrease in particle size and morphology, which might have an effect upon solubility. Solutions composed of 25:75 to 75:25 (Ca:Mg) produced a modified brushite mineral. The local bonding environment is strongly influenced by the mixed cation solution as the ATR-FTIR spectra and P K-edge XANES of these precipitates is recognizable as a low crystallinity calcium phosphate but are not readily apparent as brushite. Magnesium phosphates do not form in mixed solutions unless the concentration is overwhelmingly in favour of Mg (1:8), affirming their lack of study in nature, but not to say they cannot form in localized region with high Mg. As found with the other minerals in this series, the macro-structure via TEM was changed in the mixed solution. The crystal structure and the local bonding environment are newberyite. The observation that Mg-bearing brushite (e.g., at Ca:Mg of 1:1) has a P K-edge XANES spectra that is distinct from pure Ca brushite, and that this identifiable substituted phase occurs at Ca:Mg ratios less than those commonly found in nature, including soils, may also be important to the metastability of brushite in soils. The diffraction pattern of Mg-bearing brushite is consistent with that of pure brushite indicating the overall crystal structure is unaffected. However, there are extreme morphological changes presented by TEM images as well as broadening of FTIR bands consistent with many slightly different local bonding environments deriving from strains caused by Mg incorporation and/or substitution. This is in agreement with P K-edge XANES spectra that are similar to the pure brushite mineral but with a lower crystallinity/ordered local environment.
For hydroxyapatite/bobierrite, the addition of Mg2+ generally results in a short-range order (SRO) intermediate phase rather than substantial cation substitution. Overall, SRO hydroxyapatite has ATR-FTIR and P K-edge XANES that are extremely similar to hydroxyapatite, but in SP-XRD and TEM the mineral(s) appear as amorphous and are very small particles. Effectively, this Mg ‘influenced’ calcium phosphate is an amorphous calcium phosphate where SRO is consistent with hydroxyapatite. It is possible that much of the hydroxyapatite that has been identified within soils with P K-edge XANES is, instead, this short-range order phase rather than pure HAP. It was found that bobierrite is able to form in solutions with a large amount of Mg without affecting the local bonding environment.
Despite direct observation of brushite and ACP in many calcareous soils using XAS, thermodynamic modeling predicts that hydroxyapatite should be the solubility limiting mineral phase [40]. Consider the following: (1) Ca:P ratio is often much greater than the 1.67:1 ratio that favours the formation of apatite, and (2) soil pH is often greater than 7, where minerals such as brushite are unstable due to HPO42− dissociation in solution. It is possible that hydroxyapatite is kinetically inhibited, but given the long timeframe of soil formation this seems less than convincing. The findings of this paper lead to alternative explanations for the persistence of poorly crystalline phosphates in the environment that have not been previously considered: (1) Mg inhibition of hydroxyapatite crystallization and propagation, and (2) incorporation of Mg into the brushite crystal lattice.
5. Conclusions
This study produced a library of P K-edge XANES spectra of mixed calcium-magnesium minerals that have not been previously studied or collected. A comprehensive set of spectra from the minerals described in this paper, with two additional synthesis series, monetite (CaHPO4) and struvite (NH4MgPO4•6H2O) can be found in the Supplemental Information (Supplement B). From a mineralogical standpoint, the presence of Mg in solution has effects on the crystallography and speciation of calcium phosphate minerals. Pure Mg phases only occurred where there was an overwhelming proportion of Mg (≥1:8 Ca:Mg). Phases produced in mixed cationic solutions were observed to be less crystalline and smaller throughout the study, which can be inferred to increase overall mineral solubility. For future spectroscopic studies in acidic or neutral pH systems containing Mg, it is recommended that a Mg-bearing brushite is considered in P XANES fitting rather than a pure CaHPO4 phase. This phase is likely to be more representative of what is present in soils and an under-fitting of brushite will occur if the Mg-bearing phase is not included. This phase should also be looked for in future studies using microbeam XANES to study local speciation in soils. In basic solutions, Mg quite effectively limits the rapid precipitation of hydroxyapatite, which may be a strong factor in the limited occurrence of HAP in calcareous soils despite being far less soluble than other calcium phosphates. Any inclusion of Mg adversely affects the crystallization of hydroxyapatite but does not alter its spectroscopic signature in XANES or ATR-FTIR. If Mg substitution plays a role in stabilizing brushite and inhibiting HAP formation, this may provide important insight into why crystalline hydroxyapatite is observed in more weathered agricultural soils. In such systems, phosphate and lime (calcium carbonate) are typically applied repeatedly as fertility treatments, but Mg is depleted due to both plant uptake and leaching. Alternatively, it is possible that where HAP has been identified with P XANES in natural systems that a substantial proportion is, in fact ACP. Future research directions in this field should concern the long term evolution, stability and solubility constants of the minerals formed in Ca:Mg mixed cation solutions.
Supplementary Materials
The following are available online at https://www.mdpi.com/2571-8789/4/1/8/s1. Supplemental Information A contains 5 figures detailing ATR-FTIR, XANES, and XRD information for mineral samples not included in this manuscript. Supplemental Information B is a spreadsheet of all of the normalized XANES spectra of phosphate minerals produced as part of this research project.
Author Contributions
D.M.H. synthesized the minerals, collected the XAS, FTIR, XRD, and SEM data, analyzed the results, and drafted the manuscript. J.G.H. provided expertise in XAS and XRD data collection, analysis and interpretation as well as providing editorial comments on the manuscript. D.P. was the Principal Investigator for the project, supervisor for both D.M.H. and J.G.H., and also contributed to experimental design, data analysis, and provided rewrites and revisions of the manuscript. All authors have read and agreed to the published version of the manuscript.
Funding
Funding for this project was provided by the National Science and Engineering Research Council (NSERC) Discovery Grant (Derek Peak) and a NSERC—Federated Co-operatives Limited (FCL) funded College-University Idea2Innovate Grant.
Acknowledgments
The authors thank the CLS beamline staff at SXRMB and CMCF ID-2 for support in data collection. Research described in this paper was performed using the Canadian Light Source, which is supported by the Canada Foundation for Innovation, Natural Sciences and Engineering Research Council of Canada, the University of Saskatchewan, the Government of Saskatchewan, Western Economic Diversification Canada, the National Research Council Canada, and the Canadian Institutes of Health Research. We also acknowledge the support of the University of Saskatchewan Department of Biology Microscopy Lab (Gouosheng Liu) in collection of TEM images.
Conflicts of Interest
The authors declare no conflict of interest.
References
- Dorozhkin, S.V. Calcium Orthophosphates: Occurrence, Properties, Biomineralization, Pathological Calcification and Biomimetic Applications. Biomatter 2011, 1, 121–164. [Google Scholar] [CrossRef] [PubMed]
- Kar, G.; Hundal, L.S.; Schoenau, J.J.; Peak, D. Direct Chemical Speciation of P in Sequential Chemical Extraction Residues Using P K-Edge X-Ray Absorption near-Edge Structure Spectroscopy. Soil Sci. 2011, 176, 589–595. [Google Scholar] [CrossRef]
- Peak, D.; Kar, G.; Hundal, L.; Schoenau, J. Kinetics and Mechanisms of Phosphorus Release in a Soil Amended With Biosolids or Inorganic Fertilizer. Soil Sci. 2012, 177, 183–187. [Google Scholar] [CrossRef]
- Manimel Wadu, M.C.W.; Michaelis, V.K.; Kroeker, S.; Akinremi, O.O. Exchangeable Calcium/Magnesium Ratio Affects Phosphorus Behavior in Calcareous Soils. Soil Sci. Soc. Am. J. 2013, 77, 2004. [Google Scholar] [CrossRef]
- Johnsson, M.S.; Nancollas, G.H. The Role of Brushite and Octacalcium Phosphate in Apatite Formation. Crit. Rev. Oral Biol. Med. 1992, 3, 61–82. [Google Scholar] [CrossRef]
- Valsami-Jones, E. Mineralogical Controls on Phosphorus Recovery from Wastewaters. Mineral. Mag. 2001, 65, 611–620. [Google Scholar] [CrossRef]
- Racz, G.; Soper, R. Reaction Products of Orthophosphates in Soils Containing Varying Amounts of Calcium and Magnesium. Can. J. Soil Sci. 1967, 47, 223–230. [Google Scholar] [CrossRef]
- Bauge, S.M.Y.; Lavkulich, L.M.; Schreier, H.E. Serpentine Affected Soils and the Formation of Magnesium Phosphates (Struvite). Can. J. Soil Sci. 2013, 93, 161–172. [Google Scholar] [CrossRef] [Green Version]
- Vogel, C.; Adam, C.; Sekine, R.; Schiller, T.; Lipie, E.; McNaughton, D. Determination of Phosphorus Fertilizer Soil Reactions by Raman and Synchrotron Infrared Microspectroscopy. Appl. Spectrosc. 2013, 67, 1165–1170. [Google Scholar] [CrossRef] [Green Version]
- Siciliano, S.D.; Chen, T.; Phillips, C.; Hamilton, J.; Hilger, D.; Chartrand, B.; Grosskleg, J.; Bradshaw, K.; Carlson, T.; Peak, D. Total Phosphate Influences the Rate of Hydrocarbon Degradation but Phosphate Mineralogy Shapes Microbial Community Composition in Cold-Region Calcareous Soils. Environ. Sci. Technol. 2016, 50, 5197–5206. [Google Scholar] [CrossRef]
- Salimi, M.H.; Heughebaert, J.C.; Nancollas, G.H. Crystal Growth of Calcium Phosphates in the Presence of Magnesium Ions. Langmuir 1985, 1, 119–122. [Google Scholar] [CrossRef]
- Wang, L.; Nancollas, G.H. Calcium Orthophosphates: Crystallization and Dissolution. Chem. Rev. 2008, 108, 4628–4669. [Google Scholar] [CrossRef] [PubMed] [Green Version]
- Cao, X.; Harris, W. Carbonate and Magnesium Interactive Effect on Calcium Phosphate Precipitation. Environ. Sci. Technol. 2008, 42, 436–442. [Google Scholar] [CrossRef]
- Boanini, E.; Gazzano, M.; Bigi, A. Ionic Substitutions in Calcium Phosphates Synthesized at Low Temperature. Acta Biomater. 2010, 6, 1882–1894. [Google Scholar] [CrossRef]
- Diallo-Garcia, S.; Laurencin, D.; Krafft, J.M.; Casale, S.; Smith, M.E.; Lauron-Pernot, H.; Costentin, G. Influence of Magnesium Substitution on the Basic Properties of Hydroxyapatites. J. Phys. Chem. C 2011, 115, 24317–24327. [Google Scholar] [CrossRef]
- Driessens, F.C.M.; Verbeek, R.M.H. The Calcium Rich Compounds of the System Ca(OH)2-H3PO4-H2O; CRC Press: Boca Raton, FL, USA, 1990; pp. 37–59. [Google Scholar]
- Cao, X.; Harris, W.G.; Josan, M.S.; Nair, V.D. Inhibition of Calcium Phosphate Precipitation under Environmentally-Relevant Conditions. Sci. Total Environ. 2007, 383, 205–215. [Google Scholar] [CrossRef]
- Hesterberg, D. Chapter 11 – Macroscale Chemical Properties and X-Ray Absorption Spectroscopy of Soil Phosphorus. Dev. Soil Sci. 2010, 34, 313–356. [Google Scholar] [CrossRef]
- Franke, R.; Hormes, J. The P K-near Edge Absorption Spectra of Phosphates. Phys. B Phys. Condens. Matter 1995, 216, 85–95. [Google Scholar] [CrossRef]
- Hesterberg, D.; Zhou, W.; Hutchison, K.J.; Beauchemin, S.; Sayers, D.E. XAFS Study of Adsorbed and Mineral Forms of Phosphate. J. Synchrotron Radiat. 1999, 6, 636–638. [Google Scholar] [CrossRef]
- Okude, N.; Nagoshi, M.; Noro, H.; Baba, Y.; Yamamoto, H.; Sasaki, T. P and S K-Edge XANES of Transition-Metal Phosphates and Sulfates. J. Electron Spectros. Relat. Phenomena 1999, 101–103, 607–610. [Google Scholar] [CrossRef]
- Werner, F.; Prietzel, J. Standard Protocol and Quality Assessment of Soil Phosphorus Speciation by P K-Edge XANES Spectroscopy. Environ. Sci. Technol. 2015, 49, 10521–10528. [Google Scholar] [CrossRef] [PubMed]
- Peak, D.; Sims, J.T.; Sparks, D.L. Solid-State Speciation of Natural and Alum-Amended Poultry Litter Using XANES Spectroscopy. Environ. Sci. Technol. 2002, 36, 4253–4261. [Google Scholar] [CrossRef] [PubMed]
- Ajiboye, B.; Akinremi, O.O.; Hu, Y.; Jürgensen, A. XANES Speciation of Phosphorus in Organically Amended and Fertilized Vertisol and Mollisol. Soil Sci. Soc. Am. J. 2008, 72, 1256. [Google Scholar] [CrossRef]
- Liu, J.; Yang, J.; Cade-Menun, B.J.; Liang, X.; Hu, Y.; Liu, C.W.; Zhao, Y.; Li, L.; Shi, J. Complementary Phosphorus Speciation in Agricultural Soils by Sequential Fractionation, Solution P Nuclear Magnetic Resonance, and Phosphorus K-Edge X-Ray Absorption Near-Edge Structure Spectroscopy. J. Environ. Qual. 2013, 42, 1763. [Google Scholar] [CrossRef]
- Kar, G.; Schoenau, J.; Hilger, D.; Peak, D. Direct Chemical Speciation of Soil Phosphorus in a Saskatchewan Chernozem after Long and Short-Term Manure Amendments. Can. J. Soil Sci. 2017, 11. [Google Scholar] [CrossRef] [Green Version]
- Ingall, E.D.; Brandes, J.A.; Diaz, J.M.; De Jonge, M.D.; Paterson, D.; McNulty, I.; Elliott, W.C.; Northrup, P. Phosphorus K-Edge XANES Spectroscopy of Mineral Standards. J. Synchrotron Radiat. 2011, 18, 189–197. [Google Scholar] [CrossRef] [Green Version]
- Oxmann, J.F. Technical Note: An X-Ray Absorption Method for the Identification of Calcium Phosphate Species Using Peak-Height Ratios. Biogeosciences 2014, 11, 2169–2183. [Google Scholar] [CrossRef] [Green Version]
- Lee, D.; Kumta, P.N. Chemical Synthesis and Characterization of Magnesium Substituted Amorphous Calcium Phosphate (MG-ACP). Mater. Sci. Eng. C 2010, 30, 1313–1317. [Google Scholar] [CrossRef]
- Aramendía, M.A.; Borau, V.; Jiménez, C.; Marinas, J.M.; Romero, F.J. Synthesis and Characterization of Magnesium Phosphates and Their Catalytic Properties in the Conversion of 2-Hexanol. J. Colloid Interface Sci. 1999, 217, 288–298. [Google Scholar]
- Riman, R.E.; Sever, C. Biomimetic Hydroxyapatite Synthesis. US. Patent 8287914 B2, 16 October 2012. [Google Scholar]
- Laurencin, D.; Almora-Barrios, N.; de Leeuw, N.H.; Gervais, C.; Bonhomme, C.; Mauri, F.; Chrzanowski, W.; Knowles, J.C.; Newport, R.J.; Wong, A.; et al. Magnesium Incorporation into Hydroxyapatite. Biomaterials 2011, 32, 1826–1837. [Google Scholar] [CrossRef] [Green Version]
- Kolmas, J.; Jaklewicz, A.; Zima, A.; Bućko, M.; Paszkiewicz, Z.; Lis, J.; Ślósarczyk, A.; Kolodziejski, W. Incorporation of Carbonate and Magnesium Ions into Synthetic Hydroxyapatite: The Effect on Physicochemical Properties. J. Mol. Struct. 2011, 987, 40–50. [Google Scholar] [CrossRef]
- Toby, B.H.; Von Dreele, R.B. GSAS-II: The Genesis of a Modern Open-Source All Purpose Crystallography Software Package. J. Appl. Crystallogr. 2013, 46, 544–549. [Google Scholar] [CrossRef]
- Degen, T.; Sadki, M.; Bron, E.; König, U.; Nénert, G. The HighScore Suite. Powder Diffr. 2014, 29, S13–S18. [Google Scholar] [CrossRef] [Green Version]
- Larson, A.C.; Von Dreele, R.B. General Structure Analysis System; report LAUR 86-748; Los Alamos National Laboratory: Los Alamos, NM, USA, 2004. [Google Scholar] [CrossRef]
- Schofield, P.F.; Knight, K.S.; van der Houwen, J.A.M.; Valsami-Jones, E. The Role of Hydrogen Bonding in the Thermal Expansion and Dehydration of Brushite, Di-Calcium Phosphate Dihydrate. Phys. Chem. Miner. 2004, 31, 606–624. [Google Scholar] [CrossRef]
- Waseda, Y.; Matsubara, E.; Shinoda, K. X-Ray Diffraction Crystallography; Springer Science & Business Media: Berlin, Germany, 2011. [Google Scholar] [CrossRef]
- Stipniece, L.; Salma-Ancane, K.; Jakovlevs, D.; Borodajenko, N.; Berzina-Cimdina, L. The Study of Magnesium Substitution Effect on Physicochemical Properties of Hydroxyapatite. Mater. Sci. Appl. Chem. 2013, 28, 51. [Google Scholar] [CrossRef] [Green Version]
- Lindsay, W.L. Chemical Equilibria in Soils; John Wiley & Sons: Chichester, UK, 1979. [Google Scholar]
Figure 1.
XANES and XRD patterns of acidic/neutral mineral series. Blue spectra/patterns indicate magnesium phosphates, green spectra indicate minerals formed in mixed cation solutions with unique characteristics, and orange spectra are crystalline calcium phosphates. Percentages refer to initial solution composition during synthesis.

Figure 2.
ATR-FTIR (top) and TEM images (bottom) of the brushite/newberyite series: (A,D) pure brushite, (B,E) Mg-brushite formed from 1:1 (Ca:Mg) solution ratio, (C,F) pure newberyite. Larger versions of ATR-FTIR spectra are available in the Supplementary Information.
Figure 2.
ATR-FTIR (top) and TEM images (bottom) of the brushite/newberyite series: (A,D) pure brushite, (B,E) Mg-brushite formed from 1:1 (Ca:Mg) solution ratio, (C,F) pure newberyite. Larger versions of ATR-FTIR spectra are available in the Supplementary Information.

Figure 3.
Hydroxyapatite/amorphous calcium phosphate/bobierrite P K-edge XANES and XRD, Blue spectra/patterns indicate magnesium phosphates, green spectra indicate minerals formed in mixed cation solutions with unique characteristics (i.e., ACP), and orange spectra are crystalline calcium phosphates. Percentages refer to initial solution conditions during synthesis.

Figure 4.
ATR-FTIR (top) and TEM images (bottom) of the apatite/bobbierite series: (A,D) pure hydroxyapatite, (B,E) hydroxyapatite/amorphous calcium phosphate formed from 5:1 (Ca:Mg) initial solution conditions, (C,F) pure bobierrite. Larger versions of ATR-FTIR spectra are available in the upplementary Information.


Table 1.
Elemental composition of synthesized minerals exhibiting proportions of Mg/Ca substitution.
Table 1.
Elemental composition of synthesized minerals exhibiting proportions of Mg/Ca substitution.
| Final Solid Composition (Ca:Mg) | |||||
|---|---|---|---|---|---|
| Acidic | Basic | ||||
| Initial Solution (Ca:Mg) | % Initial Ca | DCPD † | NBTE ‡ | HAP § | BOB ¶ |
| 1:0 | 100 | 1:0 | -- | 1:0 | -- |
| 20:1 | 95 | -- | -- | 1:0.02 | -- |
| 10:1 | 90 | -- | -- | 1:0.02 | -- |
| 5:1 | 80 | -- | -- | 1:0.06 | -- |
| 3:1 | 75 | 1:0.05 | -- | -- | -- |
| 1:1 | 50 | 1:0.35 | -- | -- | -- |
| 1:3 | 25 | -- | 0.7:1 | -- | 0.59:1 |
| 1:8 | 12.5 | -- | 0.35:1 | -- | 0.21:1 |
| 0:1 | 0 | -- | 0:1 | -- | 0:1 |
† DCPD = brushite; ‡ NBTE = newberyite; § HAP = hydroxyapatite; ¶ BOB = bobierrite.
© 2020 by the authors. Licensee MDPI, Basel, Switzerland. This article is an open access article distributed under the terms and conditions of the Creative Commons Attribution (CC BY) license (http://creativecommons.org/licenses/by/4.0/).
Share and Cite
MDPI and ACS Style
Hilger, D.M.; Hamilton, J.G.; Peak, D. The Influences of Magnesium upon Calcium Phosphate Mineral Formation and Structure as Monitored by X-ray and Vibrational Spectroscopy. Soil Syst. 2020, 4, 8. https://doi.org/10.3390/soilsystems4010008
AMA Style
Hilger DM, Hamilton JG, Peak D. The Influences of Magnesium upon Calcium Phosphate Mineral Formation and Structure as Monitored by X-ray and Vibrational Spectroscopy. Soil Systems. 2020; 4(1):8. https://doi.org/10.3390/soilsystems4010008
Chicago/Turabian StyleHilger, David M., Jordan G. Hamilton, and Derek Peak. 2020. "The Influences of Magnesium upon Calcium Phosphate Mineral Formation and Structure as Monitored by X-ray and Vibrational Spectroscopy" Soil Systems 4, no. 1: 8. https://doi.org/10.3390/soilsystems4010008