Increasing Access to Clean Fuels and Clean Technologies: A Club Convergence Approach


Division of Resource Economics and Management, West Virginia University, Morgantown, WV 26506, USA
Clean Technol. 2019, 1(1), 247-264; https://doi.org/10.3390/cleantechnol1010017
Submission received: 26 June 2019
/
Revised: 29 July 2019
/
Accepted: 29 July 2019
/
Published: 2 September 2019
Abstract
:In this paper we test for convergence in access to clean energy and clean technology among nations in order to study the economic determinants of access to clean energy and clean technologies. This is important because without access to clean fuels, no global development strategy can be environmentally sustainable. After obtaining an estimated convergence rate under a conditional -convergence model, we use a more sophisticated club convergence econometric framework and ultimately reject the hypothesis of -convergence in favor of subgroups exhibiting intra-group convergence tendencies that are distinct from the other groups. We then employ a club convergence algorithm which groups the 93 nations studied into 8 convergence clubs based on characteristics including the percentage of the population with access to clean energy in the household and the growth rate of this percentage. Evidence that household access to clean energy and clean technology is tied to economic development and institutional quality is provided by showing that the convergence clubs not only reflect distinct strata in access to clean energy but are also strongly tied to important indicators of institutional quality.
Keywords:
clean technology; access to clean technology; clean energy; sustainable development; convergence; club convergenceJEL Classification:
Q42; Q52; Q551. Introduction
Two of the most pressing issues today are increasing access to electricity in the developing world and transitioning from fossil fuels to clean alternatives on a global scale. More than one billion people currently lack access to electricity in their homes worldwide [1]. Increasing the severity of this problem, non-OECD nations began to collectively emit more carbon dioxide (CO) than OECD nations in 2004 [2]. As developing nations continue a trend of expanding access to electricity throughout their populations, global CO emissions will continue to rise, outpacing emissions reduction efforts elsewhere in the world, unless this newfound access comes in the form of clean fuels and clean technologies [3]. However, increasing access to electricity through any means helps to drastically improve the quality of life of those currently without access. Since suitable clean technologies already exist for this purpose, it is imperative to understand what socioeconomic barriers exist in providing access to clean fuels and clean technologies in developing nations, as removing these barriers will help contribute to an improvement in the quality of life of more than a billion people while minimizing further environmental degradation.
In this paper we study these socioeconomic barriers by using national level data on the percentage of the population with access to clean fuels and clean technologies for cooking and by categorizing nations into similar groups through the use of convergence testing and a club convergence algorithm. These groups or convergence clubs as they are called, are intended to be nations which share not only similar trends in providing access to clean fuels and clean technologies to their populations but also share similar institutional characteristics which contribute to these trends. By studying the institutional characteristics of these convergence clubs, we can make better, more informed policy decisions which address both the immediate quality of life implications for those without electricity and the environmental and socioeconomic consequence of carbon emissions.
To successfully reduce carbon emissions, any sustainable development program must address two problems. Clean power sources must replace fossil fuels for the large scale generation of electricity and access to cleanly sourced electricity needs to be universally accessible. Virtually all of the research addressing carbon emissions from power generation addresses only the first problem. While this research has led to much progress and technological advancement, a large percentage of the world’s population has not benefited from this research and continues to use dirty fuels to generate much of its power. This includes the use of fuels which combust inefficiently for producing energy at the household level for activities including generating heat and cooking food [4].
The variable of interest in this paper, the percentage of people with access to clean fuels and clean technologies for cooking in the household, is a measure of the ability of each nation to establish the widespread implementation of electricity derived from clean power sources. This metric offers insight into how well each nation is addressing the second problem for reducing carbon emissions by telling us the percentage of the population with in-house access to technologies which are capable of using energy from clean fuels [5]. Since different nations exhibit different energy portfolios, increasing the use of clean energy sources will not have uniform results. Moreover, since countries also have varying levels of access, simply converting major power stations from dirty fuels to clean fuels will not necessarily universally reduce carbon emissions in any given nation. For example, inefficient biomass burning stoves which do not fully combust the biomass are used throughout rural Kenya where bioenergy constitutes an estimated 98% of energy production [6].
The econometric basis for this work is convergence testing. Convergence testing is a regression framework in which we determine whether or not a group of countries all lie on the same growth path. When all nations, after accounting for variables such as population growth, lie on the same growth path, we call this conditional (or -) convergence. In the case of access to clean fuels and clean technologies for cooking, we would interpret this by saying that nations with lower levels of access to clean fuels and clean technologies for cooking exhibit higher rates of growth in the percentage of the population that has access to clean fuels and clean technologies for cooking. Essentially, we are addressing the question of whether or not economic growth is a reliable driver of access to clean fuels and clean technologies for cooking. If economic growth alone is not a sufficiently strong driver, for the sake of reducing global carbon emissions we must look into alternative ways to increase access to clean fuels and clean technologies. Otherwise the continued increase in carbon emissions from developing nations will more than offset all efforts to reduce carbon emissions elsewhere in the world as dirty fuels drive increases in access to electricity.
After testing for conditional convergence, we then use a club convergence approach to determine the strength of these results. Rather than supporting the notion that economic growth alone should shape policy on increasing access to clean fuels and clean technologies at the household level, we find evidence for the existence of well defined subgroups of the pool of nations studied which exhibit behaviors indicating that they lie on a different growth path than the full assemblage of nations does collectively. This supports the idea that institutional characteristics are also important drivers for increasing household level access to clean fuels and clean technologies.
We then employ the aforementioned club convergence algorithm to determine which subgroups lie on the same growth paths and which, if any, diverge from the rest of the countries studied. We find that all nations belong to a convergence club, that is, that no nations exhibit divergent behavior and the algorithm partitions the 93 nations studied into 8 convergence clubs. In order to determine whether or not, within each convergence club, nations share similar institutional characteristics, we analyze the relationship between certain macroeconomic development indicators that also serve as measures of institutional quality and the data on access to clean fuels and clean technologies. We find that the convergence clubs represent distinct groups of countries which differ across combinations of income, economic growth and institutional characteristics and that institutional quality contributes to the spread of clean fuels and clean technologies for cooking throughout a nation. Using these findings, we then address the role of institutions in helping to improve policy making regarding access to and use of cleanly sourced energy, especially in the developing world.
The remainder of this paper begins with a review of the literature related to access to either clean technologies and the methodologies used in this paper. After this literature review, we present and discuss the data used before detailing the processes of conditional convergence and club convergence along with the results we obtain from each approach and a discussion of their socioeconomic implications.
2. Literature Review
It has been estimated that approximately 18% of the global population lacks access to electricity in the household [1]. Those lacking access to electricity in the household reside overwhelmingly in developing nations, particularly in parts of Asia and in sub-Saharan Africa [7]. Increasing access to electricity in these regions of the world is key to driving economic growth [8] but given the sensitivity of these parts of the world to climate change, it is crucial that these gains in access to electricity come from clean fuels [9]. This is particularly true considering that population growth is currently far exceeding global efforts at reducing CO emissions [3].
Addressing this, there is a substantial body of literature on expanding access to electricity in these regions via clean technology and clean energy sources. Kenya has become a regional leader in sub-Saharan Africa at providing access to bioenergy powered cooking stoves, a feat which led to increases in health outcomes, rural livelihoods and gender equality [10]. Tanzania, meanwhile, has to some extent used its access to renewable energy via hydroelectric power generation to increase the level of access to clean fuels and clean technologies throughout the country, leading also to general socioeconomic improvements [11]. Elsewhere across sub-Saharan Africa in particular, wind power actually has the potential to outpace hydroelectric power and solar power has the potential to generate nearly as much as hydroelectric power can provide [12].
To fully address the lack of access to electricity, it is imperative to consider the impact of a geographically stable life. That is to say, geographic instability has kept many rural people from having consistent access to electricity [13]. Even with this geo-economic barrier in place, it is estimated that the cost to provide access to clean burning solid fuel stoves is around $20 to $30 per person [13]. Increasing geographic stability with natural, renewable energy sources may prove crucial to increasing access to electricity generally. It has been estimated that by 2030, with sufficient investment solar power could provide clean energy to rural sub-Saharan Africa at cost of less than $0.02 (USD) per kilowatt hour [14]. Minimizing the cost of energy, especially by doing so with clean sources such as solar, is imperative, especially considering the number of people still living in severe poverty [15]. In fact, kerosene lamps are still widely used to provide light at night for those living in poverty in both rural and urban Africa [15].
In order to promote further access to clean energy sources and clean technologies in Africa, it has been recommended that subsidies for fossil fuels be removed, the cost of carbon intensive fuels increased and for the development of international financing of de-risking strategies for the expansion of the use of renewable energy sources [16]. In India, it has been determined through the use of Granger causality tests that renewable energy and economic growth are fully intertwined, yet increases in financial development lead to increases in the use of renewable energy [17]. The causal direction between energy consumption and economic growth in Nigeria and Tanzania was studied in Reference [18] where it was determined that each affects the other, that is, that while economic growth will help to drive increases in energy consumption, increased energy consumption is needed to drive economic growth. Unfortunately, throughout much of the developing world, including the many nations rich in natural resources that represent clean energy sources, increasing access to electricity in any capacity is still a significant challenge [15].
Even in the developed world there are many barriers to entry for renewable fuels and the clean technologies which use these fuels [19]. As of 2007, only 4.4% of global primary energy consumption was derived from renewable energy sources [20]. In an effort to keep clean fuels and clean technologies out of the market, the economies of the developed world have resulted to exploiting the natural resources of developing countries [21]. Globalization has consequences beyond the extraction of natural resources, however. Trade openness, a proxy for globalization, has been shown to contribute to short term increases in CO emissions [22] and in the case of certain low income nations like Tunisia, create pollution havens [23].
Technological advances to address negative externalities such as CO emissions are persistent and their integration into marketplaces has been a primary concern [24]. Investigations into the environmental consequences of such technologies do exist, though knowledge of their economic impacts is limited [25]. In a different technological direction, neural networks have proven effective tools at predicting and forecasting CO intensities [26]. Nevertheless, the lack of access to clean fuels and clean technologies is a continued public health concern with additional negative climate externalities [27].
In order to contribute to the existing body of literature pertaining to the use of and access to clean fuels and clean technologies, we rely on the macroeconomic concept of convergence. The original version of this concept, called conditional or -convergence, dates back to early works exploiting Solow growth models by several authors [28,29,30,31]. Conditional convergence uses the corollary of the Solow growth model that all nations follow a common steady state path of economic growth.
This concept has been generalized, including the generalization of club convergence. Club convergence asserts that while all nations do not follow a common growth path, select clubs of nations with similar characteristics, especially institutional characteristics, follow a common club level growth path. The virtue in this approach is that, even though economic development metrics are known to be sensitive to changes in parameters [32], measures of institutional quality are known to correlate with economic growth [33]. This allows for us to determine whether institutional quality contributes to the varying levels of access to clean fuels and clean technology that we observe in the world today.
Club convergence has been applied to diverse socioeconomic phenomena including US state level CO emissions [34], economic growth among Chinese counties [35] and life expectancy in post-Soviet states [36]. While conditional convergence studies have been able to show that fairly similar trends exist among OECD nations in terms of characteristics such as per capita carbon and ecological footprints [37], a club convergence analysis provided an enhanced level of analysis by demonstrating that, among OECD nations, Switzerland and the Scandinavian nations were significantly more eco-efficient (in terms of CO, NO and SO emissions), while Portugal, Spain, Greece and the United States were the biggest culprits emitting these pollutants [38].
3. Data
Before beginning a description of the data used in this paper, it should be acknowledged that all of the data comes from the World Bank [39].
Since the focus of this paper is addressing determinants of household access to clean energy and clean technology, our dependent variable is the percentage of the population that has access to clean energy and clean technologies for cooking. Specifically what this data measures is the percentage of the population with in-house access to technologies which are capable of using energy from clean fuels [5]. While it is the case that these technologies may currently use different fuels, they must be capable of using clean fuels in order to count. As a clarifying example, many rural communities in the developing world rely on biomass stoves for cooking. However, biomass stoves are notorious for incomplete combustion and thus the emission of undesired pollutants [40]. Another common source of energy in developing countries is kerosene, a fuel which emits more than three times as much carbon dioxide per mega joule of energy produced compared to biomass stoves [40]. Per the guidelines of the World Health Organization, kerosene is also not included as a clean fuel source [39]. In the other direction, electric stoves are considered to be a clean technology because they are capable of running off of clean energy, even though the energy source is indeterminate in general.
This data can be seen as representative of half of a larger picture of sustainable development. While developed nations can focus on increasing their use of clean fuels to generate power, developing nations must also strive to increase access to clean fuels and clean technologies. By increasing access to clean fuels and clean technologies, a nation increases its potential to use clean fuels. When it comes to increasing the use of cleanly sourced energy, without the potential there can be no actualization. This is precisely why studying access to clean fuels and clean technologies is so important to sustainable development programs and this is precisely the advantage of this data set. By studying the behavior of the level of access to clean fuels and clean technologies in the household over time, we can initiate a study of the barriers which inhibit increases in the levels of access to clean fuels and clean technologies, a critical aspect for all future policy on sustainable development.
To study this behavior we use a convergence testing framework. To test for convergence, we assume that access to clean fuels and clean technologies for cooking is a byproduct of economic growth and use the standard explanatory variables for convergence testing used in the economic growth literature. These variables are the population growth rate, saving (as a percentage of GDP) and the initial level of access to clean fuels and clean technologies for cooking at the beginning of the study. In order to satisfy the econometric specifications of convergence testing, the natural logarithm has been taken for all of the independent variables included in this study. The time frame considered in the study consists of the years from 2000 through 2016. Summary statistics of the data in their final form are presented below in Table 1. A link to the repository containing the data files and python script used in this paper is provided in Appendix A.
4. Conditional Convergence
In order to determine what factors might influence the behavior of the rate of growth of a macroeconomic variable of interest, the natural starting place is to test for convergence. That is, do countries growth rates behave similarly, with current growth rates being conditional on currently observed levels of the variable of interest. Succinctly, the idea is that countries with lower current values will have higher growth rates than countries with higher current values, thus all countries will eventually converge to a nearly identical level and growth rate. If we view access to clean fuels and clean technologies for cooking as a consequence of economic growth and development, this idea translates to countries in which smaller percentages of the population have access to clean fuels and clean technologies for cooking will expand access throughout the populace at a greater rate than those countries in which a far greater proportion of the population has access to clean fuels and clean technologies for cooking. This would imply that increased access to clean fuels and clean technologies is a consequence of economic growth, that is, that increasing access is attained by growing the economy.
The basis for the idea of convergence, which we outline here, comes from and can be found in greater detail in Reference [28]. We begin by considering a standard neoclassical growth model with labor-augmenting technology in Cobb-Douglass form.
In the above model, represents output, represents physical capital, represents labor and represents technology, which is assumed to be labor augmenting. We assume that where is capital’s share and the quantity represents labor’s share. By share we mean the proportion of output that is allocated to returns from each of capital and labor. Labor and technology are assumed to exhibit constant growth at rates n and g, respectively, thus the quantity of effective units of labor () grows at the constant rate .
Capital evolves according to the following law of motion in which s denotes the proportion of output allocated to investments, denotes the depreciation rate of capital and is the dot notation for the derivative (of ) with respect to time.
By dividing through by we can express the model in terms of units of labor, that is, in per capita terms. Thus, to derive the per capita growth rate of income according to the model, we need to take the natural logarithm of the model in per capita terms. To do this, we will need to know to dynamics of capital in per capita terms. This is given by
The natural logarithm of the full model in per capita terms is given by the following equation which provides the steady state level of income per capita ().
In order to obtain the desired regression model, Reference [28] derived the following relation in which represents the steady state level of income per worker which we just established.
The growth rate obtained by taking the natural logarithm of the ratio where and denote the initial and final observation of income (or, for our case in this paper, the percentage of the population with access to clean fuels and clean technologies for cooking). By using the fact that the natural logarithm of a ratio is the difference of the natural logarithms, we yield the following relationship where .
It is from this equation representing the dynamics of economic growth that we obtain the following econometric model used for testing for conditional convergence. In this model, t denotes the final time period of the panel data, i is an indicator for the country and is the error term.
With this econometric model motivated and defined, we are ready to test the conditional convergence hypothesis on our data set. Notice that even though this is a panel data set, there are no spatial or temporal effects. This is due to two reasons. Spatial effects are effectively included in this model since the theory of conditional convergence includes initial access at the national level () in the regression framework and temporal effects are irrelevant as the panel data that we begin with is essentially transformed into a cross sectional data set. Per Reference [28], we use the assumption that . Thus our panel data set containing data on the growth rate and initial level of access to clean fuels and clean technologies for cooking, population growth rate (n) and saving rate (s) contains everything we need to test for conditional convergence. Results from this regression support the conclusion that there is conditional convergence in the growth rates for access to clean fuels and clean technology for cooking. In Table 2 below, estimates marked with * are significant at the 5% level, ** at the 1% level and *** at the 0.1% level.
Even when finding evidence of conditional convergence as we just did, these results may not tell the full story [41]. In particular, it is possible for significant autocorrelation to exist in the residuals due to the regionally shared institutional characteristics which might undermine any conclusions drawn from the conditional convergence testing framework [42]. To determine whether or not autocorrelation of the residuals is present, we use the Durbin-Watson statistic [43]. The Durbin-Watson statistic is bounded between 0 and 4 and a value of 2 indicates a lack of autocorrelation of the residuals while values below 2 indicate positive autocorrelation of residuals and values above 2 indicate negative autocorrelation of residuals. As a general rule, values below one or above three are indicative of severe concerns of autocorrelation. The formula for the Durbin-Watson statistic is given by the following equation.
The Durbin-Watson statistic for the regression model was 1.090, indicative of the potential for spatial autocorrelation in the residuals from this model. In terms of economic growth theory, this could imply that there are institutional characteristics which might be influencing growth rates for the level of access to clean fuels and clean technologies. To test for this, in the next section we will use the more sophisticated concept of club convergence which allows us remove any concerns of spatial autocorrelation due to regionally shared institutional characteristics, that is, club convergence allows us to account for the idea that neighboring countries often share many institutional qualities.
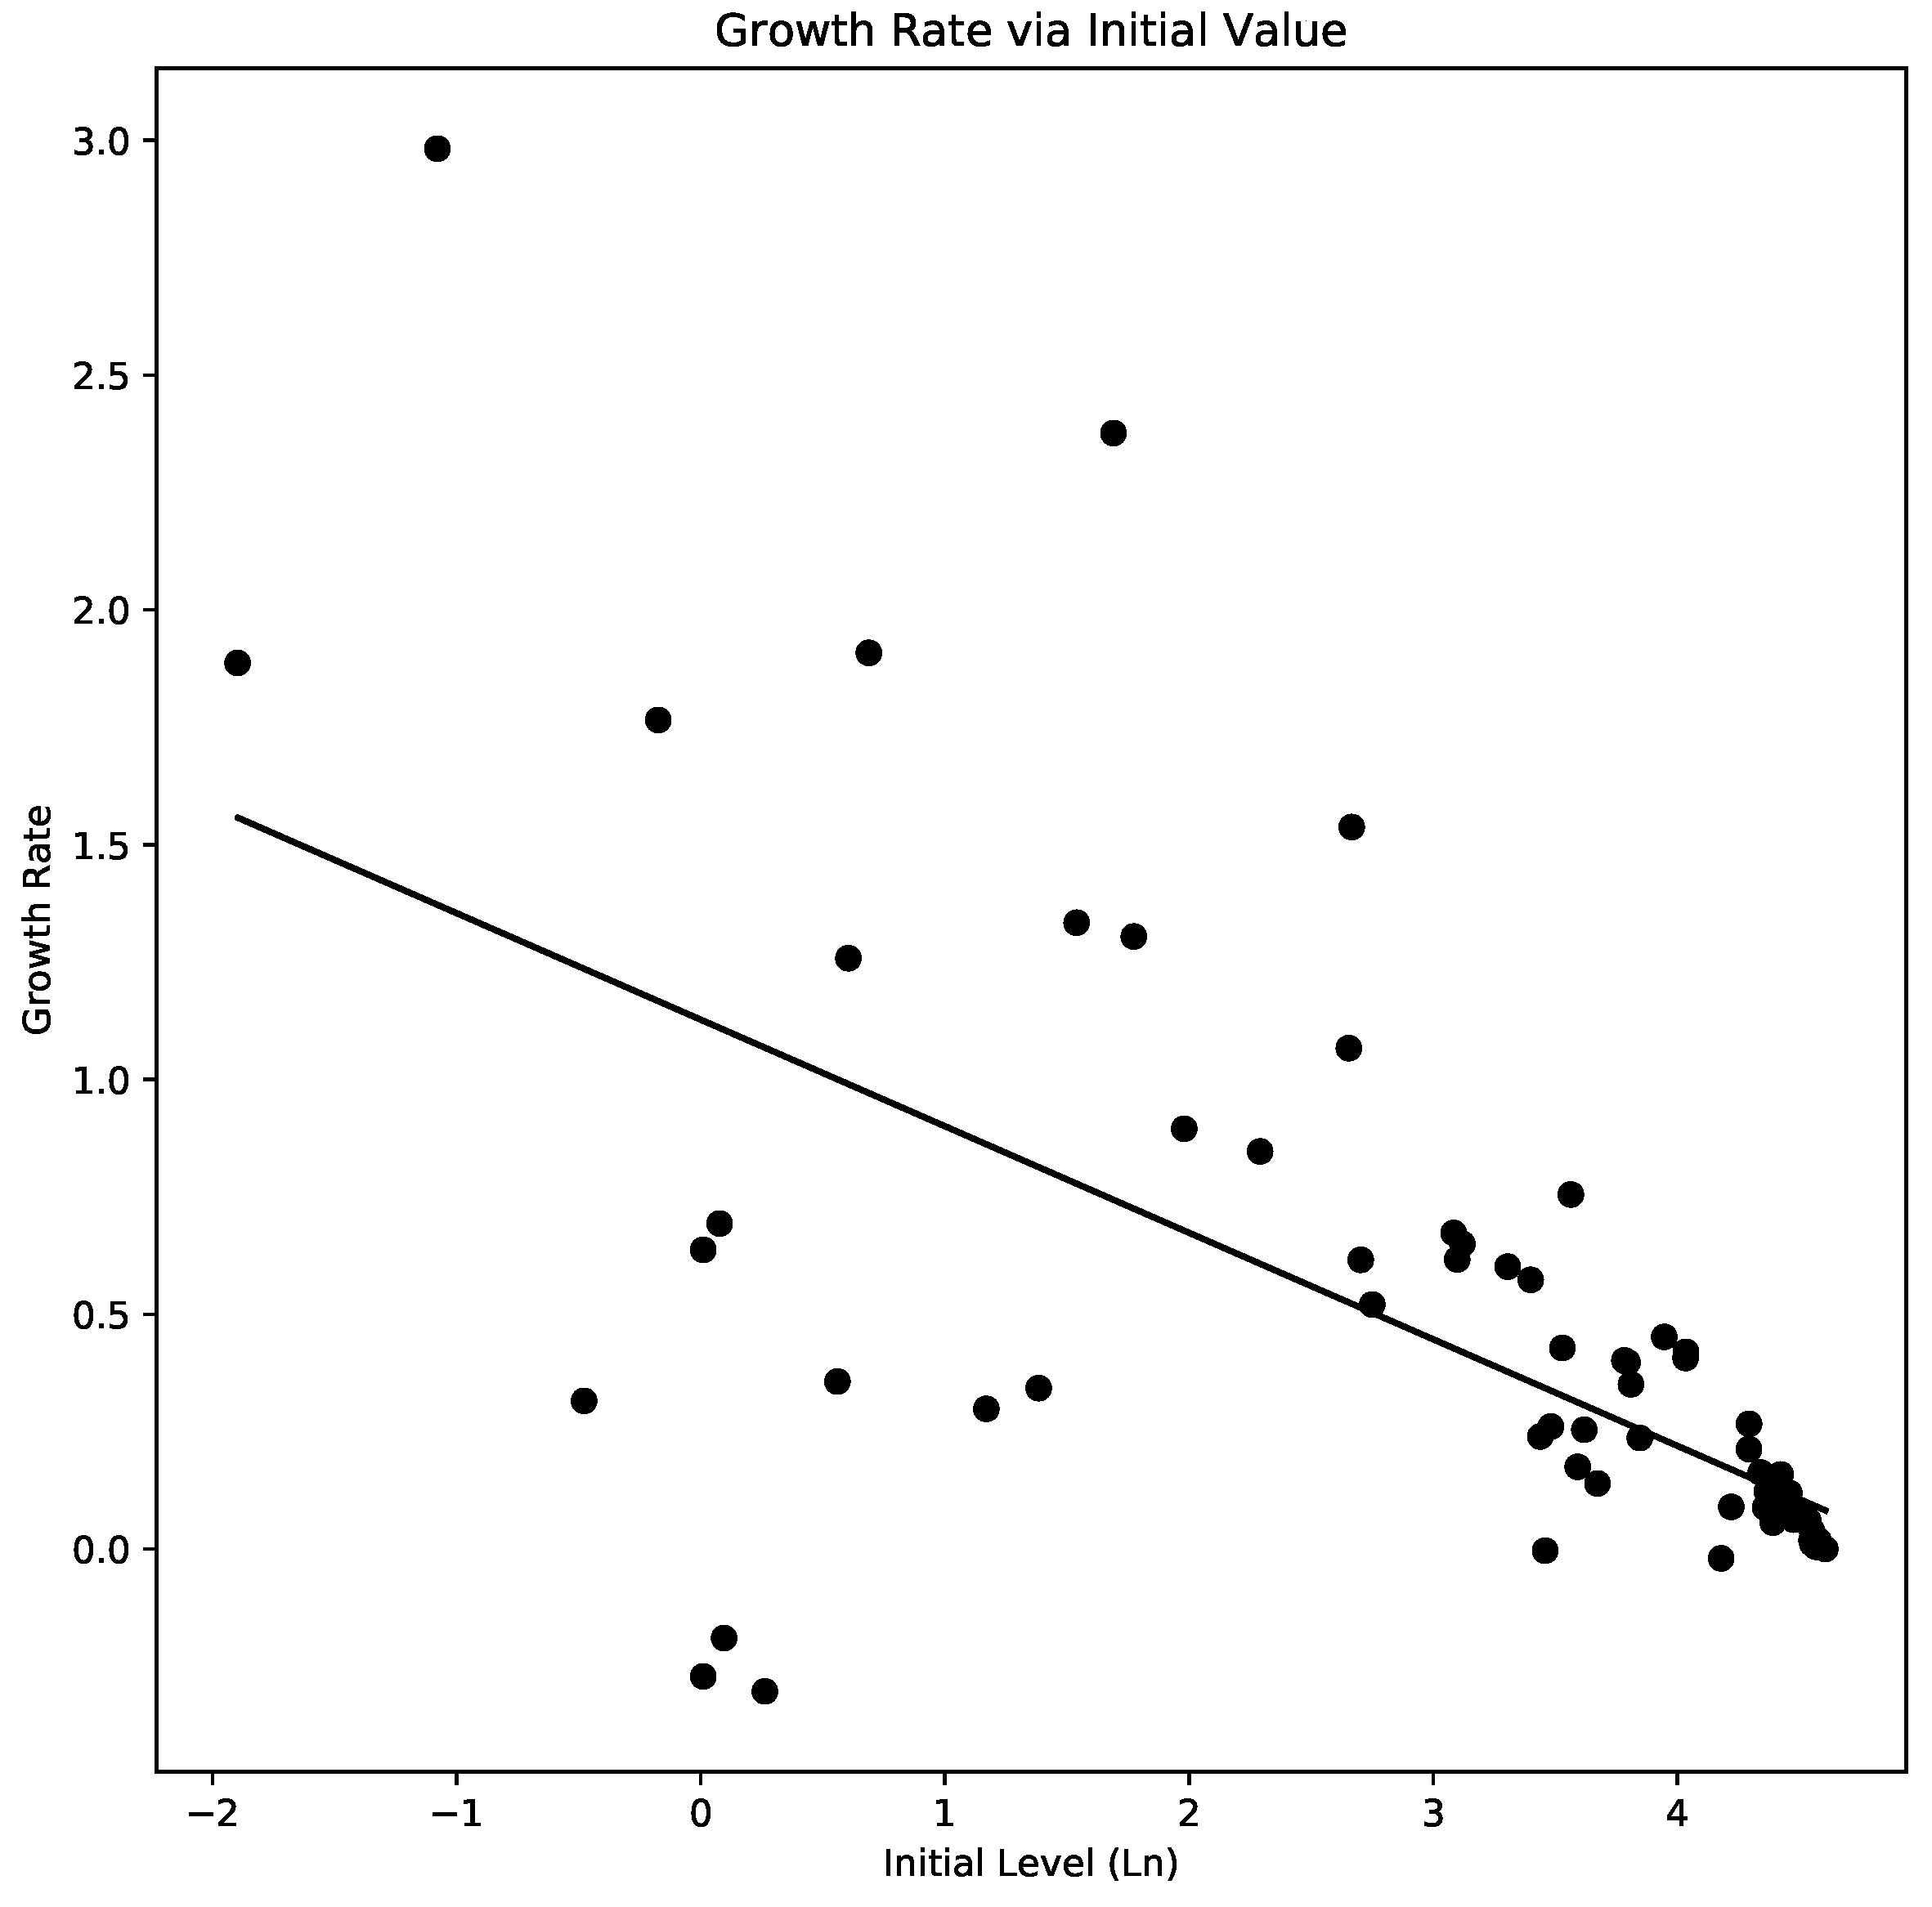
To conclude this section, we present a plot of the growth rate against the initial level of access to clean fuels and clean technologies for cooking with a regression line indicating the relationship between these two variables. As can be seen in Figure 1, higher levels of economic growth correspond to lower initial levels of access to clean fuels and clean technologies in the household and lower levels of economic growth correspond to higher initial levels of access, just as we would expect from convergence theory.
5. Club Convergence
Although we did find evidence for conditional convergence in the previous section, we also casted some doubt on those results by finding a Durbin-Watson statistic of 1.090 when testing for autocorrelation of residuals. This leads credence to the idea that we could be observing subgroups of the nations included in the study behaving differently from the rest of the population, with intra-group behavior sharing similar tendencies, presumably due to similar regional and institutional characteristics.
In order to test for this, we employ a club convergence test. Club convergence can be seen as a generalization of conditional convergence in the sense that it attempts to incorporate institutional effects. Under club convergence, we may either accept or reject a null hypothesis of conditional convergence. If we reject the null hypothesis, we may construct clubs which share similar traits and presumably similar institutional characteristics, that is, each club demonstrates conditional convergence in isolation from the other clubs. Simply stated, club convergence is the idea that select groups of nations, presumably with similar institutional characteristics, exhibit similar (club level) conditional convergence tendencies that are distinct from the other clubs. Moreover, not all nations may be members of a convergence club as individual nations may actually diverge from the rest of the world in terms of their behavior as measured by some variable of interest (in our case this variable is access to clean fuels and clean technology for cooking at the household level).
This process will begin with a test of the null hypothesis of conditional convergence. To do this, we must construct such a test. The pioneering non-parametric technique introduced by Reference [44] will be our method of choice. Spatial autocorrelation is often generated by spatial heterogeneity issues [45]. We choose the Phillips-Sul approach outlined in Reference [44] because, in the presence of such heterogeneity, standard cointegration and unit root testing are no longer sufficient for testing for convergence [44,46].
The basis for this approach is that we use the cross sectional variance of the time series of our dependent variable using the Phillips-Sul test. Developing this test requires several steps, which we meticulously outline here to help elucidate the final form of the hypothesis test that is the basis for the main results in this paper. To begin this process, we model our variable of interest, in our case the (natural logarithm of the) percentage of people with access to clean fuels and technology in the household, using a multiplicative form.
Under this approach, both explanatory terms are time varying, however the term also captures idiosyncrasies at the national level. This approach is an enhancement of the previously commonly used single factor model given by
Continuing the approach from Reference [44], we need to model the time varying idiosyncratic characterization via the variable . This is done with the following semi-parametric model.
By fixing and assuming that is across i but weakly dependent over t and that is a function slowly varying in time that satisfies as (the authors suggest the function ), we have that with for all . Furthermore, this approach allows for the existence of early transitional periods in which for . By constructing the following hypothesis test, we may address the notion of conditional convergence from the previous section.
The variable is a parameter pertaining to the rate of convergence from the previous model of conditional convergence which comes from the non-parametric econometric regression model we use to test the null hypothesis. This non-parametric model is specified as follows with the further assumption, supported by the authors of Reference [44], that we use the functional form , along with the restriction that .
By rejecting the null hypothesis stated above, we would actually be rejecting the results obtained in the previous section regarding conditional convergence, eschewing them in favor of the notion of club convergence. Not rejecting the null hypothesis would lend further support for the conditional convergence results previously obtained.
In order to create our hypothesis test, we use the following relation derived in Reference [44].
The values from our non-parametric hypothesis test are obtained from these as follows.
In this approach, the terms denote the variation (in the sense of cross-sectional variance) at each point in time.
The authors of Reference [44] suggest truncating the length of the panel data set to disclude any initial transitional period that might have occurred. In particular, they suggest using approximately the last 70% of the data, per results they obtained via Monte Carlo simulation [44].
Using this approach, we found evidence that and therefore rejected the null hypothesis that conditional convergence holds for the full panel data set. With this result, we use a club convergence algorithm to create the convergence clubs. Before stating the particular algorithm we use, we do mention that there are several possible algorithms one can use for the creation of clubs in a convergence club approach. For more on these other approaches, the reader is referred to References [47,48].
The algorithm we use in this paper, however, is one based on final time period observations. This algorithm also comes from Reference [44] and was used in Reference [34] to study state level CO emissions in the United States. The algorithm works as follows. First, we rank all nations by their respective final year (2016) percentage of the population with access to clean fuels and clean technologies for cooking in the household. We then form an initial club which includes the first k entries, in order, for some value k determined by analyzing the data set and considering economic theory. A test of the null hypothesis is then performed on this subgroup using the same null hypothesis and hypothesis test as before. Nations are then iteratively added to this club assuming that the null hypothesis is not rejected. Do recall that the null hypothesis asserts that we have conditional convergence for the members of the club we are forming. Once we reject the null hypothesis, we have formed a club. We then form a club consisting of the next two members and repeat this process until all nations are either included in some club or are found to diverge from all existing groups. If, when attempting to initialize the formation of a new club, we find divergent behavior, we assign the first member, by ranking, of that grouping to be divergent and continue with the algorithm.
Using precisely this algorithm, we obtained the existence of eight convergence clubs. In order to initialize the algorithm, we created the basis of our first convergence club as those nations which had at least 90% of their population have access to clean fuels and clean technologies for cooking. This generated a first convergence club which contained 58 of the 93 nations. This club consists of those nations which have a relatively large proportion of the population with access to clean fuels and clean technologies for cooking or, for those which are not quite as near the 100% mark, are rapidly approaching this ultimate goal.
The second convergence club consists of 15 nations which both have a lower level of access to clean fuels and clean technologies for cooking than the first convergence club and have an initial starting point (in the year 2000) that was relatively lower than the starting points observed by the first convergence club. Moreover, this convergence club is experiencing consistent growth in access to clean fuels and clean technologies for cooking that is somewhat lower than that experienced by those members of the first convergence club that had the lowest current (and initial) levels of access to clean fuels and clean technologies for cooking.
The remaining convergence clubs range in size from two to five members. While no nations were found to be divergent under this convergence club algorithm, four of the eight groups had either two or three members. Due to their small size, we take the time to mention that the nations belonging to these clubs can effectively be seen as outliers. Growth rates for access to clean fuels and clean technologies for cooking decrease monotonically from Club 3 through Club 8. Moreover, the initial level of access to clean fuels and clean technologies for cooking also decrease monotonically from Club 3 to Club 8. A list of all eight convergence clubs and their members is presented below in Table 3, followed by a second table (Table 4) containing mean values for the data used in this section at the club level. This includes data that will be used to demonstrate that the convergence clubs reflect the importance of institutional quality in expanding access to clean fuels and clean technologies for cooking at the household level. To help visualize these results, Figure 2, Figure 3 and Figure 4 below show time series of the members of example convergence clubs.
As can be seen both from the club-level data and from a quick inspection of the nations belonging to each club, we can make some immediate observations. First, Club 1 is comprised of developed nations and nations undergoing rapid and persistent economic growth, including many natural resource rich nations. Addressing the role of institutions, the marquee metric which considers how institutions affect daily life, the Human Development Index (HDI), correlates strongly with the clubs (see Table 5).
With this further evidence that institutions play a significant role in the spread of access to clean fuels and clean technologies at the household level, we conclude that the notion of conditional convergence should be eschewed in favor of club convergence in the case of access to clean fuels and clean technologies at the national level. But categorizing nations into convergence clubs is not the ultimate goal. We still need to use this classification schema to improve our understanding of the behavior of the panel data in order to guide future research and policy. That is, we need to use the results from the club convergence algorithm to improve explanations for national discrepancies in access to clean fuels and clean technologies in the household.
Regression results at the club level provide evidence for conditional convergence within convergence clubs and have Durbin-Watson statistics much closer to the ideal value of 2, further verifying the convergence clubs approach (These results are not presented in this paper as they are precautionary and superfluous. They are provided as outputs of the supplementary python script which was used to perform all of the data analysis and visualization for this paper.) Results at the club level were robust to the inclusion of the additional variables listed in the previous table (initial GINI coefficient, initial HDI value and growth rate of HDI, all as natural logarithms; data again obtained from Reference [39]). When comparing these additional variables against the convergence clubs results, we see that the development indicators (GINI and HDI) tell different stories. GINI is a measurement of income inequality based on the distribution of income. We did not find that this measure correlates with convergence club level data on growth rates in access to clean fuels and clean technologies for cooking. However, the HDI tells us a much different story. HDI results are known to correlate with income levels [49]. Moreover, since increased institutional quality corresponds to increased income levels, by using HDI as a reference for national institutional characteristics, we are able to conclude that institutional characteristics do indeed impact access to clean fuels and clean technologies for cooking at the household level, with increases in institutional quality leading to increases in access to clean fuels and clean technologies at the household level.
To verify this result, we regressed the growth rate and initial levels of access to clean fuels and clean technologies for cooking on the growth rate and initial levels of HDI values, respectively, at both the club and national levels with the univariate expression . Results are presented in the ensuing table. Estimates marked with * are significant at the 5% level, ** at the 1% level and *** at the 0.1% level. Notice that the national level regressions 95% confidence intervals fit entirely within the club level confidence intervals, as we would expect. This indicates that while some of the NGO and foreign investment based approaches acknowledged in the literature review section of this paper can help, it is critical for increases in access to clean fuels and clean technologies for cooking at the households level that increases in institutional quality occur.
For a succinct interpretation of these results, we offer the following analysis. In sufficiently developed nations, the trend of increasing the usage of renewable energy must continue to be a domestic priority. This cannot be the sole priority of developing nations. If the more than one billion people in this world without electricity gain access to electricity only from unclean fuels, all efforts to reduce carbon emissions will have been in vain. Developed nations must not only help develop improved clean technologies, they must also help increase access to these technologies across the world. While helping to fund these endeavors might not be appealing, the negative externalities of climate change are already far too great not to warrant action [50].
More comprehensively, the manner in which developed nations contribute to this is incredibly important. Foreign direct investment (FDI) has been shown to have made at best ineffective contributions in most cases to the adoption and use of cleanly sourced energy [51,52]. In order to meaningfully contribute to the increase in household level access to clean fuels and clean technologies, recommendations for lucrative incentives for private renewable energy firms and pro-poor public-private partnerships have been put forth [53]. However, such approaches have ethical concerns including the recolonization of Africa via what has been termed eco-colonial land grabs [54].
While many potential solutions exist, more research is needed on the implications of various policy choices in addressing sustainable development, especially in developing nations. Having demonstrated the importance of institutions in increasing access at the household level to clean fuels and clean technologies and having explained that any contribution to sustainable development must include the more than one billion people without access to electricity, future sustainable development policies must focus on increasing household level access to clean fuels and clean technologies if they are to be successful.
We conclude this section with two plots. Figure 5 is a plot that includes the time path of access to clean fuels and clean technologies for cooking as a percentage of the population at the national level for all nations included in the study, with the time path of each nation color coded to indicate to which convergence club it belongs. Figure 6 shows the importance of the club convergence approach by comparing the convergence rate (presented as the slope of the best fit line for each convergence club) with the convergence rate given by the conditional convergence approach used in the previous section. The convergence rate for each club is color coded and the convergence rate from the conditional convergence approach is shown in black. Colors assigned to the clubs are consistent across the two plots.
6. Conclusions and Discussion
In this paper we studied the dynamics of access to clean fuels and clean technologies for cooking at the household level. By first using a conditional convergence model, we found evidence supporting the notion that access to clean fuels and clean technologies will eventually spread to everyone around the world as a consequence of economic growth, though with some concerns about spatial heterogeneity and autocorrelation of residuals. Using a club convergence approach, we were able to reject the hypothesis that all nations exhibit similar growth patterns for access to clean fuels and clean technologies in favor of the idea that select groups of countries exhibit similar tendencies, with behavior patterns varying across different groups, all while addressing the concerns of autocorrelation of residuals and spatial heterogeneity.
Using this result, we ran the data through a club convergence algorithm which categorized the 93 nations studied into 8 distinct convergence clubs. These clubs were then characterized by economic growth and institutional quality. We found that increases in institutional quality, which are known to correlate with increases in economic growth, help explain the observed differences in growth in access to clean fuels and clean technologies across groups better than does economic growth alone.
The value of these results lies in the policy recommendations that can come from them. In particular, it is now clear that improvements in institutional quality must be a tenet of any policy aiming to increase access to clean fuels and clean technology. Especially considering that many of those without access are living without any household access to electricity, providing access to clean fuels and clean technology must be a core component of any international plan to combat rising CO levels and climate change. To do this, foreign aid, foreign direct investment and the development of other possible partnerships in places where institutional quality is sub-par are all possible components of successful sustainable development policy. Nevertheless, institutional quality must increase, else access to electricity is likely to come from dirty, carbon intensive sources such as fossil fuels.
This research can be built upon by devising improved sustainable development policies which address the more than one billion people without access to electricity, by exploring possible solutions to increase institutional quality, particularly in those countries which lack widespread access to electricity and by improving our understanding of the consequences of various options for investing in cleanly sourced energy in those nations with significant populations without access to electricity.
Funding
This research received no external funding.
Acknowledgments
The author would like to thank the reviewers for their comments which helped to improve the quality of this paper.
Conflicts of Interest
The author declares no conflicts of interest.
Appendix A. Code and Data Source Availability
The python script and csv files containing data from the World Bank [39] are available online at https://github.com/cat-astrophic/clean_technologies.
Please cite the data source if using the data used in this paper but feel free to use, edit and redistribute the script ccc.py freely.
References
- Zubi, G.; Dufo-López, R.; Pasaoglu, G.; Pardo, N. Techno-economic assessment of an off-grid PV system for developing regions to provide electricity for basic domestic needs: A 2020–2040 scenario. Appl. Energy 2016, 176, 309–319. [Google Scholar] [CrossRef]
- Popp, D. International technology transfer, climate change, and the clean development mechanism. Rev. Environ. Econ. Policy 2011, 5, 131–152. [Google Scholar] [CrossRef]
- Lambe, F.; Jürisoo, M.; Wanjiru, H.; Senyagwa, J. Bringing Clean, Safe, Affordable Cooking Energy to Households Across Africa: An Agenda for Action. Prepared by the Stockholm Environment Institute, Stockholm and Nairobi, for the New Climate Economy. 2015. Available online: http://newclimateeconomy. report/misc/workingpapers (accessed on 14 June 2019).
- Njenga, M.; Gitau, J.K.; Iiyama, M.; Jamnadassa, R.; Mahmoud, Y.; Karanja, N. Innovative biomass cooking approaches for sub-Saharan Africa. Afr. J. Food Agric. Nutr. Dev. 2019, 19, 14066–14087. [Google Scholar] [CrossRef]
- Sustainable Energy for All, Climate Policy Initiative. Understanding the Landscape: Tracking Finance for Electricity and Clean Cooking Access in High-Impact Countries; Sustainable Energy for All, Climate Policy Initiative, World Bank: Washington, DC, USA, 2017. [Google Scholar]
- Iiyama, M.; Neufeldt, H.; Dobie, P.; Njenga, M.; Ndegwa, G.; Jamnadass, R. The potential of agroforestry in the provision of sustainable woodfuel in sub-Saharan Africa. Curr. Opin. Environ. Sustain. 2014, 6, 138–147. [Google Scholar] [CrossRef] [Green Version]
- Kaygusuz, K. Energy for sustainable development: A case of developing countries. Renew. Sustain. Energy Rev. 2012, 16, 1116–1126. [Google Scholar] [CrossRef]
- Brown, E.; Campbell, B.; Cloke, J.; To, L.S.; Turner, B.; Wray, A. Low carbon energy and international development: from research impact to policymaking. Contemp. Soc. Sci. 2018, 13, 112–127. [Google Scholar] [CrossRef]
- Gujba, H.; Thorne, S.; Mulugetta, Y.; Rai, K.; Sokona, Y. Financing low carbon energy access in Africa. Energy Policy 2012, 47, 71–78. [Google Scholar] [CrossRef]
- Karanja, A.; Gasparatos, A. Adoption and impacts of clean bioenergy cookstoves in Kenya. Renew. Sustain. Energy Rev. 2019, 102, 285–306. [Google Scholar] [CrossRef]
- Bishoge, O.; Zhang, L.; Mushi, W. The potential renewable energy for sustainable development in Tanzania: A review. Clean Technol. 2019, 1, 70–88. [Google Scholar] [CrossRef]
- Quitzow, R.; Roehrkasten, S.; Jacobs, D.; Bayer, B.; Jamea, E.; Waweru, Y.; Matschoss, P. The future of Africa’s energy supply. In Potentials and Development Options for Renewable Energy; IASS: Potsdam, Germany, 2016. [Google Scholar]
- Vianello, M. A Review of Cooking Systems for Humanitarian Settings; Chatham House, the Royal Institute of International Affairs: London, UK, 2016. [Google Scholar]
- Van Buskirk, R.; Schwartz, P. Solar Electricity Access for Rural Africans at Less Than $0.02/kWh by 2030? Available online: https://www.researchgate.net/publication/331262290_Solar_electricity_access_for_rural_Africans_at_less_than_002kWh_by_2030 (accessed on 14 June 2019).
- Fashina, A.; Mundu, M.; Akiyode, O.; Abdullah, L.; Sanni, D.; Ounyesiga, L. The drivers and barriers of renewable energy applications and development in Uganda: A review. Clean Technol. 2019, 1, 9–39. [Google Scholar] [CrossRef]
- Mutanga, S.S.; Quitzow, R.; Steckel, J.C. Tackling energy, climate and development challenges in Africa. Economics 2018, 12, 1–14. [Google Scholar] [CrossRef]
- Eren, B.M.; Taspinar, N.; Gokmenoglu, K.K. The impact of financial development and economic growth on renewable energy consumption: Empirical analysis of India. Sci. Total Environ. 2019, 663, 189–197. [Google Scholar] [CrossRef] [PubMed]
- Ebohon, O.J. Energy, economic growth and causality in developing countries: A case study of Tanzania and Nigeria. Energy Policy 1996, 24, 447–453. [Google Scholar] [CrossRef]
- Painuly, J.P. Barriers to renewable energy penetration; a framework for analysis. Renew. Energy 2001, 24, 73–89. [Google Scholar] [CrossRef]
- Goldemberg, J. The promise of clean energy. Energy Policy 2006, 34, 2185–2190. [Google Scholar] [CrossRef]
- Sinha, A.; Sengupta, T. Impact of natural resource rents on human development: What is the role of globalization in Asia Pacific countries? Resour. Policy 2019, 63, 101413. [Google Scholar] [CrossRef]
- Alkhateeb, T.T.Y.; Mahmood, H. Energy Consumption and Trade Openness Nexus in Egypt: Asymmetry Analysis. Energies 2019, 12, 2018. [Google Scholar] [CrossRef]
- Mahmood, H.; Maalel, N.; Zarrad, O. Trade Openness and CO2 Emissions: Evidence from Tunisia. Sustainability 2019, 11, 3295. [Google Scholar] [CrossRef]
- Luis, P.; Van der Bruggen, B.; Van Gerven, T. Non-dispersive absorption for CO2 capture: from the laboratory to industry. J. Chem. Technol. Biotechnol. 2011, 86, 769–775. [Google Scholar] [CrossRef]
- Luis, P.; Garea, A.; Irabien, Á. Intensification of Sulfur Dioxide Absorption: Environmental and Economic Optimization. In Computer Aided Chemical Engineering; Elsevier: Amsterdam, The Netherlands, 2010; Volume 28, pp. 1003–1008. [Google Scholar]
- Acheampong, A.O.; Boateng, E.B. Modelling carbon emission intensity: Application of artificial neural network. J. Clean. Prod. 2019, 225, 833–856. [Google Scholar] [CrossRef]
- Haines, A.; Smith, K.R.; Anderson, D.; Epstein, P.R.; McMichael, A.J.; Roberts, I.; Wilkinson, P.; Woodcock, J.; Woods, J. Policies for accelerating access to clean energy, improving health, advancing development, and mitigating climate change. Lancet 2007, 370, 1264–1281. [Google Scholar] [CrossRef]
- Mankiw, N.G.; Romer, D.; Weil, D.N. A contribution to the empirics of economic growth. Q. J. Econ. 1992, 107, 407–437. [Google Scholar] [CrossRef]
- Barro, R.J.; Sala-i Martin, X. Convergence. J. Pol. Econ. 1992, 100, 223–251. [Google Scholar] [CrossRef]
- Islam, N. Growth empirics: a panel data approach. Q. J. Econ. 1995, 110, 1127–1170. [Google Scholar] [CrossRef]
- Sala-i Martin, X.X. Regional cohesion: evidence and theories of regional growth and convergence. Eur. Econ. Rev. 1996, 40, 1325–1352. [Google Scholar] [CrossRef] [Green Version]
- Groh, S.; Pachauri, S.; Rao, N.D. What are we measuring? An empirical analysis of household electricity access metrics in rural Bangladesh. Energy Sustain. Dev. 2016, 30, 21–31. [Google Scholar] [CrossRef]
- Chong, A.; Calderon, C. Institutional quality and income distribution. Econ. Dev. Cult. Chang. 2000, 48, 761–786. [Google Scholar] [CrossRef]
- Burnett, J.W. Club convergence and clustering of US energy-related CO2 emissions. Resour. Energy Econ. 2016, 46, 62–84. [Google Scholar] [CrossRef]
- Li, F.; Li, G.; Qin, W.; Qin, J.; Ma, H. Identifying Economic Growth Convergence Clubs and Their Influencing Factors in China. Sustainability 2018, 10, 2588. [Google Scholar] [CrossRef]
- Gerry, C.J.; Raskina, Y.; Tsyplakova, D. Convergence or Divergence? Life Expectancy Patterns in Post-communist Countries, 1959–2010. Soc. Indic. Res. 2018, 140, 309–332. [Google Scholar] [CrossRef]
- Solarin, S.A. Convergence in CO2 emissions, carbon footprint and ecological footprint: evidence from OECD countries. Environ. Sci. Pollut. Res. 2019, 26, 6167–6181. [Google Scholar] [CrossRef] [PubMed]
- Camarero, M.; Castillo, J.; Picazo-Tadeo, A.J.; Tamarit, C. Eco-efficiency and convergence in OECD countries. Environ. Resour. Econ. 2013, 55, 87–106. [Google Scholar] [CrossRef]
- The World Bank. World Development Indicators; The World Bank: Washington, DC, USA, 2019; Available online: https://datacatalog.worldbank.org/dataset/world-development-indicators (accessed on 21 May 2019).
- Bhattacharya, S.; Salam, P.A. Low greenhouse gas biomass options for cooking in the developing countries. Biomass Bioenergy 2002, 22, 305–317. [Google Scholar] [CrossRef]
- Pettersson, F.; Maddison, D.; Acar, S.; Söderholm, P. Convergence of carbon dioxide emissions: A review of the literature. Int. Rev. Environ. Resour. Econ. 2014, 7, 141–178. [Google Scholar] [CrossRef]
- Arbia, G.; Piras, G. Convergence in Per-Capita GDP Across European Regions Using Panel Data Models Extended to Spatial Autocorrelation Effects; Italian National Institute of Statistics: Rome, Italy, 2005. [Google Scholar]
- Durbin, J.; Watson, G.S. Testing for serial correlation in least squares regression. III. Biometrika 1971, 58, 1–19. [Google Scholar] [CrossRef]
- Phillips, P.C.; Sul, D. Transition modeling and econometric convergence tests. Econometrica 2007, 75, 1771–1855. [Google Scholar] [CrossRef]
- Billé, A.G.; Benedetti, R.; Postiglione, P. A two-step approach to account for unobserved spatial heterogeneity. Spat. Econ. Anal. 2017, 12, 452–471. [Google Scholar] [CrossRef] [Green Version]
- Ivanovski, K.; Churchill, S.A.; Smyth, R. A club convergence analysis of per capita energy consumption across Australian regions and sectors. Energy Econ. 2018, 76, 519–531. [Google Scholar] [CrossRef]
- Beylunioğlu, F.C.; Yazgan, M.E.; Stengos, T. Detecting Convergence Clubs. In Macroeconomic Dynamics; Cambridge University Press: Cambridge, UK, 2018; pp. 1–41. [Google Scholar]
- Postiglione, P.; Benedetti, R.; Lafratta, G. A regression tree algorithm for the identification of convergence clubs. Comput. Stat. Data Anal. 2010, 54, 2776–2785. [Google Scholar] [CrossRef]
- Philipson, T.; Soares, R. Human Capital, Longevity, and Economic Growth: A Quantitative Assessment of Full Income Measures; University of Chicago: Chicago, IL, USA, 2001. [Google Scholar]
- Page, E.A. Distributing the burdens of climate change. Environ. Politics 2008, 17, 556–575. [Google Scholar] [CrossRef] [Green Version]
- Lee, J.W. The contribution of foreign direct investment to clean energy use, carbon emissions and economic growth. Energy Policy 2013, 55, 483–489. [Google Scholar] [CrossRef]
- Paramati, S.R.; Ummalla, M.; Apergis, N. The effect of foreign direct investment and stock market growth on clean energy use across a panel of emerging market economies. Energy Econ. 2016, 56, 29–41. [Google Scholar] [CrossRef]
- Sovacool, B.K. Expanding renewable energy access with pro-poor public private partnerships in the developing world. Energy Strategy Rev. 2013, 1, 181–192. [Google Scholar] [CrossRef]
- Okoh, A.I.S. Greenhouse Gas Reduction Schemes and the Re-Colonization of Nature in Africa. J. Good Gov. Sustain. Dev. Afr. (JGGSDA) 2015, 2, 4. [Google Scholar]
Figure 1.
A plot of the growth rate against the initial value for access to clean fuels and clean technology with the regression line showing the relationship between the two variables. As expected, lower levels of access correspond to higher rates of growth.
Figure 1.
A plot of the growth rate against the initial value for access to clean fuels and clean technology with the regression line showing the relationship between the two variables. As expected, lower levels of access correspond to higher rates of growth.

Figure 2.
Time series of access to clean fuels and clean technologies at the household level for all members of convergence club 1. As can been seen, access to clean fuels and clean technologies is converging to 100% rather quickly for the members of this club.
Figure 2.
Time series of access to clean fuels and clean technologies at the household level for all members of convergence club 1. As can been seen, access to clean fuels and clean technologies is converging to 100% rather quickly for the members of this club.

Figure 3.
Time series of access to clean fuels and clean technologies for all members of convergence club 2. As can be see, access to clean fuels and clean technologies is increasing rather consistently but these nations will not reach a level of universal access in the near future.
Figure 3.
Time series of access to clean fuels and clean technologies for all members of convergence club 2. As can be see, access to clean fuels and clean technologies is increasing rather consistently but these nations will not reach a level of universal access in the near future.

Figure 4.
Time series of access to clean fuels and clean technologies for all members of convergence club 8. These nations exhibit convergence at the meager level of access of approximately 1%.
Figure 4.
Time series of access to clean fuels and clean technologies for all members of convergence club 8. These nations exhibit convergence at the meager level of access of approximately 1%.

Figure 5.
All time series for national access to clean fuels and clean technologies by club with each of the eight convergence clubs indicated by a distinct color.
Figure 5.
All time series for national access to clean fuels and clean technologies by club with each of the eight convergence clubs indicated by a distinct color.

Figure 6.
Club level relationships between growth rates and initial levels of access. The black line is the regression line from the conditional convergence model. The differences in slopes exemplifies the role of institutions.
Figure 6.
Club level relationships between growth rates and initial levels of access. The black line is the regression line from the conditional convergence model. The differences in slopes exemplifies the role of institutions.


Table 1.
Summary statistics of the data.
| Variable | Mean | Std. Dev. | Min | Max |
|---|---|---|---|---|
| Growth Rate of Access to Clean Fuels & Technologies | 0.35 | 0.57 | −0.30 | 2.98 |
| Initial Percentage of Population With Access | 3.43 | 1.61 | −1.90 | 4.61 |
| Population Growth Rate | −0.08 | 0.68 | −2.66 | 2.20 |
| Saving Rate | 0.35 | 0.57 | −0.30 | 2.98 |
Table 2.
Estimates from the Econometric Test for Conditional Convergence.
| Variable | Estimate | Standard Error | t-Statistic |
|---|---|---|---|
| Constant | 1.1741 *** | 0.108 | 10.893 |
| Initial Level of Access | −0.2425 *** | 0.029 | −8.452 |
| Saving (s) | −0.2248 * | 0.104 | −2.159 |
| Population, etc. () | −0.0346 | 0.066 | −0.527 |
Table 3.
Summary statistics of the data.
| Convergence Club | Size | List of Members |
|---|---|---|
| Club 1 | 58 | Australia, The Bahamas, Bahrain, Canada, Cyprus, Denmark, Finland, France, Germany, Iceland, Israel, Kuwait, Luxembourg, Malta, Netherlands, New Zealand, Norway, Singapore, Spain, Sweden, Switzerland, United Kingdom, United States, Tunisia, Jordan, Argentina, Uruguay, Egypt, St. Lucia, Morocco, Korea, Rep., Malaysia, Slovenia, Saudi Arabia, Brazil, Ecuador, Azerbaijan, Oman, Costa Rica, Mauritius, Chile, Colombia, Jamaica, Dominican Republic, Seychelles, Panama, El Salvador, Belize, Mexico, South Africa, Kyrgyz Republic, Peru, Thailand, Vietnam, Paraguay, North Macedonia, Botswana, & Bolivia |
| Club 2 | 15 | China, Indonesia, Honduras, Nicaragua, Eswatini, Angola, Guatemala, Pakistan, Philippines, Mongolia, Namibia, Sudan, India, Fiji, & Senegal |
| Club 3 | 2 | Nepal & Sri Lanka |
| Club 4 | 3 | Cameroon, Ghana, & Bangladesh |
| Club 5 | 3 | Cambodia, Kenya, & Togo |
| Club 6 | 5 | Benin, Lao PDR, Nigeria, Haiti, & Malawi |
| Club 7 | 2 | Tanzania & Niger |
| Club 8 | 5 | Sierra Leone, Mali, Madagascar, Burundi, & Uganda |
Table 4.
Mean values of the data by convergence club.
| Variable | Convergence Clubs | |||||||
|---|---|---|---|---|---|---|---|---|
| Club 1 | Club 2 | Club 3 | Club 4 | Club 5 | Club 6 | Club 7 | Club 8 | |
| Clean Access Growth Rate | 0.122 | 0.553 | 0.568 | 1.015 | 2.075 | 0.804 | 0.665 | 0.288 |
| Access Initial Value | 4.401 | 3.265 | 2.726 | 2.014 | 0.383 | 0.709 | 0.043 | −0.402 |
| Population Growth Rate | −0.090 | −0.069 | 0.067 | −0.221 | −0.194 | −0.104 | 0.107 | 0.031 |
| Saving Rate | −0.096 | −0.030 | 0.512 | 0.277 | −0.038 | −0.257 | 0.455 | 0.629 |
| GDP per capita Growth Rate | 0.294 | 0.519 | 0.564 | 0.498 | 0.475 | 0.366 | 0.360 | 0.220 |
| GDP per capita Initial Value | 9.292 | 7.449 | 6.819 | 6.723 | 6.352 | 6.576 | 6.006 | 5.910 |
| HDI Growth Rate | 0.094 | 0.195 | 0.179 | 0.229 | 0.246 | 0.194 | 0.315 | 0.276 |
| HDI Initial Value | 0.745 | 0.527 | 0.566 | 0.461 | 0.432 | 0.430 | 0.324 | 0.350 |
| GINI Initial Value | 3.584 | 3.685 | 3.542 | 3.652 | 3.726 | 3.646 | 3.534 | 3.586 |
Table 5.
Access rates and values via human development index (HDI) rates and values.
| Model | Level | Lower | Upper | t-Statistic | ||
|---|---|---|---|---|---|---|
| Growth Rates | Club | 3.4793 ** | 1.373 | 5.585 | 3.907 | 0.641 |
| Growth Rates | National | 2.6004 *** | 1.959 | 3.242 | 8.054 | 0.407 |
| Initial Values | Club | 3.9800 ** | 1.841 | 6.118 | 4.401 | 0.697 |
| Initial Values | National | 5.516 *** | 5.201 | 5.831 | 34.813 | 0.929 |
© 2019 by the author. Licensee MDPI, Basel, Switzerland. This article is an open access article distributed under the terms and conditions of the Creative Commons Attribution (CC BY) license (http://creativecommons.org/licenses/by/4.0/).
Share and Cite
MDPI and ACS Style
Cary, M. Increasing Access to Clean Fuels and Clean Technologies: A Club Convergence Approach. Clean Technol. 2019, 1, 247-264. https://doi.org/10.3390/cleantechnol1010017
AMA Style
Cary M. Increasing Access to Clean Fuels and Clean Technologies: A Club Convergence Approach. Clean Technologies. 2019; 1(1):247-264. https://doi.org/10.3390/cleantechnol1010017
Chicago/Turabian StyleCary, Michael. 2019. "Increasing Access to Clean Fuels and Clean Technologies: A Club Convergence Approach" Clean Technologies 1, no. 1: 247-264. https://doi.org/10.3390/cleantechnol1010017