
Review of Interpreting Gaseous Pollution Data Regarding Heritage Objects

1
English Heritage Trust, Rangers House, Chesterfield Walk, London SE10 8QX, UK
2
The Climate and Environmental Research Institute NILU, Instituttveien 18, 2027 Kjeller, Norway
*
Author to whom correspondence should be addressed.
Heritage 2023, 6(10), 6917-6930; https://doi.org/10.3390/heritage6100361
Submission received: 3 September 2023
/
Revised: 8 October 2023
/
Accepted: 10 October 2023
/
Published: 23 October 2023
(This article belongs to the Section Materials and Heritage)
Abstract
:Pollutant gases pose a significant risk to some cultural heritage objects, and surveys have shown that the professionals involved consider themselves to lack knowledge to fully assess risk. Three approaches towards risk assessment, research results, standards and damage functions have been considered. An assessment tool has been developed, collating over 4000 research reports into a scheme for the impact on 22 materials of acetic and formic acids, nitrogen dioxide, ozone and reduced sulphur gases. The application of doses or concentrations has been considered, the impact of measurement time compared to annual exposure investigated and a simple tool derived.
1. Introduction
Pollutant gases are important in the deterioration of some types of cultural heritage objects. A survey of over 170 heritage institutions was carried out within the MEMORI project [1], including studying indoor air pollution. The project investigated the impact of acetic acid pollution on a wide range of heritage materials, developed a dosimeter, reader, assessment scheme and decision support model. The survey indicated that only 13% of institutions undertook pollutant monitoring of some kind (a further 12% undertook materials testing), despite reporting over 36% of observed damage as being due to airborne pollutants. When the reasons behind not monitoring pollutants were investigated, 57% responded it was due to a lack of knowledge, 54% cited a lack of financial resources (to invest in analyses and expertise) and 46% reported a lack of human resources.
Air pollution measurements are only useful when sufficient research exists to interpret the results in terms of risks to different object types. Will the measured concentrations cause damage and does the environment need re-mediation? The research into pollutant effects on cultural heritage is dispersed and much is in the grey literature, which is not readily accessible. This means it is often very difficult to determine whether a particular measurement value presents a risk to the object types present. This paper investigates different approaches to interpreting gaseous pollution measurements and the factors that influence the interpretation of such results. This work considers the chance of deterioration occurring, expressed as a risk, as the complexity of the situations rarely allows exact prediction. In formal risk assessment, this would be considered the probability or frequency of an event occurring. This is normally multiplied by a fraction of the collection that is susceptible (or fractional value of each item relative to the whole asset), magnitude of effect and loss of value. The MEMORI decision support model gives some information on the magnitude of deterioration effects in its materials section. The uncertainty in the probability expressed in the surveys would introduce a very large error into formal risk assessment. The susceptible fraction is a function of the collection and its locations and clearly varies between institutions and sites. The loss of value is best determined by the institution itself and its stakeholders, as values vary greatly.
Three main routes towards interpretation exist, which are discussed throughout this paper:
- Research results. These have recently been described and the gaps in knowledge have been highlighted [2]. The collation of the research literature indicated that acetic and formic acid were implicated as the cause of over 65% of the reported instances of deterioration. Whilst a very small number of instances of concerning acetic and formic acid concentrations were reported in open rooms, the vast majority of issues were in stores, showcases and other enclosures. These can be considered as internally generated pollutants. Nitrogen dioxide and ozone have frequently been reported to cause damage but rarely with any numbers of affected objects reported, and so a percentage could not be calculated. These mainly originate externally. Hydrogen sulphide was attributed as the cause of damage in a further 15% of reported instances. This can originate both internally and externally. The results were collated into an assessment scheme in the MEMORI project. This has been expanded upon and will be outlined. Sulphur dioxide gas is known to be very corrosive, but its outdoor concentrations have been much reduced in Europe since the 1980s [3] and its indoor presence in museums is mostly very low [4]. More than twenty-five other gases have been reported to cause deterioration in museums [2], but the number of artefacts reported to be affected is much lower.
- Standards. Whilst many fields rely on standards to aid in pollution control, those produced for cultural heritage often give different values and their basis is frequently unclear. The standards are reviewed.
- Damage functions. Damage functions are mathematical relationships describing a change in property in relation to environmental parameters, including pollutant gas concentrations. A small number have been proposed for cultural heritage materials and even fewer have been suggested for indoor conditions.
Several authors and standards describe the considerations when undertaking pollutant monitoring well [5,6,7]. Some additional issues around pollution measurement that had not been fully explored were investigated further. The short experimental descriptions are simply given with the discussion. It is best to express results and interpretation in terms of concentrations or doses (concentration × time). In non-air-conditioned locations, there are strong daily and seasonal variations in acetic and formic acid concentrations due to fluctuating temperature and RH values [8]. This means that to assess the risk from acetic or formic acid, many measurements may be needed throughout the year. The annual monthly acetic acid concentration in showcases at 14 sites was analysed using a series of measurements with diffusion tubes. A simplified tool was developed to aid in deciding when to measure or interpret measurement results in terms of this variation, and this was described and has been tested using measured data. The testing of materials for emissions that can cause damage in enclosures is a large field and has not been discussed in this work.
2. Evaluation of Research Results of Pollution Gas Levels and Effects on Materials
In order to assess a pollution measurement in terms of risk to a particular material, a series of experiments using a realistic concentration of that pollutant and RH values are required with a suitable method to determine how much change has occurred. The more concentration and RH intervals that are included, the more useful the results are. The alteration of some materials is slow, such as paper, in terms of pollution concentrations in museums, and the detection methods used to assess the alterations have significant errors, meaning accelerated experiments are needed. It is, however, always difficult to interpret such results of accelerated tests back to ambient conditions and there are dangers of introduced effects. The state of knowledge for 37 gases reported to damage cultural heritage objects has been reviewed [2].
The literature for acetic and formic acid (and nitrogen dioxide and ozone) damage was surveyed and the 3000 or so published references collated. Any citations of all the relevant references in the book by Teterault [5] were assessed along with databases of references collated by the authors and material on the Indoor Air Quality website [9].
The most sensitive materials to ozone and nitrogen dioxide are certain dyes. Some unstable glass is the most sensitive cultural heritage material to damage by formic acid with a reported sensitivity of 31 µg/m3 [10]. Lead is the most sensitive material to acetic acid at 430 µg/m3 [11] with a recommendation to keep the acetic acid concentration below 100 µg/m3. Tetreault subsequently elucidates his reasoning, using his exposure results as doses [5]. Recent much longer-term exposure work has indicated that this value (430 µg/m3) appears to be a threshold and that no lead corrosion is occurring just below it, for exposure of up to ten years in various museum showcases [12]. Experiments were run with 99.98% lead coupons, mechanically abraded with glass bristle brushes to generate a rough, reactive surface and degreased in spectrosol acetone, exposed above saturated magnesium nitrate solutions to give an RH~53%, [13], with acetic acid added to the water. The concentrations were selected to produce an airborne concentration of 400 and 600 µg/m3 of acetic acid. Formic acid atmospheres at 50, 100 and 200 µg/m3 were also generated. The tests were run in Bernadin Mason 250 mL jars, with the salt and acetic or formic acid solutions replaced every 12 months. The lead corrosion was determined by mass increase and XRD (Bruker D8 with Linxeye detector). The mass gain at 400 µg/m3 after 6 months was 0.057 gm−2 compared to Tetreault’s value of 0.051 gm−2, and after 10 years the total mass gain had risen very slightly to 0.062 gm−2. At 600 µg/m3, after 10 years, a total mass gain of 5.783 gm−2 basic lead carbonate corrosion had occurred. These results indicate there is a threshold between 400 and 600 µg/m3 for acetic acid exposure. The experiment ran for ten years and the behaviour after this period is unknown, but it seems unlikely the corrosion rate will increase dramatically. In the initial paper, Tetreault gives three further reasons why 100 µg/m3 should be used as a limit despite his experiments clearly showing the 430 µg/m3 threshold [11]: unknown effects of lead composition; surface preparation; and the presence of other low molecular weight carbonyl compounds. These results enhance our understanding of two of these. The purity of the lead used was intentionally such that a maximum corrosion rate would be expected and the cleaning process to maximise surface roughness. Measurements by the authors of acetic acid concentrations in showcases indicate that approximately 25% of them contain less than 400 µg/m3 but more than 100 µg/m3, indicating significant expenditure would be required to reduce concentrations, overall, to less than 100 µg/m3. The evidence now indicates the precautionary principle is perhaps excessive in this instance. For formic acid, the mass gains were 0.031, 2.435 and 5.853 g for 50, 100 and 200 µg/m3 after 10 years’ exposure. This indicates a threshold between 50 and 100 µg/m3 for formic acid.
An assessment system was developed for the sensitivity of 21 material types to certain concentrations of acetic/formic acid and nitrogen dioxide/ozone within the MEMORI project and has been extended after the project was completed.
Two original sensors were used in the MEMORI project. The glass slide dosimeter, GSD, responds to both acetic and formic acid and the early warning organic, the EWO sensor, to both ozone and nitrogen dioxide [14,15]. Six bands were initially selected from the concentrations reported to be causing damage and the results of measurements in over 300 showcases, partly reported in [16]. The scheme of the response was updated in 2020, adding discrete formic and acetic acid concentration values; three further material types; silver tarnishing; effects of RH on metal corrosion; and two further low formic acid concentration bands to accommodate the low concentrations response of lead and glass. This was performed to give eight bands in total for the lead and glass. The acetic acid concentration response of the 25 material types was mapped onto the six-to-eight-band scheme with a red-amber-green system from the literature and research carried out in the MEMORI project. Table 1 shows the respective sensitivity of lead (at 50% RH), glass, copper (at 75% RH) and lignin-free paper to acetic and formic acid concentrations (µg/m3) and response levels as measured with a glass slide dosimeter. The online information also includes the data for nitrogen dioxide and ozone. Table 1 shows the red-amber-green system, an eight-level system developed from the MEMORI project. This is shown for 4 of the 33 materials.
The value judgements, common in conservation, make any system subjective and it is very difficult to compare deterioration across different types of materials. Red was selected to be such that a concentration of that level would cause damage requiring interventive conservation within two years. This time frame was selected as a realistic one to obtain resources to change displays or storage within many institutions. There are certainly instances where damage would occur much faster, such as lead at high acetic acid concentrations or some glasses with formic acid. Green was set such that no observable damage would be expected in 30 years. Within the constraints of present knowledge, it is unlikely that the materials will change significantly within this period [2,9,12,16]. It is extremely difficult to predict beyond this horizon with the knowledge available at present. There are serious questions about the extrapolation of doses to very long time periods. Thirty years was thought to be the maximum period to which the literature results could be reasonably extrapolated. It should be born in mind that for many materials, RH has a strong effect when combined with pollution and that both showcase materials and conservation treatments can generate pollutant gases. Amber indicates there is uncertainty in the published research, or the results vary, but damage will appear in the medium term, after more than two years. There is then time for some investigation of the environment and mitigation, if the risk is unacceptable for the particular collection in the enclosure. The scheme can be used in all situations, but elevated acetic acid and formic acid concentrations are most frequently encountered in showcases and storage enclosures.
The scheme allows users to set different risk tolerance thresholds, avoiding any amber situations where resources allow, but just responding to red-coded situations where resources are limited. A grey coding was also used, where there were not enough data to make an assessment. Whilst the scheme is necessarily simplified, extensive additional information is provided on the MEMORI web pages, https://memori.nilu.no/ (accessed on 2 September 2023) [16] to better understand and interpret the results. The MEMORI web pages provide references and discussion as to how the levels were set for different materials. The updated scheme is available at, https://www.english-heritage.org.uk/learn/conservation/collections-advice-and-guidance/, Collection Advice and Guidance, Management of Showcases (accessed on 2 September 2023) [17].
3. Standards of Air Pollution Limits and Effects
Table 2 shows twelve standards’ limits that were collated. These standards are directed towards indoor air in museums, libraries and archives. Most give pollution concentrations, some deal with metal corrosion rates and one provides a correlation between the two.
Table 3 shows the values from standards separating material types.
There is a very wide range in the standard concentrations proposed. Many of the standards were directed towards paper or based on paper responses. A meeting took place in 1983 discussing pollutants in archives recommending air quality criteria should be acceptable, measurable, achievable and economically sustainable. In the absence of quantitative dose–response relationships, the trend has been towards the best available technologies criteria (best control technology) for SOx, NOx, O3 and particulates [31]. There has been a recent general trend to take material type into consideration, as espoused by PAS198 [28] and to a degree by ASHRAE 2007 [30]. Whilst some standards have some documentation on their formulation [20,26,29], others do not, or it is unclear how the values proposed came from the referenced research [28,30]. The figures appearing in PAS 198 are presumably referenced as Table G.2 in that guide, but many do not appear in the works referenced in that standard specifically. For example, the figure for formic acid given in PAS 198 is 957 µg/m3, but Robinet (which is referenced) gives a much lower figure of 31. The hydrogen sulphide figure is exceptionally high and there maybe a typo in the units (ppb instead of ppt).
The complexity of pollutant material interactions and synergistic effects means measuring corrosion rates is an attractive approach to monitoring environments. Table 4 shows values for two corrosion rate-based ISO standards. ISO 9223 [32] covers both indoor and outdoor environments. ISO 11844 [33] is designed for indoor museum environments.
The corrosion rate-based standards describe the exposure of a set of metal coupons and the measurement of the corrosion amount, generally after 12 months or longer. These clearly integrate the effect of all gases, temperature and RH into the measured corrosion rate. In the classification of the corrosion of metals and alloys, ISO 9223 has some further indications of sulphur dioxide and chloride deposition rates, as well as the time of wetness that can be used as an alternative approach to assign a corrosion class [32]. However, the parameters are generally higher outdoors. Damage functions provide a third route to this method, and several are given but these are for outdoor exposures and may not be relevant indoors. ISO 11844, Classification of low corrosivity of indoor atmospheres provides lower corrosion rate classes, specifically designed for museums [33]. Neither standard includes lead, which is very susceptible to acetic acid and to several gases that react only minimally with silver or copper.
4. Damage Functions
Few damage functions have been published for indoor environments [34,35,36] which limits their use. When they are available for the material of interest, they integrate the effects of different parameters. This accommodation of synergistic effects means they can reliably identify damaging situations without needing tight ranges or values, as the other parameters vary.
Two exhibitions of ceremonial robes were planned coinciding with the coronation of King Charles III in the UK. One was based at Apsley House, London, from May until October; the second at Audley End House, near Cambridge, in May and June. Both sets of Lords ceremonial robes had extensive silverwork on silk and fur. Neither set had ever been exhibited before. The presence of silver thread on textiles poses a significant conservation challenge to clean the silver if the exhibition generates tarnish. A damage function for silver has been produced [35] and it allowed the risk to be assessed rapidly from existing environmental data.
where
Ag = 45.30 H2S + 1.46 NO2 + 3.90 SO2 + 4.81 HCl + 0.20 O3 + 1.04 RH + 0.79 T
- Ag is the silver tarnish rate in Å (0.1 nm) per 30 days;
- H2S is the hydrogen sulphide concentration in ppb;
- NO2 is the nitrogen dioxide concentration in ppb;
- SO2 is the sulphur dioxide concentration in ppb;
- HCl is the hydrogen chloride concentration in ppb;
- O3 is the ozone concentration in ppb;
- RH is the mean RH, %;
- T is the mean temperature, °C.
Data for pollution were available from previous years, and both rooms have continuous temperature and RH monitoring (Rotronic Hygroclip II). Data for the relevant months were fed into the damage function. The results are shown in Table 5.
The Audley End room proposed has a relatively non-aggressive environment towards silver, with an estimated tarnish rate of 1.2 nm in the two months of exposure. This is due to the house’s rural location. Apsley House has a much higher estimated tarnish rate, averaging 14.6 nm/30 days, 73.2 nm over the exhibition period. It was decided the Audley End exhibition could go ahead without any further measures in place. A showcase was procured to protect the robe from the aggressive room environment in Apsley House. Unfortunately, as the emissions from textile dyes and furs can tarnish silver, this approach had some associated risks. Two environmental and filtration control units (HahnRK2/5) were used in the case to mitigate this.
The accuracy of damage functions, like Equation (1), needs to be considered. It was assessed in a series of instances where pollution, temperature and RH were measured, alongside measurement of the silver tarnish rate. The pollution was measured with diffusion tubes, temperature and RH with Rotronic Hygroclip I or II probes, and the silver tarnish rate with Onguard or AirCorr units or by exposing 99.9% silver coupons. The silver coupons were cleaned with Micromesh 1200 cloth, degreased in spectrosol acetone and dried. After exposure, they were stripped with a Palmsens potentiostat in 1 M sodium nitrate from 0 to −2.5 V versus a standard hydrogen electrode. The thickness of silver sulfide was determined from the area under the reduction peak starting at −1.0 V and the surface area of the coupon stripped. The measured silver sulfide thicknesses were compared to the values estimated for the same time period using the damage function. The results are shown in Figure 1.
There is a very good correlation between the measured and estimated values, considering the errors in each individual measurement and their propagation. The error in the temperature is 0.03 °C, in the RH 0.8% (checked with annual calibration traceable to NAMAS standards), and the diffusion tubes have reported errors of around 15% [37]. Using the average values, the propagated error from the parameter measurements was:
∆Ag = √(0.15)2 + 0.152 + 0.152 + 0.152 + 0.152 + 0.0022 + 0.022) = 0.300
This propagated error of Equation (1) was found to be similar to the deviation of the calculation by the damage function from the measured values.
5. Concentration or Dose, and Synergism with RH
Within human health, dose is mainly used as the measure of exposure. Biological systems often have some ability to repair pollution damage. Most inanimate materials do not possess this ability. Despite this, the dose-approach is often used in engineering. A concentration measure from passive sampling averaged over weeks or months is a resource efficient compromise. A higher time resolution may be needed for building and mitigation diagnostic purposes, or if significantly high or low periodic values are detected This can be in situations with LOAELs (lowest observed adverse effect levels). The RH has a strong and sometimes extremely strong synergistic effect with some pollutant gases. Data were taken from Tetreault’s work on lead corrosion in acetic acid environments and replotted in terms of dose [11] (Figure 2).
Although there is a general correlation, the data are very highly spread due to the strong synergistic effect with RH. After exposure to around 13 mg/m3/month, lead can be unaffected or experience up to an 8.3 g/m2 mass gain in corrosion, depending on the RH, which is therefore a central parameter to assess to evaluate the corrosion risk.
6. Temporal Variations in Acetic and Formic Acid Concentrations in Showcases
In non-air-conditioned locations, there are strong daily and seasonal variations in acetic and formic acid concentrations due to fluctuating temperature and RH values that affect the emissions. However, variation can also occur in air-conditioned spaces. The temperature and RH are maintained, but induced seasonal variations in ventilation can alter the air exchange rate and hence acetic and formic acid concentration in showcases. Thus, many measurements may be needed throughout the year to assess the risk from acetic or formic acid. The monthly acetic acid concentration in showcases in 14 sites over a year was analysed from a series of measurements with diffusion tubes. This included results from monthly duplicate measurements of acetic and formic acid concentrations in seven of ten showcases across Europe from the EU MASTER project [4,38,39]. Two of these showcases were in air-conditioned rooms and five in rooms without air conditioning. Duplicate diffusion tubes were used. A number of further measurements were made in the British Museum and Museum of London to provide data from showcases from four galleries with air conditioning and three without air conditioning. For these London measurements, Palmes diffusion tubes were exposed for twelve monthly periods. The diffusion tubes were based on potassium hydroxide sorbent and analysis with a Dionex 600 ion chromatograph (Sunnyvale, CA, USA) with AS14 column and 18 mM sodium carbonate/sodium bicarbonate eluent [37]. The tubes were exposed in quadruplicate. For each set of measurements in a showcase, the maximum concentration was noted, and other values were expressed as a percentage of this maximum value. Any values with a standard deviation greater than 17% of the average measured value were discarded. The maximum measured concentration in µg/m3 is shown on the ordinate label in Figure 3.
The showcases in air-conditioned rooms showed large monthly variations in acetic acid concentration. Although the naturally ventilated room variations were larger, these values are surprisingly variable.
7. Development and Testing of an Equilibrium Acetic Acid Concentration Tool
In addition to the main research, an attempt was made in the MEMORI project to use existing data to develop a tool to estimate the approximate acetic acid concentration from emissions from wood products, from temperature and RH data. Wood products, and in particular MDF (medium-density fibreboard), continue to be the most common source of acetic acid in showcases. Equilibrium concentration data for the acetic acid above oak and spruce sawdust were measured. The wood chips were placed over saturated salt solutions at temperature intervals between 5 and 35 °C and RH intervals of 30–75% RH [40]. The data were fitted with splines to produce a reaction surface. Acetic acid concentration values were then extracted at 0.1 °C and 1% RH intervals. This extracted concentration versus the temperature and RH data set was placed in a spreadsheet and used as a lookup table for T/RH data from environmental monitoring. A years’ worth of measured T/RH data can be inserted, and the spreadsheet will estimate the acetic acid concentration by data point (T(t) and RH(t)). The time-dependent acetic acid concentration, ratioed against its maximum value, is displayed over the measurement period. Spreadsheets have been produced for different measurement periods: 1 day suitable for active measurements; 3 days suitable for A-D strips, 14 or 30 days for diffusion tubes. The spreadsheet then indicated the anticipated annual spread of concentration data and the date of the maximum acetic concentration value. These data are extremely useful in the planning of measurements.
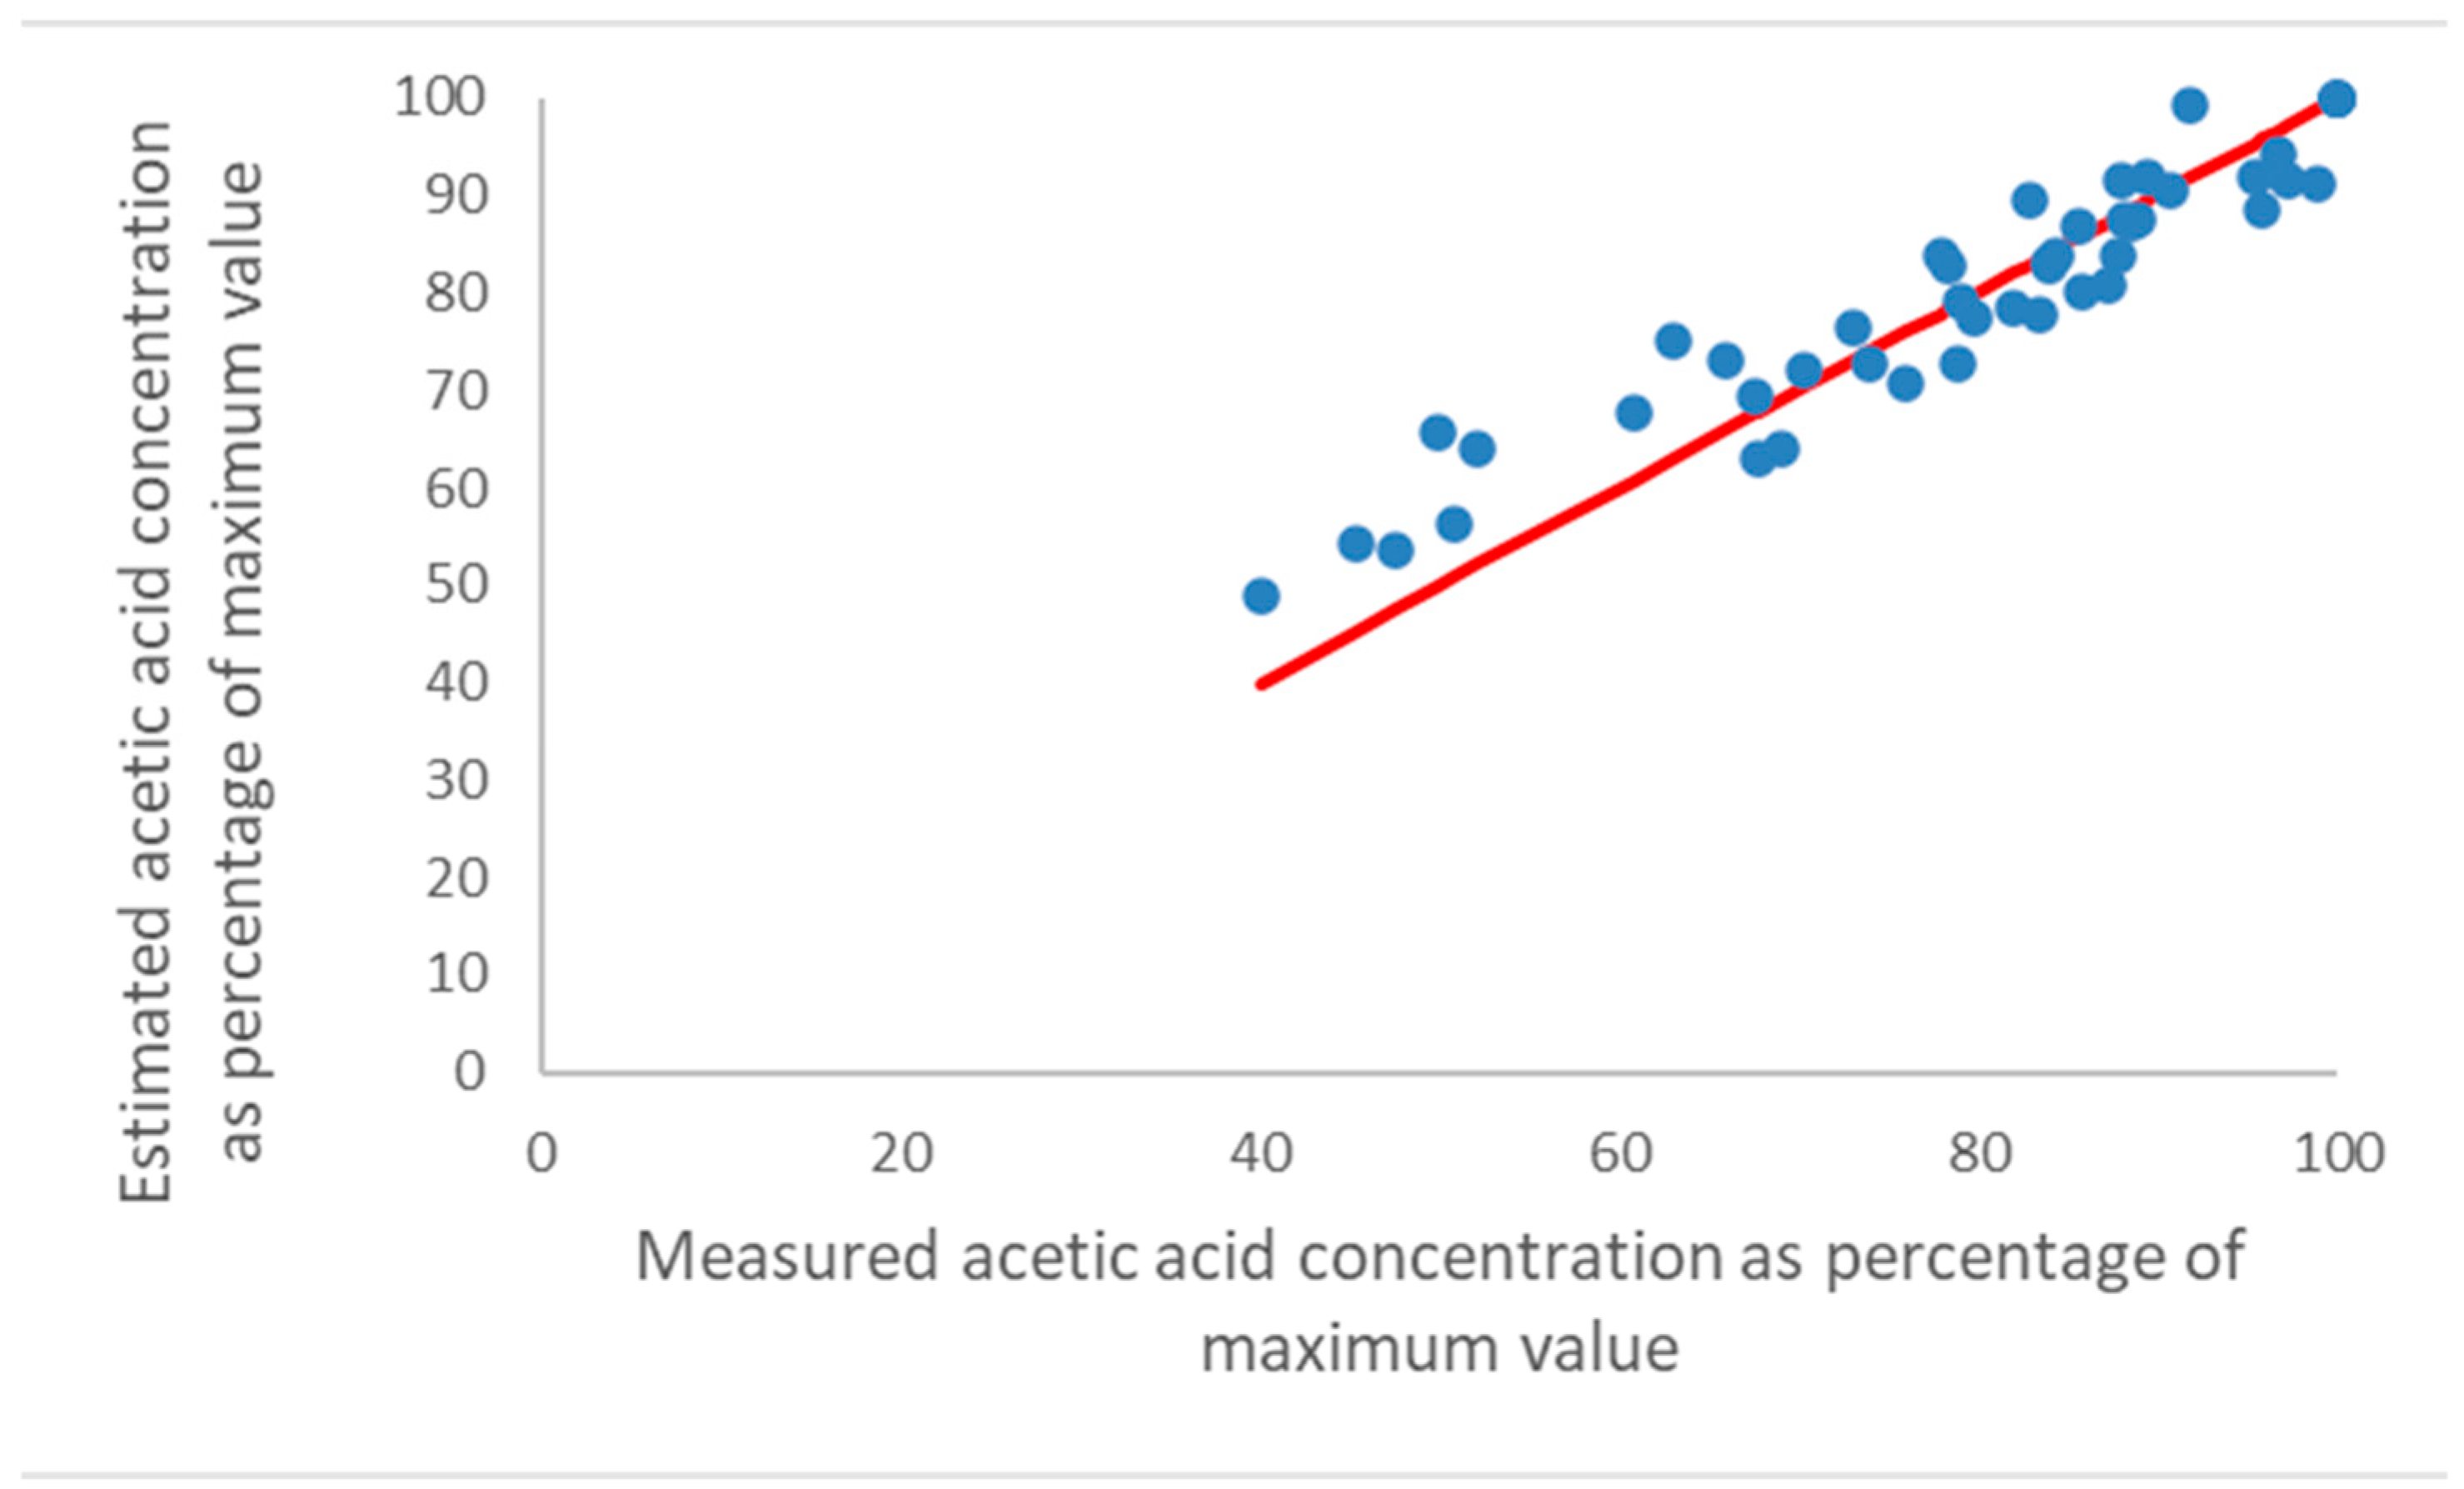
The process was assessed using the measured T/RH and acetic acid concentration data from the seven British Museum and Museum of London showcases. The estimated values of the acetic acid concentration from the spreadsheet were calculated from measured average values of T and RH monitoring in showcases. These estimated values were compared with the measured acetic acid concentrations in those showcases from diffusion tubes. The values were aligned at 100%. Figure 4 shows the measured acetic acid concentration against the estimated concentration for the four showcases in air-conditioned rooms.
At higher values, the estimated concentrations are quite close to the measured ones and the errors increase as the values drop. Below 65% of the maximum monthly measured acetic acid concentration, all of the estimated values are higher and diverge further from the measured values with a decreasing % of the maximum concentration. The R2 value of the points from 60 to 100% where there is a good linear relationship is 0.84.
Figure 5 shows the values for naturally ventilated rooms.
For the three naturally ventilated rooms, a similar trend is observed, but there are more values at a lower percentage. The R2 value of the points from 66 to 100% where there is a good linear relationship is 0.78. The equilibrium concentration tool appears to work best at high T, RH, acetic acid emissions and concentrations. The equilibrium concentration does not respond linearly to either temperature or RH, so an average value will indeed underestimate changes. In reality, the acetic acid concentration will be in a dynamic equilibrium rather than the changing steady state assumed by the model. The emission from wood is related to the wood temperature and moisture content. Whilst the temperature probably is quite similar to the air temperature, the moisture content will certainly lag behind the RH, especially for thicker pieces. Medium-density fibreboard is generally used for baseboards, backboards or mounts, and in many instances the structural requirements lead to the use of 10 or 13 mm-thick boards. It seems that the larger deviations from the measured values at lower acetic acid concentrations might be explained by a time lag in the emission response of the wood (and other materials) with changing RH and T, which create a so-called hysteresis in the concentrations of the acetic acid in a showcase “around” the average values of the model. This hysteresis should result in a spread around the measured values and a systematic deviation if it is not symmetric, and it could thus explain the deviations at low acetic acid concentrations.
8. Conclusions
The research results do provide enough information to assess the risk from some pollutants towards some heritage materials. However, there are very significant gaps in this research, which complicates the issue. Much of the existing research is in the grey literature and relatively inaccessible. An assessment system has been developed to draw this information together and provide an accessible method to assess measured values for the main reported damaging pollutants. The concentrations proposed in standards vary widely, limiting their utility. Also, few recent standards have a clear description of how the concentrations proposed were arrived at, which arguably is not the place of a standard but does undermine their widespread use. Damage functions appear to provide a good approach to interpreting data. However, the limited numbers thus far developed clearly reduce their utility at present. Damage functions of acetic and formic acid should include the main synergy with RH and need to consider possible thresholds (LOAELs) in the effects of the acids, as well as possible temporal effects of RH and T on the emissions that can create highly variable concentrations in enclosures and different corrosion effects than would be expected from the average values.
By applying the information and methods described in this paper it should be possible to obtain a useful and sometimes quite accurate understanding of the risk of deterioration/corrosion of heritage material of interest due to indoor exposure to gaseous pollution. However, the variability in both environmental situations and materials is large. As such, interpretation is indispensable in preventive conservation, and the attentive observations of objects and changes cannot be replaced.
Author Contributions
Conceptualization, D.T.; methodology, T.G. and D.T.; formal analysis, D.T. and T.G.; data curation, T.G.; writing—original draft preparation, D.T.; writing—review and editing, T.G. and D.T.; funding acquisition, T.G. and D.T. All authors have read and agreed to the published version of the manuscript.
Funding
Some of equipment was funded by UKRI through the Capco Scheme. Otherwise, this research received no external funding.
Data Availability Statement
All data are available from the corresponding author on request.
Conflicts of Interest
The authors declare no conflict of interest.
References
- Spiegel, E. (Care for Art, Koln, Germany). 2012 The Current Situation and Management of Indoor Air Pollution (IAQ) in European Collections, 2012. Unpublished manuscript.
- Thickett, D. Review of analysis for cultural heritage conservation. Curr. Top. Anal. Chem. 2020, 12, 73–88. [Google Scholar]
- Tidblad, J.; Kreislová, K.; Faller, M.; De la Fuente, D.; Yates, T.; Verney-Carron, A.; Grøntoft, T.; Gordon A Hans, U. ICP Materials Trends in Corrosion, Soiling and Air Pollution (1987–2014). Materials 2017, 10, 969. [Google Scholar] [CrossRef] [PubMed]
- Dahlin, E. (Ed.) EU Project MASTER. Final Report “Preventive Conservation Strategies for Protection of Organic Objects in Museums, Historic Buildings and Archives”; NILU OR 76/2010; NILU: Kjeller, Norway, 2010; Available online: https://projects.nilu.no/master/76-2010-emd-teg-MASTER.pdf (accessed on 9 August 2023).
- Tétreault, J. Airborne Pollutants in Museums Galleries and Archives; Canadian Conservation Institute: Ottawa, Canada, 2003.
- Grzywacz, C.M. Monitoring for Gaseous Pollutants in Museum Environments; Tools for Conservation; Getty Conservation Institute: Los Angeles, CA, USA, 2006; Available online: http://hdl.handle.net/10020/gci_pubs/monitoring_gaseous (accessed on 2 September 2023).
- ISO 16000-1:2004; Indoor Air—Part 1: General Aspects of Sampling Strategy. International Standards Organisation: Geneva, Switzerland, 2004.
- Gibson, L.T.; Watt, C.M. Acetic and formic acids emitted from wood samples and their effect on selected materials in museum environments. Corros. Sci. 2010, 52, 172–178. [Google Scholar] [CrossRef]
- Indoor Air Pollution Working Group. Available online: http:/iaq.dk/iap (accessed on 31 August 2023).
- Robinet, L. The Role of Organic Pollutants in the Alteration of Soda Silicate Glasses. Ph.D. Dissertation, University of Edinburgh, Edinburgh, UK, University of Paris VI, Paris, France, 2006. [Google Scholar]
- Tétreault, J.; Sirois, J.; Stamatopoulou, E. Study of lead corrosion in acetic acid environment. Stud. Conserv. 1998, 43, 17–32. [Google Scholar]
- Thickett, D.; Chisholm, R.; Lankester, P. Reactivity Monitoring of Atmospheres. In Metal 2013, Proceedings of the Interim Meeting of the ICOM-CC Metal Working Group, Edinburgh, Scotland, UK, 16–20 September 2013; Mardikian, P., Ed.; Historic Scotland and International Council of Museums: Edinburgh, UK, 2013; pp. 129–136. ISBN 978-92-9012-410-8. [Google Scholar]
- Wexler, A.; Hasegawa, S. Relative Humidity-Temperature Relationships of Some Saturated Salt Solutions in the Temperature Range 0° to 50 °C. J. Res. Natl. Bur. Stand. 1954, 53, 19–26. [Google Scholar] [CrossRef]
- Dahlin, E. (Ed.) EU Project POPAINT. Final Report. “Improved Protection of Paintings during Exhibition, Storage and Transit”; NILU OR 42/2010; NILU: Kjeller, Norway, 2010; Available online: http://propaint.nilu.no/ (accessed on 29 June 2023).
- Grøntoft, T.; Odlyha, M.; Mottner, P.; Dahlin, E.; Lopez-Aparicio, S.; Jakiela, S.; Scharff, M.; Andrade, G.; Obarzanowski, M.; Ryhl-Svendsen, M.; et al. Pollution monitoring by dosimetry and passive diffusion sampling for evaluation of environmental conditions for paintings in microclimate frames. J. Cult. Herit. 2010, 11, 411–419. [Google Scholar] [CrossRef]
- MEMORI. The MEMORI Technology. Innovation for Conservation. 2023. Available online: http://memori.nilu.no (accessed on 29 June 2023).
- English Heritage. Management of Showcases. Available online: https://www.english-heritage.org.uk/learn/conservation/collections-advice-and-guidance/ (accessed on 10 July 2023).
- BS 5454:1977; Recommendations for the Storage and Exhibition of Archival Documents. British Standards Institution: London, UK, 1977.
- Thomson, G. The Museum Environment; Butterworths: London, UK, 1978. [Google Scholar]
- NBSUR 83-2795; Air Quality Criteria for Storage of Paper Based Archival Records. National Bureau of Standards: Gaithersburg, MA, USA, 1983.
- National Research Council. Preservation of Historical Records; National Research Council: Washington, DC, USA, 1986; p. 29.
- BS 5454:1989; Recommendations for the Storage and Exhibition of Archival Documents. British Standards Institution: London, UK, 1989.
- BS 5454:2000; Recommendations for the Storage and Exhibition of Archival Documents. British Standards Institution: London, UK, 2000.
- NISO TR01; Environmental Guidelines for the Storage of Paper Records. National Information Standards Organization Press: Bethesda, MA, USA, 1995.
- Boston, G. Safeguarding the Documentary Heritage: A Guide to Standards, Recommended Practices, and Reference Literature Related to the Preservation of Documents of All Kinds; UNESCO: Milton Keynes, UK, 1998; pp. 19–20. [Google Scholar]
- NARA 1571; Archival Storage Standards. National Archives and Records Administration: Washington, DC, USA, 2002; p. 15.
- PD 5454; Guide for the Storage and Exhibition of Archival Materials. British Standards Institution: London, UK, 2012.
- PAS 198; Guide for the Specification for Managing Environmental Conditions for Cultural Collections. British Standards Institution: London, UK, 2012.
- American Society of Heating, Refrigerating and Air-Conditioning Engineers. Chapter 21 Museums, Galleries, Archives and Libraries. In 2003 ASHRAE Handbook: Heating, Ventilating, and Air-Conditioning Applications; Owen, M.S., Ed.; ASHRAE: Atlanta, GA, USA, 2003; pp. 21.1–24.46. [Google Scholar]
- American Society of Heating, Refrigerating and Air-Conditioning Engineers. Chapter 21 Museums, Galleries, Archives and Libraries. In 2007 ASHRAE Handbook: Heating, Ventilating, and Air-Conditioning Applications; Owen, M.S., Ed.; ASHRAE: Atlanta, GA, USA, 2007; pp. 21.1–24.46. [Google Scholar]
- Baer, N.S.; Banks, P.N. Indoor air pollution: Effects on cultural and historic materials. Int. J. Mus. Manag. Curatorship 1985, 4, 9–20. [Google Scholar]
- ISO 9223-2012; Corrosion of Metals and Alloys—Corrosivity of Atmospheres, Classification, Determination and Estimation. International Standards Organisation: Geneva, Switzerland, 2012.
- ISO 11844-2:2005; Corrosion of Metals and Alloys—Classification of Low Corrosivity of Indoor Atmospheres—Part 2: Determination of Corrosion Attack in Indoor Atmospheres. International Standards Organisation: Geneva, Switzerland, 2005.
- Pastorelli, G.; Cao, S.; Kralj Cigi, I.; Cucci, C.; Elnaggar, A.; Strlič, M. Development of dose-response functions for historic paper degradation using exposure to natural conditions and multivariate regression. Polym. Degrad. Stab. 2019, 168, 108944. [Google Scholar] [CrossRef]
- Thickett, D.; Chisholm, R.; Lankester, P. Development of damage functions for copper, silver and enamels on copper. In Proceedings of the Climate for Collections, Standards and Uncertainties, Munich, Germany, 7–9 November 2012; Archetype: London, UK, 2012; pp. 325–335. [Google Scholar]
- Fenech, A. Lifetime of Colour Photographs in Mixed Archival Collections. Ph.D. Thesis, University College London, London, UK, 2011. Available online: https://discovery.ucl.ac.uk/id/eprint/1333217/ (accessed on 2 September 2023).
- Gibson, L.T.; Cooksey, B.G.; Littlejohn, D.; Tennent, N.H. Determination of acetic acid and formic acid in the museum environment by passive sampling. Anal. Chim. Acta 1997, 341, 11–19. [Google Scholar] [CrossRef]
- Grøntoft, T. Performance evaluation for museum enclosures. Measurement, modeling and mitigation of pollutant impact on objects in museum enclosures. E-Preserv. Sci. 2012, 9, 36–46. Available online: http://www.morana-rtd.com/e-preservationscience/2012/Grontof-26-06-2012.pdf (accessed on 9 August 2023).
- Grøntoft, T.; Henriksen, J.; Hansen, J.E.; Ofstad, T.; Dahlin, E.; Lazaridis, M.; Czop, J.; Sommer-Larssen, A.; Hallett, K.; Calnan, C.; et al. EU project MASTER (EVK4-CT-2002-00093). Project Deliverable no. D.3.1, WP 3. Sensor and Environmental Data from the Field Test Programme. Published Project Report by NILU-Norwegian Institute for Air Research, NILU OR 45/2009. Available online: https://www.nilu.no/publikasjon/24477/ (accessed on 2 September 2023).
- Thickett, D.; Bradley, S.M. Assessment of the risks to metal artifacts exposed by volatile carbonyl pollutants. In Metal 98, Proceedings of the International Conference on Metals Conservation, Draguignan, France, 27–29 May 1998; Mourey, W., James, L.R., Eds.; James & James: London, UK, 1998; pp. 260–264. [Google Scholar]
Figure 1.
Estimated rates of silver tarnish from damage function compared to measured tarnish rates.
Figure 1.
Estimated rates of silver tarnish from damage function compared to measured tarnish rates.
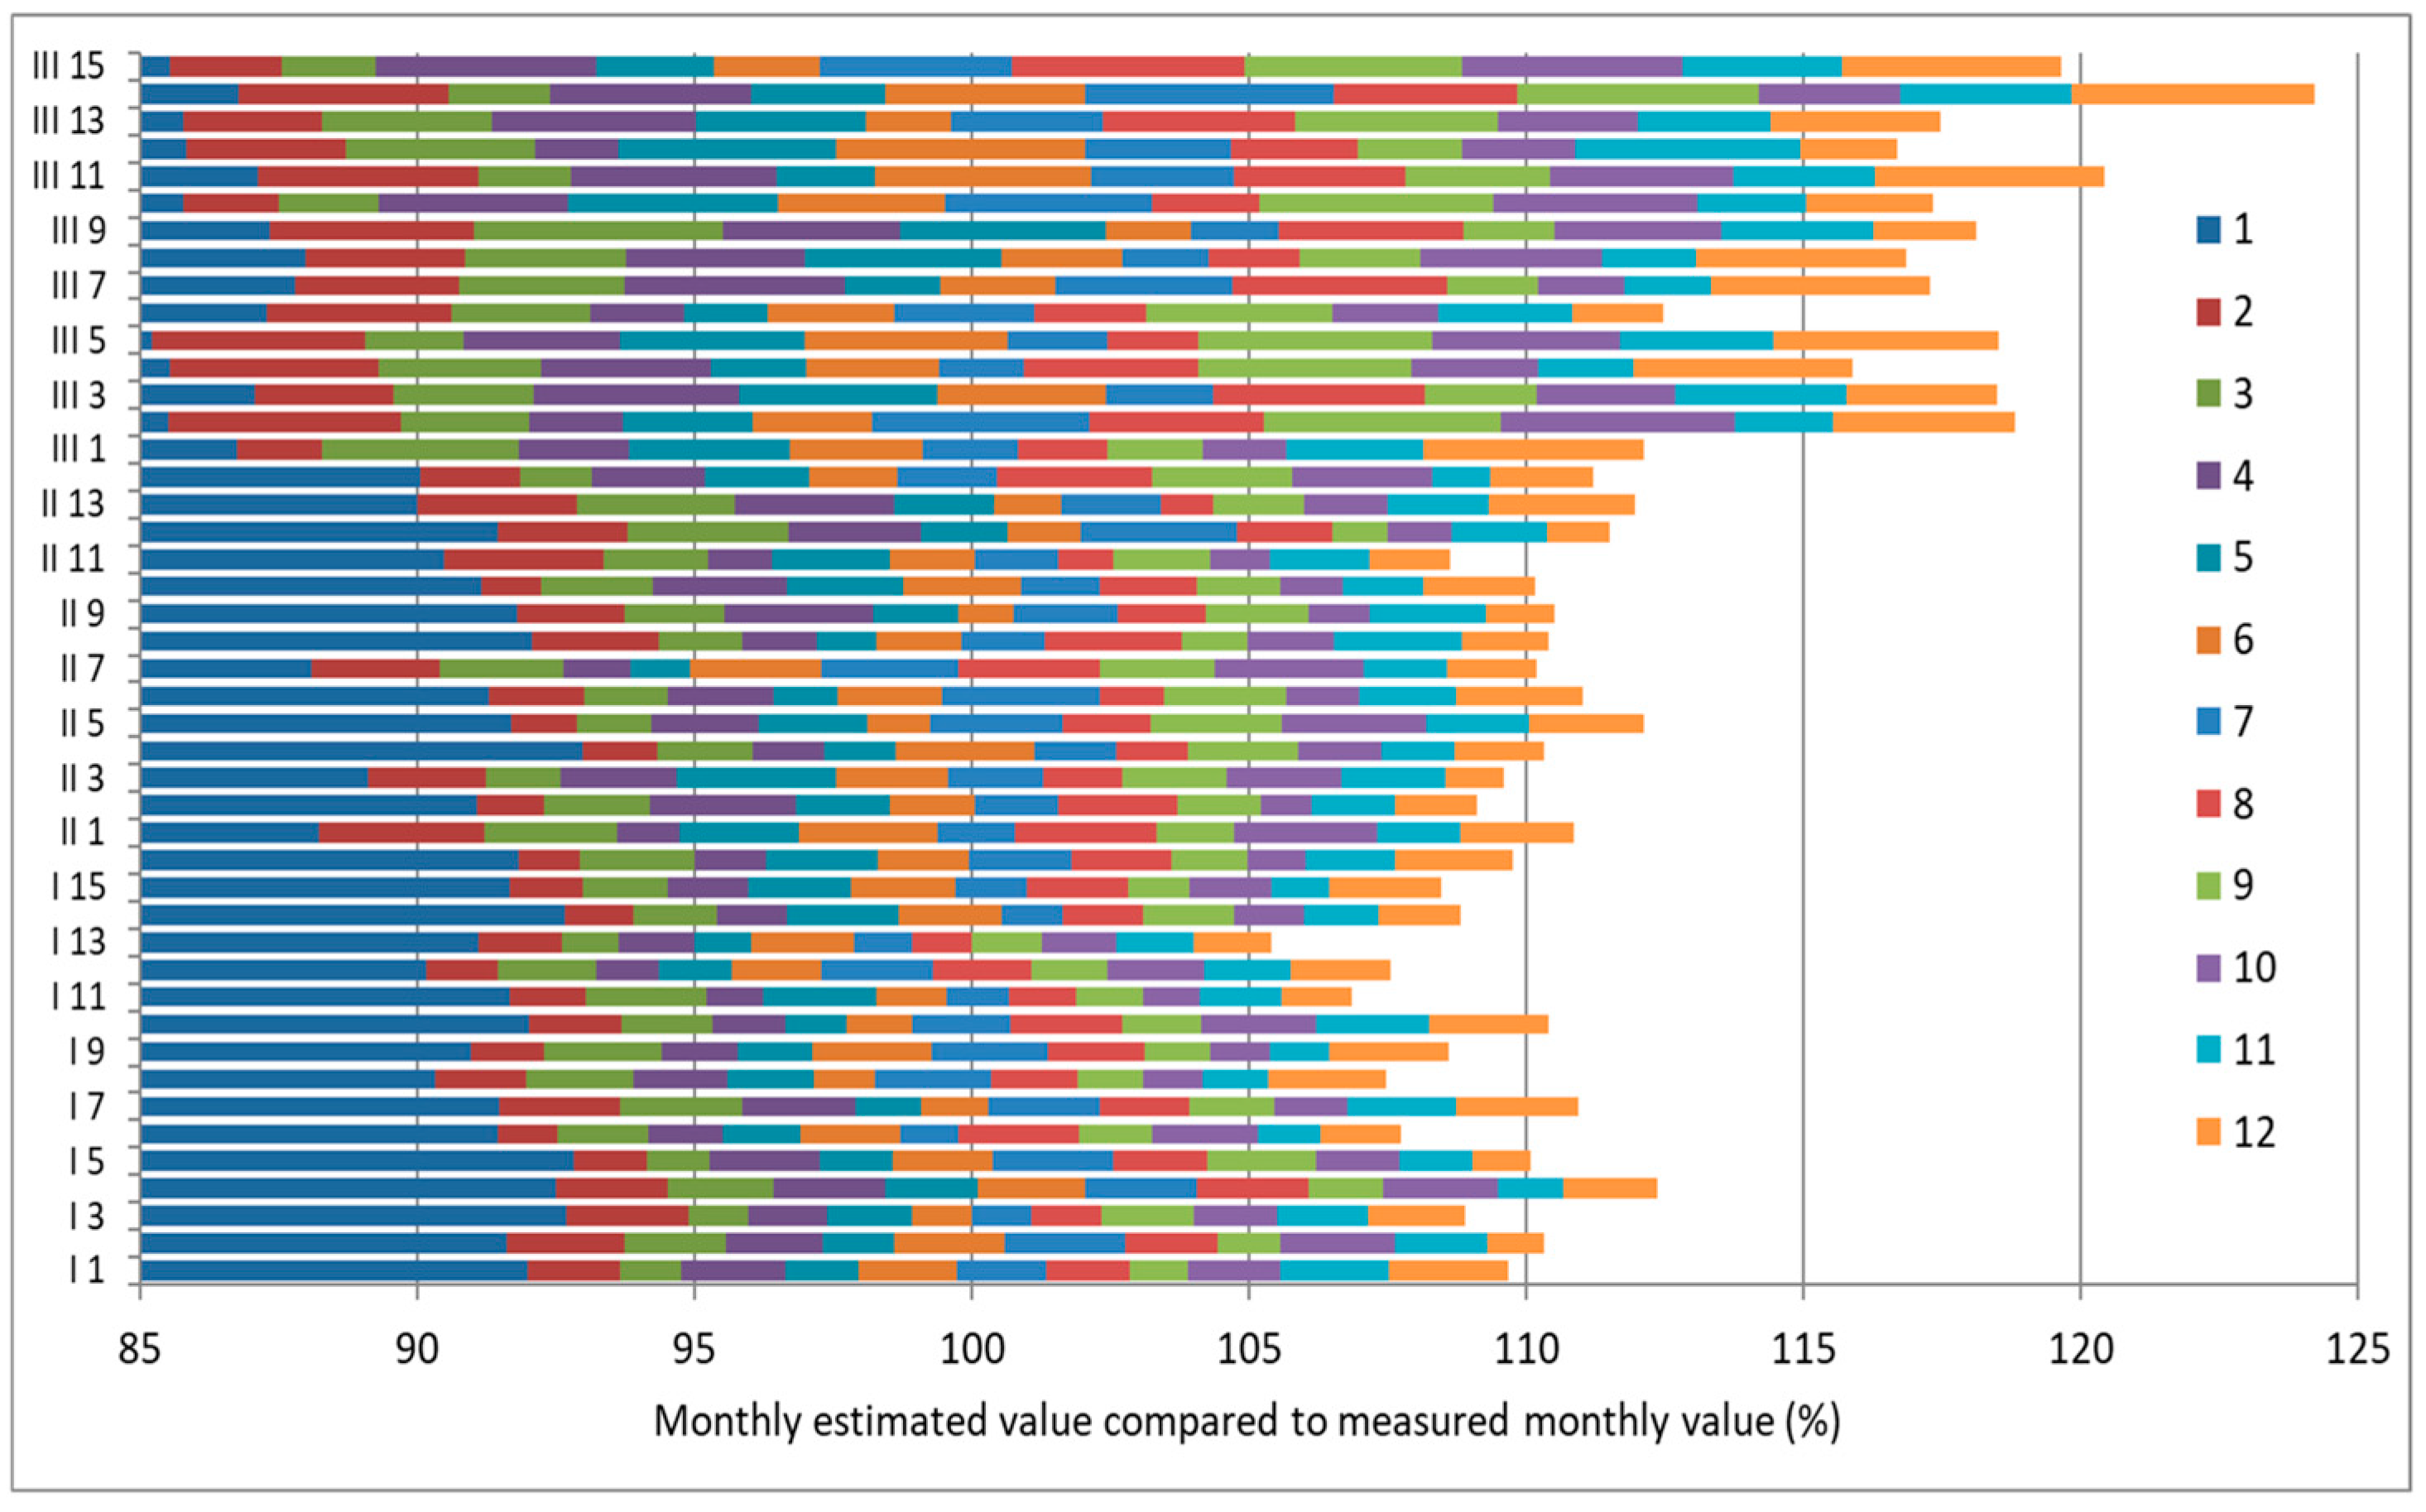
Figure 2.
Mass gain on lead as a result of acetic acid dose exposure. From data in [12].
Figure 2.
Mass gain on lead as a result of acetic acid dose exposure. From data in [12].
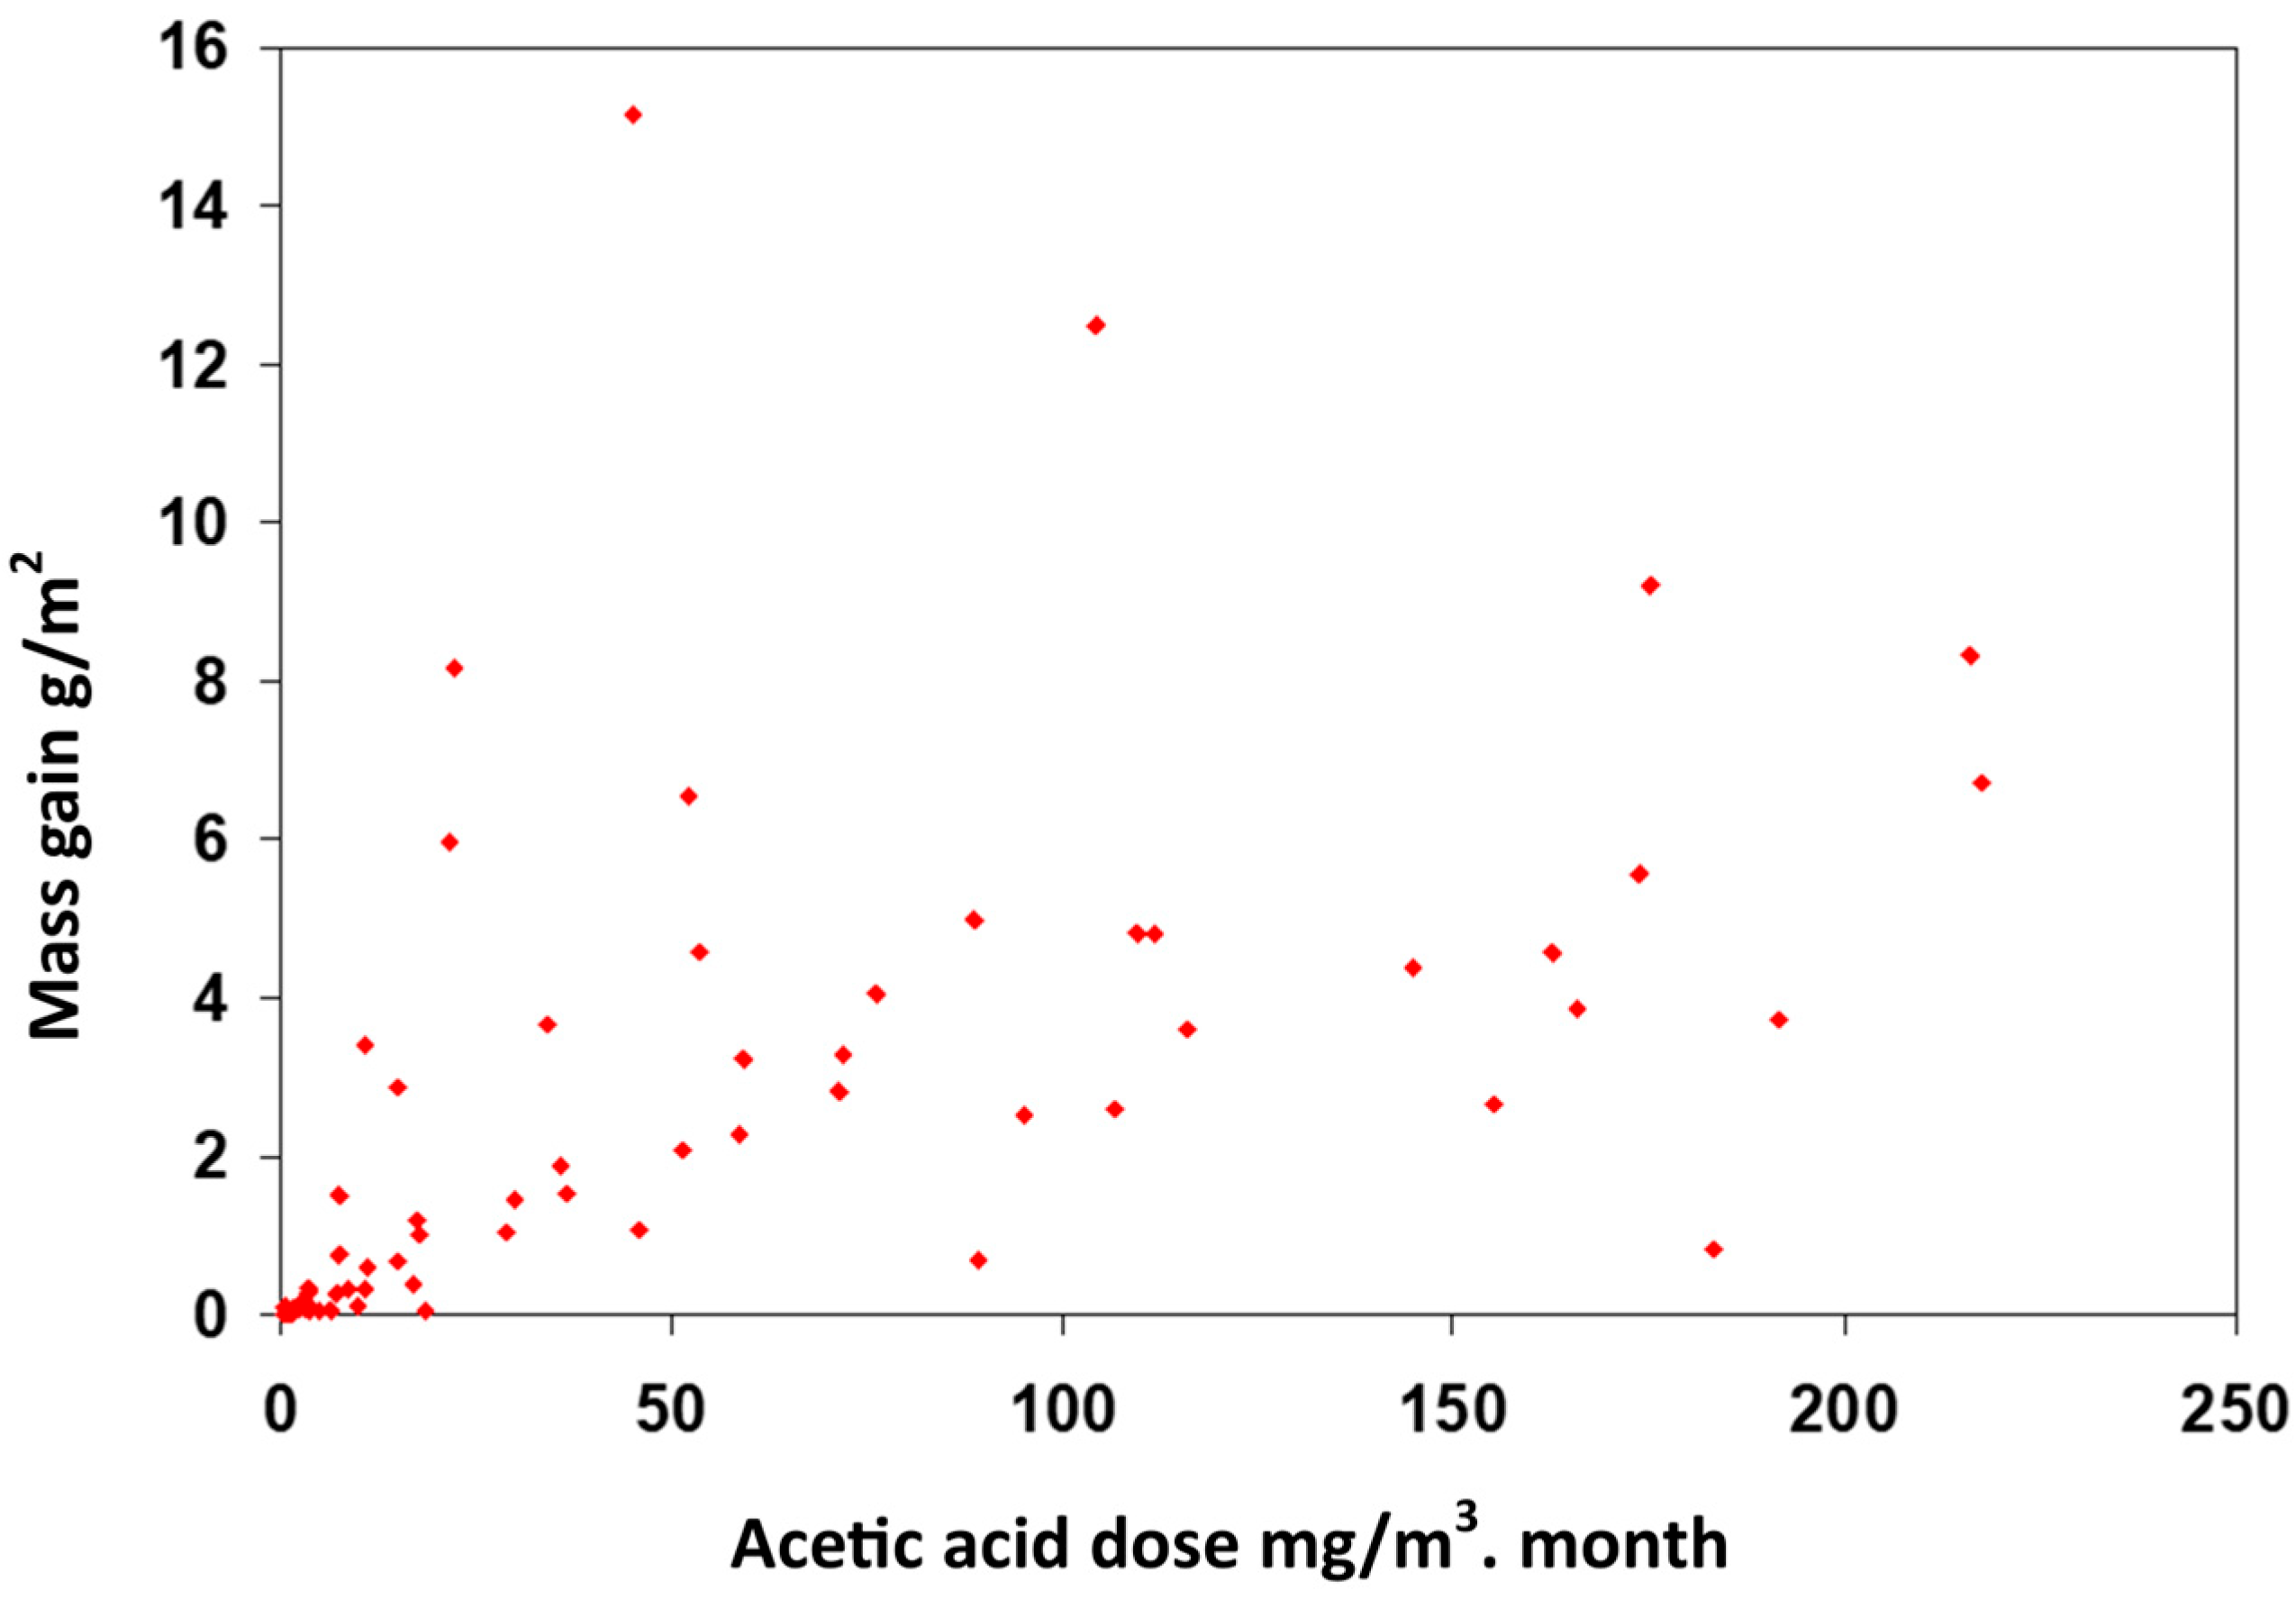
Figure 3.
Annual monthly acetic acid concentrations in 14 showcases relative to the maximum concentration. The maximum monthly concentration (µg/m3) is given as the numeric at the end of the ordinate labels. AC = Showcases with air conditioning, ACR = Showcases in rooms with air conditioning, N = Showcases without air conditioning in naturally ventilated rooms.
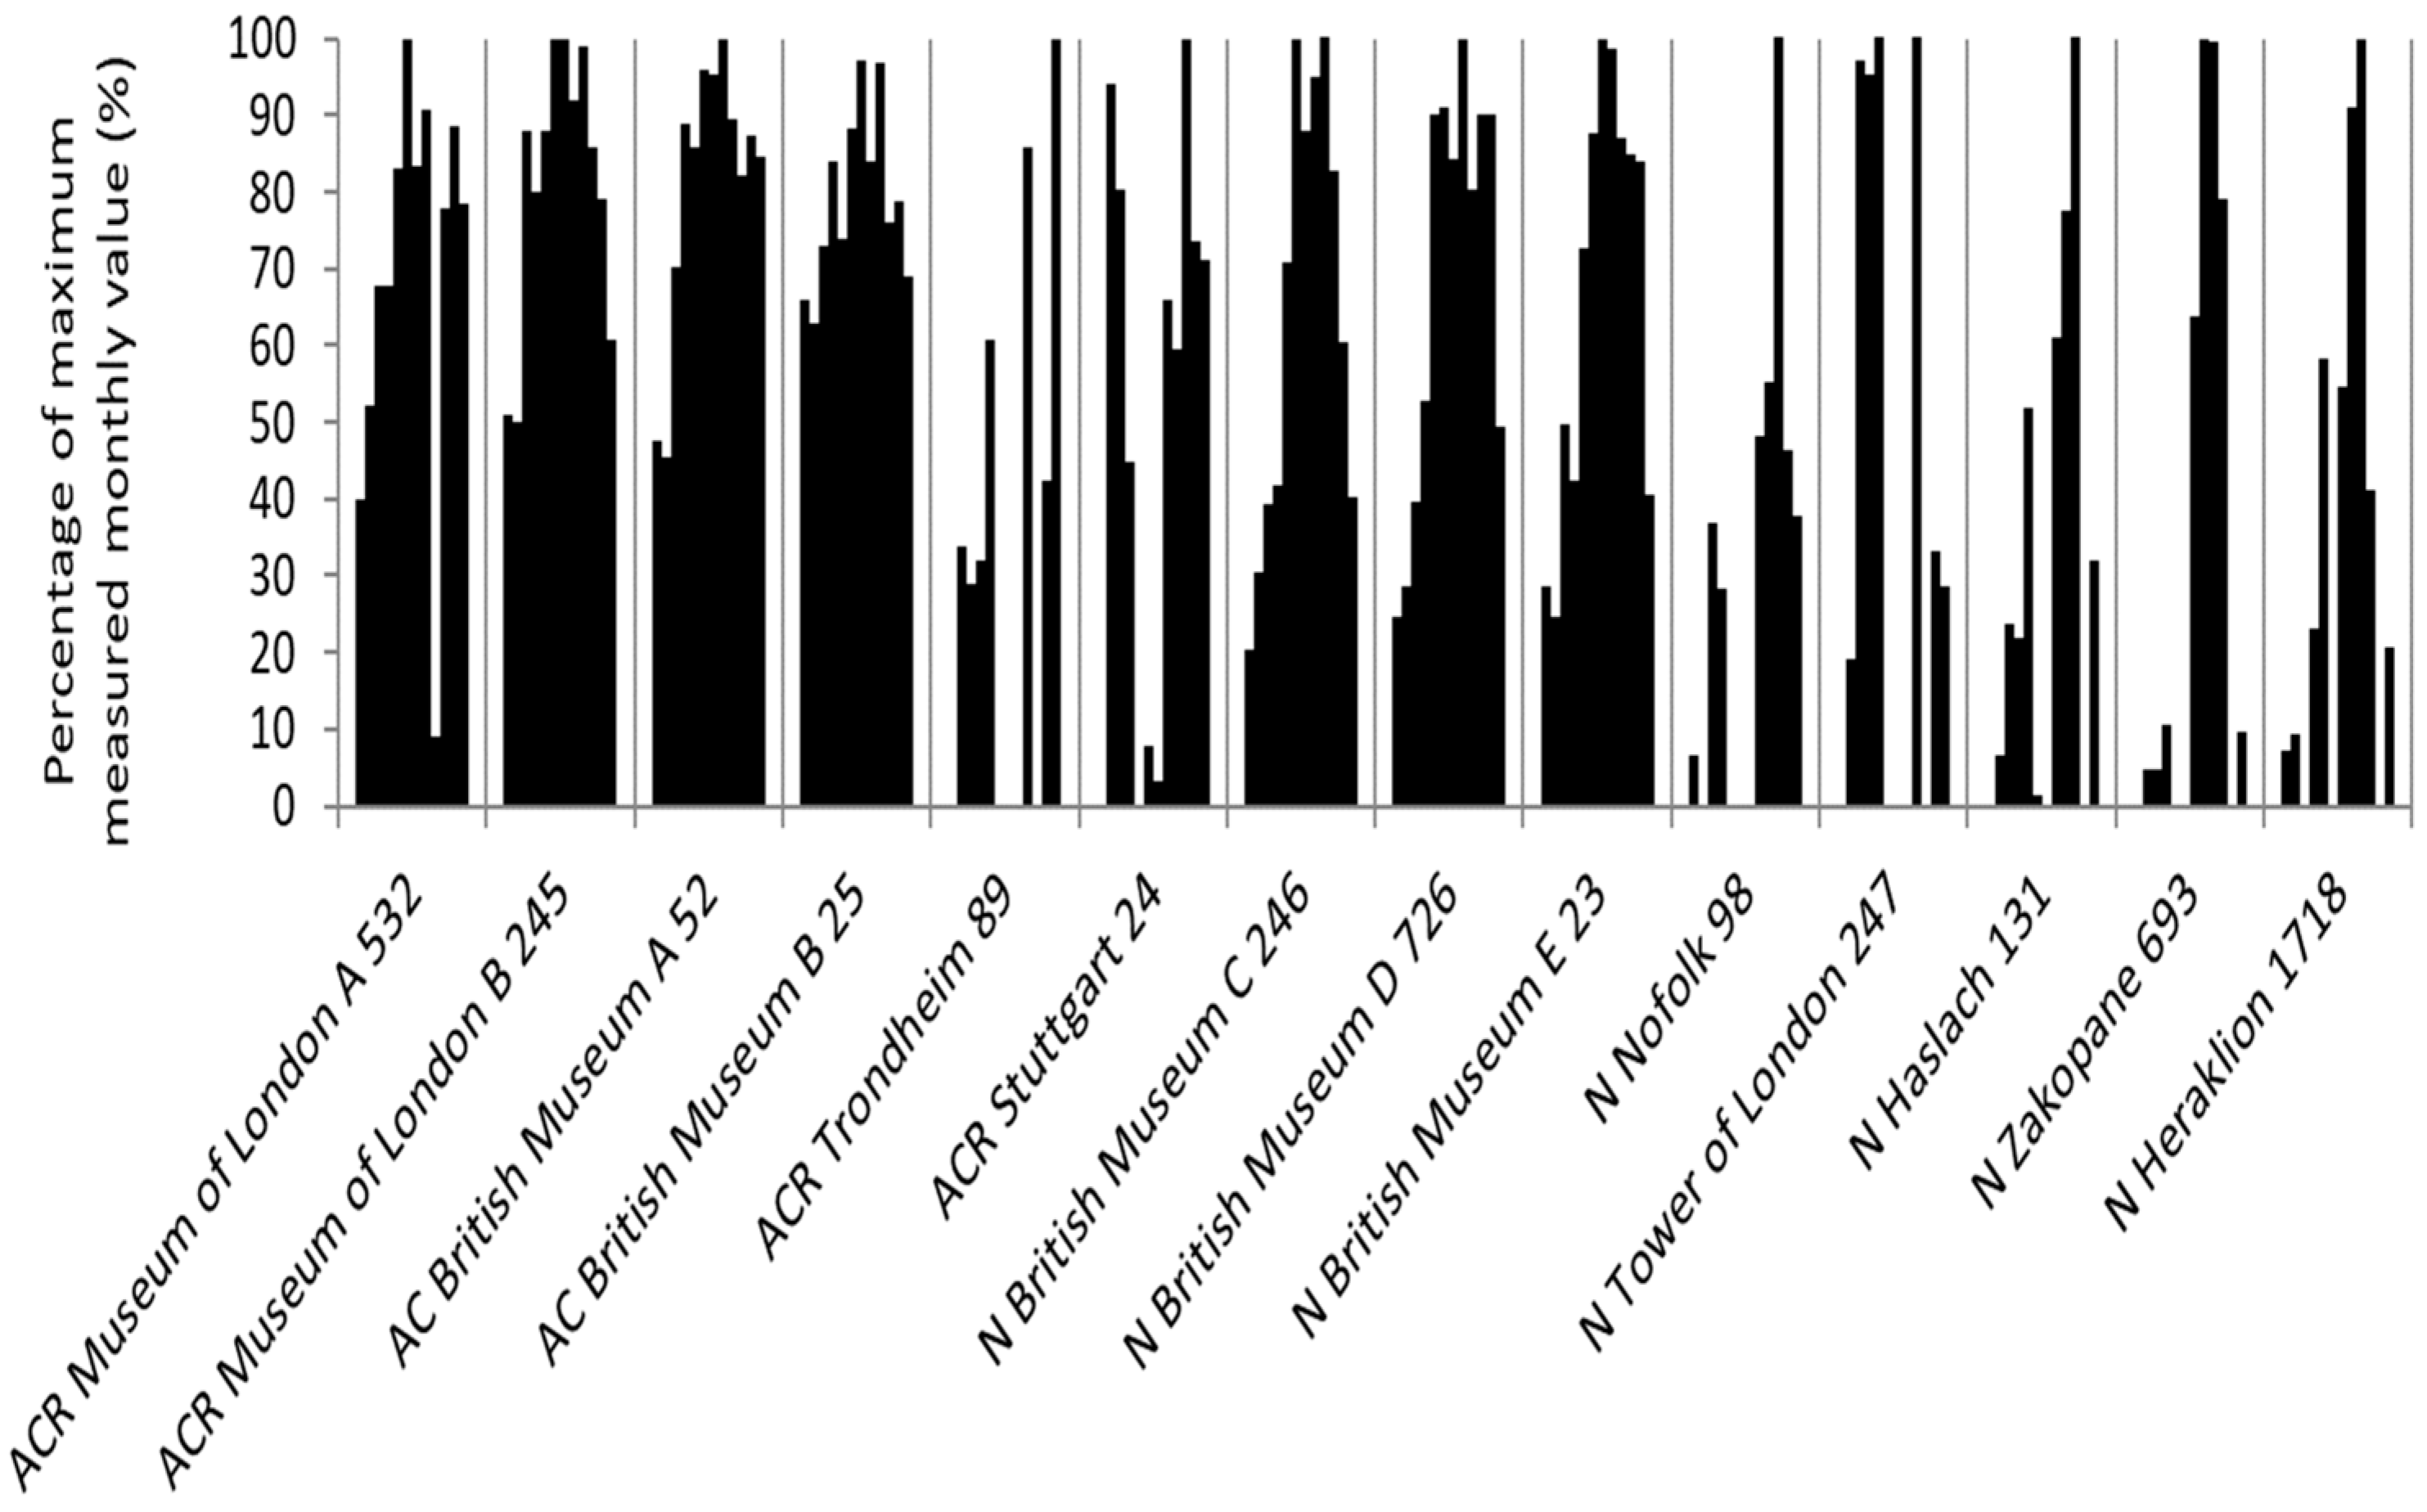
Figure 4.
Measured relative acetic acid concentrations for the four showcases in air-conditioned rooms in the Museum of London and British Museum, against the concentration estimated by T and RH values by the Excel spreadsheet (see text), aligned at 100%. The red line is full agreement for comparison.
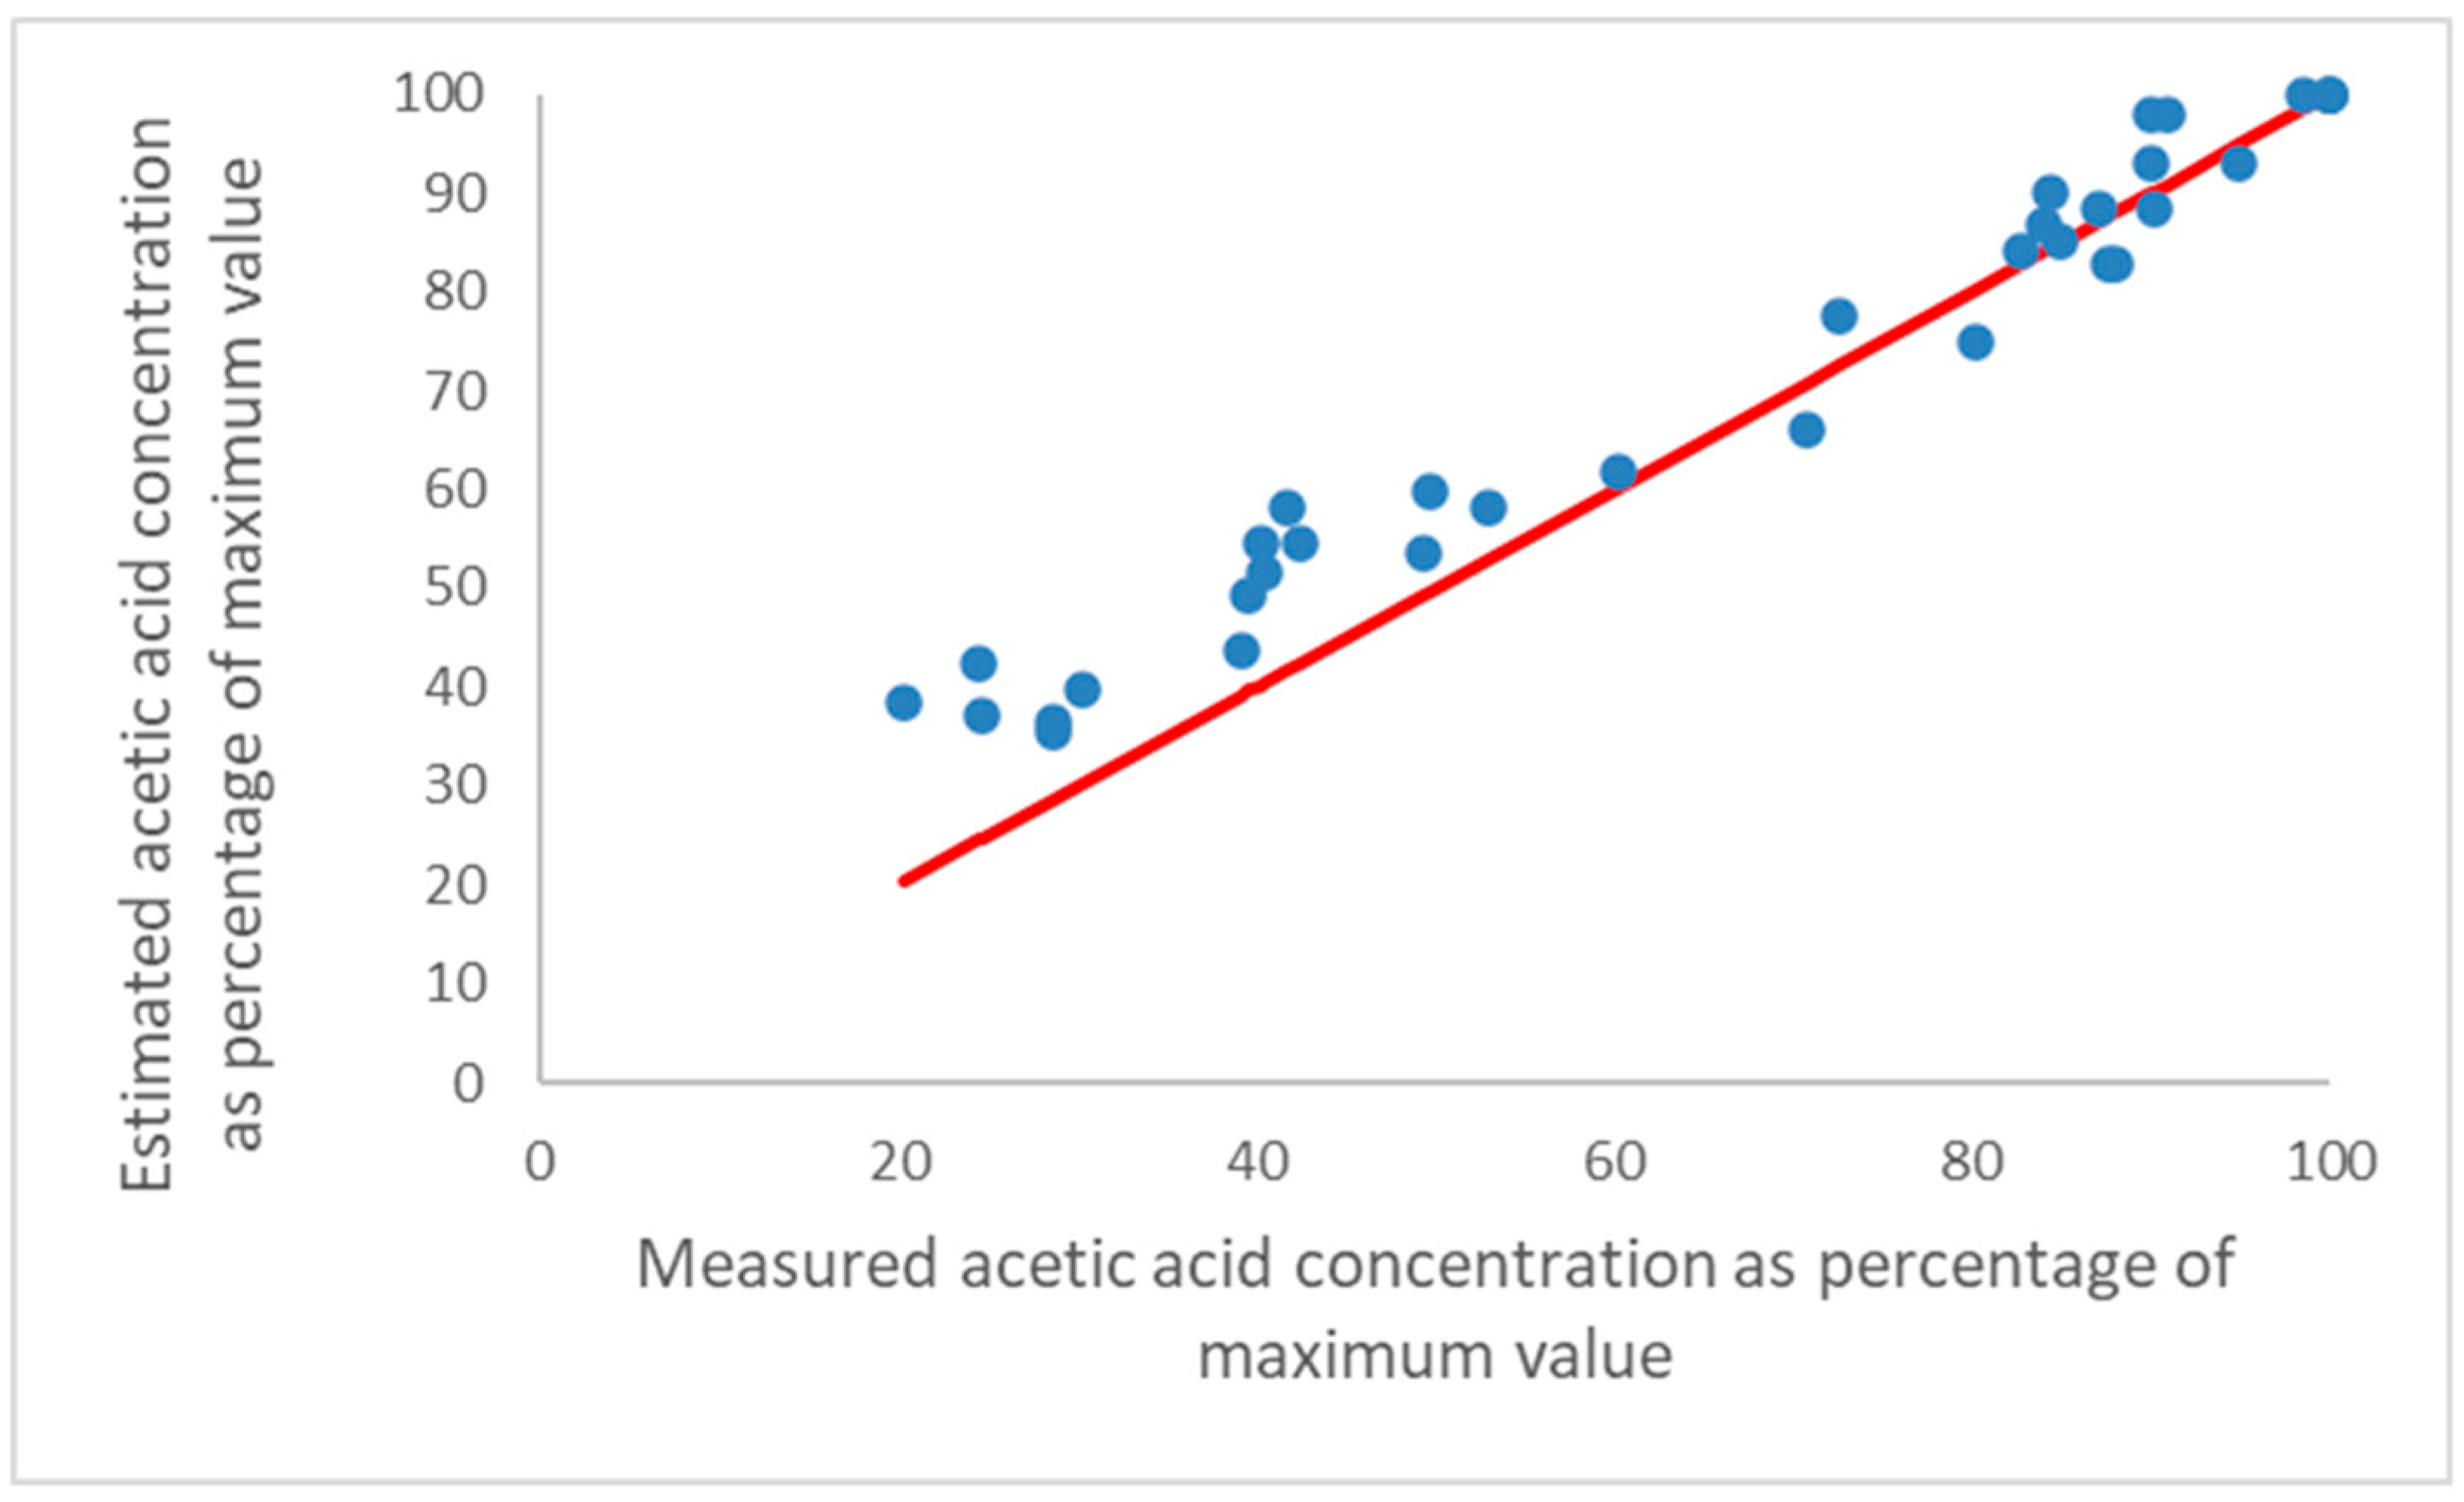
Figure 5.
Measured relative acetic acid concentrations for the three naturally ventilated showcases in the Museum of London and British Museum, against the concentration estimated by T and RH values by the Excel spreadsheet (see text), aligned at 100%. The red line is full agreement for comparison.
Figure 5.
Measured relative acetic acid concentrations for the three naturally ventilated showcases in the Museum of London and British Museum, against the concentration estimated by T and RH values by the Excel spreadsheet (see text), aligned at 100%. The red line is full agreement for comparison.

Table 1.
Sensitivity of the selected materials to acetic and formic acid concentrations (µg/m3) and RH (lead and copper) and the response of a glass slide dosimeter (GSD). Red indicates a high level of risk (with full details given below), amber a medium risk and green a low risk of deterioration.
Table 1.
Sensitivity of the selected materials to acetic and formic acid concentrations (µg/m3) and RH (lead and copper) and the response of a glass slide dosimeter (GSD). Red indicates a high level of risk (with full details given below), amber a medium risk and green a low risk of deterioration.
| Equivalent Acetic Acid Concentration | Equivalent Formic Acid Concentration | GSD Response | Lead 50% RH | Glass | Copper 75% RH | Lignin-Free Paper | ||
|---|---|---|---|---|---|---|---|---|
| Acetic | Formic | Acetic | Formic | |||||
| 0–400 | <20 | 0–1.9 | ||||||
| 20–100 | ||||||||
| 100–200 | ||||||||
| 400–750 | 200–375 | 1.9–2.7 | ||||||
| 750–1500 | 375–750 | 2.7–4.3 | ||||||
| 1500–3000 | 750–1500 | 4.3–7.5 | ||||||
| 3000–6000 | 1500–3000 | 7.5–13.1 | ||||||
| >6000 | >3000 | >13.1 | ||||||
Table 2.
Standards for gas concentrations.
| Gas/Particle Concentration (µg/m3) | BS5454 1977 [18] | Thomson 1978 [19] | Nat Bur Std 1983 NBS [20] | NRC 1986 NRC [21] | BS5454 1989 [22], 2000 [23] | NISO 1995 NISO [24] | UNESCO 1998 [25] | NARA 2002 [26] | PD5454 2012 [27] |
|---|---|---|---|---|---|---|---|---|---|
| Acetic acid | BCT | 10 | |||||||
| Formaldehyde | BCT | 5 | |||||||
| Formic acid | |||||||||
| Nitrogen dioxide | 10 | 5 | BCT | 10 | 19 | 1 | 5 | 10 | |
| Ozone | 2 | 25 | 2 | 20 | 2 | 4 | |||
| Reduced sulphides (H2S) | |||||||||
| Sulphur dioxide | 50 | 10 | 1 | 1 | 10 | 27 | 1 | 2.7 | 1 |
| Total suspended particle | 75 | 75 |
Table 3.
Further standards for gas concentrations.
| PAS 198 [28] | ASHRAE 2003 [29] | ASHRAE 2007 [30] | ||||||
|---|---|---|---|---|---|---|---|---|
| Gas/Particle Concentration (µg/m3) | Historic Soda Silicate Glass | Shell, Eggs | Lead | 1 Year | 10 Years | 100 Years | General Collections | Sensitive Materials |
| Acetic acid | 1000 | 100 | 1000 | 100 | 100 | 224 | 5 | |
| Formaldehyde | 300 | 20 | 5 | |||||
| Formic acid | 500 | 500 | 78 | 5 | ||||
| Nitrogen dioxide | 10 | 1 | 0.1 | 1 | 0.1 | |||
| Ozone | 10 | 1 | 0.1 | 0.05 | 0.5 | |||
| Reduced sulphides (H2S) | 1 | 0.1 | 0.01 | 0.1 | 0.01 | |||
| Sulphur dioxide | 10 | 1 | 0.1 | 0.4 | 0.04 | |||
| Fine particles PM2.5 | 10 | 1 | 0.1 | 1 | 0.1 | |||
Table 4.
Standards based on metal corrosion rates.
| Corrosion Rate (mg/m2/yr) | |||||
|---|---|---|---|---|---|
| Copper | Silver | Sulphur Dioxide (μg/m3) | Chloride | ||
| ISO 11844 IC1 | V low ind | ≤50 | ≤70 | ||
| ISO 11844 IC2 | Low ind | 50–200 | 170–670 | ||
| ISO 11844 IC3 | Med ind | 200–900 | 670–3000 | ||
| ISO 11844 IC4 | High ind | 900–2000 | 3000–6700 | ||
| ISO 11844 IC5 | V high ind | 2000–5000 | 6700–16,700 | ||
| ISO 9223 C1 | v.Low | ≤900 | |||
| ISO 9223 C2 | Low | 900–5000 | <5 | ||
| ISO 9223 C3 | Med | 5000–12,000 | 5–30 or | low | |
Table 5.
Pollutants and climate data and damage function results.
| H2S (ppb) | NO2 (ppb) | SO2 (ppb) | HCl (ppb) | O3 (ppb) | RH (%) | Temp (°C) | Silver Corrosion Rate (Å/30 Days) | ||
|---|---|---|---|---|---|---|---|---|---|
| Apsley House | May | 27.47 | 27.98 | 1.26 | 25.01 | 1.59 | 50.27 | 10.53 | 144.11 |
| June | 26.32 | 24.40 | 1.32 | 29.82 | 1.67 | 53.49 | 10.92 | 147.94 | |
| July | 25.53 | 30.81 | 1.56 | 11.06 | 1.45 | 57.55 | 11.86 | 139.82 | |
| August | 27.38 | 26.06 | 1.35 | 25.49 | 1.78 | 63.89 | 11.54 | 157.50 | |
| September | 0.57 | 18.7 | 0.3 | 4.5 | 7.9 | 53.5 | 12.5 | 142.76 | |
| Audley End House | May | 0.03 | 1.7 | 0.2 | 0.3 | 12.1 | 41.2 | 11.32 | 60.22 |
| June | 0.05 | 2.0 | 0.2 | 0.1 | 9.7 | 44.5 | 13.43 | 65.13 |
Disclaimer/Publisher’s Note: The statements, opinions and data contained in all publications are solely those of the individual author(s) and contributor(s) and not of MDPI and/or the editor(s). MDPI and/or the editor(s) disclaim responsibility for any injury to people or property resulting from any ideas, methods, instructions or products referred to in the content. |
© 2023 by the authors. Licensee MDPI, Basel, Switzerland. This article is an open access article distributed under the terms and conditions of the Creative Commons Attribution (CC BY) license (https://creativecommons.org/licenses/by/4.0/).
Share and Cite
MDPI and ACS Style
Thickett, D.; Grøntoft, T. Review of Interpreting Gaseous Pollution Data Regarding Heritage Objects. Heritage 2023, 6, 6917-6930. https://doi.org/10.3390/heritage6100361
AMA Style
Thickett D, Grøntoft T. Review of Interpreting Gaseous Pollution Data Regarding Heritage Objects. Heritage. 2023; 6(10):6917-6930. https://doi.org/10.3390/heritage6100361
Chicago/Turabian StyleThickett, David, and Terje Grøntoft. 2023. "Review of Interpreting Gaseous Pollution Data Regarding Heritage Objects" Heritage 6, no. 10: 6917-6930. https://doi.org/10.3390/heritage6100361