Article

Super-Resolution Techniques in Photogrammetric 3D Reconstruction from Close-Range UAV Imagery

1
Department of Surveying and Geoinformatics Engineering, University of West Attica, 12243 Athens, Greece
2
NCSR Demokritos, Institute of Informatics & Telecommunications, 15341 Athens, Greece
3
School of Applied Arts and Sustainable Design, Hellenic Open University, 26335 Patras, Greece
4
School of Rural, Surveying and Geoinformatics Engineering, National Technical University of Athens, 15780 Athens, Greece
*
Author to whom correspondence should be addressed.
Heritage 2023, 6(3), 2701-2715; https://doi.org/10.3390/heritage6030143
Submission received: 9 February 2023 / Revised: 22 February 2023 / Accepted: 3 March 2023 / Published: 6 March 2023
(This article belongs to the Special Issue Photogrammetry, Remote Sensing and GIS for Built Heritage)

Abstract

:
Current Multi-View Stereo (MVS) algorithms are tools for high-quality 3D model reconstruction, strongly depending on image spatial resolution. In this context, the combination of image Super-Resolution (SR) with image-based 3D reconstruction is turning into an interesting research topic in photogrammetry, around which however only a few works have been reported so far in the literature. Here, a thorough study is carried out on various state-of-the-art image SR techniques to evaluate the suitability of such an approach in terms of its inclusion in the 3D reconstruction process. Deep-learning techniques are tested here on a UAV image dataset, while the MVS task is then performed via the Agisoft Metashape photogrammetric tool. The data under experimentation are oblique cultural heritage imagery. According to results, point clouds from low-resolution images present quality inferior to those from upsampled high-resolution ones. The SR techniques HAT and DRLN outperform bicubic interpolation, yielding high precision/recall scores for the differences of reconstructed 3D point clouds from the reference surface. The current study indicates spatial image resolution increased by SR techniques may indeed be advantageous for state-of-the art photogrammetric 3D reconstruction.

1. Introduction

Image data can be exploited by SfM (Structure-from-Motion) and MVS (Multi-View Stereo) photogrammetric tools towards reconstructing robust, free of outliers, and elaborate 3D models [1,2]. Essentially, these image-based approaches start from aerial and/or terrestrial image blocks to automatically perform image registration (via sparse image matching) and subsequently reconstruct accurate textured 3D models of the depicted scenes (via dense image matching). Since these automated pipelines are capable of generating high-quality spatial data at a reasonable cost, the now widely available software tools for SfM/MVS photogrammetry have triggered a tremendous increase in the number of its applications, notably in the geosciences but also in all possible fields requiring reliable 3D geospatial information. Consequently, the SfM/MVS photogrammetric tools also attract today unprecedented numbers of mostly non-expert users, namely those with little or without formal training in photogrammetry [3].
Clearly, however, this striking popularity of photogrammetric 3D reconstruction approaches is largely due to an ever-growing variety of autonomous platforms for flexible image acquisition known as unmanned aerial vehicles (UAVs) or drones. Thanks to their obvious advantages, both financial and technical, against conventional satellite and manned aircraft platforms [4], UAVs have become the main camera platform currently used for the purposes of aerial mapping. A summary literature review of recent developments and applications involving light-weight UAVs and SfM/MVS software is given in [5].
This is also true for the specific environment of cultural heritage, where UAVs have provided an attractive alternative to traditional, but unwieldy, camera platforms for low-altitude image acquisition (balloons, kites, elevators, tripods). In a review of their use in this field [6], it is noted that, beyond mere technical innovation, the methodological novelty of UAVs lies mainly in allowing archaeologists to exercise direct control over all aspects of survey processes (platform, sensors, and processing of collected data). As a consequence of the above, the UAV/SfM/MVS photogrammetric approach is now also very popular in the field of cultural heritage. The recent detailed review [7] discusses state-of-the-art tools and methodologies for image acquisition, data processing, and 3D reconstruction in relation to cultural heritage.
On the other hand, in multiple applications of Remote Sensing (RS), such as surveillance and satellite imaging practices, the spatial resolution of aerial or satellite images has a strong impact on the precision and reliability of the information which is extracted from the images [8,9,10]. High-resolution (HR) images may of course be acquired under controlled scenarios in the absence of related constraints on the recording hardware. However, in certain instances the MVS input images are of limited spatial resolution (as in the case of historic photographic archives); the hardware may impede the collection of the required data amount; power consumption may in turn constrain the hardware, e.g., in the case of drones [11]. As regards imagery from unmanned aerial vehicles (UAVs) in particular, issues of low spatial resolution are mainly attributed to the flight height and the selected resolution in 3D space (ground element or “groundel”), especially in urban environments or industrial and construction sites, as well as to their generally low-cost, consumer-grade digital RGB cameras. The problem is that requirements of safe flight and/or the camera parameters do not always conform with the needed ground sampling distance, geometry or texture quality; in such cases, the generated 3D model will most likely be poor in detail and completeness, regardless of the adopted MVS algorithm [11,12,13]. For straightforwardly super-resolving a Digital Surface Model (DSM), on the other hand, a large amount of data is required for model training [14]. Hence, an algorithmic increase of image spatial resolution may indeed be of high interest as a means for effectively improving not only the visual quality but also the metric accuracy of results. Super-Resolution (SR) algorithms upsample original low-resolution (LR) imagery in an attempt to improve both their visual and metric properties, enrich detail and possibly recover high image frequencies [10,15,16,17,18,19,20,21,22,23,24,25]. In this sense, single-image super-resolving techniques, in particular, seem to be suitable for improving 3D reconstruction, thus calling for a closer examination in terms of effectiveness.
Ιn this work, a study is carried out on different image SR techniques to assess their suitability regarding their inclusion in a 3D reconstruction procedure. SR techniques are validated on UAV-captured image data. In particular, the SR algorithms presented in [19,22,23,24] are examined as means for super-resolving images which enter the 3D reconstruction task in the field of cultural heritage. The MVS task is performed by using the Agisoft Metashape photogrammetric tool [26]. The specific contribution of our work is a thorough investigation of the suitability of different pre-trained image SR techniques applied on oblique low-altitude (close-range) imagery for the purposes of photogrammetric full 3D reconstruction (as generally required in the field of cultural heritage projects).
This work is organized into 6 sections. Section 2 presents the literature on improving 3D reconstruction by means of SR tools. Section 3 describes the image datasets, the SR techniques, the 3D reconstruction approach and the methodology adopted for the comparisons. The results are given in Section 4, while Section 5 discusses the main issues arising throughout the current study. The conclusions are drawn in Section 6.

2. Literature Review of 3D Reconstruction with the Aid of Super-Resolution

SR techniques can algorithmically increase the spatial resolution of images (but it is noted that, while thereby details get clearer and more discernible, artefacts may also be induced). The exploitation of SR tools for enhancing 3D reconstruction procedures is an open research field, since relatively few related studies have appeared in the literature up to now [11,12,13,14,25,27,28].
Working in the context of conventional mapping and DSM generation from satellite imagery, the authors in [14] examined the introduction of different refined SR models aiming at a workflow for creating DSMs per subpixel level. Qualitative analysis and a summary statistical measure (RMS difference in DSM elevations) led to the conclusion that a subpixel level DSM of higher reliability may be more effectively obtained via image SR techniques rather than bicubic image interpolation or direct DSM upscaling.
In Ref. [25] the neural networks RDN [29] and ESRGAN [30], along with bicubic interpolation, were evaluated regarding DSM generation in urban areas from pairs of satellite images. Judging mainly from the summary quantitative measures of DSM differences, these authors found no evidence that the employment of image SR networks outperforms standard bicubic image interpolation for the investigated 3D task. In a more detailed local investigation on stereo matching, image disparities at the maxima of the distributions of the employed similarity measure (cross-correlation coefficient) along corresponding epipolar lines of satellite stereo pairs were evaluated against ground truth elevation data from Lidar. It was seen that matching benefited strongly from SR for features of high contrast; on the other hand, in uniformly textured areas SR turned out to be disadvantageous, accompanied by uncontrolled artefact occurrence and inconsistent patterns which led to poor matching in such areas (not rare in urban environments). Concluding, the authors skeptically wondered whether, without addressing such shortcomings, one may actually exploit SR potential with reliability in 3D photogrammetry. One may remark, however, that (unlike standard stereo matching) multi-view matching may provide more means to efficiently exclude outlying image content and SR-induced image artefacts.
The use of image SR algorithms has been suggested also in [12] for cases where a required higher ground resolution cannot be possibly met by shorter imaging distances or different cameras/lenses. In this work, photogrammetric products (from the Agisoft Metashape tool) from vertical images captured by a small commercial UAV were evaluated against the same data pre-processed with a method based on the SR generative adversarial network (SRGAN) [31]; the data collected at a lower altitude served for ground truth. It was concluded that photogrammetric products created after SR-processing of images from larger imaging distances presented quality close to those from smaller distances (and, additionally, avoided certain occlusion issues met in imagery from smaller heights but with inadequate multiple overlaps).
A recent paper [11] also investigated how an increase in resolution by SR techniques of the images which enter an MVSNet algorithm is reflected in quality improvements of the reconstructed 3D models. COLMAP [32] and CasMVSNet [33,34] were the 3D reconstruction algorithms used. In order to increase the image spatial resolution by a factor of 2, the SR algorithm Deep Back-Projection Networks (DBPN) [35], as well as bicubic interpolation, were tested. It was shown that the introduction of a SR stage before recovering the depth maps led in most cases to a better 3D model in the case of both PatchMatch-based and Deep-Learning (DL) based algorithms. Overall, it was concluded that SR especially improves the completeness of reconstructed models, turning out to be particularly effective in the case of well-textured scenes.
The potential of a SR model for single images, based on the ESRGAN deep convolutional neural network [26], to improve the spatial resolution of UAV-captured RGB images was investigated in [13]. The model was retrained using HR images and corresponding LR images created by downsampling the original HR images. A qualitative and quantitative assessment of results from a photogrammetric Structure from Motion (SfM) process (again with the Agisoft Metashape software) indicated that the internal and external camera parameters of the SR images presented values close to those from the adjustment of the HR images. It was also concluded that SR resampling is beneficial for scene reconstruction; a more thorough evaluation, however, would have allowed a more detailed comparison of the two dense 3D models.
Finally, other recent applications employed a SR technique to assist road pavement monitoring with UAV images [27] and to improve building façade 3D reconstruction using images from a smartphone [28]. In the different context of consumer RGB-D cameras, the approach in [36] aims at high-quality 3D reconstruction involving, among other steps, the application of a depth super-resolution network directly on noisy, low-resolution depth images combined with a high-resolution intensity image of the scene (for a review of similar methods for super-resolving depth images from RGB-D cameras see [37]).

3. Materials and Methods

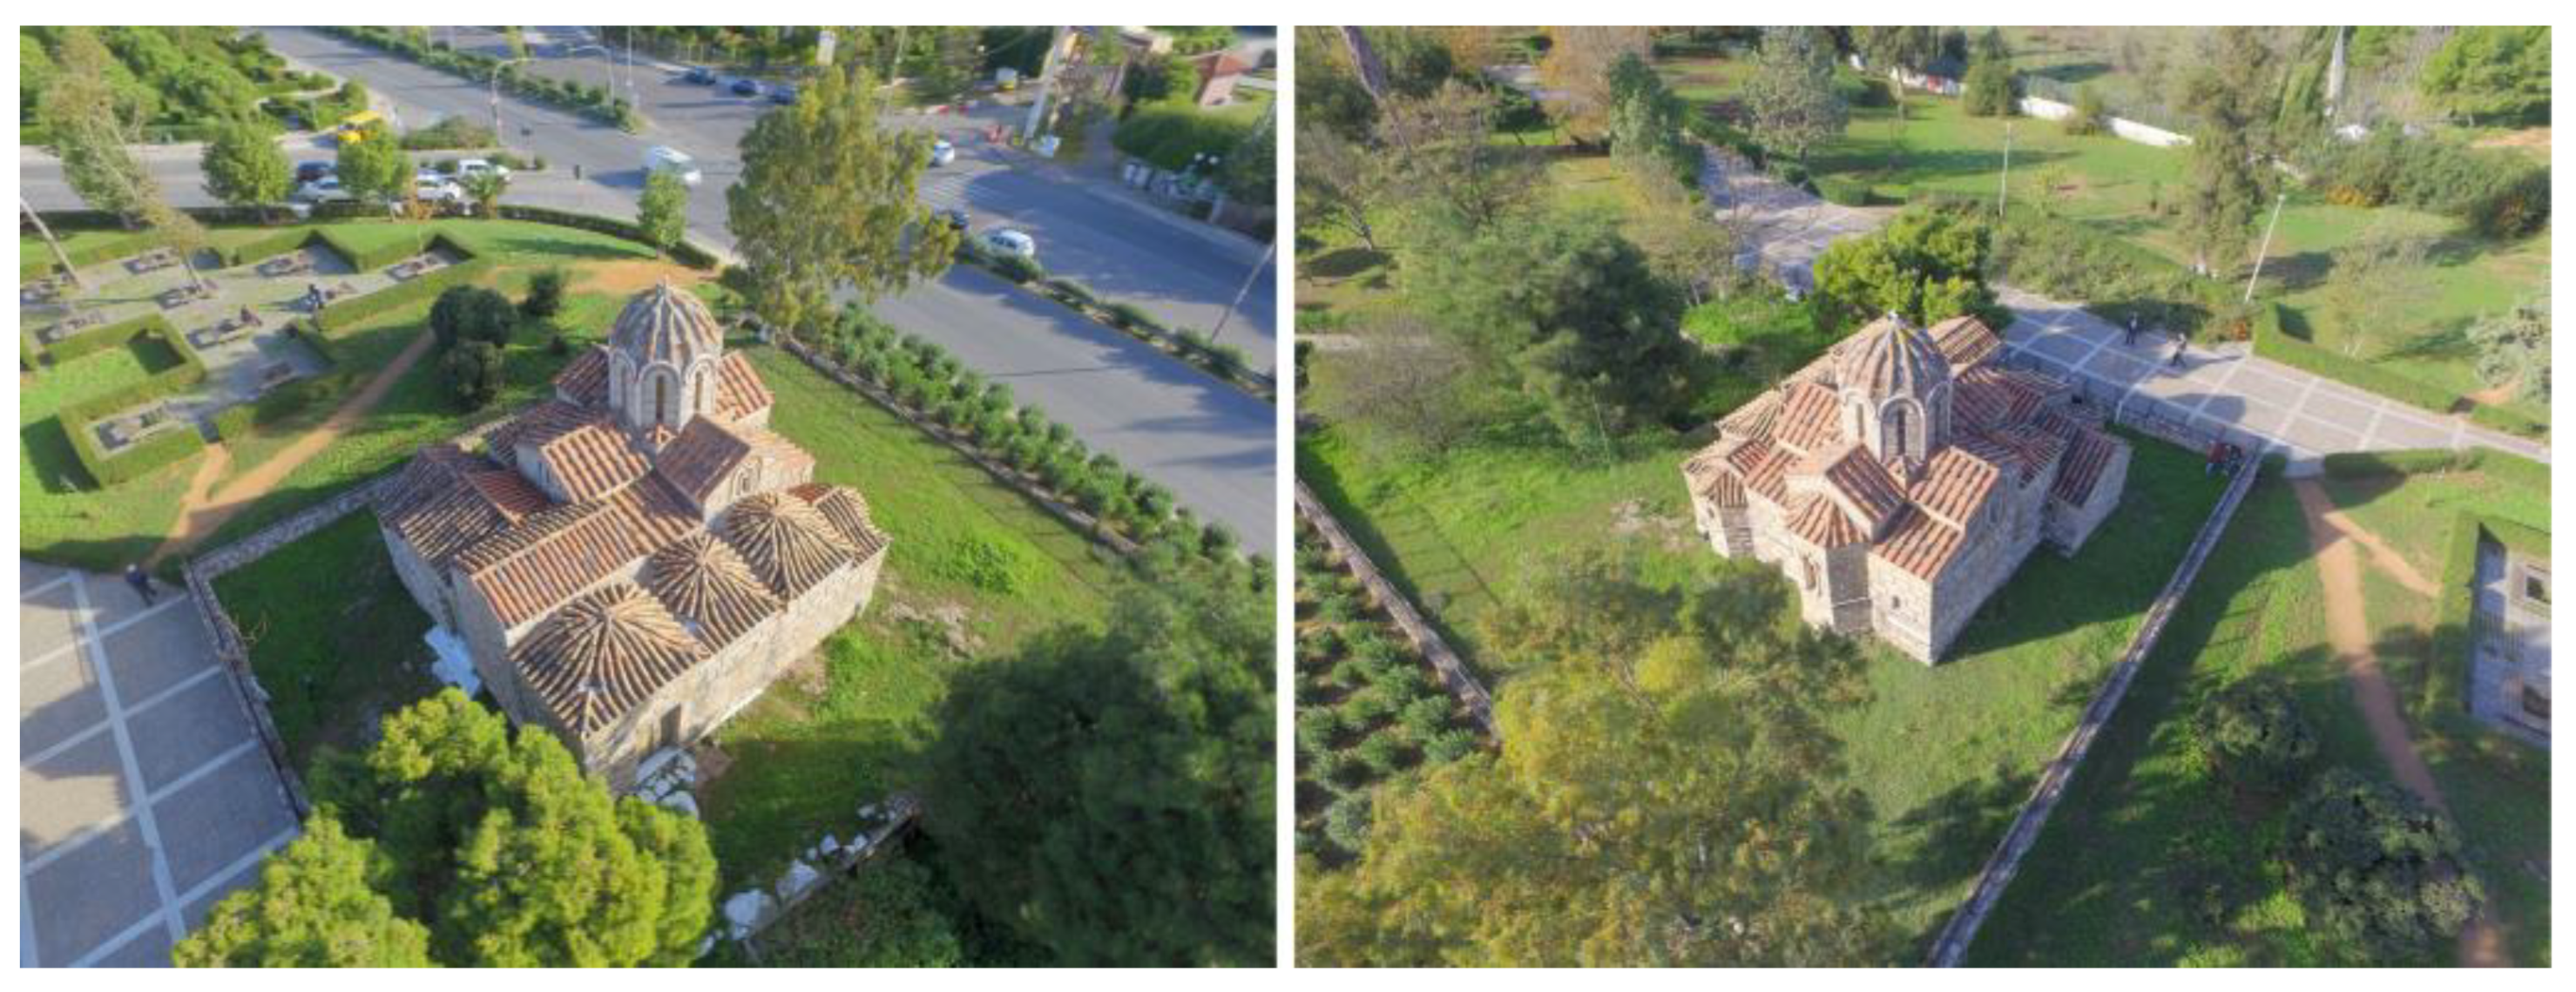
3.1. Low-Altitude Image Data

The dataset in our low-altitude close-range photogrammetric study consists of 29 UAV-captured oblique images and depicts Omorfokklisia, a 13th-century Byzantine church on the outskirts of Athens, Greece. The UAV platform was a DJI Phantom 3 Professional with a 12 MP camera (pixel size: 1.6 μm; nominal focal length: 3.61 mm). The mean flying height was ~18 m and the camera tilt angle ~45°. A circular flight path in the “point of interest flight mode” was chosen, i.e., the UAV orbited automatically around the object of interest. Figure 1 presents two typical images of the data set, which also show the environment of the monument.

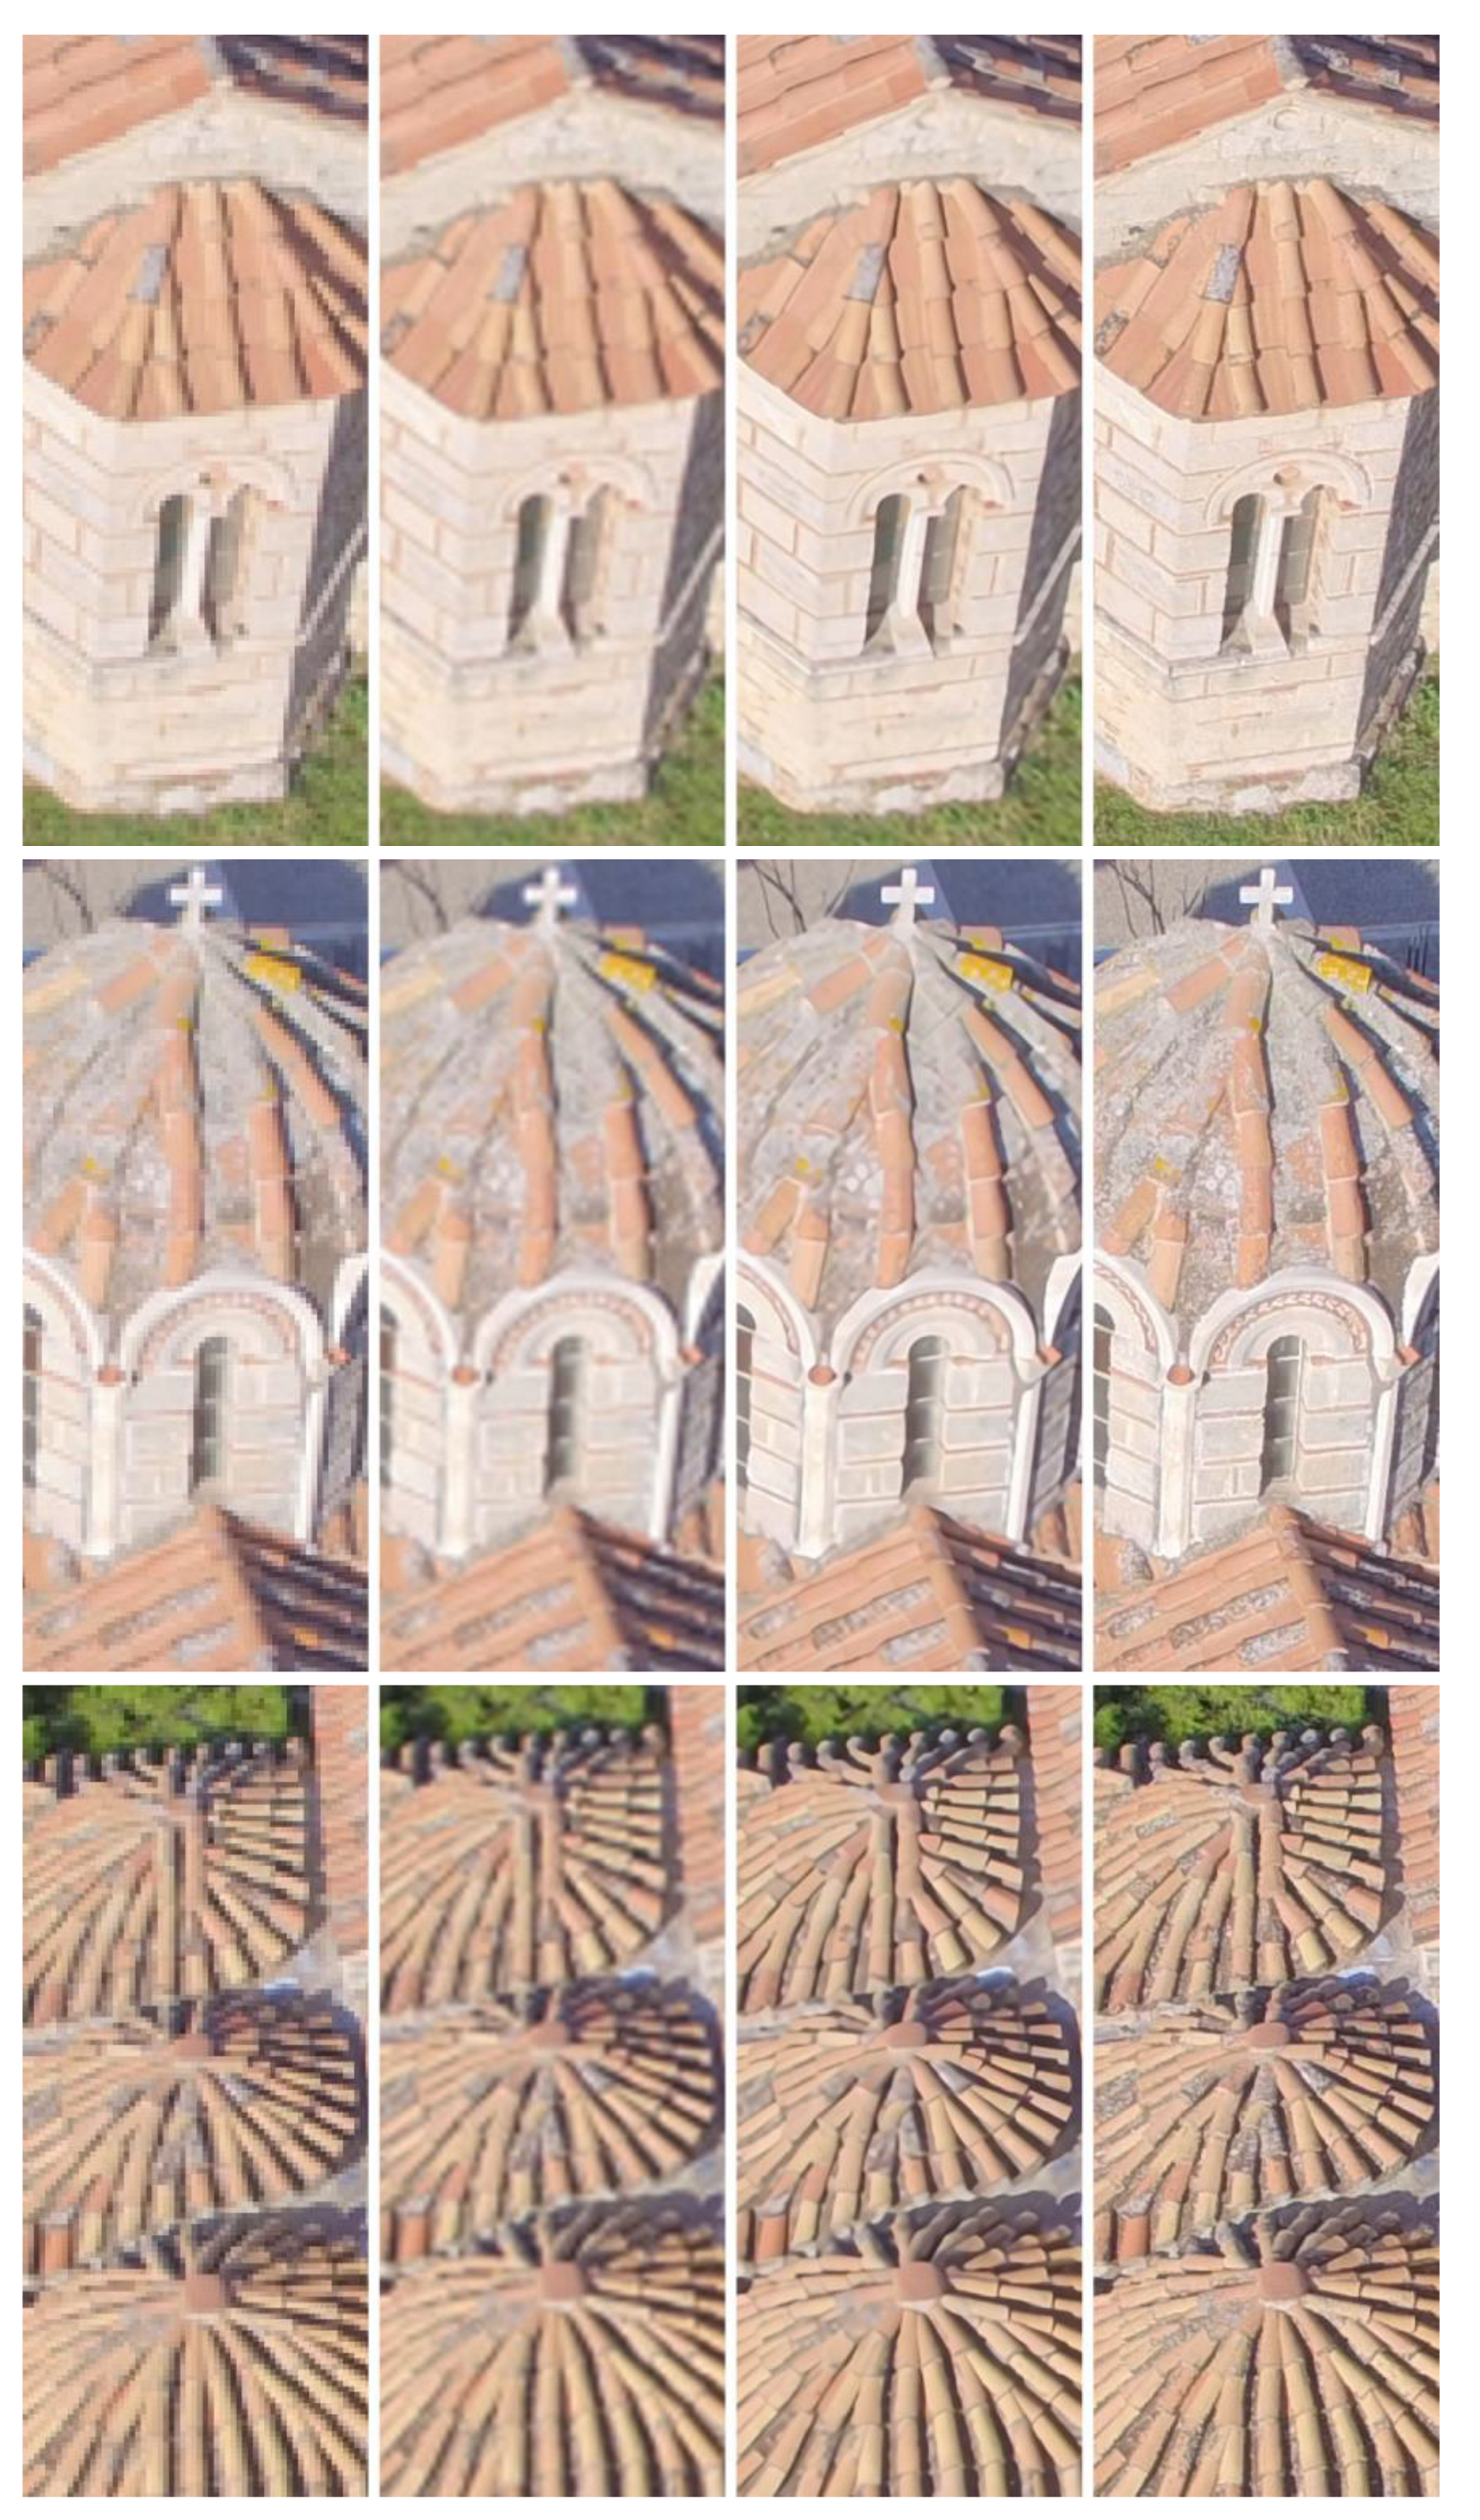
3.2. Deep-Learning Based Super-Resolution Techniques

Besides conventional bicubic image upscaling per factor 4 (used here for the purposes of comparison), the following DL-based SR techniques have been tested in the context of 3D reconstruction. All algorithms have been run on Kaggle [38].
  • RankSRGAN: This SR technique [23] was employed for image resolution enhancement by a factor of 4. The RankSRGAN framework is structured into 3 stages. In stage 1, various SR techniques serve for super-resolving images of public SR datasets. Next, pair-wise images are ranked based on the quality score of a chosen perceptual metric while the corresponding ranking labels are preserved. Stage 2 regards Ranker training. The learned Ranker has a Siamese architecture and should be able to rank images depending on their perceptual scores. In stage 3 the trained Ranker serves as the definition of a rank-content loss for a typical SRGAN to generate visually “pleasing” images.
  • Densely Residual Laplacian Super-Resolution (DRLN): This SR technique [19] also served in this study for SR by a factor of 4. It relies on a modular convolution neural network, where several components that boost the performance are employed. The cascading residual on the residual architecture used facilitates the circulation of low-frequency information so that high and mid-level information can be learned by the network. There are densely linked residual blocks that reprocess the previously computed features, which results in “deep supervision” and learning from high-level complex features. Another significant characteristic of the DRLN technique is Laplacian attention. Via the latter, the crucial features are modeled on multiple scales, whereas the inter- and intra-level dependencies between the feature maps get comprehended.
  • Hybrid Attention Transformer Super-Resolution (HAT): The images were again super-resolved by a factor of 4 via this SR technique [24]. HAT is inspired by the fact that transformer networks can greatly benefit from the self-attention mechanism and exploit long-range information. Shallow feature extraction and deep feature extraction precede the SR reconstruction stage. The HAT transformer jointly utilizes channel attention and self-attention schemes as well as an overlapping cross-attention module. This SR technique aims at activating many more pixels for the reconstruction of HR images.
Finally, in our experiment, the Holistic Attention Network (HAN) [22], in which the feature representation for SR is advanced, has also been used. There are two attention modules jointly working to successfully model informative features among hierarchical layers. The layer attention module learns the weights for hierarchical features by considering correlations of multi-scale layers, channels, and positions, while a channel-spatial attention module comprehends the channel and spatial interdependencies of features in each layer. However, the HAN technique needs input images with an equal number of rows and columns, which is not the case here. It has been tested in other experiments with satisfactory performance, but no results can be shown in this work.

3.3. SfM/MVS Tool

Several alternative software tools are currently available to end-users for the photogrammetric generation of complex 3D models from unordered imagery. Although most of them are based on implementing the standard SfM procedure, they demonstrate variations in terms of user-friendliness and interactivity, acquisition cost (open-source or commercial software), level of customization, and overall processing time. Some of the most commonly used open-source SfM software options include COLMAP [39] and Meshroom [40]. In the commercial market, on the other hand, the tools ContextCapture [41], Agisoft Metashape [26], RealityCapture [42], and Pix4DMapper [43] are some of the dominant players. For the 3D reconstruction stage in the present contribution, the photogrammetric 3D reconstruction pipeline of Agisoft Metashape was employed due to its wide popularity (particularly among non-experts in photogrammetry) in both the remote sensing and the cultural heritage communities as well as its ease of use. Note that this software is also available for use under an academic license.
It may be mentioned that the Cascade Cost Volume Multi View Stereo CasMVSNet [33,34], a DL based algorithm for MVS reconstruction, has also been experimented with; regrettably, it ran out of memory when asked to process the HR images.

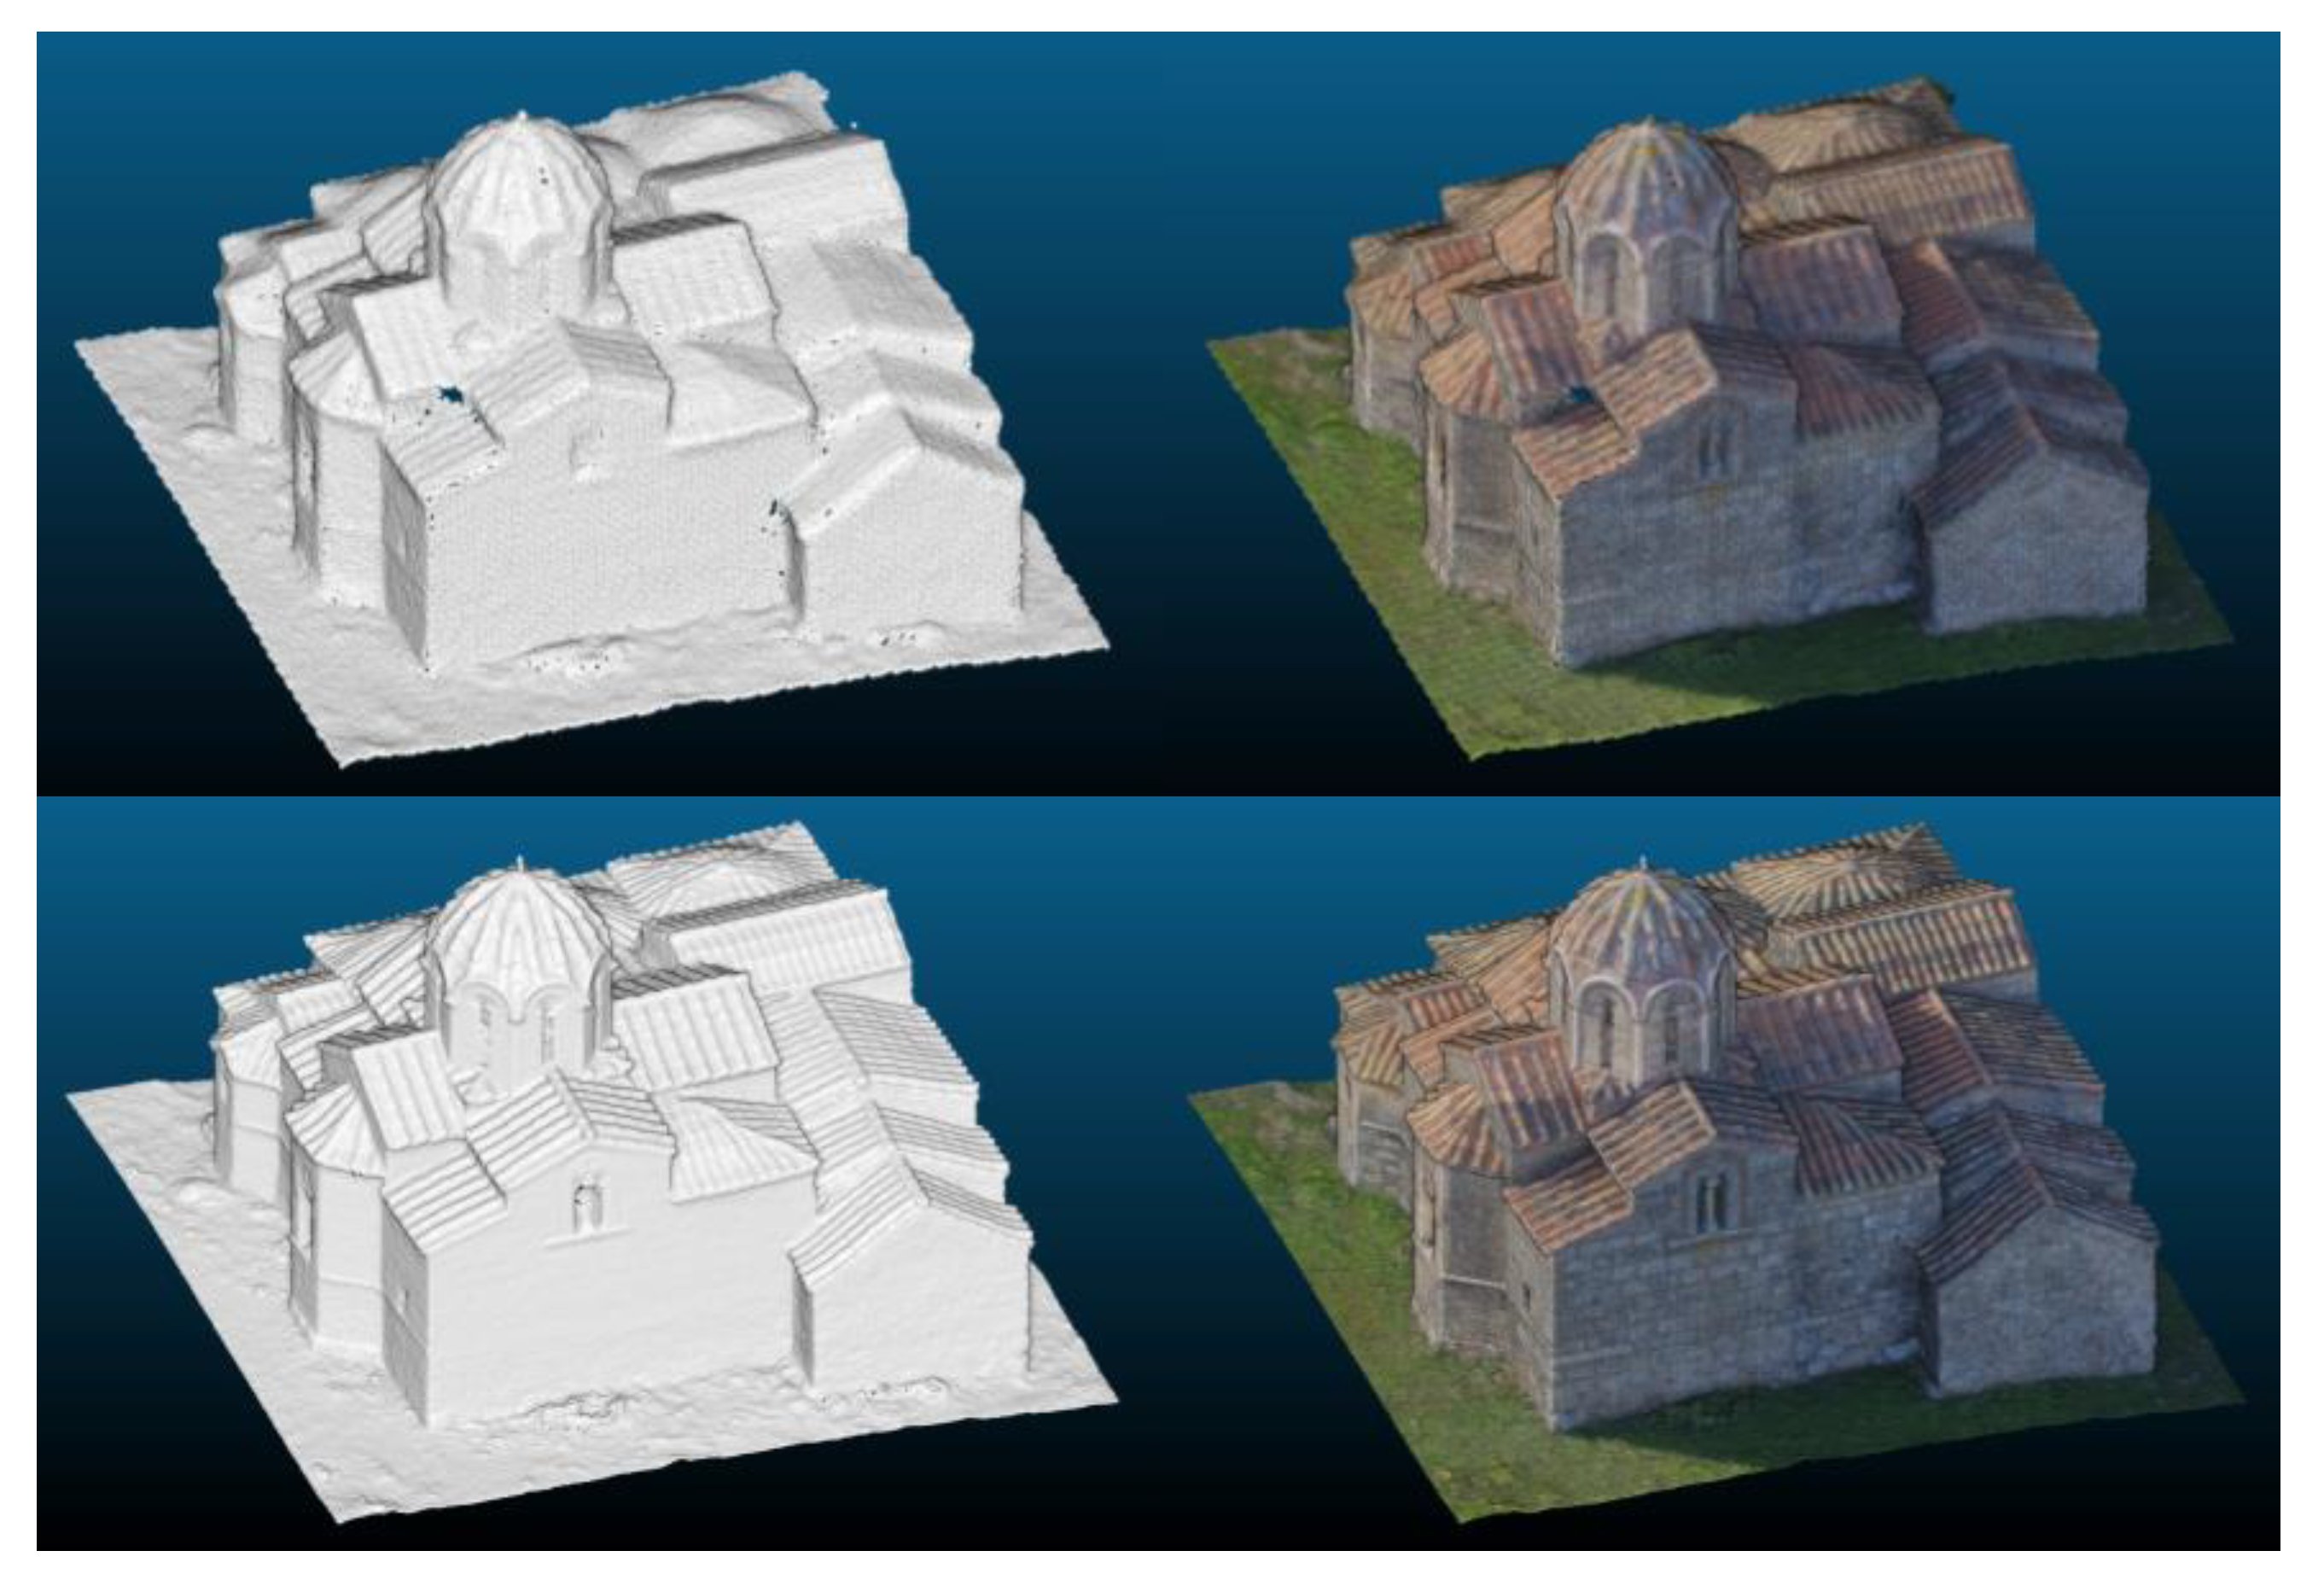
3.4. Methodology for 3D Model Reconstruction

Starting from digital images, Agisoft Metashape produces 3D spatial data in an accurate and fast manner. Characteristic feature functions of this image-based reconstruction software include point extraction and matching, photogrammetric bundle adjustment, dense point cloud editing and classification, DSM generation, georeferenced orthomosaic generation, stereoscopic measurements, 3D model generation and texturing, along with panorama stitching.
Similar to other publications [13,25], bicubic downscaling per a factor of 4 has been applied to the original HR images to generate their LR counterparts. Then, the three mentioned SR tools RankSRGAN, DRLN, and HAT [19,23,24] were used to bring these LR images back to the original spatial resolution, thus producing the super-resolved (SR) images; for comparison purposes, bicubic interpolation was also applied for upsampling the LR images by a factor of 4. In Figure 2 typical image patches are seen.
The super-resolved image has a clearly improved quality (edges have been enhanced, yet poorly textured areas have been somewhat “flattened” compared to the HR images). No discernible SR-induced artefacts are to be observed.
The original HR images were then input into the Agisoft tool for full self-calibrating bundle adjustment (estimation of interior and exterior camera orientations) and 3D reconstruction. The resulting HR 3D model served as the reference model in comparisons. Next, SR 3D models were generated from the SR images, along with a 3D model from the bicubically upscaled images; finally, the LR images produced the low-resolution 3D model. All high-precision reconstruction processes in Agisoft were performed with the same parameters. In summary, the following six models were generated:
(a)
one model from the original 3000 × 4000 high-resolution images (HR)
(b)
one model from the downsampled 750 × 1000 low-resolution images (LR)
(c)
one model from the bicubically upsampled 3000 × 4000 low-resolution images (BU)
(d)
three models from the super-resolved 3000 × 4000 low-resolution images (SR).

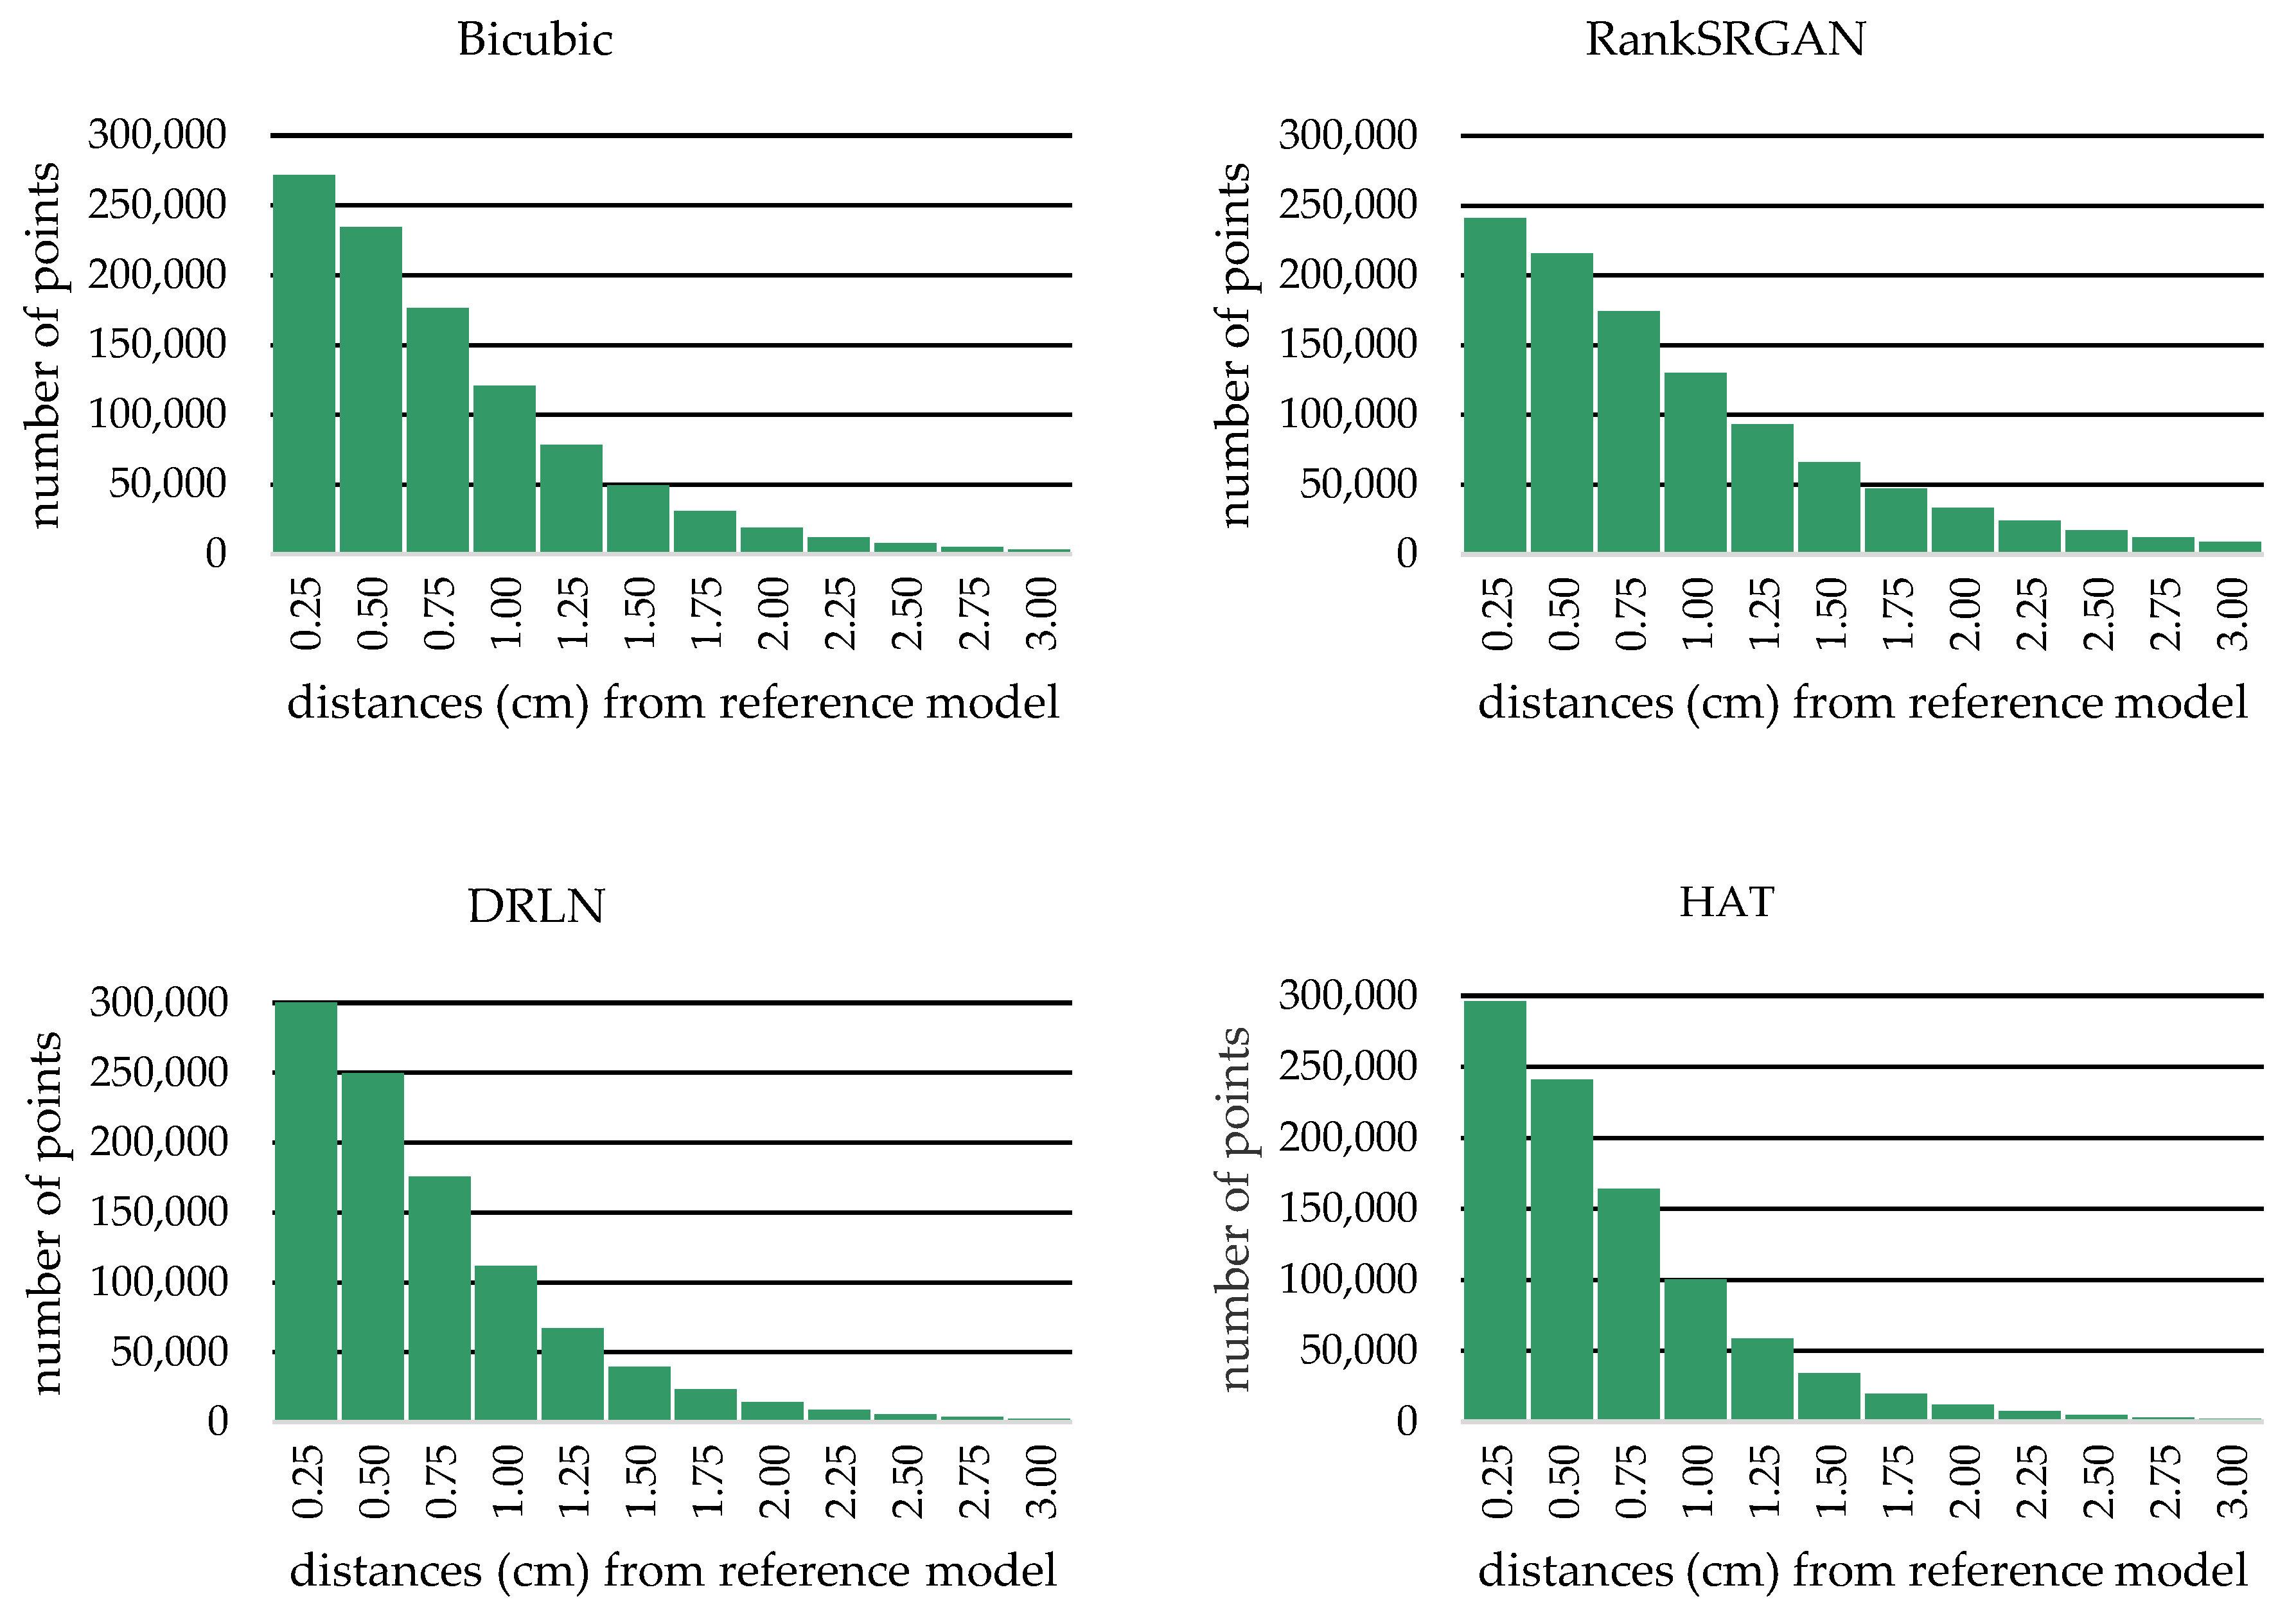
3.5. Criteria for the Comparison of Point Clouds

The evaluation of the similarity between point clouds has generally two distinct steps: the registration of the clouds into the same reference (geodetic) system; and the comparison itself. The objective of registration is basically to calculate the 6-parameter rigid (translation and rotation) or the 7-parameter similarity (plus uniform scaling) 3D transformation for point clouds of arbitrary initial position in order to express them in a common coordinate system. In general, the registration step includes, in turn, two distinct steps: coarse registration (initialisation); and registration refinement.
The alternatives for point cloud registration have been extensively reviewed in the recent literature [44,45,46,47,48,49], particularly in the context of photogrammetric and LiDAR 3D reconstruction. A large part of the reviewed research is dedicated to the automatic establishment of distinctive feature point correspondences for initializing registration, among which DL-based approaches are being currently investigated. In our case, however, initialisation presents no problem since ground control points (GCPs) have been used, which additionally gives to all 3D models a common scale. Alternatively, one could use the GPS information for the location of camera stations; or else (since in our case the corresponding images of the different image sets share the same exterior camera orientation) one could simply transform these orientations into a common reference system.
On the other hand, a substantial part of research on point cloud registration addresses the general case of “non-cooperative” datasets of point clouds stemming from different sources, where the registration task may face varying levels of noise and types of outliers, considerable scaling differences, very different point densities, and only partially overlapping 3D data. In cases (like here), however, of point clouds from the same source, with equal point density (excepting the low-resolution 3D model), no scaling issues, total overlap, similar levels of noise, and good initial registration, methods based on the ICP (Iterative Closest Point) registration algorithm [50,51] are generally expected to perform well [46,49,50]. Furthermore, considering 3D rigid transformations (rotation plus translation), the transformation which minimizes the total Euclidean distance between all point correspondences is usually regarded as being optimal [48].
Coming, finally, to the comparison itself between registered point clouds and the evaluation of their quality, several different approaches have been reviewed in the context of aerial photogrammetry and laser scanning [52,53]. Both these reviews conclude that, among other possible metrics, in such applications, the most popular and representative evaluation option for cloud-to-cloud comparisons and noise evaluation appears to be the so-called point-to-plane approach (see also [54]). This means that the evaluation measure for the difference between point clouds is the distance of a reconstructed point from the reference surface, which is modelled locally by fitting a mathematical primitive (in this case a plane) on the nearest point and its immediate neighbourhood.

3.6. Comparison of Point Clouds

Pairwise comparisons of the dense 3D point clouds were thus performed, namely the LR model, the BU model, and the three SR models were each compared against the reference HR model. Based on the above considerations, we used the popular 3D point cloud processing software CloudCompare [55], which allows for the calculation of distances between “corresponding” cloud points by means of the ICP algorithm. For each point of a cloud, its corresponding point was determined here as its projection on the plane fitted to its 6 closest points of the other cloud.
Following [56,57], reconstructions were evaluated in terms of precision p and recall (completeness) r over four distance thresholds t: 0.5, 1, 2, and 3 cm. Completeness is generally defined as the percentage of ground truth points (here: those of the reference model) for which the distance to their corresponding (as defined above) point in the reconstructed cloud is below the selected evaluation threshold. Precision (sometimes also referred to as accuracy), on the other hand, is defined as the percentage of reconstructed points whose distance from their corresponding (as defined above) ground truth points falls within the selected threshold.
Thus, precision quantifies the metric quality of the reconstruction: how close are the reconstructed points to ground truth; recall, in turn, quantifies the completeness of reconstruction: to which extent the ground-truth points are covered [56]. Obviously, the properties of precision and recall (completeness) are both crucial for assessing quality of reconstructions. Hence, they are often combined in the F-score, which represents a summary quantitative measure, being the harmonic mean of the precision p and recall r values: F = 2 × (p × r)/(p + r). The following Tables concentrate all values of p(t), r(t) and F(t) for the respective evaluation threshold t.

4. Results

4.1. Full 3D Model

The reconstructed 3D models were first cut to keep only the object of interest (in Figure 3 views of two such models are given). The numbers of reconstructed model points are seen in Table 1.
Models from SR images have more vertices than the HR (reference) model; it remains to be seen whether they fit precisely to the latter. The 3D model from the LR images, on the other hand, has of course far fewer points (less than 10%).
Then, each of the reconstructed LR, BU, and SR point clouds were registered onto the properly scaled HR point cloud to allow for comparisons via point-to-plane distances (as previously defined) from it. No threshold for maximum distance values is used in these calculations.
Visualizations of model differences from the HR model are seen in Figure 4. Truncated histograms of differences between the BU and SR models (the differences in the LR model are very large, as already depicted in Figure 4) from the HR model are shown in Figure 5.
Detailed results for the registration of reconstructed-to-reference point clouds (precision p) and of reference-to-reconstructed point clouds (recall r), along with the respective F-score values (F), are seen in Table 2. The number of points with distances from the reference model smaller than, or equal to, four selected evaluation thresholds t are presented. Results will be evaluated in the next section.

4.2. Model Segments

Next to the comparison of the 3D models of the entire monument, 3D reconstruction was also investigated in different individual model segments. In the mutual registration of the full (all-around) models, possible misalignments originating in the SfM step (errors of image interior/exterior orientation in bundle adjustment) may be reflected in stronger local surface deviations. The main purpose of this paper is to evaluate the effectiveness of different SR techniques by studying their impact on the multi-view reconstruction procedure rather than on the SfM step. Although of course the steps of SfM (sparse matching) and 3D reconstruction (dense matching) cannot be totally decoupled from each other, an independent registration of segments of the reconstructed 3D models to their reference counterparts might possibly mitigate the impact of such misalignments. The issue of SfM-induced 3D reconstruction problems will be discussed in the next section.
Thus, the same comparisons were made for the three monument segments A, B, and C seen in Figure 6. These represent three viewing directions, namely a top view (a complex of domes and slanted tile roofs) and two different side views (which mainly include planar surfaces but also tile roofs). As in the preceding section, Table 3, Table 4 and Table 5 concentrate the respective information from all segment model comparisons regarding the percentages of calculated distance values for the same evaluation thresholds.

5. Discussion

The results of the previous section show that, as expected, LR images are by far superseded by both BU and SR methods regarding both the number of points and precision/recall performance. Although bicubic interpolation offers substantial improvement versus LR images, it was expected that it would be outperformed by RankSRGAN; in this particular investigation, however, the bicubic interpolation appears to be clearly superior over this SR tool. The other two SR approaches (DRLN and HAT) gave the best results, with similarly high precision and recall percentages, thus appearing to be very efficient as regards both model accuracy and completeness. In fact, in all cases, less than 4% of all tested points differed by more than 2 cm from their expected position, and less than 1% by more than 3 cm. An impression given by Figure 4 is that DRLN gives the best outcome; yet the tabulated results revealed that HAT consistently gives (marginally) better p, r, and F values. In fact, both methods appear here to be equivalent in improving 3D reconstruction when starting with LR images. Furthermore, DRLN and HAT upscaling produced more reconstructed 3D points than the original HR images (namely by 11.5% and 4%, respectively), which however appear to conform with the used reference surface.
Of course, the final result of 3D reconstruction pipelines carries the impact of multiple intermediate steps; error propagation through them is a topic not fully mastered in photogrammetry, as rightly remarked in [25]. In typical cases, for instance, sparse matching (SfM) and dense matching (MVS) errors are intertwined in an almost inseparable way; hence, it is difficult in our case to separately assess the impact of SR tools on each individual step. The study of local similarity measures along epipolar lines, as in [25], may indeed give a picture for the performance of SR tools in stereo matching (although, in the general case, the positions of epipolar lines themselves have already been affected by bundle adjustment). But when more overlapping views (and thus more homologous epipolar lines) are available, the situation is far more complicated, the more so since outlying local contributions of individual images can be in this case effectively discarded.
On the other hand, a straightforward comparison of the values of image orientation parameters with those from a different solution may be an indication of their actual closeness; this led in [13] to the conclusion that interior and exterior imaging geometry could be accurately retrieved from SR image sets. These parameters, however, may be strongly intercorrelated (especially in geometrically weak image networks) and, if necessary, call for more thorough investigations. In any case, strong imaging configurations are needed in projects where accuracy is a central issue.
Indeed, the robustness of a bundle adjustment heavily depends on image network geometry; for instance, image tilts and cross-flights (which allow significant image roll angles) are generally desirable. Unlike typical networks of vertical images mostly used in publications on SR-based 3D reconstruction, a strong geometry has been adopted here, based on oblique UAV imagery pointed towards the object of interest, which guarantees high numbers of image ray intersections in 3D space. It might be partly attributed to this fact that our results for the full 3D model are similar to those for the model segments.

6. Conclusions

Deep-learning-based image SR techniques have been proven as a powerful means for enhancing image spatial resolution, visual quality, and detail. Our work shows that it can also contribute to improving 3D scene reconstruction. Corroborating the results of other relevant publications (based on satellite or vertical UAV images), the present study, using low-altitude oblique UAV images and pre-trained SR tools, clearly indicated that state-of-the-art photogrammetric 3D reconstruction can give improved results by exploiting the increased image spatial resolution thus provided. Two of the three SR tools led to high and almost equivalent accuracy and completeness scores in 3D reconstruction when compared with models from images of original high resolution.
Future work includes experimentation with results from model retraining; evaluation of different imaging geometries for SR-based 3D reconstruction; also, research regarding the possibility of isolating the effects of SR techniques on the basic steps of a SfM/MVS pipeline (for sparse point extraction and matching).
As in most relevant publications, the low-resolution images here were not original images but bicubically downscaled versions of the originals, which might introduce a certain bias in the comparisons. An alternative would be the employment of different imaging distances, as in [12], to provide LR and HR data. But this also presents problems since such images are not directly comparable regarding 3D reconstruction due to their different image perspectives. Thus, we also intend to perform tests with images acquired with different resolutions but under similar geometric conditions, namely from equal imaging distances and with the same camera tilts.

Author Contributions

Conceptualization, A.P., L.G. and E.P.; methodology, A.P. and L.G.; software, A.P., L.G. and L.R.; validation, E.C. and L.R.; formal analysis, A.P., L.G., E.P. and G.K.; investigation, A.P., L.G. and A.E.S.; resources, A.E.S. and E.C.; data curation, A.P. and L.G.; writing—original draft preparation, A.P.; writing—review & editing, E.P. and G.K.; visualization, A.P. and L.G.; project administration, L.G. All authors have read and agreed to the published version of the manuscript.

Funding

This research received no external funding.

Institutional Review Board Statement

Not applicable.

Informed Consent Statement

Not applicable.

Data Availability Statement

Not applicable.

Conflicts of Interest

The authors declare no conflict of interest.

References

  1. Szeliski, R. Computer Vision: Algorithms and Applications, 2nd ed.; University of Washington: Seattle, WA, USA, 2022; Available online: https://szeliski.org/Book (accessed on 26 September 2022).
  2. Luhmann, T.; Robson, S.; Kyle, S.; Harley, I. Close Range Photogrammetry. Principles, Techniques and Applications; Whittles Publishing: Dunbeath, UK, 2011. [Google Scholar]
  3. James, M.R.; Chandler, J.H.; Eltner, A.; Fraser, C.; Miller, P.E.; Mills, J.P.; Noble, T.; Robson, S.; Lane, S.N. Guidelines on the Use of Structure-from-Motion Photogrammetry in Geomorphic Research. Earth Surf. Process. Landf. 2019, 44, 2081–2084. [Google Scholar] [CrossRef]
  4. Gerke, M. Developments in UAV-Photogrammetry. J. Digit. Landsc. Archit. 2018, 3, 262–272. [Google Scholar]
  5. Berra, E.F.; Peppa, M.V. Advances and Challenges of UAV SfM MVS Photogrammetry and Remote Sensing: Short Review. In The International Archives of the Photogrammetry, Remote Sensing and Spatial Information Sciences, Proceedings of the IEEE Latin American GRSS & ISPRS Remote Sensing Conference (LAGIRS 2020), Santiago, Chile, 22–26 March 2020; IEEE: Piscataway, NJ, USA, 2020; Volume XLII-3/W12, pp. 267–272. [Google Scholar]
  6. Campana, S. Drones in Archaeology. State-of-the-art and Future Perspectives. Archaeol. Prospec. 2017, 24, 275–296. [Google Scholar] [CrossRef]
  7. Pepe, M.; Alfio, V.S.; Costantino, D. UAV Platforms and the SfM-MVS Approach in the 3D Surveys and Modelling: A Review in the Cultural Heritage Field. Appl. Sci. 2022, 12, 12886. [Google Scholar] [CrossRef]
  8. Ran, Q.; Xu, X.; Zhao, S.; Li, W.; Du, Q. Remote sensing images super-resolution with deep convolution networks. Multimed. Tools Appl. 2020, 79, 8985–9001. [Google Scholar] [CrossRef]
  9. Shermeyer, J.; Van Etten, A. The effects of super-resolution on object detection performance in satellite imagery. In Proceedings of the 2019 IEEE/CVF Conference on Computer Vision and Pattern Recognition Workshops, Long Beach, CA, USA, 16–17 June 2019. [Google Scholar]
  10. Panagiotopoulou, A.; Bratsolis, E.; Grammatikopoulos, L.; Petsa, E.; Charou, E.; Poirazidis, K.; Martinis, A.; Madamopoulos, N. Sentinel-2 images at 2.5 m spatial resolution via deep learning: A case study in Zakynthos. In Proceedings of the 2022 IEEE 14th Image, Video, and Multidimensional Signal Processing Workshop (IVMSP 2022), Nafplio, Greece, 26–29 June 2022. [Google Scholar]
  11. Lomurno, E.; Romanoni, A.; Matteucci, M. Improving multi-view stereo via super-resolution. In Image Analysis and Processing—Proceedings of the 21st International Conference, Lecce, Italy, 23–27 May 2022; Sclaroff, S., Distante, C., Leo, M., Farinella, G.M., Tombari, F., Eds.; Lecture Notes in Computer Science 13232; Springer: Cham, Switzerland, 2022. [Google Scholar] [CrossRef]
  12. Burdziakowski, P. Increasing the geometrical and interpretation quality of unmanned aerial vehicle photogrammetry products using super-resolution algorithms. Remote Sens. 2020, 12, 810. [Google Scholar] [CrossRef] [Green Version]
  13. Pashaei, M.; Starek, M.J.; Kamangir, H.; Berryhill, J. Deep learning-based single image super-resolution: An investigation for dense scene reconstruction with UAS photogrammetry. Remote Sens. 2020, 12, 1757. [Google Scholar] [CrossRef]
  14. Zhang, Y.; Zheng, Z.; Luo, Y.; Zhang, Y.; Wu, J.; Peng, Z. A CNN-based subpixel level DSM generation approach via single image super-resolution. Photogramm. Eng. Remote Sens. 2019, 85, 765–775. [Google Scholar] [CrossRef]
  15. Zhu, X.X.; Tuia, D.; Mou, L.; Xia, G.-S.; Zhang, L.; Xu, F. Deep learning in remote sensing: A comprehensive review and list of resources. IEEE Trans. Geosci. Remote Sens. 2017, 5, 8–36. [Google Scholar] [CrossRef] [Green Version]
  16. Wenming, Y.; Zhang, X.; Tian, Y.; Wang, W.; Xue, J.-H.; Liao, Q. Deep learning for single image SR: A brief overview. IEEE Trans. Multimed. 2019, 99, 3106–3121. [Google Scholar]
  17. Shamsolmoali, P.; Emre Celebi, M.; Wang, R. Deep learning approaches for real-time image super-resolution. Neural Comput. Appl. 2020, 32, 14519–14520. [Google Scholar] [CrossRef]
  18. Panagiotopoulou, A.; Grammatikopoulos, L.; Kalousi, G.; Charou, E. Sentinel-2 and SPOT-7 images in machine learning frameworks for super-resolution. In Pattern Recognition, ICPR International Workshops and Challenges, Virtual Event, 10–15 January 2021; Lecture Notes in Computer Science 12667; Del Bimbo, A., Cucchiara, R., Sclaroff, S., Farinella, G.M., Mei, T., Bertini, M., Escalante, H.J., Vezzani, R., Eds.; Springer: Cham, Switzerland, 2021. [Google Scholar]
  19. Anwar, S.; Barnes, N. Densely residual Laplacian super-resolution. IEEE Trans. Pattern Anal. Mach. Intell. 2022, 44, 1192–1204. [Google Scholar] [CrossRef]
  20. Dong, R.; Zhang, L.; Fu, H. RRSGAN: Reference-based super-resolution for remote sensing image. IEEE Trans. Geosci. Remote. Sens. 2022, 60, 5601117. [Google Scholar] [CrossRef]
  21. Islam, M.J.; SakibEnan, S.; Luo, P.; Sattar, J. Underwater image super-resolution using deep residual multipliers. In Proceedings of the 2020 IEEE International Conference on Robotics and Automation (ICRA), Paris, France, 15 September 2020. [Google Scholar]
  22. Niu, B.; Wen, W.; Ren, W.; Zhang, X.; Yang, L.; Wang, S.; Zhang, K.; Cao, X.; Shen, H. Single image super-resolution via a holistic attention network. In Computer Vision—16th European Conference (ECCV 2020), Glasgow, UK, 23–28 August 2020; Lecture Notes in Computer Science 12357; Vedaldi, A., Bischof, H., Brox, T., Frahm, J.M., Eds.; Springer: Cham, Switzerland, 2020. [Google Scholar] [CrossRef]
  23. Zhang, W.; Liu, Y.; Dong, C.; Qiao, Y. RankSRGAN: Generative adversarial networks with ranker for image super-resolution. In Proceedings of the 2019 IEEE/CVF International Conference on Computer Vision (ICCV), Seoul, Republic of Korea, 27 February 2020. [Google Scholar]
  24. Chen, X.; Wang, X.; Zhou, J.; Dong, C. Activating more pixels in image super-resolution transformer. arXiv 2022, arXiv:2205.04437v2. [Google Scholar]
  25. Imperatore, N.; Dumas, L. Contribution of super resolution to 3D reconstruction from pairs of satellite images. In ISPRS Annals of the Photogrammetry, Remote Sensing and Spatial Information Sciences: Proceedings of the XXIV ISPRS Congress (2022 edition), Nice, France, 6–11 June 2022; International Society for Photogrammetry and Remote Sensing (ISPRS): Hannover, Germany, 2022; Volume V-2-2022, pp. 61–68. [Google Scholar]
  26. Agisoft Metashape. Available online: https://www.agisoft.com (accessed on 20 November 2022).
  27. Inzerillo, L.; Acuto, F.; Di Mino, G.; Uddin, M.Z. Super-resolution images methodology applied to UAV datasets to road pavement monitoring. Drones 2022, 6, 171. [Google Scholar] [CrossRef]
  28. Inzerillo, L. Super-resolution images on mobile smartphone aimed at 3D modeling. In The International Archives of the Photogrammetry, Remote Sensing and Spatial Information Sciences: Proceedings of the 9th International Workshop 3D-ARCH “3D Virtual Reconstruction and Visualization of Complex Architectures”, Mantua, Italy, 2–4 March 2022; Politecnico di Milano: Milan, Italy, 2022; Volume XLVI-2/W1-2022, pp. 259–266. [Google Scholar]
  29. Zhang, Y.; Tian, Y.; Kong, Y.; Zhong, B.; Fu, Y. Residual dense network for image super-resolution. In Proceedings of the IEEE/CVF Conference on Computer Vision and Pattern Recognition (CVPR 2018), Salt Lake City, UT, USA, 18–23 June 2018; pp. 2472–2481. [Google Scholar]
  30. Wang, X.; Yu, K.; Wu, S.; Gu, J.; Liu, Y.; Dong, C.; Qiao, Y.; Change Loy, C. Esrgan: Enhanced super-resolution generative adversarial networks. In Proceedings of the European Conference on Computer Vision (ECCV), Munich, Germany, 8–14 September 2018; pp. 63–79. [Google Scholar]
  31. Ledig, C.; Theis, L.; Huszár, F.; Caballero, J.; Cunningham, A.; Acosta, A.; Aitken, A.; Tejani, A.; Totz, J.; Wang, Z.; et al. Photo-realistic single image super-resolution using a generative adversarial network. In Proceedings of the 30th IEEE Conference on Computer Vision and Pattern Recognition (CVPR 2017), Honolulu, HI, USA, 21–26 July 2017; pp. 4681–4690. [Google Scholar]
  32. Schönberger, J.L.; Zheng, E.; Frahm, J.-M.; Pollefeys, M. Pixel-wise view selection for unstructured multi-view stereo. In European Conference on Computer Vision (ECCV 2016), Amsterdam, The Netherlands, 11–14 October 2016; Springer: Berlin/Heidelberg, Germany, 2016; pp. 501–518. [Google Scholar]
  33. Yao, Y.; Luo, Z.; Li, S.; Fang, T.; Quan, L. MVSNet: Depth inference for unstructured multi-view stereo. In Proceedings of the European Conference on Computer Vision (ECCV 2018), Munich, Germany, 8–14 September 2018; Lecture Notes in Computer Science 11212; Ferrari, V., Hebert, M., Sminchisescu, C., Weiss, Y., Eds.; Springer: Cham, Switzerland, 2018. [Google Scholar] [CrossRef] [Green Version]
  34. Gu, X.; Fan, Z.; Zhu, S.; Dai, Z.; Tan, F.; Tan, P. Cascade cost volume for high-resolution multi-view stereo and stereo matching. In Proceedings of the 2020 IEEE/CVF Conference on Computer Vision and Pattern Recognition (CVPR), Online/Seattle, WA, USA, 14–19 June 2020. [Google Scholar]
  35. Haris, M.; Shakhnarovich, G.; Ukita, N. Deep back-projection networks for super resolution. In Proceedings of the IEEE Conference on Computer Vision and Pattern Recognition, Salt Lake City, UT, USA, 18–23 June 2018. [Google Scholar]
  36. Li, J.; Gao, W.; Wu, Y. High-quality 3D reconstruction with depth super-resolution and completion. IEEE Access 2019, 7, 19370–19381. [Google Scholar] [CrossRef]
  37. Li, J.; Gao, W.; Wu, Y.; Liu, Y.; Shen, Y. High-quality indoor scene 3D reconstruction with RGB-D cameras: A brief review. Comput. Vis. Media 2022, 8, 369–393. [Google Scholar] [CrossRef]
  38. Kaggle: Your Machine Learning and Data Science Community. Available online: https://www.kaggle.com/ (accessed on 20 November 2022).
  39. Schonberger, J.L.; Frahm, J.M. Structure-from-Motion Revisited. In Proceedings of the IEEE Conference on Computer Vision and Pattern Recognition (CVPR), Las Vegas, NV, USA, 27–30 June 2016; pp. 4104–4113. [Google Scholar]
  40. Griwodz, C.; Gasparini, S.; Calvet, L.; Gurdjos, P.; Castan, F.; Maujean, B.; De Lillo, G.; Lanthony, Y. AliceVision Meshroom: An Open-Source 3D Reconstruction Pipeline. In Proceedings of the 12th ACM Multimedia Systems Conference, Istanbul, Turkey, 28 September–1 October 2021; pp. 241–247. [Google Scholar]
  41. Bentley: ContextCapture. Available online: https://www.bentley.com/software/contextcapture/ (accessed on 19 February 2023).
  42. CapturingReality: RealityCapture. Available online: https://www.capturingreality.com/ (accessed on 19 February 2023).
  43. Pix4D: Pix4DMapper. Available online: https://www.pix4d.com/ (accessed on 19 February 2023).
  44. Cheng, L.; Chen, S.; Liu, X.; Xu, H.; Wu, Y.; Li, M.; Chen, Y. Registration of Laser Scanning Point Clouds: A Review. Sensors 2018, 18, 1641. [Google Scholar] [CrossRef] [Green Version]
  45. Li, L.; Wang, R.; Zhang, X. A Tutorial Review on Point Cloud Registrations: Principle, Classification, Comparison, and Technology Challenges. Hindawi Math. Probl. Eng. 2021, 2021, 9953910. [Google Scholar] [CrossRef]
  46. Huang, X.; Mei, G.; Zhang, J.; Abbas, R. A Comprehensive Survey on Point Cloud Registration. arXiv 2021, arXiv:2103.02690v2. [Google Scholar]
  47. Si, H.; Qiu, J.; Li, Y. A Review of Point Cloud Registration Algorithms for Laser Scanners: Applications in Large-Scale Aircraft Measurement. Appl. Sci. 2022, 12, 10247. [Google Scholar] [CrossRef]
  48. Brightman, N.; Fan, L.; Zhao, Y. Point Cloud Registration: A Mini-Review of Current State, Challenging Issues and Future Directions. AIMS Geosci. 2023, 9, 68–85. [Google Scholar] [CrossRef]
  49. Xu, N.; Qin, R.; Song, S. Point Cloud Registration for LiDAR and Photogrammetric Data: A Critical Synthesis and Performance Analysis on Classic and Deep Learning Algorithms. ISPRS Open J. Photogramm. Remote Sens. 2023, 8, 100032. [Google Scholar] [CrossRef]
  50. Girardeau-Montaut, D.; Roux, M.; Marc, R.; Thibault, G. Change detection on points cloud data acquired with a ground laser scanner. In Proceedings of the ISPRS Workshop, Laser Scanning 2005, Enschede, The Netherlands, 12–14 September 2005. [Google Scholar]
  51. Cignoni, P.; Rocchini, C.; Scopigno, R. Metro: Measuring error on simplified surfaces. Comput. Graph. Forum 1998, 17, 167–174. [Google Scholar] [CrossRef] [Green Version]
  52. Ahmad, F.N.; Yusoff, A.R.; Ismail, Z.; Majid, Z. Comparing the Performance of Point Cloud Registration Methods for Landslide Monitoring Using Mobile Laser Scanning Data. In The International Archives of the Photogrammetry, Remote Sensing and Spatial Information Sciences: International Conference on Geomatics and Geospatial Technology (GGT 2018), Kuala Lumpur, Malaysia, 3–5 September 2018; International Society for Photogrammetry and Remote Sensing (ISPRS): Hannover, Germany, 2018; Volume XLII-4/W9, pp. 11–21. [Google Scholar]
  53. Fretes, H.; Gomez-Redondo, M.; Paiva, E.; Rodas, J.; Gregor, R. A Review of Existing Evaluation Methods for Point Clouds Quality. In Proceedings of the International Workshop on Research, Education and Development on Unmanned Aerial Systems (RED-UAS 2019), Cranfield, UK, 25–27 November 2019; pp. 247–252. [Google Scholar]
  54. Helmholz, P.; Belton, D.; Oliver, N.; Hollick, J.; Woods, A. The Influence of the Point Cloud Comparison Methods on the Verification of Point Clouds Using the Batavia Reconstruction as a Case Study. In Proceedings of the 6th International Congress for Underwater Archaeology, Fremantle, WA, Australia, 28 November–2 December 2020; pp. 370–381. [Google Scholar]
  55. CloudCompare: 3D Point Cloud and Mesh Processing Software. Available online: https://www.cloudcompare.org/ (accessed on 20 November 2022).
  56. Knapitsch, A.; Park, J.; Zhou, Q.-Y.; Koltun, V. Tanks and temples: Benchmarking large-scale scene reconstruction. ACM Trans. Graph. (ToG) 2017, 36, 78. [Google Scholar] [CrossRef]
  57. Schöps, T.; Schönberger, J.L.; Galliani, S.; Sattler, T.; Schindler, K.; Pollefeys, M.; Geiger, A. A multi-view stereo benchmark with high-resolution images and multi-camera videos. In Proceedings of the IEEE Conference on Computer Vision and Pattern Recognition (CVPR), Honolulu, HI, USA, 21–26 July 2017; pp. 2538–2547. [Google Scholar]
Figure 1. Two images of the data set, which show the monument and its direct environment.
Heritage 06 00143 g001
Figure 2. Three patches of the same oblique image. From left to right: low resolution, bicubic upscaling, super resolution (HAT), high resolution (original image).
Heritage 06 00143 g002
Figure 3. Rendered and textured models from images of low (above) and high resolution (below).
Heritage 06 00143 g003
Figure 4. Point cloud colourmaps of the point-to-plane distances (m) from the reference (HR) model and magnified numeric scale. Top: LR model; middle: BU model (left) and RankSRGAN model (right); bottom: DRLN model (left) and HAT model (right).
Heritage 06 00143 g004
Figure 5. Histograms of point-to-plane distances from the reference (HR) model.
Heritage 06 00143 g005
Figure 6. Frontal and isometric views of monument segments A, B and C (from (left) to (right)).
Heritage 06 00143 g006
Table 1. Number of point cloud vertices.
3D ModelsNumber of Vertices
HR (reference)907,917
LR87,844
BU1,020,456
SR RankSRGAN1,091,278
SR DRLN1,012,209
SR HAT951,992
Table 2. Precision (p), Recall (r) and F-score (F) percentage of the calculated distance differences for the full point cloud. Percentage values account for the points with distances which are smaller than, or equal to, the respective evaluation threshold t.
Point CloudEvaluation Threshold t (cm)
0.51.02.03.0
prFprFprFprF
LR from Agisoft15.5213.7914.6130.4027.1328.6757.0651.4954.1377.7672.0974.81
BU49.6246.6248.0878.7475.2876.9796.1794.8995.5298.9998.5698.77
RankSRGAN41.8440.0840.9469.7167.2668.4691.7190.2490.9797.4796.8797.17
DRLN54.3853.0453.7082.8081.3582.0797.1296.8596.9899.1999.1899.18
HAT56.1655.1055.6284.2582.9483.5997.3597.1797.2699.2299.2799.24
Table 3. Precision (p), Recall (r) and F-score (F) percentage of distance values for segment A.
Point CloudEvaluation Threshold t (cm)
0.5 cm1 cm2 cm3 cm
prFprFprFprF
BU44.8841.9243.3575.2571.0373.0895.7294.0394.8798.9598.4098.67
RankSRGAN39.7236.8238.2167.7463.7965.7191.0488.9289.9797.3396.6296.97
DRLN54.4352.5653.4883.1680.9882.0597.2396.7797.0099.2399.1699.19
HAT55.8954.6855.2884.5682.7183.6297.5997.1897.3899.2899.2899.28
Table 4. Precision (p), Recall (r) and F-score (F) percentage of distance values for segment B.
Point CloudEvaluation Threshold t (cm)
0.5 cm1 cm2 cm3 cm
prFprFprFprF
BU50.8347.3749.0480.3875.9378.0996.3295.0995.7099.0598.7898.91
RankSRGAN40.1138.1039.0868.1565.3666.7390.9189.2990.0997.1796.7496.95
DRLN52.8544.8848.5482.1475.7678.8297.0496.0896.5699.2199.1199.16
HAT54.0952.6353.3583.0981.5082.2997.1496.9697.0599.2299.2899.25
Table 5. Precision (p), Recall (r) and F-score (F) percentage of distance values for segment C.
Point CloudEvaluation Threshold t (cm)
0.5 cm1 cm2 cm3 cm
prFprFprFprF
BU43.1947.6245.3074.2777.7075.9595.7796.3696.0698.9799.1899.07
RankSRGAN38.6240.6339.6066.9068.9167.8991.4691.8591.6597.5797.7597.66
DRLN42.2753.9647.4072.3082.9477.2595.1297.5196.3098.8999.4599.17
HAT48.4054.9451.4678.6884.1581.3296.6297.7897.2099.1399.4499.28
Disclaimer/Publisher’s Note: The statements, opinions and data contained in all publications are solely those of the individual author(s) and contributor(s) and not of MDPI and/or the editor(s). MDPI and/or the editor(s) disclaim responsibility for any injury to people or property resulting from any ideas, methods, instructions or products referred to in the content.

