
Analysis of the Current Status of Sensors and HBIM Integration: A Review Based on Bibliometric Analysis


Centro de Investigación en Arquitectura, Patrimonio y Gestión para el Desarrollo Sostenible (PEGASO), Universitat Politècnica de València, 46022 Valencia, Spain
*
Author to whom correspondence should be addressed.
Heritage 2024, 7(4), 2071-2087; https://doi.org/10.3390/heritage7040098
Submission received: 2 February 2024
/
Revised: 26 March 2024
/
Accepted: 30 March 2024
/
Published: 3 April 2024
Abstract
:This article presents a bibliometric analysis conducted on the implementation of sensor-extracted data in the context of Historical Building Information Modeling (HBIM) with a focus on the conservation of heritage buildings. The study utilized recognized databases, namely, Web of Science (WoS) and Scopus. A bibliometric analysis methodology was applied, employing the VOSviewer 1.6.19 software. The results obtained provide a robust overview of the current state and trends in HBIM and sensor research and enabled the identification of emerging trends in the field of preventive conservation. Three promising trends were identified, establishing connections between this field and 4D spatial data management, energy performance, and artificial intelligence. Additionally, relations with climate change were also detected. These trends underscore a significant convergence of technologies and methodologies in the realm of heritage building conservation. The conclusions serve as a valuable contribution to guiding future research in the field of built heritage conservation.
1. Introduction
The conservation of heritage buildings poses a highly complex challenge due to various threats that can affect the integrity of these cultural assets. These challenges include the vulnerability of these structures to natural hazards, their pre-existing conservation conditions, their unique structural and material characteristics, their low energy efficiency, and the effects of climate change, which are becoming increasingly relevant [1]. The control of environmental and climatic factors is extremely delicate, especially when dealing with historic buildings open to tourist visits [2]. Therefore, prompt surveys and damage assessments are essential for their conservation [3].
The conservation of heritage buildings is crucial for the individual and collective identity of a country, in addition to boosting tourism activity. In line with the need to conserve these buildings, the application of structural health monitoring (SHM) systems has experienced a remarkable increase in recent decades [4]. SHM involves observing structures over time with periodic measurements, extracting damage-related features, and statistically analyzing these features to assess the current health of the building and anticipate its future behavior [5]. The implementation of this type of system is not only essential to assess structural performance, but also to provide valuable information to facilitate the planning of cost-effective and sustainable maintenance and retrofit solutions [1].
Nowadays, the documentation, planning, and management of interventions in heritage buildings are increasingly based on the Building Information Modeling (BIM) methodology. The main feature of this methodology is the integration of a three-dimensional graphic model of the quantitative and qualitative information of the objects being modeled, as well as the relationships between them and their links with external documents [6]. This approach consolidates various aspects of the design in a unified digital environment, characterized by a high level of uniformity, especially in its application to historic buildings (HBIM) [7]. The Historical Building Information Modeling (HBIM) methodology stands out for its ability to organize and archive architectural information, encompassing both geometric and specific semantic data [8], as evidenced by Banfi et al. [9], Chiabrando et al. [10], Nieto-Julian et al. [11], and Currà et al. [12]. This is essential to support the decision-making process and streamline workflows in historic building research [3].
Among the data that the HBIM methodology can store and manage are those derived from various monitoring systems aimed at detecting threats to building conservation, as evidenced by O’Shea & Murphy [13], Nagy & Ashraf [14], Moyano et al. [15], and Machete et al. [4]. This integration turns out to be an essential component in achieving an integrated design and efficient management oriented to preventive and proactive maintenance [7] The convergence of HBIM, IoT, and wireless sensor networks is significantly improving the remote sensing capability of data in historic buildings [3]. However, despite the many advantages offered by these digital technologies, significant challenges remain in their practical application. These challenges include sensor overloads, unreliable networks, and problems related to data compression and transmission [1].
In this context, the objective of this paper is to explore the current state of the field of study, trying to identify the most outstanding scientific works that have contributed to this area, to analyze the most influential publications and recognize the leading research groups. Additionally, the paper pursues establishing connections between this topic and the deployment of digital technologies, as well as their relationship with the challenge of climate change.
Ultimately, it is the intention to outline an essential state-of-the-art bibliography for researchers that will foster substantial advances in the development and application of technologies for the conservation of cultural heritage and visitor flow management.
2. Materials and Methods
The bibliometric analysis methodology used in this paper has been successfully employed in other literature review studies related to the field of HBIM and sensors such as those of Vilutiene et al. [16], which deals with BIM for structural analysis; and Li et al. [17], related to studies on visitor carrying capacity; as well as in studies related to the topic such as Zhang & Zou [3], which deals with hotspots and trends related to HBIM; Liu et al. [18], which deals with BIM aimed at tourism sustainability in heritage assets; Hou et al. [19], which deals with digital twins applied to heritage management; and Bulgarelli-Bolaños et al. [20], which deals with the scientific concepts of HBIM and 3D modeling, thus validating its applicability in different research contexts.
To achieve the proposed objectives, this research is structured in five phases: (1) bibliometric data collection; (2) analysis of the obtained data; (3) data evaluation; (4) results; (5) discussion of the results. All these phases lead to a series of conclusions.
2.1. Compilation of Bibliometric Data
To ensure the reliability and authority of the data, two of the most popular and trustworthy international databases, Web of Science (WoS) and Scopus, were utilized. As some documents are shared between both databases, and considering the existence of exclusive documents in each, the decision was made to analyze both for result comparison throughout the process. This approach allowed for verifying points of convergence and divergence in the datasets.
The process of compiling the relevant scientific literature was primarily based on the combination of two sets of keywords using the Boolean operator “AND” applied in the search fields of WoS and Scopus. The first set of keywords included “sensor*”, encompassing various variations such as sensor, sensors, sensorial, sensorization, sensored, sensorized, sensoring, and sensing. The second set consisted of diverse variations of terms related to HBIM, including hbim, h-bim, heritage-bim, heritage bim, historic-bim, historic bim, heritage building information modeling, and historic building information modeling. The Boolean operator “OR” was used to separate the words in each set, allowing the system to consider all possibilities that included the specified words.
Consideration was given to including the word “monitoring” in the first set or in an intermediate set, but the search results encompassed monitoring types that deviated from the topic or overly restricted the number of documents.
By utilizing the initial set of keywords, a comprehensive compilation of various sensor types became feasible, encompassing wireless and fiber optic sensors. These sensors are instrumental in gathering diverse data types, ranging from temperature, pressure, humidity, movement, proximity, and light to vibration and CO2 levels. The amalgamation of the first set of keywords with the second set led to the identification of scientific publications that intricately address both topics simultaneously.
The same conditions were consistently applied whenever possible to retrieve data from WoS and Scopus. At the first filtering level, scientific articles, conference proceedings, and book chapters were exclusively chosen. This reduced the number of documents in WoS from 230 to 217, and in Scopus, from 79 to 69.
At the second filtering level, specific research areas were selected, including remote sensing, imaging science photographic technology, engineering, computer science, architecture, environmental sciences ecology, archaeology, construction building technology, art, instruments instrumentation, arts humanities, other topics, and automation control systems. Following the implementation of this filter, the WoS publications were reduced to 183. In Scopus, where the research area filters differ from WoS, the selected areas were computer science, engineering, environmental sciences, and arts and humanities, resulting in a total of 65 publications. This filter was necessary because the sensor terms were involved in other areas of scientific research that were far removed from the research objective, such as spectroscopy, geology, and biochemistry.
2.2. Analysis of the Obtained Data
The obtained data from both database platforms were exported and subsequently imported into the bibliometric analysis software VOSviewer version 1.6.19. The WoS data were exported in “.txt” format, while the Scopus data were exported in “.csv” format.
As the VOSviewer version 1.6.19 does not facilitate the simultaneous analysis of two databases, a comparative analysis of the WoS and Scopus data was conducted using the same software but independently.
Upon initiating the data processing in the software, the need arose to adjust certain imported file data, as errors and discrepancies were observed in author names, institution names, and keywords. Additionally, similar terms were found to appear separately, leading to substantial distortions in the analysis results.
To conduct these adaptations, two native text files from the VOSviewer software, version 1.6.19, were utilized: the “thesaurus_authors” and “thesaurus_terms” files.
The “thesaurus_authors” file facilitated the grouping of all possible names assigned to the same author, preventing publications where the same author was cited differently from being counted separately.
The “thesaurus_terms” file was duplicated into two distinct files: one for terms related to institutions and another specifically for keywords. The former was necessary to consolidate different forms in which institution names were presented, sometimes abbreviated or in different languages. Specifically, in the case of files generated in the Scopus database, institution names were divided into research groups or centers, causing a separation of all publications related to the same institution.
The second file, pertaining to keywords, was essential for grouping terms in singular or plural, correcting misspelled words, and unifying similar words with the same meaning. This facilitated and simplified the identification of relationships between keywords.
2.3. Data Evaluation
The VOSviewer software, version 1.6.19, organizes the inserted data on its platform as follows:
- Publications, author names, keywords, or other terms are considered “items”.
- The links or connections between these elements are referred to as “links”.
- Each link has a “strength”, represented by a positive numerical value. The higher the value, the stronger the link.
- The elements and links together form a “network”.
- Elements within a network can be grouped into “clusters”, indicating their relationships.
- Elements can have various attributes, such as “weight” and “score” attributes. These attributes are represented by numerical values. An element with a higher weight is considered more important. In the visualization map (tag cloud graphic), elements with higher weights are more prominent than those with lower weights. Score attributes do not necessarily refer to the importance of the element; they can represent, for example, the publication date of an article. These attributes are displayed on the map with colors that can be interpreted on a scale.
- There are also two standard weighting attributes: “links” and “total link strength”. Links indicate the number of connections an element has with other elements, and the total link strength represents the sum of the strength of those connections.
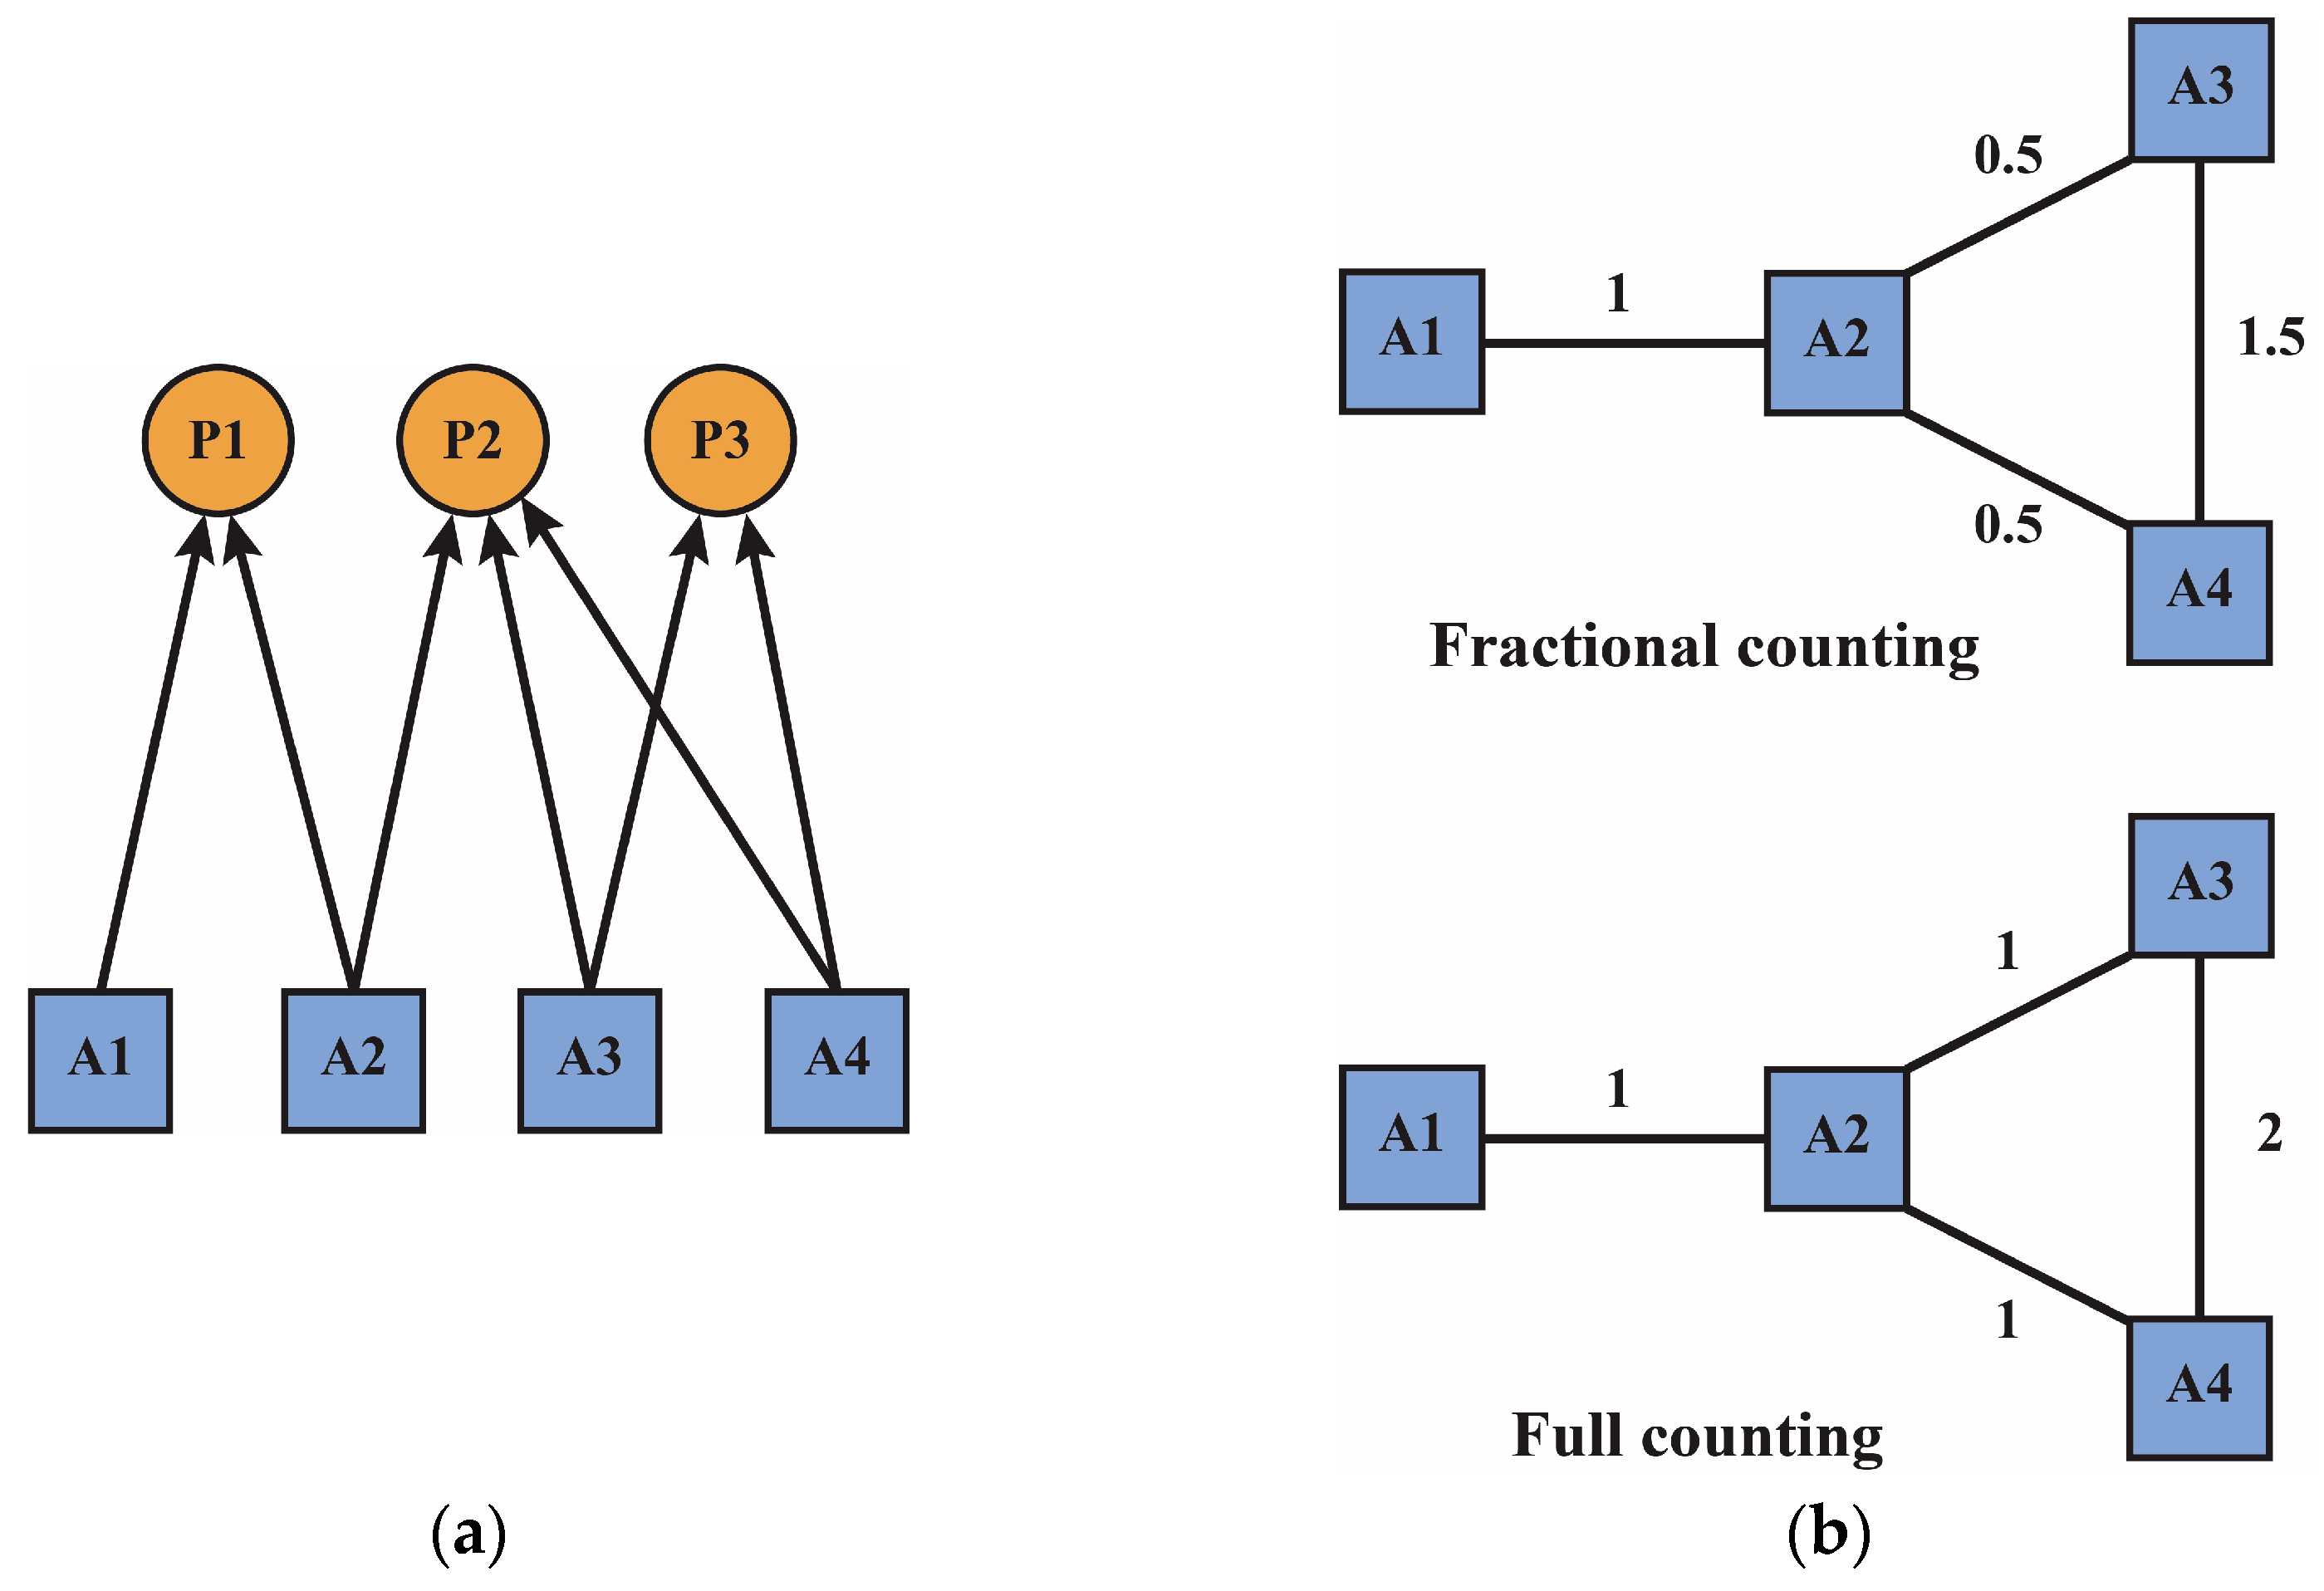
When creating a map based on bibliographic data, VOSviewer version 1.6.19 offers two counting methods: full counting and fractional counting. The main difference between these methods lies in the strength of the links.
In full counting, the strength of the link between two authors is based on the number of documents on which they have co-authorship.
In fractional counting, the strength of a link between authors is determined not only by the number of documents on which they collaborate but also by the total number of authors in each of those documents (Figure 2a,b). The fractional counting method aims to reduce the influence of documents with numerous authors. For this study, the full counting method was exclusively employed [21].
3. Results
VOSviewer version 1.6.19 can analyze compiled data in five distinct ways: citation, co-authorship, co-occurrence, co-citation, or bibliographic coupling. However, this study focused on the analysis and relationships between the first three methods. This choice was driven by the specific nature of our research, where we aimed to emphasize document relationships through citations, author collaboration, and keyword co-occurrence to gain a targeted perspective in our area of interest. The exclusion of the last two methods was a strategic decision to simplify and concentrate our analysis on key aspects that we deemed essential for addressing our research questions.
3.1. Identifying Authors with the Highest Citations
To recognize the most prominent authors, two categories were taken into account: the category of authors with the highest citations, utilizing the number of citations per author as the evaluation criterion, and, in case of a tie, considering the strength of the link in the citation network; and the category of authors with the most publications, using the number of publications per author as the evaluation criterion.
In both the WoS and Scopus databases, the authors M. Murphy, S. Pavia, and E. McGovern, stand out as the top three most cited authors (Figure 3a,b).
In WoS, the authors with the highest link strength are J. Moyano and J.E. Nieto-Julian, followed by M. Murphy, S. Pavia, Y. Alshawabkeh, and A. Baik, who share the third position. In Scopus, M. Murphy and S. Pavia, lead the list, with E. McGovern in the third position.
3.2. Authors with the Most Publications
3.3. Documents with the Highest Citations
To identify the most relevant publications, the primary criterion was the number of citations received, and in case of a tie, the number of links to each document in the citation network and the publication date of the document were considered.
The most cited paper in both databases is the article by authors M. Murphy, E. McGovern, and S. Pavia titled “Historic Building Information Modelling—Adding Intelligence to Lasers and Image-based Surveys of European Classical Architecture”, published in 2013 in the ISPRS Journal of Photogrammetry and Remote Sensing [22].
In WoS, it is followed by articles authored by D. Pflugmacher, W.B. Cohen., R.E. Kennedy, and Z. Yang, published in 2014 [23], and F. Ubertini, G. Comanducci, N. Cavalagli, A.L. Pisello, A.L. Materazzi, and F. Cotana, published in 2017 [24] (Figure 5a). In Scopus, it is followed by articles authored by G. Rocha, L. Mateus, J. Fernandez, and V. Ferreira, published in 2020 [25], and M. Pepe, D. Costantino, and A.R. Garofalo, published in 2020 [26] (Figure 5b).
3.4. The Most Prominent Research Groups
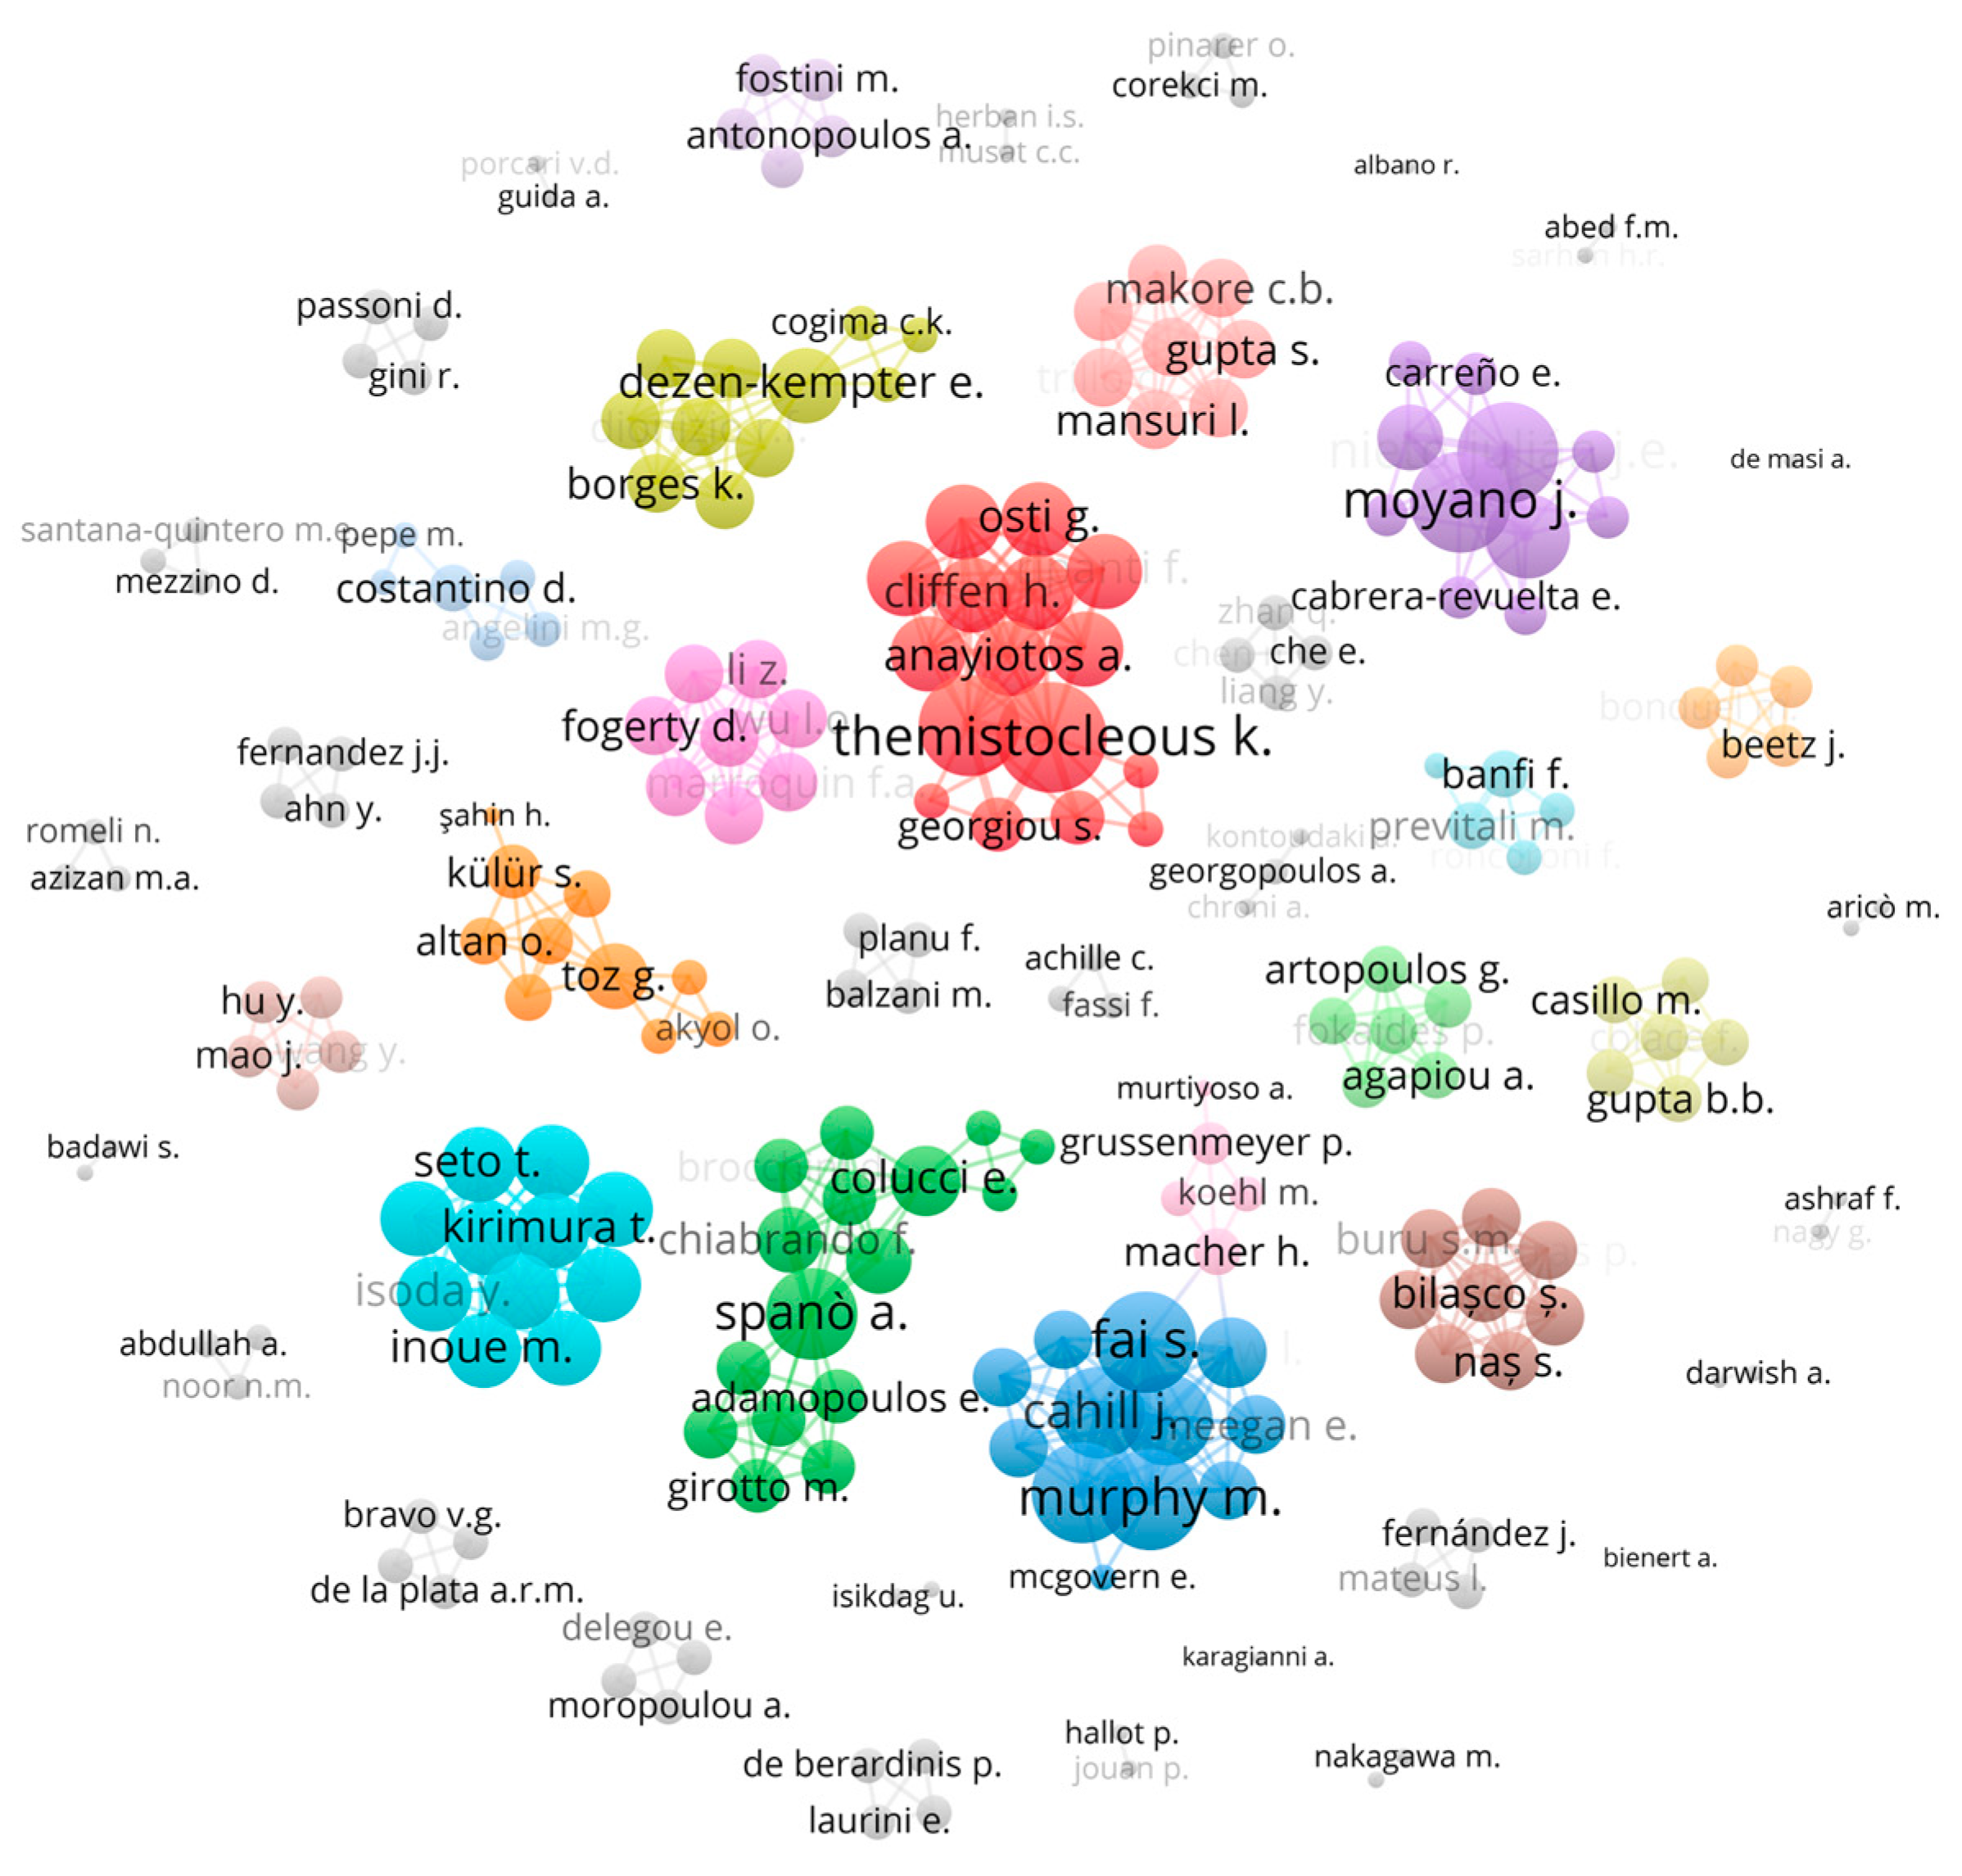
To identify the most prominent research groups, we assessed the teams formed by authors with the highest link strength in the co-authorship network and the strength of the links between those authors and other authors within those groups (Figure 6 and Figure 7).
In WoS, the author with the highest link strength is A. Spanò, followed by J. Moyano, and J.E. Nieto-Julian, who share the second position. In Scopus, K. Themistocleous stands out as the author with the highest link strength.
In WoS, it is observed that A. Spanò, primarily collaborates with G. Sammartano and F. Chiabrando, while J. Moyano, and J.E. Nieto-Julian work closely together, in addition to collaborating with other authors such as M. Fernandez-Alconchel and D. Anton. On the other hand, M. Murphy leads a group that includes authors like S. Pavia, A. Corns, S. Lenihan, and J. Cahill. Lastly, F. Ubertini collaborates primarily with N. Cavalagli and G. Comanducci.
In Scopus, K. Themistocleous collaborates with authors such as M. Ioannides, D. Hadjimitsis, and S. Georgiou. Additionally, S. Fai collaborates with M. Murphy, S. Pavia, A. Corns, and J. Cahill, highlighting the relationship between M. Murphy and S. Pavia. J. Moyano and J.E. Nieto-Julian lead a group that also collaborates with M. Fernandéz-Alconchel. Lastly, A. Spanò primarily works with G. Sammartano and F. Chiabrando. This allowed the identification of five relevant groups related to the research topic:
- The group led by M. Murphy and S. Pavia from Trinity College Dublin (Republic of Ireland).
- The group led by A. Spanò and G. Sammartano from the Politecnico di Torino (Italy).
- The group led by J. Moyano and J.E. Nieto-Julian from the Universidad de Sevilla (Spain).
- The group led by F. Ubertini, N. Cavalagli, and G. Comanducci from the Universitá degli Studi di Perugia (Italy).
- The group led by K. Themistocleous and M. Ioannides from the Cyprus University of Technology (Cyprus).
These five groups have a large part of their work dedicated to the documentation and digitalization of heritage buildings using the HBIM methodology, but the groups of the Universidad de Sevilla and the Università degli Studi di Perugia stand out for also contributing to topics related to the use of sensors in the monitoring of heritage buildings.
3.5. Keywords with the Highest Link Strength
To analyze how publications are associated with topics related to the development and application of digital technologies, as well as the issue of climate change, a co-occurrence keyword network analysis was conducted in both WoS and Scopus.
Keywords with the highest link strength were identified in both databases, allowing the recognition of the most important keywords related to the research topic (Figure 8 and Figure 9). The eight keywords with the highest link strength in both databases are:
- hbim, encompassing terms such as hbim, h-bim, hbim platform, heritage bim, heritage building information modeling (hbim), heritage building information modeling hbim, heritage building information modelling (h-bim), historic building information modeling hbim, historic building information modelling hbim, and historic building information modeling hbim (hbim).
- cultural heritage, encompassing terms such as cultural heritage and cultural herit.
- remote sensing, encompassing terms such as remote sensing and remote sensing (rs).
- 3d modeling, encompassing terms such as 3d modeling, 3d modelling, 3d model, 3d models, 3d-models, and 3-d modelling.
- bim, encompassing terms such as bim, building information modeling (bim), building information modelling, building information modeling (bim), building information model, building information model (bim), and bim).
- 3d laser scanner, encompassing terms such as 3d laser scanner, 3d laser scanning, 3d scanning, laser scanner, and laser scanning.
- photogrammetry, which does not encompass other terms.
- point clouds, encompassing terms such as point clouds, point cloud, and points clouds.
In the keyword analysis, it is evident that terms directly related to Heritage Building Information Modeling (HBIM) and sensors (remote sensing) emerged, as these were the keywords used in the search. The most relevant connections related to emerging technologies and the issue of climate change were then investigated using these two key terms as a starting point.
3.6. Relationships with Digital Technologies and Climate Change
In WoS, strong connections were found between “HBIM” and technologies used in the HBIM or Building Information Modeling (BIM) methodology, such as “Photogrammetry”, “Geographic Information System (GIS)”, “Digital Twin”, “3D Laser Scanner”, “Terrestrial Laser Scanning”, “3D Modeling”, “Scan-to-BIM”, “3D Reconstruction”, and “Data Fusion”. These connections were to be expected, as they are involved in the possible HBIM methodologies for survey and 3D modeling of heritage buildings [11,32,39,40,41,42,43], except for the “Geographic Information System (GIS)”, which refers to the development of new methodologies for data collection and management of heritage buildings at the territorial scale [44,45,46].
Additionally, technologies related to climate change, such as “Remote Sensing”, “Building Performance Simulation (BPS)”, and “Building Energy Modeling (BEM)”, were highlighted. These connections, refer to the modeling of heritage buildings dedicated to the study of energy efficiency, in which they focus on the analysis of data taken by sensors considering environmental information and the conditions of the structural health of the buildings, also incorporating predictions under simulated circumstances using specific 3D models [13,47].
When examining the relationship between “Remote Sensing” and technological topics, it was observed that connections are established linking to a series of terms related to HBIM, and additionally, other terms such as “Unmanned Aerial Vehicle (UAV)” and “Point Clouds” are incorporated. As explained above, the connection between sensors and HBIM is involved with the issue of monitoring the environmental and structural conditions of heritage buildings. Already when it comes to UAV and point clouds, they refer to the use of sensors as an integral part of the tools applied to the graphic survey of heritage buildings, whether they are aerial or terrestrial [48,49,50,51,52,53].
However, when considering its relationship with topics related to climate change, a single term that entirely encompasses this theme stands out, which is “Climate Change”. Monitoring sensors are often used in studies related to climate change, aiming to detect its effects on the architectural and structural elements of heritage buildings [4,53,54]. The data collected by these sensors allow real-time analysis of the situation of the building, helping the decision-making process of its managers.
In the Scopus database, it is observed that the relationships between “HBIM” and technological topics maintain consistency with keywords identified in the WoS database. Additionally, some additional keywords are incorporated, such as “Lidar”, “Artificial Intelligence”, and “Online BIM”. The relationship between “HBIM” and “Lidar” is identified through a study performed by Albano [55] that performs a survey using this technology to model the roofs of buildings in a certain historical center.
The relationship with “Artificial Intelligence” is portrayed in the work of Darwish & Hassanien [56], that relates the use of artificial intelligence based on algorithms to detect the deterioration of heritage structures. Its relationship with “Online BIM” is highlighted in the work of Artopoulos et al. [57], which deals with issues related to digitalization at multiple scales and disciplines for the restoration of heritage buildings, highlighting the potential of the integration of data, methods, and workflows.
Regarding the topic of climate change, similar terms to those in WoS are found, and some additional keywords are included, such as “Energy Performance”, “Smart Sensing”, “Sensors”, “Sustainable Development”, “Smart Indicators Sensor networks”, and “Monitoring”. These terms refer again to the applicability of sensors in the monitoring of heritage buildings and their integration into the HBIM methodology as a reading of their data in real time through intelligent sensors. And as said before, this monitoring of heritage buildings by means of sensors is used to evaluate the energy performance of these buildings [15].
When exploring the relationship of “Remote Sensing” with technological topics in Scopus, a notable similarity with the keywords identified in WoS was observed. However, there was no strong connection identified with any keyword representing the topic of climate change.
3.7. Potential Future Research Directions
To identify potential future research directions, an analysis was conducted through the overlaid visualization map (Figure 10) available in VOSviewer version 1.6.19. This map enables the visualization of the appearance dates of keywords, from the oldest to the most recent.
The combination of relevant keywords, particularly “HBIM” and “Remote Sensing”, which are fundamental in the context of HBIM and sensors research, was examined. Combinations involving the keyword “HBIM” with other keywords related to sensor themes, such as “Smart Sensor” and “Sensor Networks”, were also considered. Subsequently, the relationships of these keywords with others emerging in recent publications, such as “Energy Performance” and “Artificial Intelligence”, were evaluated, indicating potential future research directions.
WoS and Scopus share an emerging trend in the field of study, which originates from a common connection between “HBIM” and “Remote Sensing” (Figure 11a,b). This trend focuses on the theme of “4D Spatial Data Management”, and according to the compiled data, it starts to be cited in the year 2023. The relationship between these three elements is involved with data management according to time, and can deal with the evolution of buildings from their creation to possible future interventions, using monitoring data generated by different types of sensors to plan maintenance activities, preventive conservation, or even make predictions using simulation software such as those dedicated to energy performance or design scenarios [57].
In Scopus, two additional possible fields are identified:
A first field is formed from a common relationship between “HBIM” and “Smart Sensing” (Figure 12a). This field is related to “Energy Performance”, and according to the compiled data, it starts to be cited from the year 2023. It also connects with topics such as “Building Performance Simulation (BPS)” and “Building Energy Modeling (BEM)”, which begin to appear in the same period. The relationship between the elements is involved with the monitoring of heritage buildings through environmental sensors that can measure the energy performance of the building and that, integrated into a 3D model conceived for analysis of performance, help in decision making in future interventions and necessary adaptations to the building [15].
The second field is formed from the relationship between “HBIM” and “Sensor Networks” (Figure 12b) and focuses on “Artificial Intelligence”. This field also links with the “Internet of Things (IoT)” and its adaptation to cultural heritage, identified as “Internet of Heritage Cultural Things (IOHCT)”. These three elements connect and complement each other. The Internet of Things makes it possible to connect physical elements in general to the internet network; it can also be dedicated to specific elements of a given topic, such as cultural heritage, which allows the connection between HBIM models and sensor networks through the internet and subsequently, with the help of artificial intelligence and its algorithms, a series of analysis and predictions through simulations [2,56,58].
These emerging trends suggest promising research areas that have gained relevance in recent years and could influence future investigations in the fields of HBIM and sensors.
4. Discussion and Conclusions
In this study, a comprehensive bibliometric analysis was conducted to examine current research on the relationship between Heritage Building Information Modeling (HBIM) and sensor technologies.
The employed methodology in this research affords a diverse range of possibilities for the amalgamation and visual representation of the compiled data, thereby significantly enhancing the analytical process and facilitating a more nuanced interpretation of the information, ultimately leading to a more comprehensive understanding of the results.
The flexibility inherent in the chosen methodology empowers researchers to explore various combinations and visualizations, fostering a deeper insight into the intricate relationships within the dataset and ensuring a robust foundation for drawing meaningful conclusions from the gathered information.
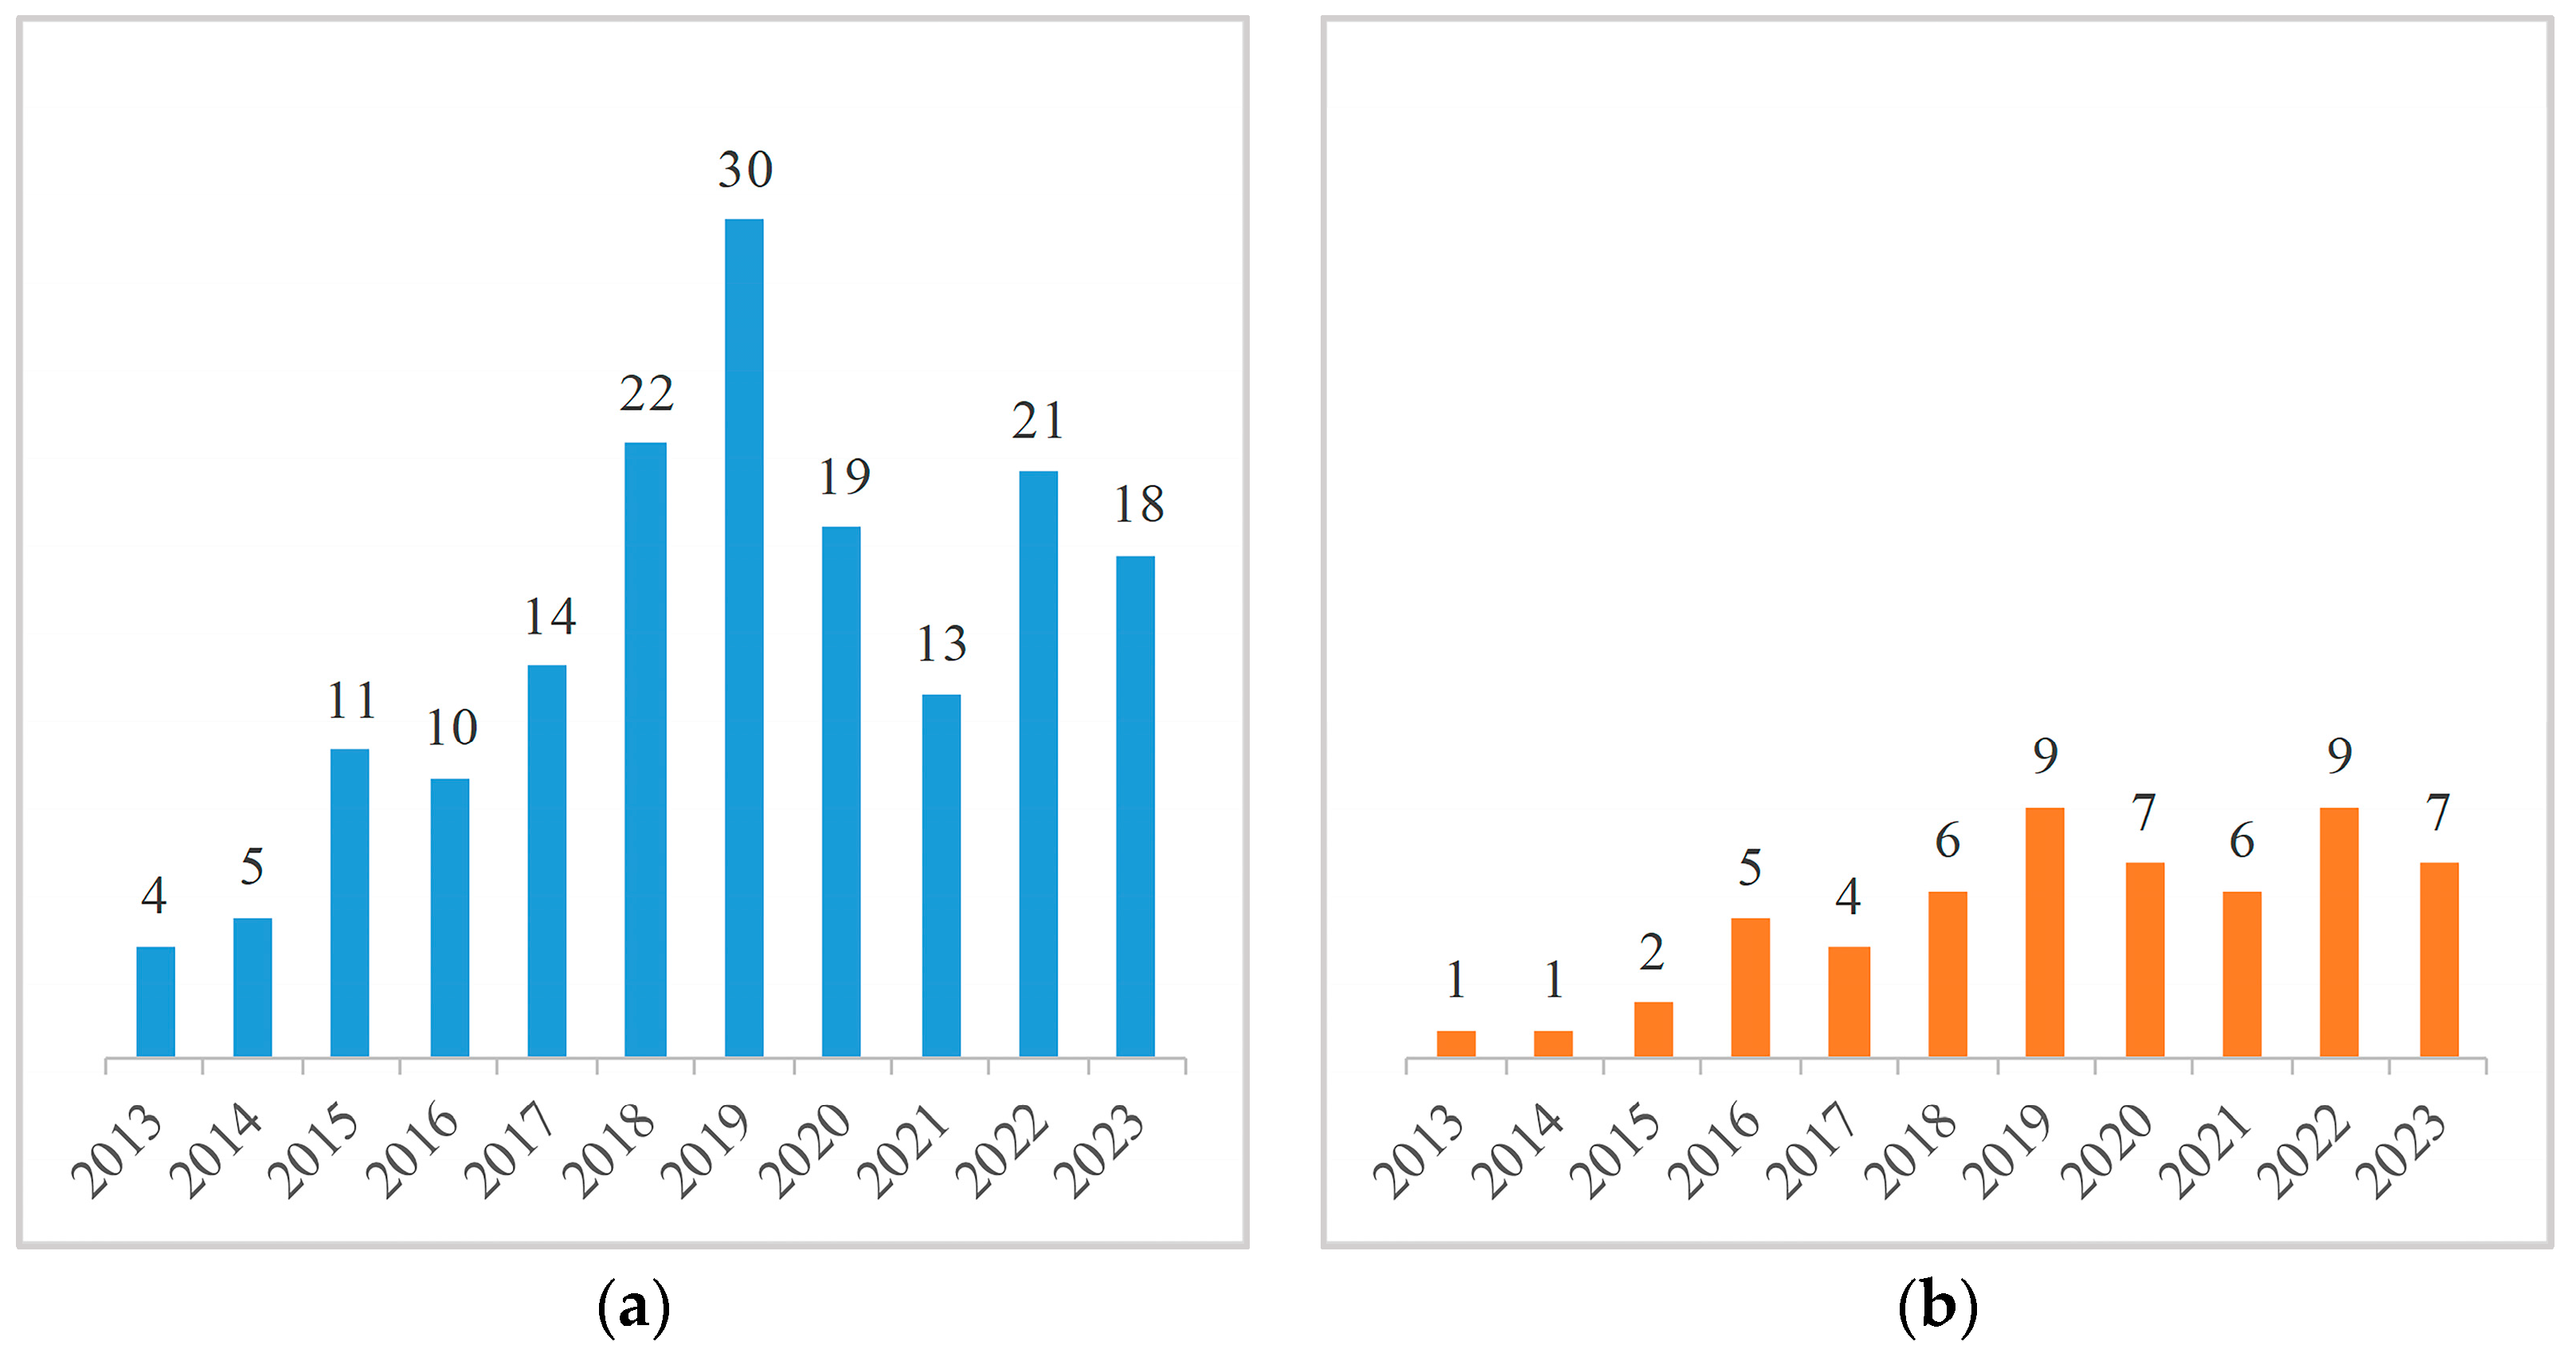
It has been identified that the author M. Murphy stands out as one of the most cited, as he was a pioneer who began addressing the topic of HBIM in 2013. From that point onwards, all authors cite him in their texts, making 2013 the year with the highest number of citations. Subsequently, in 2019, there is a peak of interest in the topic, marked by the highest number of publications. It is in 2023 that new research avenues emerged, undoubtedly placing them under the spotlight.
An increase in publications related to this topic over the last decade has been observed, suggesting a significant upturn in research interest and activity during this period, in line with rapid advances and evolution, reflecting the trajectory of digital technologies. The simultaneous growth in publications and technological progress implies a dynamic interplay, emphasizing the timeliness and evolving nature of Heritage Building Information Modeling (HBIM) and sensor technologies within the broader scholarly discourse.
The prominent research groups identified in this study are predominantly from European institutions and have a primary preference for publishing in English. This observation leads us to consider a possible limitation in the study, given its reliance on data sourced exclusively from WoS and Scopus in the English language, which might introduce a bias towards European perspectives. Equally notable is the scarcity of contributions on the topic from countries such as Canada, the United States, and Australia, even when restricting the analysis to English language publications. This underrepresentation underscores a broader gap in the dissemination of research findings from these regions within the English language scholarly landscape.
In addition, the data analysis has revealed three discernible and promising trends in the dynamic interaction between HBIM and sensor technologies. Specifically, these trends revolve around “4D Spatial Data Management”, delving into the temporal dimension of data; “Energy Performance”, addressing the sustainability aspects; and “Artificial Intelligence”, exploring the integration of advanced computational methods.
Concerning “4D Spatial Data Management”, it has been identified that it is being used at the urban scale through 3D models of heritage buildings integrated into a GIS platform, with the aim of analyzing the historical evolution and structural changes that have occurred over time in buildings located in the old towns of historic cities [57,59,60].
On the analysis of “Energy Performance” in heritage buildings, works are increasingly being developed on energy performance analysis through 3D models associated with data generated by sensors [7,14,15,47]. These works, in general, seek to adapt the parameters and methods already used in the BIM methodology (dedicated to new buildings) to the HBIM methodology (dedicated to heritage buildings), adapting or developing new tools that suit the unique characteristics inherent to heritage buildings. In addition, they are looking at energy efficiency and at the adaptation of these buildings to the current requirements associated with sustainability.
With respect to the use of “Artificial Intelligence”, there are already works that deal with the subject applied to the conservation of cultural heritage, as seen in the works of Bienvenido-Huertas et al. [61], Wang et al. [62], Zou et al. [63], Mesanza-Moraza et al. [64], Ergün Hatir et al. [65], Ni & Liu [66], Mishra [67], and Mansuri & Patel [68], portrayed in the state-of-the-art review conducted by Zhang & Zou [3]. These works show that the topic is being addressed, but needs further research dedicated to the use of artificial intelligence integrated with digital twins developed with the HBIM methodology.
Unveiling these trends not only contributes to our understanding of the current landscape but also provides valuable insights for future research directions in this evolving multidisciplinary field. These results can serve as a starting point for researchers interested in contributing to the advancement of this field of study, as well as to knowledge in the conservation and management of heritage buildings.
Author Contributions
Conceptualization, R.R.; methodology, R.R.; software, R.R.; validation, R.R., C.L.-G. and M.J.V.; formal analysis, R.R.; investigation, R.R.; resources, R.R., C.L.-G. and M.J.V.; data curation, R.R.; writing—original draft preparation, R.R.; writing—review and editing, R.R., C.L.-G. and M.J.V.; visualization, R.R.; supervision, C.L.-G. and M.J.V.; project administration, C.L.-G. and M.J.V.; funding acquisition, C.L.-G. and M.J.V. All authors have read and agreed to the published version of the manuscript.
Funding
This research was conducted through the research project “Analysis and development of the integration of HBIM in GIS for the creation of a protocol for cultural heritage tourism planning” (ref. PID2020-119088RB-I00), funded by the Ministry of Science and Innovation, Government of Spain and the FPU grant (ref. FPU21/06469) funded by the Ministry of Universities, Government of Spain. The APC will be funded by the Universitat Politècnica de València.
Data Availability Statement
The datasets used and/or analyzed during the current study are available from the first author upon reasonable request.
Conflicts of Interest
The authors declare no conflicts of interest.
References
- Rossi, M.; Bournas, D. Structural Health Monitoring and Management of Cultural Heritage Structures: A State-of-the-Art Review. Appl. Sci. 2023, 13, 6450. [Google Scholar] [CrossRef]
- Casillo, M.; Colace, F.; Gupta, B.B.; Lorusso, A.; Marongiu, F.; Santaniello, D. A Deep Learning Approach to Protecting Cultural Heritage Buildings Through IoT-Based Systems. In Proceedings of the 2022 IEEE International Conference on Smart Computing (SMARTCOMP), Helsinki, Finland, 20–24 June 2022; pp. 252–256. [Google Scholar] [CrossRef]
- Zhang, Z.; Zou, Y. Research hotspots and trends in heritage building information modeling: A review based on CiteSpace analysis. Humanit. Soc. Sci. Commun. 2022, 9, 1–22. [Google Scholar] [CrossRef]
- Machete, R.; Neves, M.; Ponte, M.; Falcão, A.P.; Bento, R. A BIM-Based Model for Structural Health Monitoring of the Central Body of the Monserrate Palace: A First Approach. Buildings 2023, 13, 1532. [Google Scholar] [CrossRef]
- Liu, T.; Yang, B.; Zhang, Q. Health Monitoring System Developed for Tianjin 117 High-Rise Building. J. Aerosp. Eng. 2017, 30, B4016004. [Google Scholar] [CrossRef]
- Castellano-Román, M.; Pinto-Puerto, F. Dimensions and Levels of Knowledge in Heritage Building Information Modelling, HBIM: The model of the Charterhouse of Jerez (Cádiz, Spain). Digit. Appl. Archaeol. Cult. Herit. 2019, 14, e00110. [Google Scholar] [CrossRef]
- Meoni, A.; Vittori, F.; Piselli, C.; D’Alessandro, A.; Pisello, A.; Ubertini, F. Integration of structural performance and human-centric comfort monitoring in historical building information modeling. Autom. Constr. 2022, 138, 104220. [Google Scholar] [CrossRef]
- Cursi, S.; Martinelli, L.; Paraciani, N.; Calcerano, F.; Gigliarelli, E. Linking external knowledge to heritage BIM. Autom. Constr. 2022, 141, 104444. [Google Scholar] [CrossRef]
- Banfi, F.; Barazzetti, L.; Previtali, M.; Roncoroni, F. Historic bim: A new repository for structural health monitoring. Int. Arch. Photogramm. Remote Sens. Spat. Inf. Sci. ISPRS Arch. 2017, 42, 269–274. [Google Scholar] [CrossRef]
- Chiabrando, F.; Sammartano, G.; Spanò, A.; Spreafico, A. Hybrid 3D Models: When Geomatics Innovations Meet Extensive Built Heritage Complexes. ISPRS Int. J. Geo-Inf. 2019, 8, 124. [Google Scholar] [CrossRef]
- Nieto-Julián, J.E.; Antón, D.; Moyano, J.J. Implementation and Management of Structural Deformations into Historic Building Information Models. Int. J. Arch. Herit. 2020, 14, 1384–1397. [Google Scholar] [CrossRef]
- Currà, E.; D’amico, A.; Angelosanti, M. Representation and knowledge of historic construction: HBIM for structural use in the case of Villa Palma-Guazzaroni in Terni. Riv. Tema 2021, 7, 8–20. [Google Scholar] [CrossRef]
- O’shea, M.; Murphy, J. Design of a BIM Integrated Structural Health Monitoring System for a Historic Offshore Lighthouse. Buildings 2020, 10, 131. [Google Scholar] [CrossRef]
- Nagy, G.; Ashraf, F. HBIM platform & smart sensing as a tool for monitoring and visualizing energy performance of heritage buildings. Dev. Built Environ. 2021, 8, 100056. [Google Scholar] [CrossRef]
- Moyano, J.; Fernández-Alconchel, M.; Nieto-Julián, J.E.; Marín-García, D.; Bruno, S. Integration of dynamic information on energy parameters in hbim models. Int. Arch. Photogramm. Remote Sens. Spat. Inf. Sci. ISPRS Arch. 2023, 48, 1089–1096. [Google Scholar] [CrossRef]
- Vilutiene, T.; Kalibatiene, D.; Hosseini, M.R.; Pellicer, E.; Zavadskas, E.K. Building Information Modeling (BIM) for Structural Engineering: A Bibliometric Analysis of the Literature. Adv. Civ. Eng. 2019, 2019, 5290690. [Google Scholar] [CrossRef]
- Li, J.; Weng, G.; Pan, Y.; Li, C.; Wang, N. A scientometric review of tourism carrying capacity research: Cooperation, hotspots, and prospect. J. Clean. Prod. 2021, 325, 129278. [Google Scholar] [CrossRef]
- Liu, Z.; Zhang, M.; Osmani, M. Building Information Modelling (BIM) Driven Sustainable Cultural Heritage Tourism. Buildings 2023, 13, 1925. [Google Scholar] [CrossRef]
- Hou, H.; Lai, J.H.; Wu, H.; Wang, T. Digital twin application in heritage facilities management: Systematic literature review and future development directions. Eng. Constr. Arch. Manag. 2023. ahead-of-print. [Google Scholar] [CrossRef]
- Bulgarelli-Bolaños, J.P.; Hernández-Salazar, I.; Pinto-Puerto, F. Evolución de la producción científica sobre los conceptos HBIM y modelado 3D en la gestión de obras patrimoniales. Rev. Tecnol. En Marcha 2020, 33, 89–101. [Google Scholar] [CrossRef]
- Van Eck, N.J.; Waltman, L. Manual for VOSviewer Version 1.6.19. In Univeristeit Leiden; Issue January; 2023. Available online: http://www.vosviewer.com/documentation/Manual_VOSviewer_1.6.1.pdf (accessed on 23 September 2023).
- Murphy, M.; McGovern, E.; Pavia, S. Historic Building Information Modelling—Adding intelligence to laser and image based surveys of European classical architecture. ISPRS J. Photogramm. Remote. Sens. 2013, 76, 89–102. [Google Scholar] [CrossRef]
- Pflugmacher, D.; Cohen, W.B.; Kennedy, R.E.; Yang, Z. Using Landsat-derived disturbance and recovery history and lidar to map forest biomass dynamics. Remote. Sens. Environ. 2014, 151, 124–137. [Google Scholar] [CrossRef]
- Ubertini, F.; Comanducci, G.; Cavalagli, N.; Pisello, A.L.; Materazzi, A.L.; Cotana, F. Environmental effects on natural frequencies of the San Pietro bell tower in Perugia, Italy, and their removal for structural performance assessment. Mech. Syst. Signal Process. 2017, 82, 307–322. [Google Scholar] [CrossRef]
- Rocha, G.; Mateus, L.; Fernández, J.; Ferreira, V. A Scan-to-BIM Methodology Applied to Heritage Buildings. Heritage 2020, 3, 47–67. [Google Scholar] [CrossRef]
- Pepe, M.; Costantino, D.; Garofalo, A.R. An efficient pipeline to obtain 3D model for HBIM and structural analysis purposes from 3D point clouds. Appl. Sci. 2020, 10, 1235. [Google Scholar] [CrossRef]
- Xu, Z.; Wu, L.; Shen, Y.; Li, F.; Wang, Q.; Wang, R. Tridimensional Reconstruction Applied to Cultural Heritage with the Use of Camera-Equipped UAV and Terrestrial Laser Scanner. Remote Sens. 2014, 6, 10413–10434. [Google Scholar] [CrossRef]
- Xiao, W.; Mills, J.; Guidi, G.; Rodriguez-Gonzalvez, P.; Barsanti, S.G.; Gonzalez-Aguilera, D. Geoinformatics for the conservation and promotion of cultural heritage in support of the UN Sustainable Development Goals. ISPRS J. Photogramm. Remote Sens. 2018, 142, 389–406. [Google Scholar] [CrossRef]
- Esposito, M.; Damiano, E.; Minutolo, A.; De Pietro, G.; Fujita, H. Hybrid query expansion using lexical resources and word embeddings for sentence retrieval in question answering. Inf. Sci. 2020, 514, 88–105. [Google Scholar] [CrossRef]
- Tapete, D.; Cigna, F.; Donoghue, D.N.M. ‘Looting marks’ in space-borne SAR imagery: Measuring rates of archaeological looting in Apamea (Syria) with TerraSAR-X Staring Spotlight. Remote Sens. Environ. 2016, 178, 42–58. [Google Scholar] [CrossRef]
- Shuai, Y.; Masek, J.G.; Gao, F.; Schaaf, C.B.; He, T. An approach for the long-term 30-m land surface snow-free albedo retrieval from historic Landsat surface reflectance and MODIS-based a priori anisotropy knowledge. Remote Sens. Environ. 2014, 152, 467–479. [Google Scholar] [CrossRef]
- Andriasyan, M.; Moyano, J.; Nieto-Julián, J.E.; Antón, D. From Point Cloud Data to Building Information Modelling: An Automatic Parametric Workflow for Heritage. Remote. Sens. 2020, 12, 1094. [Google Scholar] [CrossRef]
- Tommasi, C.; Achille, C.; Fassi, F. From point cloud to BIM: A modelling challenge in the cultural heritage field. Int. Arch. Photogramm. Remote Sens. Spat. Inf. Sci.-ISPRS Arch. 2016, 41, 429–436. [Google Scholar] [CrossRef]
- Chiabrando, F.; Sammartano, G.; Spanò, A. Historical buildings models and their handling via 3d survey: From points clouds to user-oriented hbim. Int. Arch. Photogramm. Remote Sens. Spat. Inf. Sci.-ISPRS Arch. 2016, 41, 633–640. [Google Scholar] [CrossRef]
- Jouan, P.; Hallot, P. Digital Twin: A HBIM-Based Methodology to Support Preventive Conservation of Historic Assets Through Heritage Significance Awareness. Int. Arch. Photogramm. Remote Sens. Spat. Inf. Sci. 2019, XLII-2/W15, 609–615. [Google Scholar] [CrossRef]
- Underwood, J.; Isikdag, U. Emerging technologies for BIM 2.0. Constr. Innov. 2011, 11, 252–258. [Google Scholar] [CrossRef]
- Angelini, M.G.; Baiocchi, V.; Costantino, D.; Garzia, F. Scan to BIM for 3D reconstruction of the papal basilica of saint Francis in Assisi In Italy. Int. Arch. Photogramm. Remote Sens. Spat. Inf. Sci.-ISPRS Arch. 2017, 42, 47–54. [Google Scholar] [CrossRef]
- Gini, R.; Passoni, D.; Pinto, L.; Sona, G. Aerial Images From an UAV System: 3D Modeling And Tree Species Classification in a Park Area. Int. Arch. Photogramm. Remote Sens. Spat. Inf. Sci. 2012, XXXIX-B1, 361–366. [Google Scholar] [CrossRef]
- Franco, P.A.C.; de la Plata, A.R.M.; Franco, J.C. From the Point Cloud to BIM Methodology for the Ideal Reconstruction of a Lost Bastion of the Cáceres Wall. Appl. Sci. 2020, 10, 6609. [Google Scholar] [CrossRef]
- Alshawabkeh, Y.; Baik, A.; Miky, Y. Integration of Laser Scanner and Photogrammetry for Heritage BIM Enhancement. ISPRS Int. J. Geo-Inf. 2021, 10, 316. [Google Scholar] [CrossRef]
- De la Plata, A.R.M.; Franco, P.A.C.; Franco, J.C.; Bravo, V.G. Protocol Development for Point Clouds, Triangulated Meshes and Parametric Model Acquisition and Integration in an HBIM Workflow for Change Control and Management in a UNESCO’s World Heritage Site. Sensors 2021, 21, 1083. [Google Scholar] [CrossRef]
- Lanzara, E.; Catello, D.; Casciello, M. Scan to HBIM for Complex Reflective Metal Artefacts. 3D Digitisation and Restoration. Int. Arch. Photogramm. Remote Sens. Spat. Inf. Sci. 2022, XLVIII-2/W1-2022, 121–128. [Google Scholar] [CrossRef]
- Moyano, J.; Carreño, E.; Nieto-Julián, J.E.; Gil-Arizón, I.; Bruno, S. Systematic approach to generate Historical Building Information Modelling (HBIM) in architectural restoration project. Autom. Constr. 2022, 143, 104551. [Google Scholar] [CrossRef]
- Chenaux, A.; Murphy, M.; Pavia, S.; Fai, S.; Molnar, T.; Cahill, J.; Lenihan, S.; Corns, A. A Review of 3D GIS for use in Creating Virtual Historic Dublin. ISPRS Ann. Photogramm. Remote Sens. Spat. Inf. Sci. 2019, 42, 249–254. [Google Scholar] [CrossRef]
- Templin, T.; Brzezinski, G.; Rawa, M. Visualization of Spatio-Temporal Building Changes Using 3D Web GIS. IOP Conf. Ser. Earth Environ. Sci. 2019, 221, 012084. [Google Scholar] [CrossRef]
- Sammartano, G.; Avena, M.; Fillia, E.; Spanò, A. Integrated HBIM-GIS Models for Multi-Scale Seismic Vulnerability Assessment of Historical Buildings. Remote. Sens. 2023, 15, 833. [Google Scholar] [CrossRef]
- Massafra, A.; Predari, G.; Gulli, R. Towards Digital Twin Driven Cultural Heritage Management: A HBIM-Based Workflow for Energy Improvement of Modern Buildings. Int. Arch. Photogramm. Remote Sens. Spat. Inf. Sci. 2022, XLVI-5/W1-2022, 149–157. [Google Scholar] [CrossRef]
- Chiabrando, F.; Sammartano, G.; Spano, A. A Comparison Among Different Optimization Levels in 3D Multi-Sensor Models. A Test Case in Emergency Context: 2016 Italian Earthquake. Int. Arch. Photogramm. Remote Sens. Spat. Inf. Sci. 2017, XLVII-2/W3, 155–162. [Google Scholar] [CrossRef]
- Murtiyoso, A.; Grussenmeyer, P. Comparison and Assessment of 3D Registration and Georeferencing Approaches of Point Clouds in the Case of Exterior and Interior Heritage Building Recording. Int. Arch. Photogramm. Remote Sens. Spat. Inf. Sci. 2018, XLII–2, 745–751. [Google Scholar] [CrossRef]
- Murtiyoso, A.; Grussenmeyer, P.; Suwardhi, D.; Fadilah, W.A.; Permana, H.A.; Wicaksono, D. Multi-Sensor 3D Recording Pipeline for the Documentation of Javanese Temples. Int. Arch. Photogramm. Remote Sens. Spat. Inf. Sci. 2019, XLII–2/W5, 829–834. [Google Scholar] [CrossRef]
- Yang, X.; Grussenmeyer, P.; Koehl, M.; Macher, H.; Murtiyoso, A.; Landes, T. Review of built heritage modelling: Integration of HBIM and other information techniques. J. Cult. Herit. 2020, 46, 350–360. [Google Scholar] [CrossRef]
- Castilla, F.J.; Ramón, A.; Adán, A.; Trenado, A.; Fuentes, D. 3D Sensor-Fusion for the Documentation of Rural Heritage Buildings. Remote. Sens. 2021, 13, 1337. [Google Scholar] [CrossRef]
- Moyano, J.; Nieto-Julián, J.E.; Fernández-Alconchel, M.; Oreni, D.; Estévez-Pardal, R. Analysis and Precision of Light Detection and Ranging Sensors Integrated in Mobile Phones as a Framework for Registration of Ground Control Points for Unmanned Aerial Vehicles in the Scanning Technique for Building Information Modelling in Archaeological Sites. Drones 2023, 7, 477. [Google Scholar] [CrossRef]
- Mitro, N.; Krommyda, M.; Amditis, A. Smart Tags: IoT Sensors for Monitoring the Micro-Climate of Cultural Heritage Monuments. Appl. Sci. 2022, 12, 2315. [Google Scholar] [CrossRef]
- Albano, R. Investigation on Roof Segmentation for 3D Building Reconstruction from Aerial LIDAR Point Clouds. Appl. Sci. 2019, 9, 4674. [Google Scholar] [CrossRef]
- Darwish, A.; Hassanien, A.E. IoHCT: Internet of Cultural Heritage Things Digital Twins for Conservation and Health Monitoring of Cultural in the Age of Digital Transformation. In Digital Twins for Digital Transformation: Innovation in Industry. Studies in Systems, Decision and Control; Hassanien, A.E., Darwish, A., Snasel, V., Eds.; Springer: Cham, Switzerland, 2022; Volume 423. [Google Scholar] [CrossRef]
- Artopoulos, G.; Fokaides, P.; Lysandrou, V.; Deligiorgi, M.; Sabatakos, P.; Agapiou, A. Data-Driven Multi-Scale Study of Historic Urban Environments by Accessing Earth Observation and Non-Destructive Testing Information via an HBIM-Supported Platform. Int. J. Arch. Herit. 2023, 1–20. [Google Scholar] [CrossRef]
- Laurini, E.; Rotilio, M.; Lucarelli, M.; De Berardinis, P. Technology 4.0 for buildings management: From building site to the interactive building book. ISPRS Ann. Photogramm. Remote Sens. Spat. Inf. Sci. 2019, 42, 707–714. [Google Scholar] [CrossRef]
- Chiabrando, F.; Naretto, M.; Sammartano, G.; Sambuelli, L.; Spanò, A.; Losè, L.T. The 4DILAN Project (4th Dimension in Landscape and Artifacts Analyses). ISPRS Int. Arch. Photogramm. Remote. Sens. Spat. Inf. Sci. 2017, XLII-5/W1, 227–234. [Google Scholar] [CrossRef]
- Abbate, E.; Sammartano, G.; Spanò, A. Prospective Upon Multi-Source Urban Scale Data for 3D Documentation and Monitoring of Urban Legacies. ISPRS Int. Arch. Photogramm. Remote. Sens. Spat. Inf. Sci. 2019, XLII-2/W11, 11–19. [Google Scholar] [CrossRef]
- Bienvenido-huertas, D.; Nieto-julián, J.E.; Moyano, J.J.; Macías-bernal, J.M.; Castro, J.; Nieto-julián, J.E.; Moyano, J.J.; Macías, J.M. Implementing Artificial Intelligence in H-BIM Using the J48 Algorithm to Manage Historic Buildings Implementing Artificial Intelligence in H-BIM Using the J48 Algorithm to Manage. Int. J. Arch. Herit. 2019, 14, 1148–1160. [Google Scholar] [CrossRef]
- Wang, N.; Zhao, X.; Zou, Z.; Zhao, P.; Qi, F. Autonomous damage segmentation and measurement of glazed tiles in historic buildings via deep learning. Comput. Civ. Infrastruct. Eng. 2019, 35, 277–291. [Google Scholar] [CrossRef]
- Zou, Z.; Zhao, X.; Zhao, P.; Qi, F.; Wang, N. CNN-based statistics and location estimation of missing components in routine inspection of historic buildings. J. Cult. Herit. 2019, 38, 221–230. [Google Scholar] [CrossRef]
- Mesanza-Moraza, A.; García-Gómez, I.; Azkarate, A. Machine Learning for the Built Heritage Archaeological Study. J. Comput. Cult. Herit. 2020, 14, 1–21. [Google Scholar] [CrossRef]
- Hatir, M.E.; Barstuğan, M.; Ince, I. Deep learning-based weathering type recognition in historical stone monuments. J. Cult. Herit. 2020, 45, 193–203. [Google Scholar] [CrossRef]
- Ni, Z.; Liu, Y.; Karlsson, M.; Gong, S. A Sensing System Based on Public Cloud to Monitor Indoor Environment of Historic Buildings. Sensors 2021, 21, 5266. [Google Scholar] [CrossRef] [PubMed]
- Mishra, M. Machine learning techniques for structural health monitoring of heritage buildings: A state-of-the-art review and case studies. J. Cult. Herit. 2021, 47, 227–245. [Google Scholar] [CrossRef]
- Mansuri, L.E.; Patel, D. Artificial intelligence-based automatic visual inspection system for built heritage. Smart Sustain. Built Environ. 2022, 11, 622–646. [Google Scholar] [CrossRef]
Figure 1.
(a) Publications in WoS from January 2013 to September 2023; (b) Publications in Scopus from January 2013 to September 2023. Own elaboration based on data from WoS and Scopus.
Figure 1.
(a) Publications in WoS from January 2013 to September 2023; (b) Publications in Scopus from January 2013 to September 2023. Own elaboration based on data from WoS and Scopus.

Figure 2.
(a) Links of authorship between four authors and three publications; (b) co-authorship networks constructed using fractional counting (above) or full counting (below). Own elaboration based on Van Eck & Waltman [21].
Figure 2.
(a) Links of authorship between four authors and three publications; (b) co-authorship networks constructed using fractional counting (above) or full counting (below). Own elaboration based on Van Eck & Waltman [21].

Figure 3.
(a) Most cited authors in WoS from January 2013 to September 2023; (b) most cited authors in Scopus from January 2013 to September 2023. Own elaboration based on data from WoS and Scopus.
Figure 3.
(a) Most cited authors in WoS from January 2013 to September 2023; (b) most cited authors in Scopus from January 2013 to September 2023. Own elaboration based on data from WoS and Scopus.

Figure 4.
(a) Authors with the most publications in WoS from January 2013 to September 2023. (b) Authors with the most publications in Scopus from January 2013 to September 2023. Own elaboration based on data from WoS and Scopus.
Figure 4.
(a) Authors with the most publications in WoS from January 2013 to September 2023. (b) Authors with the most publications in Scopus from January 2013 to September 2023. Own elaboration based on data from WoS and Scopus.

Figure 5.
(a) Most cited publications in WoS from January 2013 to September 2023 [22,23,24,25,26,27,28,29,30,31,32]; (b) most cited publications in Scopus from January 2013 to September 2023 [9,22,25,26,33,34,35,36,37,38]. Own elaboration based on data from WoS and Scopus.

Figure 6.
Visualization in VOSviewer 1.6.19 software of the formation of author groups with the highest link strength in the co-authorship network, using data from WoS.
Figure 6.
Visualization in VOSviewer 1.6.19 software of the formation of author groups with the highest link strength in the co-authorship network, using data from WoS.

Figure 7.
Visualization in VOSviewer 1.6.19 software of the formation of author groups with the highest link strength in the co-authorship network, using data from Scopus.
Figure 7.
Visualization in VOSviewer 1.6.19 software of the formation of author groups with the highest link strength in the co-authorship network, using data from Scopus.

Figure 8.
Visualization in VOSviewer 1.6.19 software of the keywords with the highest link strength in the co-occurrence network, using data from WoS.
Figure 8.
Visualization in VOSviewer 1.6.19 software of the keywords with the highest link strength in the co-occurrence network, using data from WoS.

Figure 9.
Visualization in VOSviewer 1.6.19 software of the keywords with the highest link strength in the co-occurrence network, using data from Scopus.
Figure 9.
Visualization in VOSviewer 1.6.19 software of the keywords with the highest link strength in the co-occurrence network, using data from Scopus.

Figure 10.
Overlay visualization in VOSviewer 1.6.19 software of keywords with the strongest link strength in the co-occurrence network, using WoS data. Blue points represent keywords found in older publications, green points in intermediate publications, and yellow points in more recent publications.

Figure 11.
(a) Identification of the links between the keywords “HBIM” and “Remote Sensing” with the keyword “4D Spatial Data Management” in the overlay visualization map of VOSviewer 1.6.19 software using WoS data; (b) identification of the links between the keywords “HBIM” and “Remote Sensing” with the keyword “4D Spatial Data Management” in the overlay visualization map of VOSviewer 1.6.19 software using Scopus data.

Figure 12.
(a) Identification of links between the keywords “HBIM” and “Smart Sensing”, with the keyword “Energy Performance” in the overlay visualization map of the VOSviewer 1.6.19 software, using Scopus data; (b) identification of links between the keywords “HBIM” and “Sensor Networks”, with the keyword “Energy Performance” in the overlay visualization map of the VOSviewer 1.6.19 software, using Scopus data.

Disclaimer/Publisher’s Note: The statements, opinions and data contained in all publications are solely those of the individual author(s) and contributor(s) and not of MDPI and/or the editor(s). MDPI and/or the editor(s) disclaim responsibility for any injury to people or property resulting from any ideas, methods, instructions or products referred to in the content. |
© 2024 by the authors. Licensee MDPI, Basel, Switzerland. This article is an open access article distributed under the terms and conditions of the Creative Commons Attribution (CC BY) license (https://creativecommons.org/licenses/by/4.0/).
Share and Cite
MDPI and ACS Style
Rolim, R.; López-González, C.; Viñals, M.J. Analysis of the Current Status of Sensors and HBIM Integration: A Review Based on Bibliometric Analysis. Heritage 2024, 7, 2071-2087. https://doi.org/10.3390/heritage7040098
AMA Style
Rolim R, López-González C, Viñals MJ. Analysis of the Current Status of Sensors and HBIM Integration: A Review Based on Bibliometric Analysis. Heritage. 2024; 7(4):2071-2087. https://doi.org/10.3390/heritage7040098
Chicago/Turabian StyleRolim, Renan, Concepción López-González, and María José Viñals. 2024. "Analysis of the Current Status of Sensors and HBIM Integration: A Review Based on Bibliometric Analysis" Heritage 7, no. 4: 2071-2087. https://doi.org/10.3390/heritage7040098