Citric Acid Regulated Fabrication of Macroporous TiO2

School of Materials Science and Engineering, Institute of New Catalytic Materials Science, Key Laboratory of Advanced Energy Materials Chemistry (MOE), Collaborative Innovation Center of Chemical Science and Engineering (Tianjin), Nankai University, Tianjin 300350, China
*
Author to whom correspondence should be addressed.
Surfaces 2020, 3(1), 50-60; https://doi.org/10.3390/surfaces3010006
Submission received: 1 December 2019
/
Revised: 9 January 2020
/
Accepted: 17 January 2020
/
Published: 3 February 2020
(This article belongs to the Special Issue Surface Aspects of Semiconductor Photochemistry)
Abstract
:Macroporous TiO2 monolith was prepared by a microphase separation method. After citric acid was added to the synthesis procedure, the yield of the titanium precursor has been significantly increased, and the stability of macroporous structure can be obviously enhanced. Anatase and rutile phase of TiO2 were obtained after a 550 °C and 800 °C calcination, respectively.
1. Introduction
As one of the important inorganic materials, titanium oxide, has proven to be a safe, nontoxic chemical, and TiO2 has been widely used in catalysis, optical coatings, gas sensing, lithium ion batteries [1,2,3,4,5,6,7]. Also, much attention has been paid to TiO2 because of its highly efficient photocatalytic activity [8,9,10,11]. Owing to its good chemical and physical properties, TiO2 with different morphologies and structures, such as quantuam dots, microspheres, nanorods, nanowires, nanoplate, and hierarchical 3D-microstructures have been prepared through soluthermal, sol-gel, hard-template methods [12,13,14,15,16,17,18,19,20,21,22].
It is well known that catalysts with porous structures will provide high surface area, more active site, and easy for mass transfer. TiO2 with mesoporous, macroporous and hierarchical porous structures have been reported, Wu. et al. reported a hard template method to fabricate a connected three-dimensional ordered macroporous (3DOM) materials, polystyrene (PS) colloid was used as a template in an ethanol/water mixed solution of citric acid [23]. The hard template method was further developed to synthesis a TiO2-carbon nanocomposite in a three dimensionally ordered macroporous framework with a pore-hierarchical structure [24].
In this paper, neither hard or soft templating agent was added in the synthesis procedure, nitrogen-doped titanium dioxide with microporous-macroporous multi-scale porous structure was prepared by a microphase separation method. Citric acid was used as a stabilizing agent to control the hydrolysis of butyl titanate, and the macroporous structure can be effectively stabilized. Compared with the procedure without citric acid, the macroporous morphology and structure of titanium precursor was greatly improved and the product are fully constructed by macrouprous structures. The amount of citric acid and other reaction conditions on the formation of macropores and crystalline phase were investigated. By changing the calcination temperature, crystalline anatase and rutile phases were obtained. The materials were characterized by XRD, SEM, TEM, N2 adsorption-desorption, XPS, UV-vis spectra, and photocatalytic activity.
2. Materials and Methods
2.1. Materials
Citric acid was purchased from Tianjin Ruijinte Chemical Co., Ltd, Tianjin, China. Tetrabutyl titanate was purchased from Guangfu Fine Chemical Research Institute, Tianjin, China, Ammonium hydroxide and anhydrous ethanol were purchased from Tianjin Chemical Reagent No.3 Factory. Rhodamine B (RhB) was purchased from ACROS. All reagents are analytically pure and do not require further purification.
2.2. Synthesis
A mixed solution of anhydrous ethanol and deionized water were formulated with ethanol weight percent of 95%. Different amount of citric acid was added to 40 mL of the above solution, and the mixture was stirred for 30 min. After it was sufficiently dissolved, 10 mL of concentrated aqueous ammonia was slowly added dropwise to the mixture to form a white flocculent precipitate. After stirring well, the stirring speed was slowed down, and another 10 mL of concentrated ammonia water was added dropwise at a constant rate, and the precipitate gradually dissolved. Then, 6 mL of butyl titanate was added dropwise to the reaction system, the stirring was stopped, and the mixture stayed for another 12 h. After centrifugation, the product was thoroughly washed with deionized water, absolute ethanol, and dried at 60 °C for 24 h.
The obtained product was calcined at 350 °C, 550 °C, and 800 °C for 4 h, respectively.
2.3. Characterization
The crystal structure of the sample was characterized by Rigaku D/Max-2500 diffraction analyzer (San Jose, CA, USA), Cu Kα1 (1.5406 Å) radiation operated at 40 kV, 10–70°, scanning speed 4°/min. The morphology of the sample was observed by SHIMADZU SS-550 scanning electron microscope (Shimadzu Corporation, Kyoto, Japan) at 5 keV. The morphology, elemental distribution, and lattice information of the samples were obtained by field emission transmission electron microscopy (FE-TEM, JEM-2800, JEOL, Tokyo, Japan), attachments in transmission electron microscopy (Energy Dispersive Spectrdmeter). UV-vis spectrum was recorded on SHIMADZU UV-2450 (Shimadzu Corporation, Kyoto, Japan). N2 adsorption–desorption isotherms were measured on a BELSORP-mini surface analyzer (Mercer Instruments, Passy, France) at liquid nitrogen temperature (77 K). The samples were degassed at 250 °C for 4 h prior to the measurement. The surface area was obtained by the Brunauer–Emmett–Teller (BET) method, and pore size distribution was calculated from the adsorption branch of the isotherm by the Barret–Joyner–Halenda (BJH) model. The surface composition of the samples are determined by X-ray photoelectron spectroscopy (XPS, Thermo Scientific ESCALAB 250Xi, Thermofisher scientific, Waltham, MA, USA).
2.4. Photocatalytic Performance
Rhodamine B (RB) is a typical representative of organic dye contaminants in water [7]. It is used to detect the photocatalytic activity of TiO2 under ultraviolet light.
In a typical photocatalytic experiment, 20 mg catalyst was well dispersed into 100 mL RB (10–5 M) solution, no ultrasonic dispersion is used because the ultrasonic pre-treatment will destroy the macroporous structure of the catalyst. In the catalytic reactor, the cooling water was passed through the quartz tube to make sure the reaction will not be disturbed by the reaction temperature. Firstly, the RB solution with/without catalyst was magnetically stirred in the dark for 30 min to allow an adsorption/desorption equilibrium. Then, a 150 W mercury lamp (central wavelength of 325 nm) was turned on and off every 20 min. In each single stop, the supernatant was centrifuged (8000 r/min, 15 min), and measured by an ultraviolet-visible spectrophotometer at λ = 552 nm, using deionized water as reference. The concentration of the RB solution at a certain time can be determined from the calibration curve. The conversion rate of RB at each time was calculated as X = (C0 − C)/C0.
In order to determine the durability and stability of the photocatalyst, a recycle test for photodegradation was also carried out.
3. Results and Discussion
3.1. Macroporous TiO2
The shape and size of the obtained precursor were investigated by SEM observation. Figure 1 shows the SEM image of the precursor prepared through the microphase separation method, without the addition of citric acid in the raw material. It can be seen that the product is composed of lots of blocks in micrometer size with irregular shapes, and higher magnification picture shows that few of the blocks incompletely formed porous structure (Figure 1b), which shows that the precursor has a tendency to form three-dimensional macroporous pores in ethanol/water solution, but does not form a stable macroporous pore structure in a wide range. If 0.32 g of citric acid was added to the original mixture (see Figure 1c,d), the obtained product has a macroporous structure with high yield, the macropores are long and narrow, with macropores of 1–8 μm. The macroprous monolith exhibits a cylindrical channel parallel to each other, perpendicular to the surface of the monolith. It can be seen that only one side of the parallel porous channel is open, the other end of the channel is closed.
The crystal structure of all samples was determined by powder X-ray diffraction. Figure 2 is an X-ray diffraction (XRD) pattern of the sample before calcination and after calcination at different temperatures. In the XRD pattern, the titanium precursor showed no diffraction peaks, indicating that the uncalcined titanium precursor was amorphous. If the precursor was calcined at 350 °C for 4 h, a crystalline titanium oxide was obtained. As shown in Figure 3b, it is a typical anatase phase (JCPDS 21-1272), and the diffraction peak appeared broad, indicating poor crystallinity of the TiO2-350. The diffraction peak of the product obtained by calcination at 550 °C is still a typical anatase phase (JCPDS 21-1272), and the peak shape is sharper, indicating that the obtained product is a highly crystalline anatase phase. IF the precursor was further treated by a high temperature calcination, 800 °C for 4 h, the obtained product shows a highly crystalline rutile phase (JCPDS 34-0180). The crystallite size of the calcinated TiO2 samples were calculated, for TiO2-350, the size of the particle is calculated as D (101) = 13 nm, if the calcination temperature is 550 °C, the crystallite size is about D (101) = 21 nm. For TiO2-800, the average particles size is about D (110) = 52 nm.
The morphology and microstructure of the calcined titanium oxide were further evidenced by SEM and TEM images (Figure 3). From the SEM images, it can be seen that the macroporous structure was well inherited, even after a high temperature 800 °C calcination. High magnification SEM images show that the pore wall of the macropores was constructed by aggregations of nanoparticles.
The physico-chemical adsorption properties and pore parameters of the porous titania product were studied by N2 adsorption-desorption (Figure 4). Before calcination, titanium precursor has type I adsorption isotherm (Figure 4a), without a significant hysteresis loop, and the resulting product is presumed to contain micropores. The Brunaure-Emmett-Teller specific surface area of the precursor is 247 m2/g, and the BJH pore size distribution showed an average pore diameter of 1.7 nm, which belongs to ultramicropores (1–2 nm). Therefore, it is speculated that the macroporous material contains micropores and mesopores, having a relatively wide pore size distribution. Since no templating agent is used in the synthesis process, it is speculated that the obtained micropores and mesopores are irregular pores formed by the accumulation of amorphous titanium dioxide particles or the gaps between the particles, and the pore size of the pores should be relatively wide.
The type of adsorption isotherm (see Figure 4b) of the sample calcined at 550 °C can still be attributed to the Langmuir Type I adsorption isotherm, with a hysteresis loop. It is speculated that during the crystallization of anatase, the growth of titanium dioxide crystals causes the microporous/mesoporous structure formed by the particles to be deformed and partially damaged. The BET specific surface area was reduced to 48.8 m2/g. The hysteresis ring appears at a relative pressure of about 0.4, indicating the presence of mesopores, and the BJH pore size distribution in the mesoporous region has a wide range, and the average BJH pore diameter is 4.6 nm.
After calcination at 800 °C, the isotherm (see Figure 4c) is completely incompatible with the standard classification of IUPAC adsorption isotherms. The hysteresis loop in the region with higher relative pressure may be the structure of its macropores and mesopores, there is no more micropores contained in TiO2-800. The BET specific surface area of the product after calcination at 800 °C was suddenly reduced to 17 m2/g, which also confirmed that the microporous in the product had disappeared after calcination at a high temperature of 800 °C. BJH pore size distribution in the mesoporous region has a wide range from 3–10 nm. We can speculate that in the high-temperature crystal transformation process, the macro- and mesopores formed by the particle accumulation are retained, micropores were completely destroyed due to the growth of the crystal particles.
3.2. Effect of Citric Acid on the Formation of Macroporous Structure
In order to investigate the effect of citric acid on the formation of macroporous structure, the addition amount of citric acid was adjusted. When a certain amount of citric acid is added, the product forms a stable macroporous structure with a relatively high yield and a regular morphology (see Figure 5). When the amount of citric acid added to the reaction system increases to 0.72 g (Figure 5a,b), the closed end of the pores becomes extremely thin, many of the pores are converted into fully connected, and the dimeter of the macropores become more uniform. The arrangement of the macropore is more tight and tidy. When the amount of citric acid kept increasing to 1.8 g (Figure 5c,d), the yield of the macroporous structure was obviouly lowered, although neatly dense macropores were also retained. When the citric acid added to the reaction system was increased to 3.59 g (Figure 5e,f), almost no macroporous structure was found in the observation range, and instead some large pieces and blocks constructed by small particles were obtained.
By adding different amounts of citric acid to the product, we can infer that the addition of a small amount of citric acid in the reaction system is beneficial to stabilize and optimize the macroporous structure of titanium dioxide, when the added citric acid is increased to about 0.72 g (i.e., the mole ratio of citric acid to titanium is 0.1), the large pore structure of titanium precursor with the highest mass yield is obtained. However, the mechanical stability of macroporous structure was poor. Further increasing the amount of citric acid causes the macroporous structure to gradually collapse. When the molar amount of citric acid is about 0.2 times that of the titanium source, the yield of macroporous titanium dioxide is significantly reduced; when the molar amount of citric acid reaches 0.5 times of the titanium source amount, no more macroprous structure can be observed in the product. This phenomenon may be caused by the presence of excess citric acid in the solution to destroy the conditions of macropore formation, such as pH value, or may be due to the large amount of ammonium citrate formed by the exceed addition of citric acid in the reaction system. The flocculent precipitate destroys the equilibrium of the reaction system and introduces more impurities.
Citric acid molecule is a ligand with multiple ligands, one hydroxyl group and three carboxyl groups. Citric acid (CA) has shown special abilities for creating mesoporous materials as organic additives in the sol–gel process [25,26,27,28]. For example, Liu Gang obtained amorphous mesoporous aluminophosphate materials (AlPO) with relatively high specific surface areas, narrow pore size distributions and excellent thermally stabilities. This method can be further extended to fabricate metal oxide. Porous nanometer nickel oxides with high surface area was fabricated through a CA involved sol-gel way. Thermally stable mesoporous anatase-nanocrystal framework was reported by a citric acid assisted templating method.
In our report, if citric acid is added to the precursor solution of titanium dioxide, citric acid will form a certain degree of complexation with titanium, so that the titanium dioxide precursor is highly dispersed in the organic ligand network. That is to say, the addition of citric acid would change the transition history of the precursor to the oxide and avoids the occurrence of agglomeration. Although we have no more understanding on the dynamics of various citrate microstructures, physicochemical properties, and thermal decomposition microscopic processes, the above experiments have confirmed the good coordination effect of citric acid, avoiding the formation of large agglomerated particles by the polycondensation reaction of hydrates during the formation of titanium macroporous precursors, which plays a very good role in stabilizing the macroporous framework.
3.3. Photocatlytic Activity of Macroporous TiO2 with Different Crystalline Strcuture, (a) P25, (b) TiO2-550, (c) TiO2-800
From the UV-visible diffuse reflection absorption spectrum, it can be clearly observed that P25 showed strong absorption in the UV region with an absorption edge at around 400 nm. The absorption edge of TiO2-550 and TiO2-800 were slightly red-shifted. For TiO2-550, the difference could be ascribed to the lower amount of nitrogen incorporated, as revealed by EDS spectra (Figure 6c). For TiO2-800, the difference could be ascribed to two reasons. The first one is the different crystal phase, where TiO2-800 was a rutile TiO2, rutile phase usually shows a smaller band gap than anatase phase. However, for TiO2-800, it is still a red-shifted compared to pure rutile phase, this can also be attributed to a nitrogen doping effect. EDS spectra confirmed that N1s also existed in TiO2-800 (Figure 6d). During the synthesis of TiO2, ammonia was not only used as a precipitant, but also can provide nitrogen resources to produce a nitrogen-doped TiO2. Simultaneously, since the size of TiO2-550 is much smaller than TiO2-800, the nano-effect could also contribute to the blue shift. The band gap value of the catalyst is calculated according to the UV-vis spectra. By calculation, the band gap value of the catalyst is calculated according to the UV-vis spectra. By calculation, the bandgap energy of P25 is about 3.15 eV, TiO2-550 is about 2.93 eV, while that of TiO2-800 is about 2.73 eV.
As a typical water pollution agent, RB has been widely used in the photocatalytic reaction to evaluate the activity of photocatalyst. The photocatalytic test was performed under ultraviolet light irradiation with/without photocatalysts. In the blank control experiment, without any catalyst in the RB solution, the degradation of RB is slow as the reaction time increases. Only 14.3% of RB was degraded after a 20 min explosion of UV light. For macroporous TiO2-550, the conversion of RB reached 16.4% at the first 20 minutes’ irradiation. The photocatalytic activity in the first 20 min for TiO2-550 is almost the same as that of the blank control, but it is quite different from the other catalysts. As a comparison, the photocatalytic activity of P25 under same condition was also investigated. As is shown in Figure 7, TiO2-800 exhibits a much higher photocatalytic activity (75% removal of RB in the first 20 min), similar with that of P25. After 40 min, the RBs catalyzed by P25 and macroporous rutile materials were substantially degraded.
Since the N2 adsorption results have been shown to have been destroyed by high temperature calcination at 550 °C and 800 °C, the micropores structures accumulated in the titanium dioxide material have been destroyed, so there is basically no existence of micropores. The product contains large macropores with a pore size of several micrometers visible in SEM, and some mesopores existed between the nanoparticles aggregation, as observed in TEM. The adsorption of the dye molecules by the photocatalyst could be ignored, it can be inferred that decolorization reaction of the dye solution is the result of photocatalytic degradation.
The photocatalytic activity mainly depends on three aspects: the absorption rate of light, the reaction efficiency of photogenerated electron/hole pairs, and the recombination rate of electron/hole pairs. An important factor affecting the light absorption rate is the pore wall structure of the catalyst. Ultraviolet light decays rapidly with its propagation in the medium. Ultraviolet light with a wavelength of 320 nm is propelled by 8.5 um in titanium dioxide solids, and its intensity is attenuated to 10% of the original intensity. In this experiment, the cylindrical straight channel of macroporous titania provides an optical path for the photon stream to enter the inner surface of the catalyst. The macroporous structure causes light waves to be injected into the inner layer of the catalyst, which enhances the light absorption efficiency and greatly improves the catalytic efficiency of the photocatalyst.
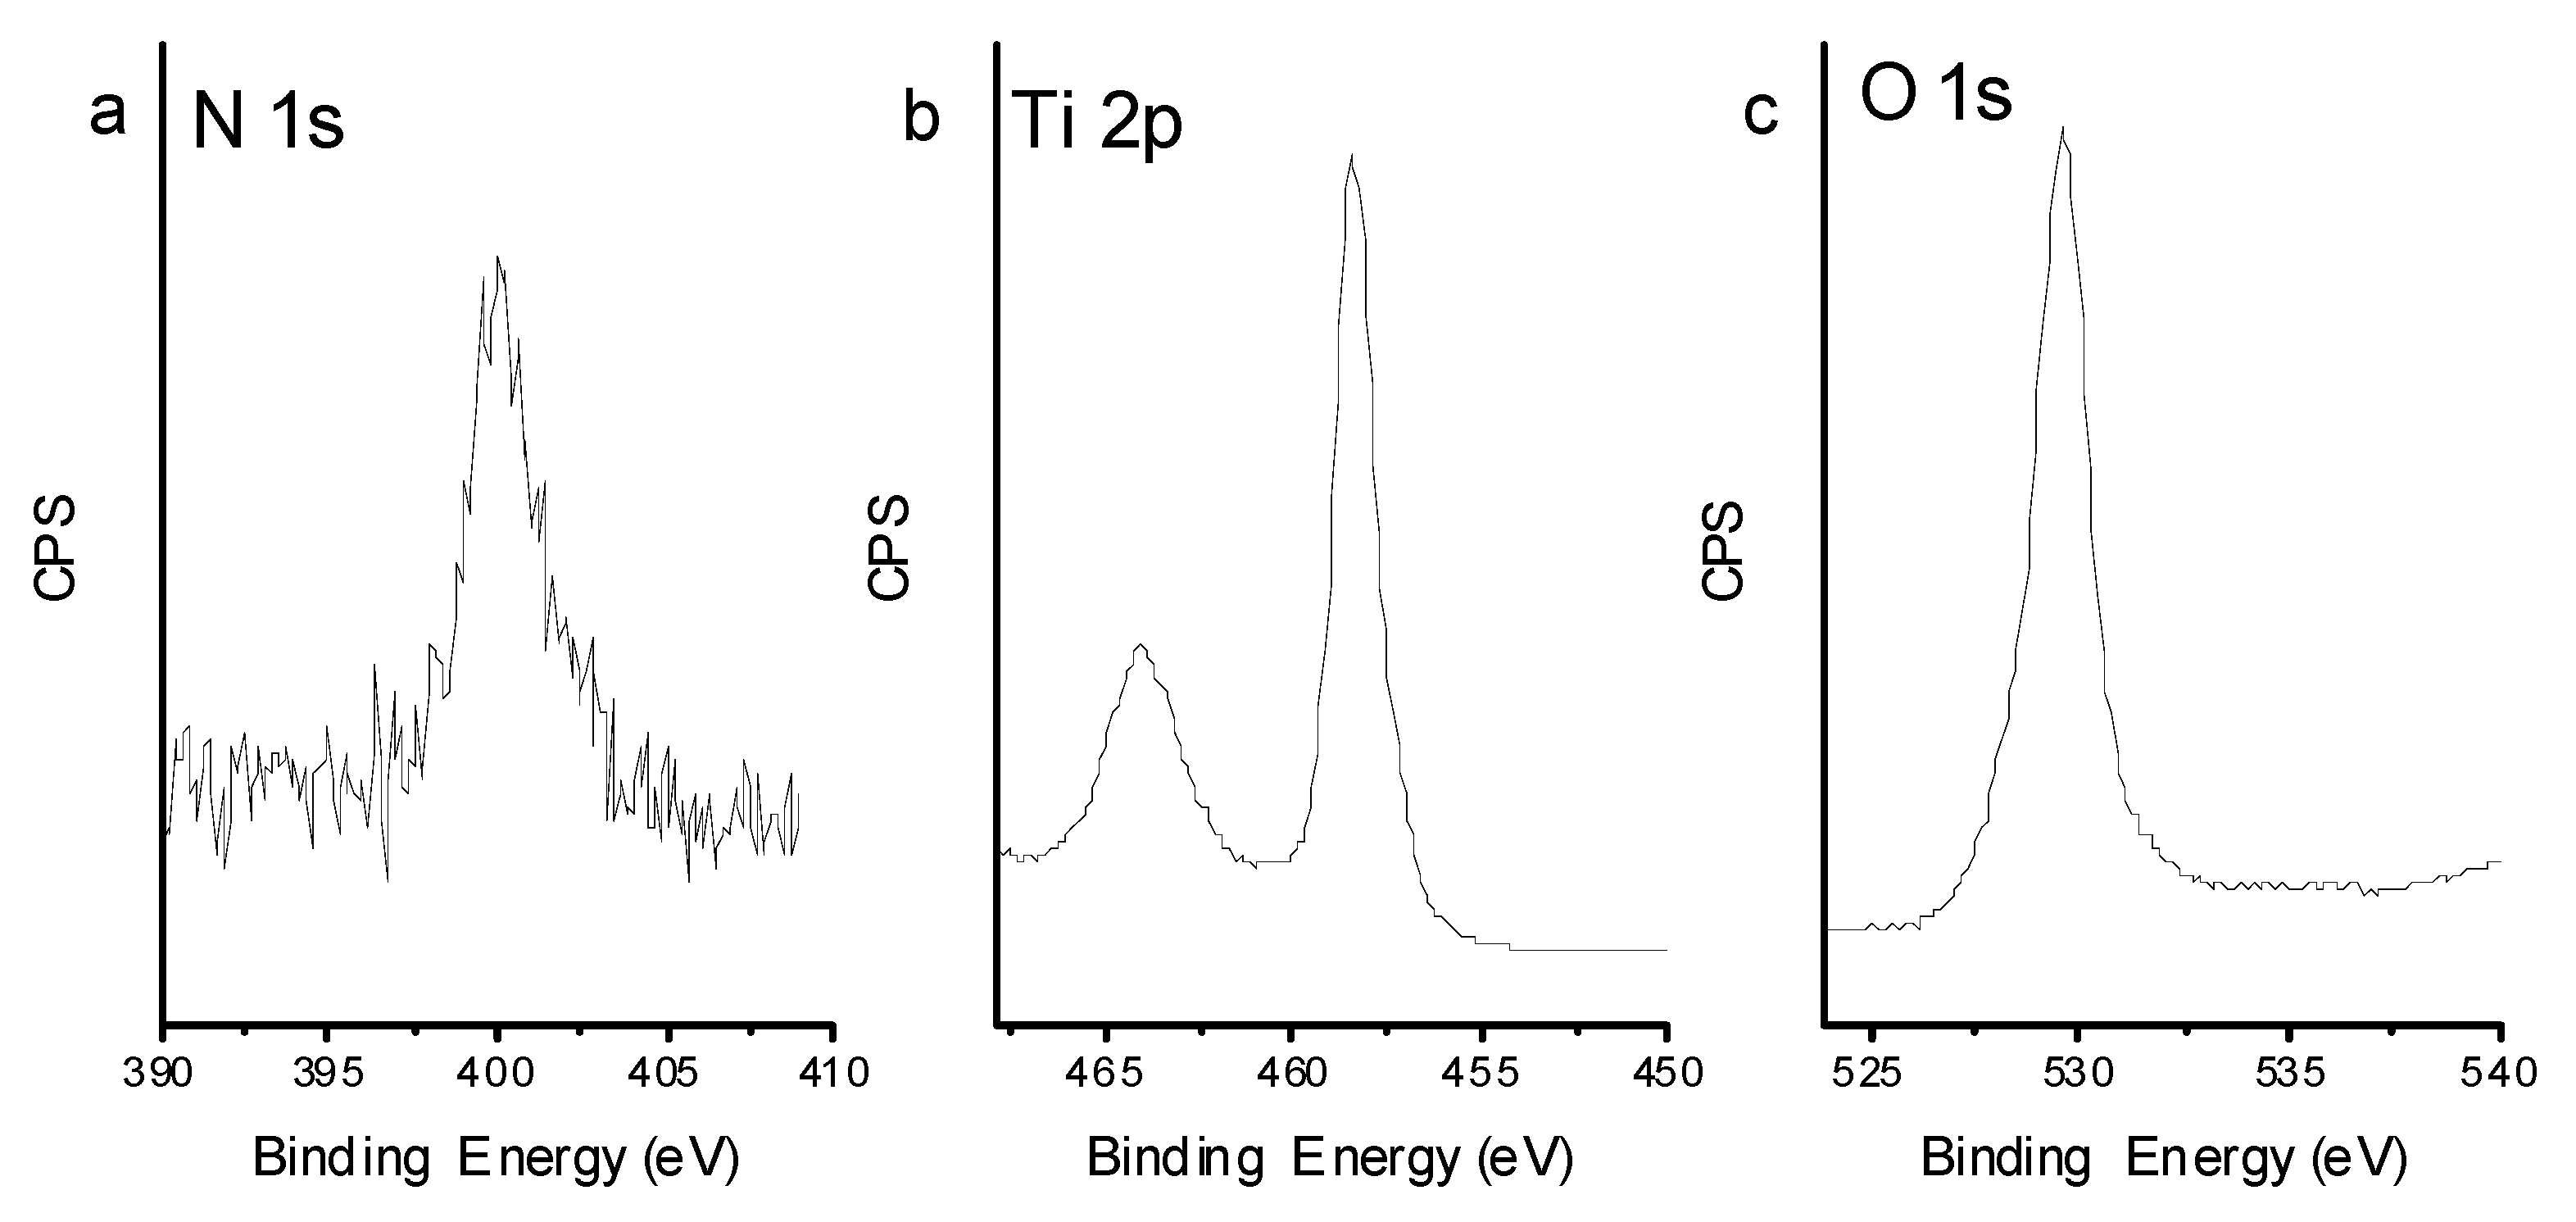
According to the XPS results (see Figure 8), the binding energies of Ti 2p3/2 and Ti 2p1/2 are 458.4 eV and 464.1 eV, respectively. The binding energy of O1s is 529.6 eV. There was a single peak in N1s spectrum for TiO2-800, 399.4 eV, which is greater than the binding energy of N1s in TiN and smaller than the binding energy of N1s in NaNO3. N1s binding energy at 399.4 eV is 0.6 eV higher from the standard binding energy of N1s in NH3 (398.8 eV), which is the only nitrogen source in this experiment. Due to the existence of a large amount of oxygen with higher electronegativity than nitrogen in the crystal lattice of TiO2-800, the electron density decreases and the binding energy of N1s increases. It can be concluded that nitrogen atom in the product may exist as O-Ti-N. Numerous efforts have been devoted to achieving higher separation efficiency through nanostructure engineering, doping strategy, surface treatment, and junction-structure modification [28,29,30]. In this report, ammonia was used as a doping element to get a N-doped TiO2, which can extend the photoresponsed range and further enhance the photocatalytic activity. The experimental results demonstrated that this modified nitrogen doped rutile TiO2 sample exhibits enhanced absorption in visible region and may induce efficient charge separation and transport. As a result, the unique nitrogen surface (TiO2–x:N) enhance the photocatalytic RhB degradation.
4. Conclusions
We reported a citric stabilized preparation of microporous-macroporous titanium dioxide. The experimental results show that the product can hardly form regular macroporous channels without the addition of citric acid. Under the same reaction conditions, when certain amount of citric acid was added, the titanium precursor exhibits a large range of macroporous structure. When the amount of citric acid added is about 0.36 g, the yield of a stable macroporous structure is the highest. After calcination at different temperatures, nitrogen-doped macroporous titanium oxide of rutile and anatase phases were obtained. Compared with P25, both of the rutile and the anatase phase macroporous TiO2 showed good catalytic activity for photocatalytic degradation of RB.
Author Contributions
X.Z., R.C. and N.S. performed the experiments. R.C. Wrote the manuscript. T.C. took part in data analysis. All authors have read and agreed to the published version of the manuscript.
Funding
This work was supported by NSFC (no. 21373116) of China.
Conflicts of Interest
The authors declare no conflict of interest.
References
- Chen, X.B.; Burda, C. The Electronic Origin of the Visible-Light Absorption Properties of C-, N- and S-Doped TiO2 Nanomaterials. J. Am. Chem. Soc. 2008, 130, 5018–5019. [Google Scholar] [CrossRef] [PubMed]
- Chen, X.B.; Liu, L.; Huang, F.Q. Black Titanium Dioxide (TiO2) Nanomaterials. Chem. Soc. Rev. 2015, 44, 1861–1885. [Google Scholar] [CrossRef] [PubMed]
- Thompson, T.L.; Yates, J.T. Surface Science Studies of the Photoactivation of TiO2 New Photochemical Processes. Chem. Rev. 2006, 106, 4428–4453. [Google Scholar] [CrossRef] [PubMed]
- Zhang, J.; Xu, Q.; Feng, Z.C.; Li, M.J.; Li, C. Importance of the Relationship Between Surface Phases and Photocatalytic Activity of TiO2. Angew. Chem. Int. Ed. 2008, 47, 1766–1769. [Google Scholar] [CrossRef]
- Gutierrez, J.; Tercjak, A.; Mondragon, I. Conductive Behavior of High TiO2 Nanoparticle Content of Inorganic/Organic Nanostructured Composites. J. Am. Chem. Soc. 2010, 132, 873–878. [Google Scholar] [CrossRef]
- Kwon, D.H.; Kim, K.M.; Jang, J.H.; Jeon, J.M.; Lee, M.H.; Kim, G.H.; Li, X.S.; Park, G.S.; Lee, B.; Han, S.; et al. Atomic Structure of Conducting Nanofilaments in TiO2 Resistive Switching Memory. Nat. Nanotechnol. 2010, 5, 148–153. [Google Scholar] [CrossRef]
- Bavykin, D.V.; Friedrich, J.M.; Walsh, F.C. Protonated Titanates and TiO2 Nanostructured Materials: Synthesis, Properties, and Applications. Adv. Mater. 2006, 18, 2807–2824. [Google Scholar] [CrossRef]
- Fujishima, A.; Zhang, X.; Tryk, D. TiO2 Photocatalysis and Related Surface Phenomena. Surf. Sci. Rep. 2008, 63, 515–582. [Google Scholar] [CrossRef]
- Khan, M.M.; Ansari, S.A.; Pradhan, D.; Ansari, M.O.; Han, D.H.; Lee, J.; Cho, M.H. Band Gap Engineered TiO2 Nanoparticles for Visible Light Induced Photoelectrochemical and Photocatalytic Studies. J. Mater. Chem. A 2014, 2, 637–644. [Google Scholar] [CrossRef]
- Li, W.; Wu, Z.X.; Wang, J.X.; Elzatahry, A.A.; Zhao, D.Y. A Perspective on Mesoporous TiO2 Materials. Chem. Mater. 2014, 26, 287–298. [Google Scholar] [CrossRef]
- Schneider, J.; Matsuoka, M.; Takeuchi, M.; Zhang, J.; Horiuchi, Y.; Anpo, M.; Bahnemann, D.W. Understanding TiO2 Photocatalysis: Mechanisms and Materials. Chem. Rev. 2014, 114, 9919–9986. [Google Scholar] [CrossRef] [PubMed]
- Tian, J.; Zhao, Z.H.; Kumar, A.; Boughton, R.I.; Liu, H. Recent Progress in Design, Synthesis, and Applications of One-dimensional TiO2 Nanostructured Surface Heterostructures: A review. Chem. Soc. Rev. 2014, 43, 6920–6937. [Google Scholar] [CrossRef] [PubMed]
- Yuan, Z.Y.; Ren, T.Z.; Azioune, A.; Pireaux, J.J.; Su, B.L. Self-Assembly of Hierarchically Mesoporous−Macroporous Phosphated Nanocrystalline Aluminum (Oxyhydr)oxide Materials. Chem. Mater. 2006, 18, 1753–1767. [Google Scholar] [CrossRef]
- Shi, M.M.; Bao, D.; Wulan, B.R.; Li, Y.H.; Zhang, Y.F.; Yan, J.M.; Jiang, Q. Au Sub-Nanoclusters on TiO2 toward Highly Efficient and Selective Electrocatalyst for N2 Conversion to NH3 at Ambient Conditions. Adv. Mater. 2017, 29, 1606550. [Google Scholar] [CrossRef] [PubMed]
- Choi, H.; Sofranko, A.C.; Dionysiou, D.D. Nanocrystalline TiO2 Photocatalytic Membranes with a Hierarchical Mesoporous Multilayer Structure: Synthesis, Characterization, and Multifunction. Adv. Funct. Mater. 2006, 16, 1067–1074. [Google Scholar] [CrossRef]
- Kandiel, T.A.; Dillert, R.; Feldhoff, A.; Bahnemann, D.W. Direct Synthesis of Photocatalytically Active Rutile TiO2 Nanorods Partly Decorated with Anatase Nanoparticles. J. Phys. Chem. C 2010, 114, 4909–4915. [Google Scholar] [CrossRef]
- Kim, S.H.; Cho, Y.S.; Jeon, S.J.; Eun, T.H.; Yi, G.R.; Yang, S.M. Microspheres with Tunable Refractive Index by Controlled Assembly of Nanoparticles. Adv. Mater. 2008, 20, 3268–3273. [Google Scholar] [CrossRef]
- Li, H.X.; Bian, Z.F.; Zhu, J.; Zhang, D.Q.; Li, G.S.; Huo, Y.N.; Li, H.; Lu, Y.F. Mesoporous Titania Spheres with Tunable Chamber Stucture and Enhanced Photocatalytic Activity. J. Am. Chem. Soc. 2007, 129, 8406–8407. [Google Scholar] [CrossRef]
- Song, X.F.; Gao, L. Fabrication of Hollow Hybrid Microspheres Coated with Silica/Titania via Sol−Gel Process and Enhanced Photocatalytic Activities. J. Phys. Chem. C 2007, 111, 8180–8187. [Google Scholar] [CrossRef]
- Wang, M.Y.; Wang, C.L.; Xie, K.P.; Sun, L.; Lin, C.J. Fabrication of a Sponge like Nanostructured TiO2 Film and Its Photocatalytic Activity. Acta Phys. Chim. Sin. 2009, 25, 2475–2480. [Google Scholar]
- Xu, P.C.; Liu, Y.; Wei, J.H.; Xiong, R.; Pan, C.X.; Shi, J. Solvothermal Preparation of Ag/TiO2 Nanoparticles and Their Photocatalytic Activity. Acta Phys. Chim. Sin 2010, 26, 2261–2266. [Google Scholar]
- Yu, J.G.; Su, Y.R.; Cheng, B. Template-Free Fabrication and Enhanced Photocatalytic Activity of Hierarchical Macro-/Mesoporous Titania. Adv. Funct. Mater. 2007, 17, 1984–1990. [Google Scholar] [CrossRef]
- Wu, Q.Z.; Shen, Y.; Liao, J.F.; Li, Y.G. Synthesis and Characterization of Three-dimensionally Ordered Macroporous Rare Earth Oxides. Mater. Lett. 2004, 58, 2688–2691. [Google Scholar] [CrossRef]
- Song, L.H.; Li, L.; Gao, X.; Zhao, J.X.; Lu, T.; Liu, Z. A Facile Synthesis of a Uniform Constitution of Three-Dimensionally Ordered Macroporous TiO2–carbon Nanocomposites with Hierarchical Pores for Lithium Ion Batteries. J. Mater. Chem. A 2015, 3, 6862–6872. [Google Scholar] [CrossRef]
- Fan, Y.; Bao, X.J.; Lin, X.Y.; Shi, G.; Liu, H.Y. Acidity Adjustment of HZSM-5 Zeolites by Dealumination and Realumination with Steaming and Citric Acid Treatments. J. Phys. Chem. B 2006, 110, 15411–15416. [Google Scholar] [CrossRef]
- Shen, X.Q.; Zhou, J.X.; Jing, M.X.; Shen, Y.J. Nanosized Nickel Oxides Derived from the Citrate Gel Process and Performances for Electrochemical Capacitors. J. Wuhan Univ. Technol. Mater. Sci. Ed. 2007, 22, 179–182. [Google Scholar] [CrossRef]
- Liu, G.; Jia, M.J.; Zhou, Z.; Zhang, W.X.; Wu, T.H.; Jiang, D.Z. Synthesis of Amorphous Mesoporous Aluminophosphate Materials with High Thermal Stability Using a Citric Acid Route. Chem. Commun. 2004, 1660. [Google Scholar] [CrossRef]
- Delekar, S.; Yadav, H.; Achary, S.N.; Meena, S.S.; Pawar, S. Structural Refinement and Photocatalytic Activity of Fe-doped Anatase TiO2 Nanoparticles. Appl. Surf. Sci. 2012, 263, 536–545. [Google Scholar] [CrossRef]
- Yadav, H.M.; Otari, S.V.; Koli, V.B.; Mali, S.S.; Hong, C.K.; Pawar, S.H.; Delekar, S.D. Preparation and Characterization of Copper-doped Anatase TiO2 Nanoparticles with Visible Light Photocatalytic Antibacterial Activity. J. Photochem. Photobiol. A Chem. 2014, 280, 32–38. [Google Scholar] [CrossRef]
- Gao, C.M.; Wei, T.; Zhang, Y.Y.; Song, X.H.; Huan, Y.; Liu, H.; Zhao, M.W.; Yu, J.H.; Chen, X.D. A Photoresponsive Rutile TiO2 Heterojunction with Enhanced Electron-Hole Separation for High-Performance Hydrogen Evolution. Adv. Mater. 2019, 31, 1806596. [Google Scholar] [CrossRef]
Figure 1.
SEM images of titanium precursor prepared (a,b) without the addition of citric acid, (c,d) with 0.32 g citric acid.
Figure 1.
SEM images of titanium precursor prepared (a,b) without the addition of citric acid, (c,d) with 0.32 g citric acid.

Figure 2.
XRD patterns of titanium samples, (a) titanium precursor, (b) TiO2-350, (c) TiO2-550, (d) TiO2-800.
Figure 2.
XRD patterns of titanium samples, (a) titanium precursor, (b) TiO2-350, (c) TiO2-550, (d) TiO2-800.
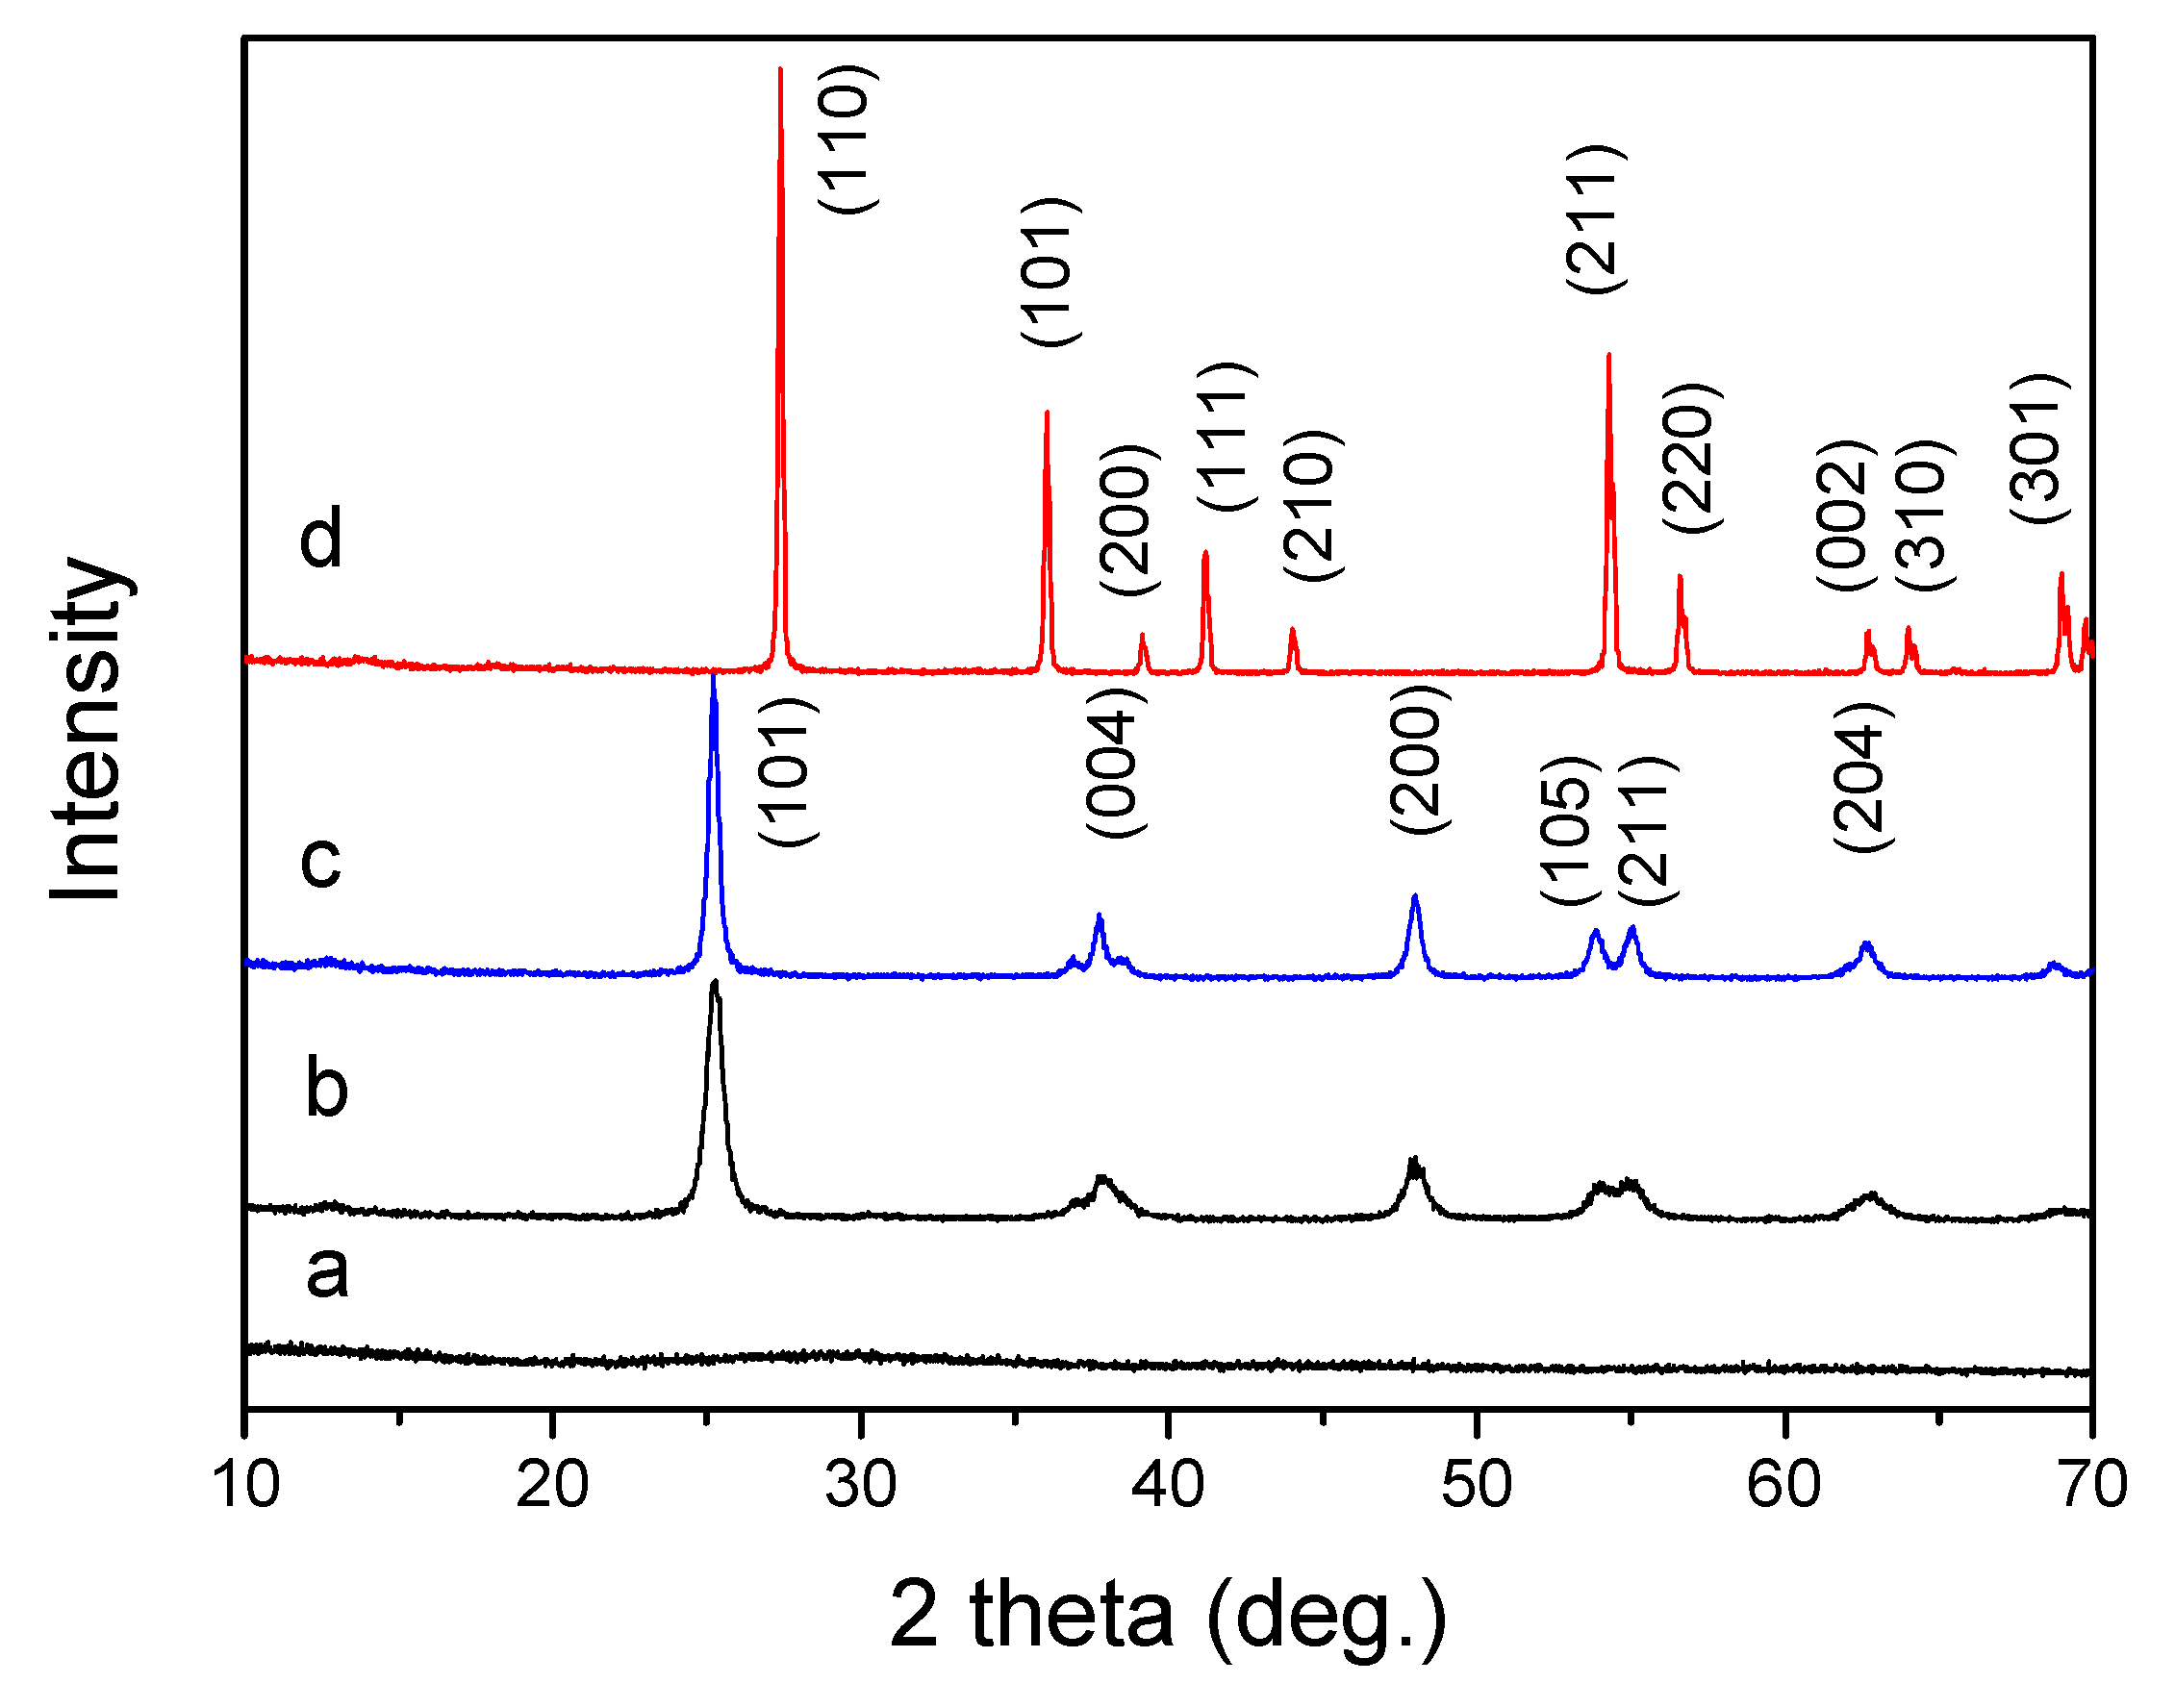
Figure 3.
(a,b) SEM images of titanium oxide obtained by thermal decomposition at 800 °C TiO2-800. (c,d) TEM imaged of TiO2-550. (e,f) TEM imaged of TiO2-800.
Figure 3.
(a,b) SEM images of titanium oxide obtained by thermal decomposition at 800 °C TiO2-800. (c,d) TEM imaged of TiO2-550. (e,f) TEM imaged of TiO2-800.
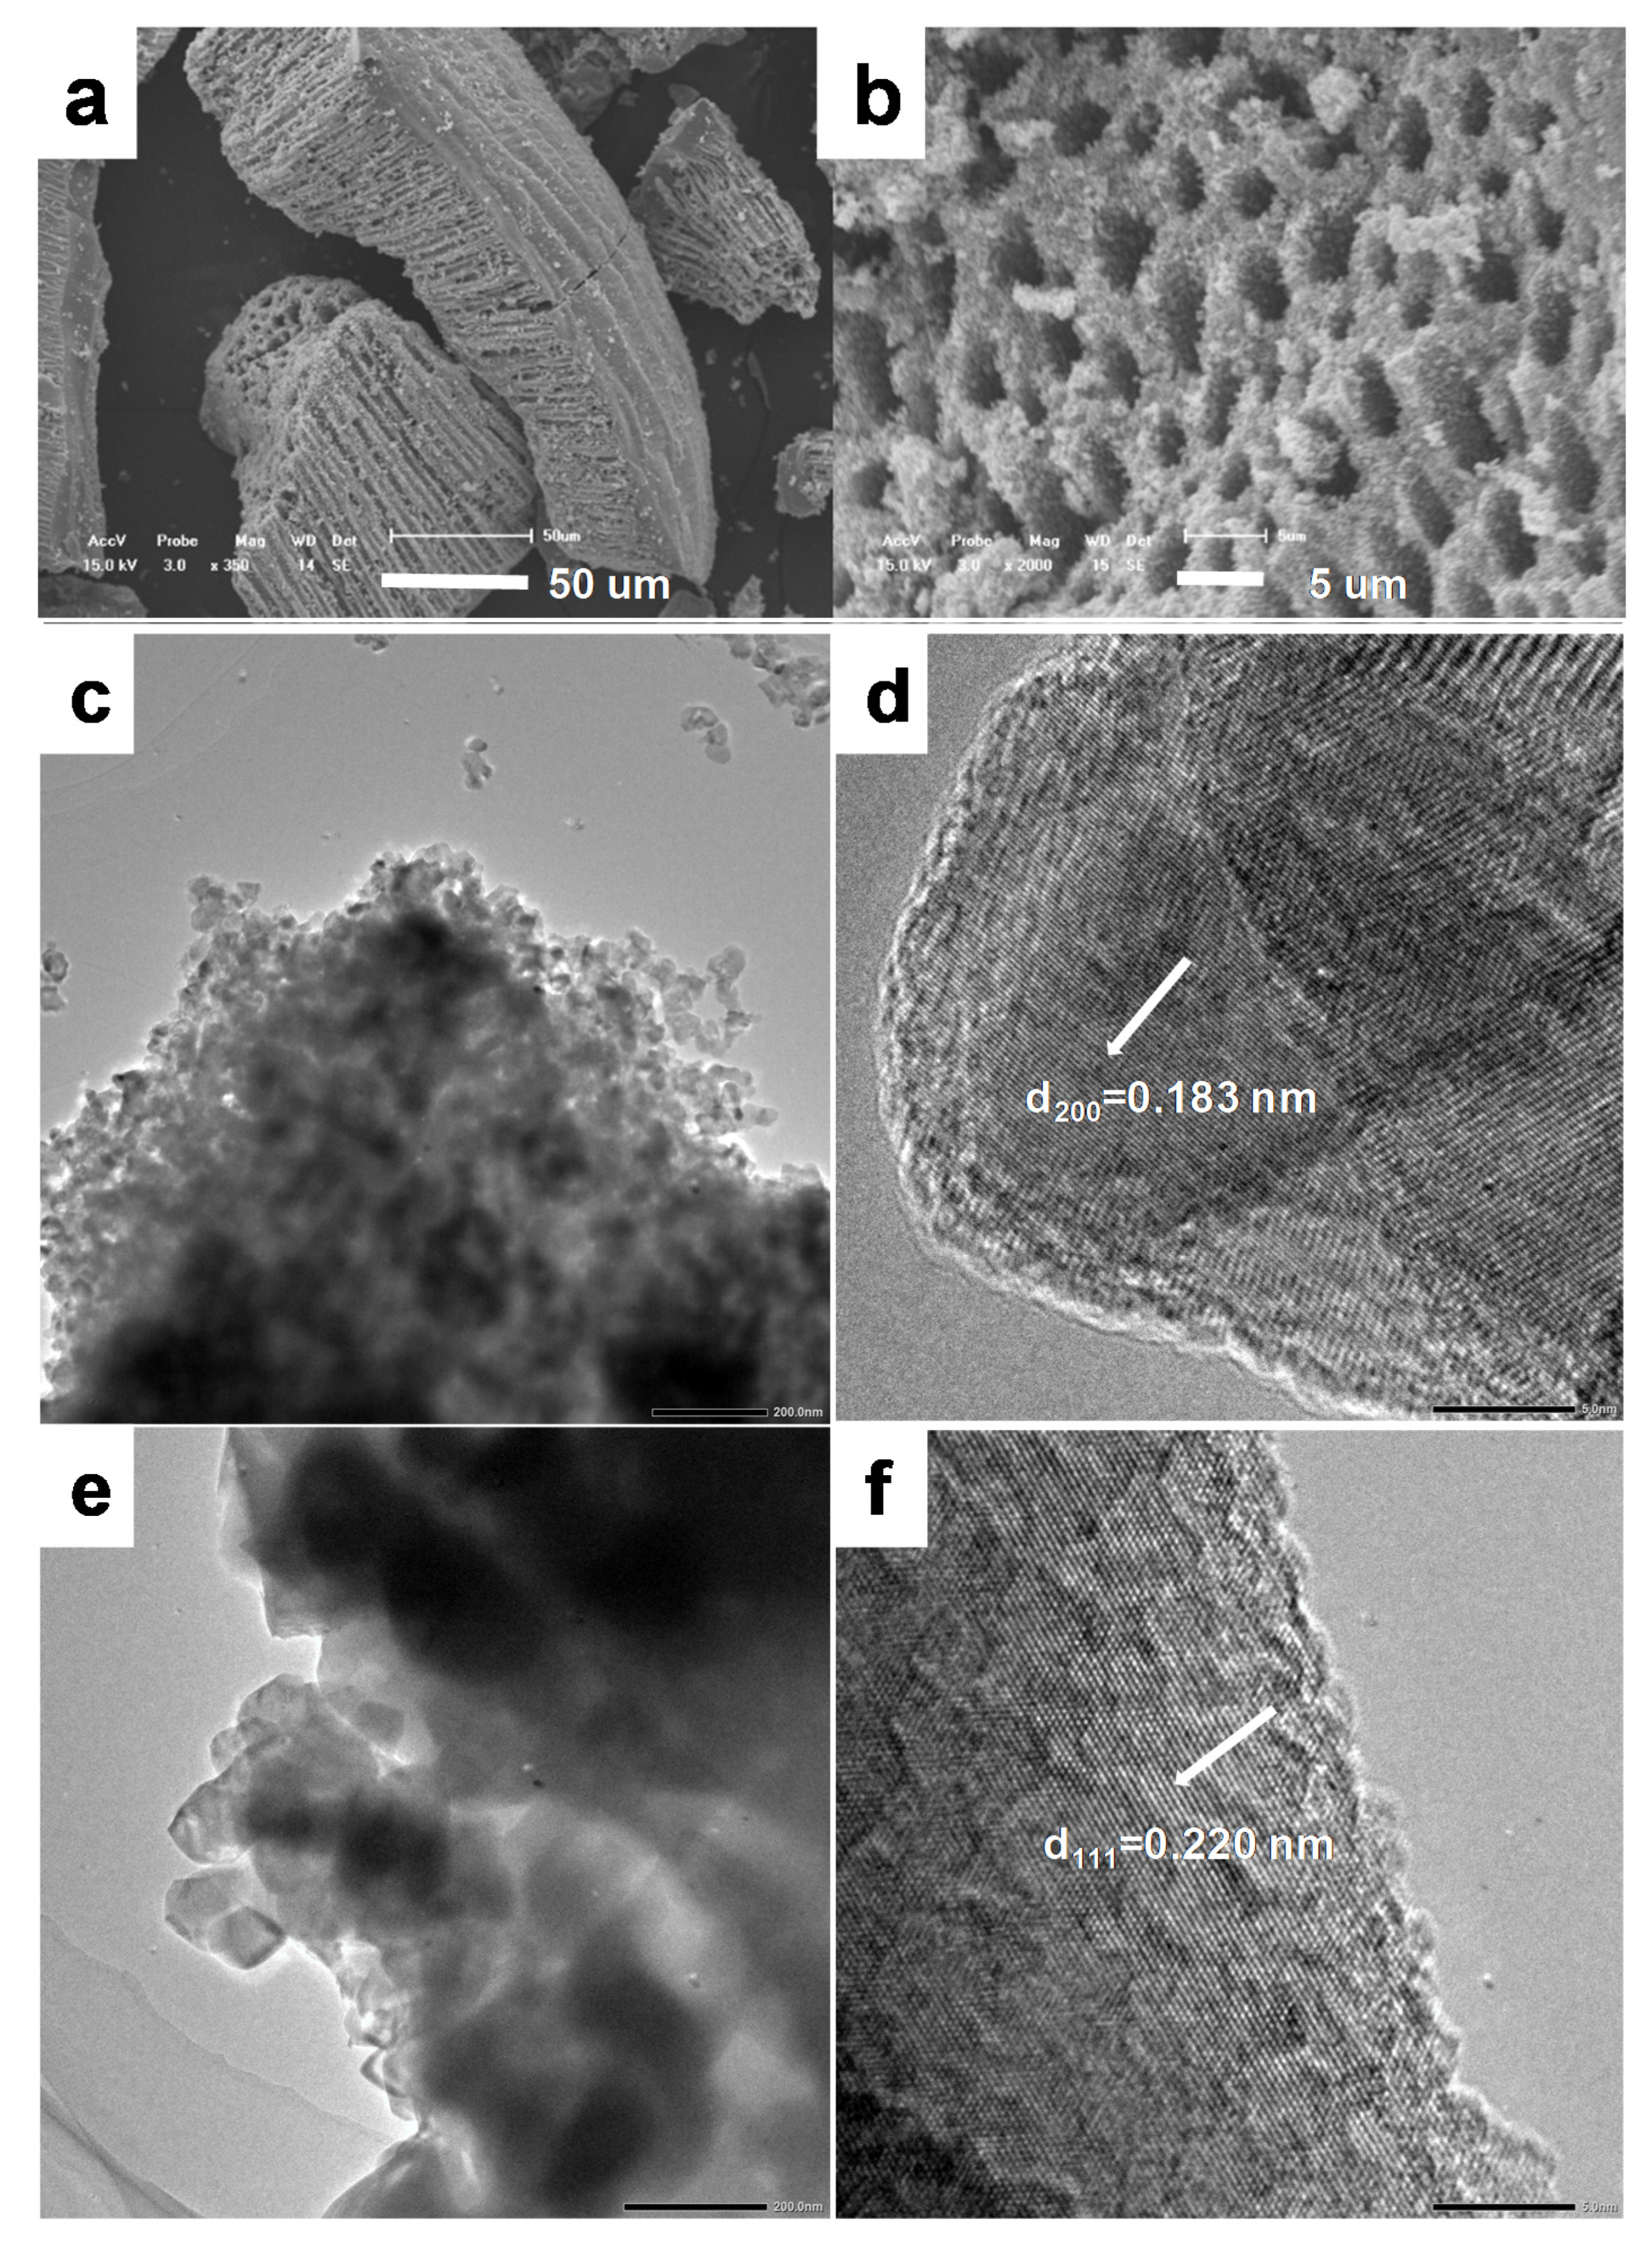
Figure 4.
N2 adsorption-desorption curves of titanium samples, (a) titanium precursor, (b) TiO2-550, (c) TiO2-800.
Figure 4.
N2 adsorption-desorption curves of titanium samples, (a) titanium precursor, (b) TiO2-550, (c) TiO2-800.
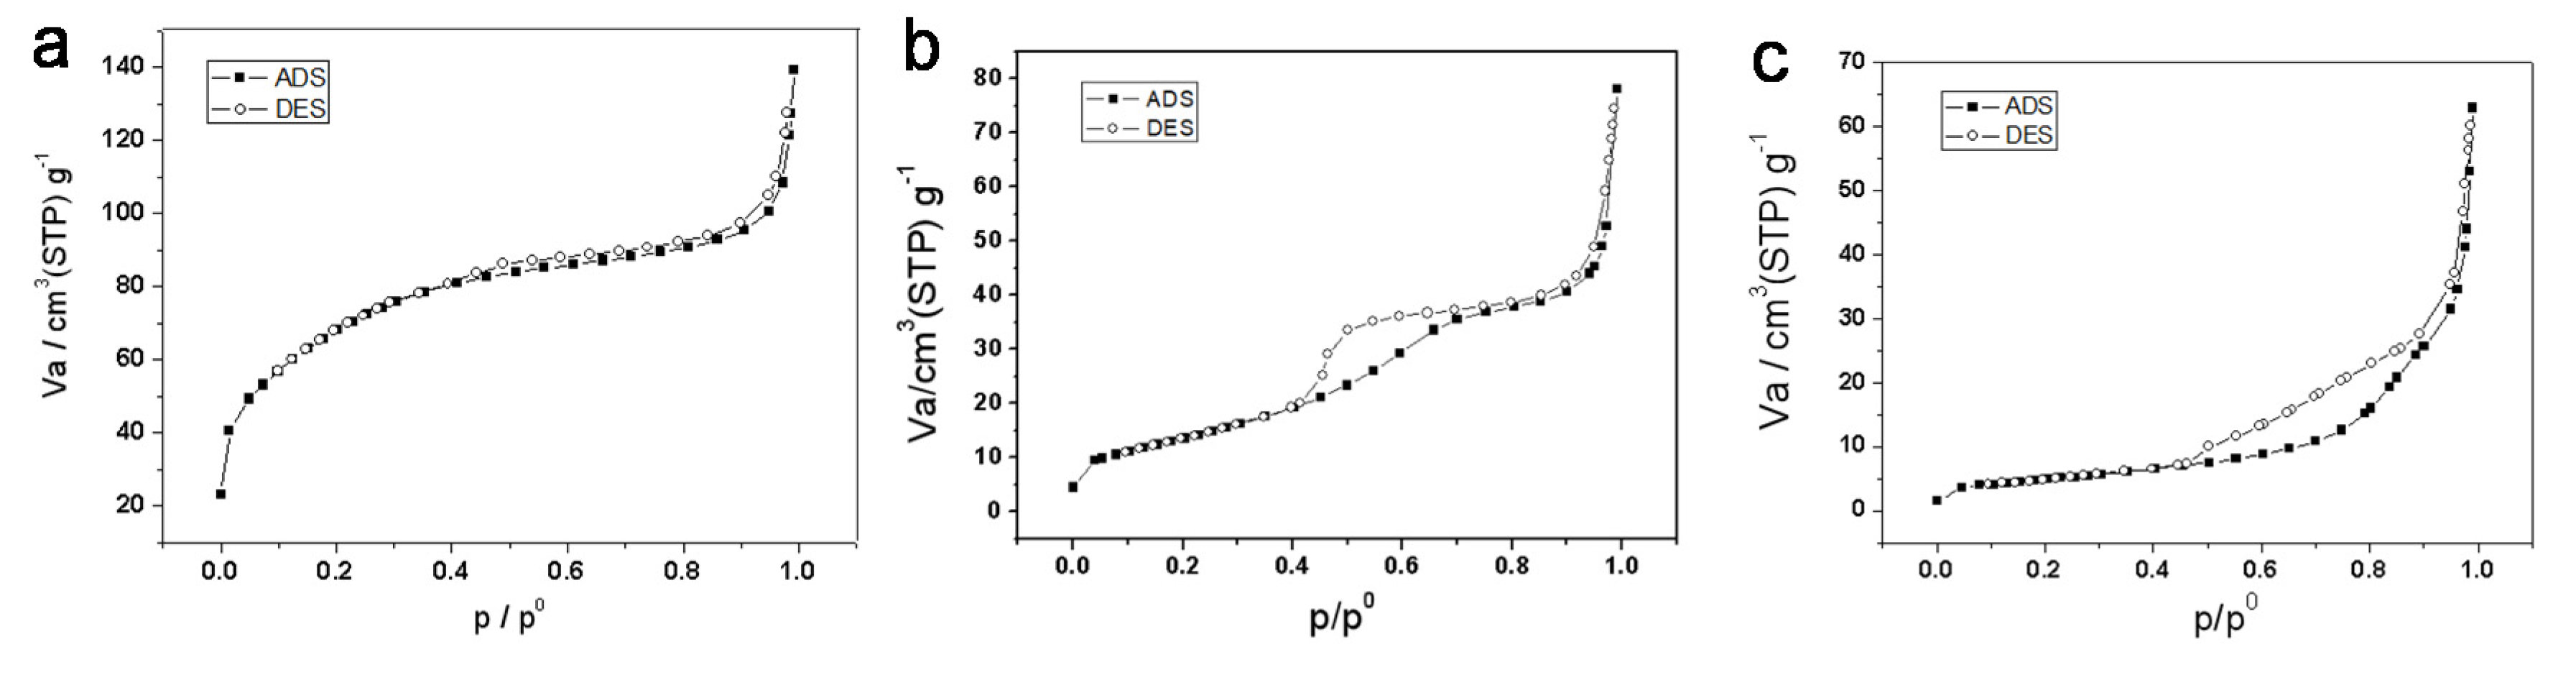
Figure 5.
SEM images of titanium precursors prepared by the addition of citric acid. (a,b) 0.72 g, (c,d) 1.8 g, (e,f) 3.59 g.
Figure 5.
SEM images of titanium precursors prepared by the addition of citric acid. (a,b) 0.72 g, (c,d) 1.8 g, (e,f) 3.59 g.

Figure 6.
(a) UV-vis spectra of TiO2 samples, (b) calculated according to the formula αhν = A(hν − Eg)n/2, (c,d) EDS spectra for TiO2-550 and TiO2-800.
Figure 6.
(a) UV-vis spectra of TiO2 samples, (b) calculated according to the formula αhν = A(hν − Eg)n/2, (c,d) EDS spectra for TiO2-550 and TiO2-800.
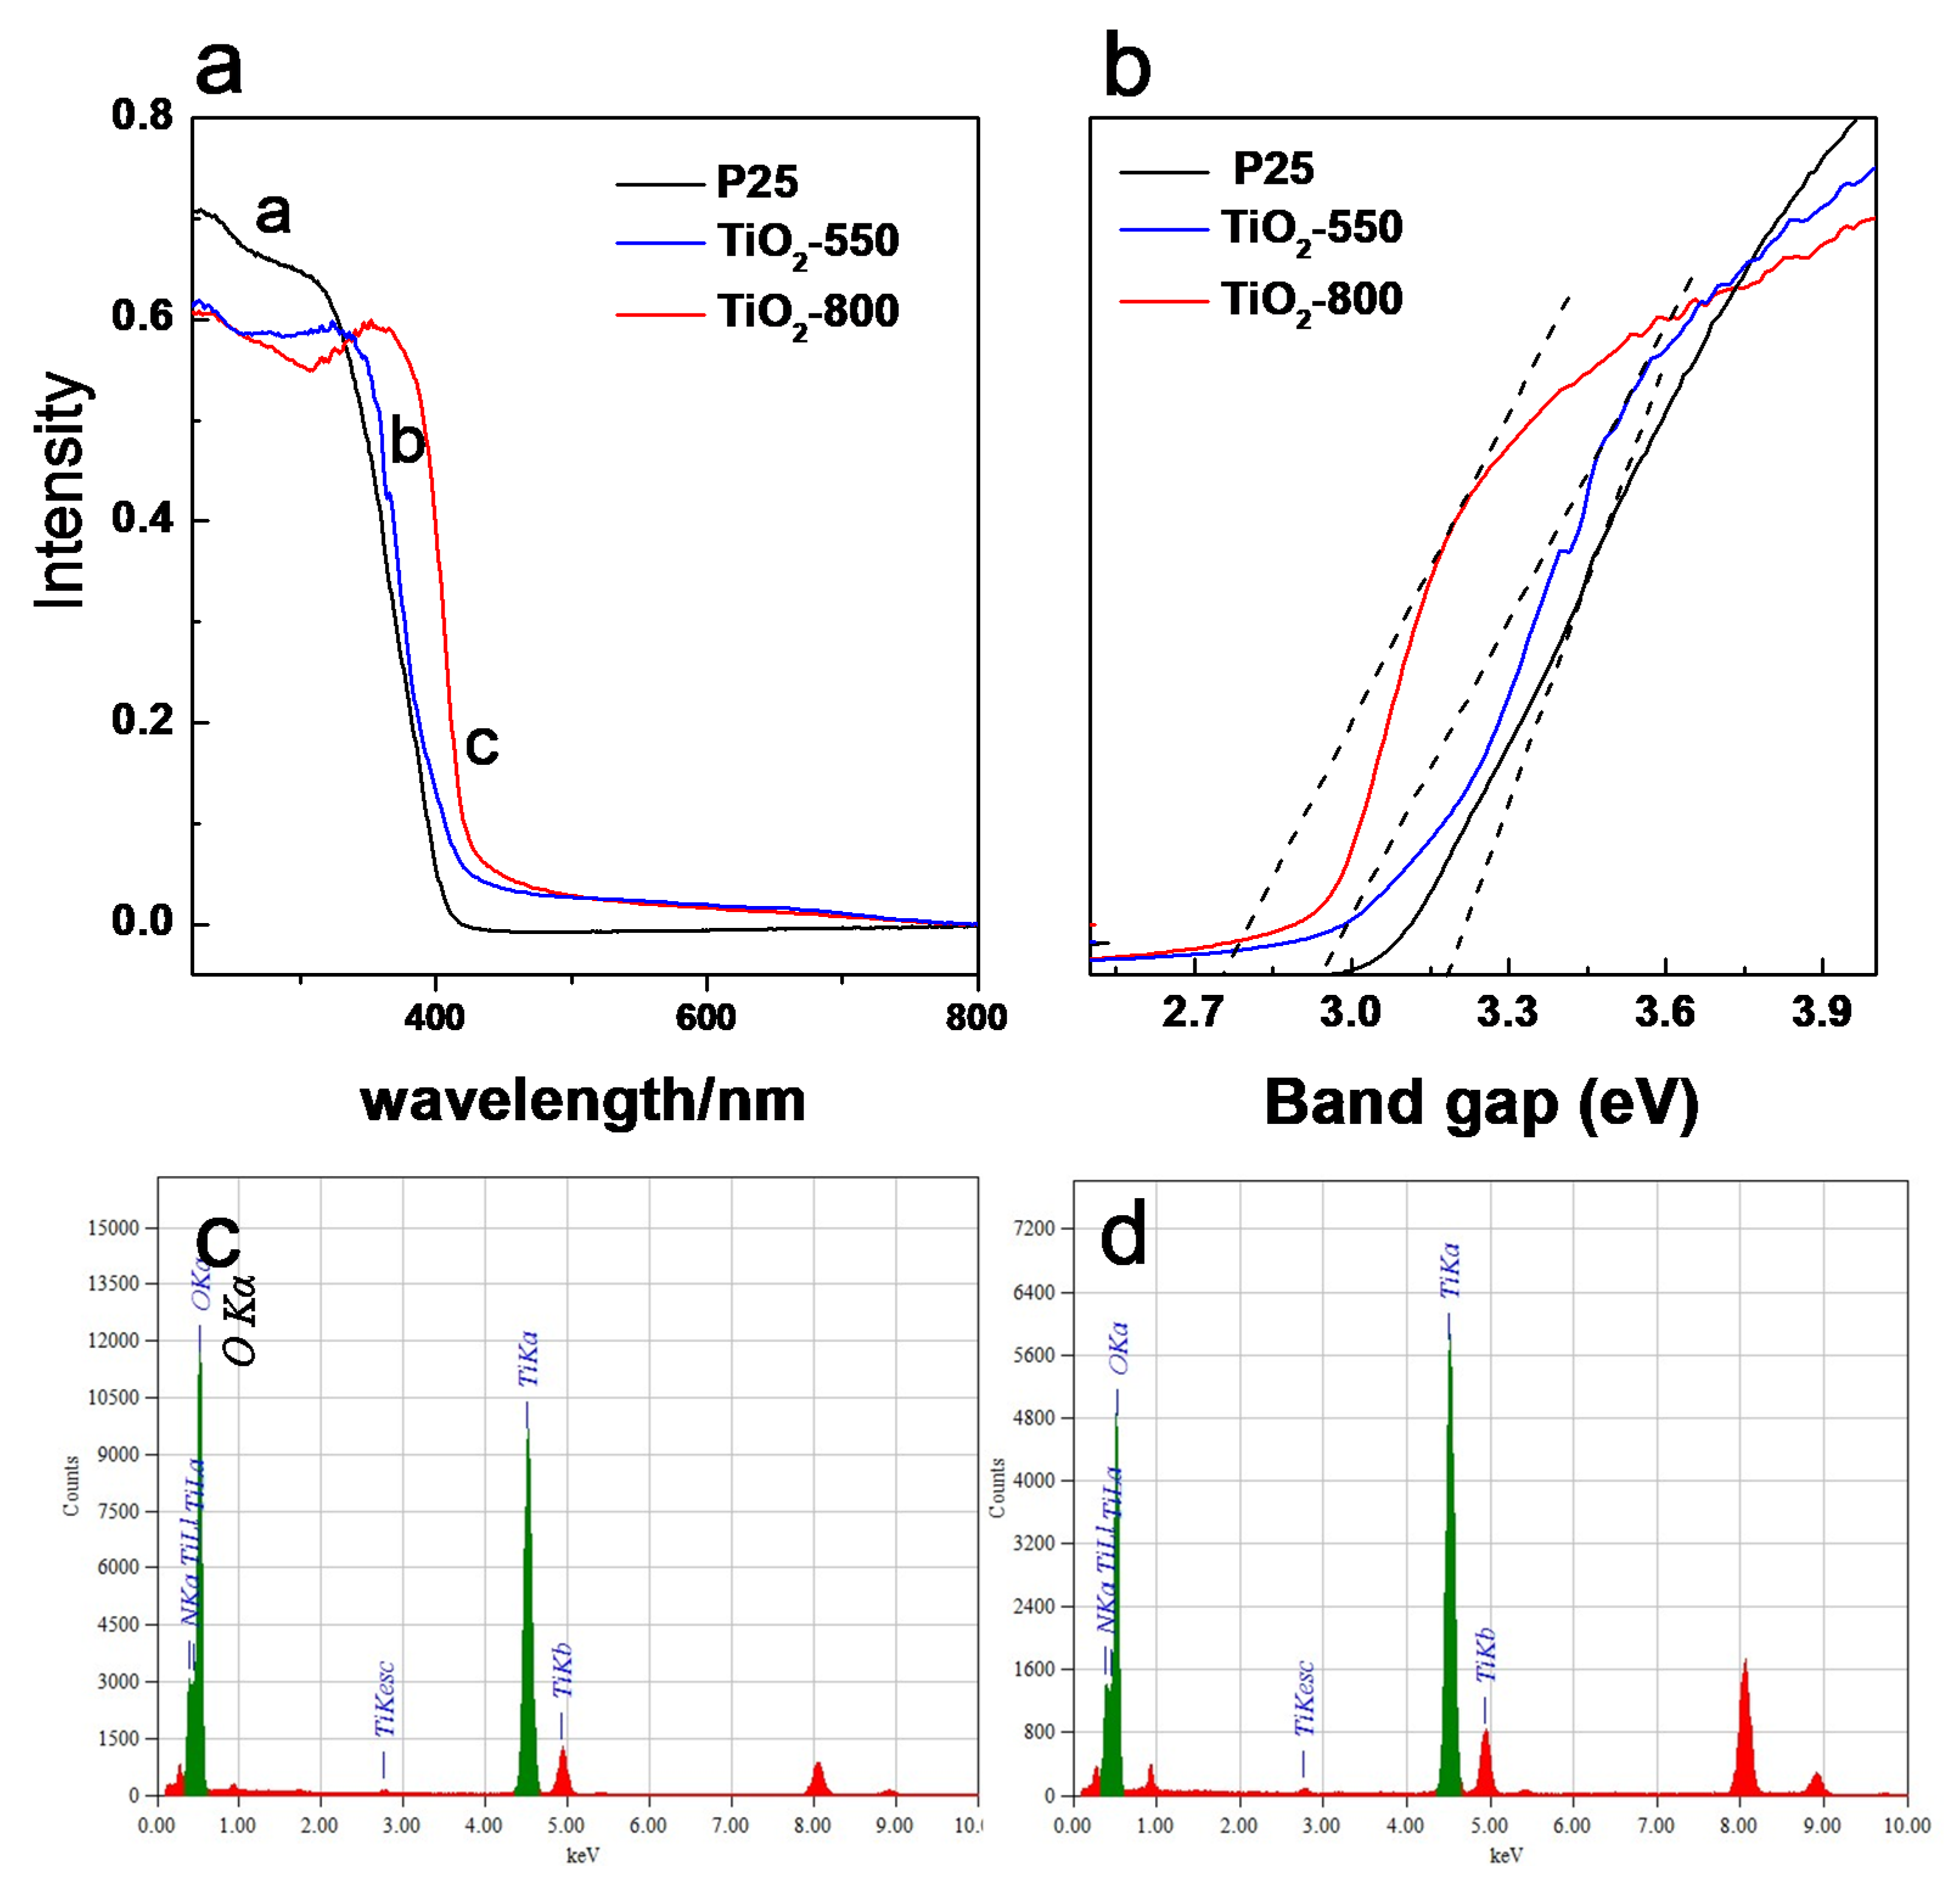
Figure 7.
(a) Photocatalytic degradation of RB under UV-light irradiation, A—blank control, B—P25, C—TiO2-550, D—TiO2-800. (b) Recycling test for RB degradation over TiO2-800.
Figure 7.
(a) Photocatalytic degradation of RB under UV-light irradiation, A—blank control, B—P25, C—TiO2-550, D—TiO2-800. (b) Recycling test for RB degradation over TiO2-800.

Figure 8.
XPS spectra of TiO2-800, (a) N 1s spectrum, (b) Ti 2p spectrum, (c) O 1s spectrum.
© 2020 by the authors. Licensee MDPI, Basel, Switzerland. This article is an open access article distributed under the terms and conditions of the Creative Commons Attribution (CC BY) license (http://creativecommons.org/licenses/by/4.0/).
Share and Cite
MDPI and ACS Style
Chen, R.; Shao, N.; Zhou, X.; Chen, T. Citric Acid Regulated Fabrication of Macroporous TiO2. Surfaces 2020, 3, 50-60. https://doi.org/10.3390/surfaces3010006
AMA Style
Chen R, Shao N, Zhou X, Chen T. Citric Acid Regulated Fabrication of Macroporous TiO2. Surfaces. 2020; 3(1):50-60. https://doi.org/10.3390/surfaces3010006
Chicago/Turabian StyleChen, Rui, Ningning Shao, Xiaoquan Zhou, and Tiehong Chen. 2020. "Citric Acid Regulated Fabrication of Macroporous TiO2" Surfaces 3, no. 1: 50-60. https://doi.org/10.3390/surfaces3010006