
Microcalorimetry Techniques for Studying Interactions at Solid–Liquid Interface: A Review

1
School of Engineering Science, University of Chinese Academy of Sciences, Beijing 100083, China
2
Institute of Porous Flow and Fluid Mechanics, The Chinese Academy of Sciences, Beijing 100083, China
3
State Key Laboratory of Enhanced Oil Recovery, Research Institute of Petroleum Exploration and Development of PetroChina, Beijing 100083, China
4
School of Pharmacy, Health Science Center, Xi’an Jiaotong University, Xi’an 710061, China
*
Authors to whom correspondence should be addressed.
Surfaces 2024, 7(2), 265-282; https://doi.org/10.3390/surfaces7020018
Submission received: 16 February 2024
/
Revised: 6 March 2024
/
Accepted: 9 March 2024
/
Published: 23 April 2024
Abstract
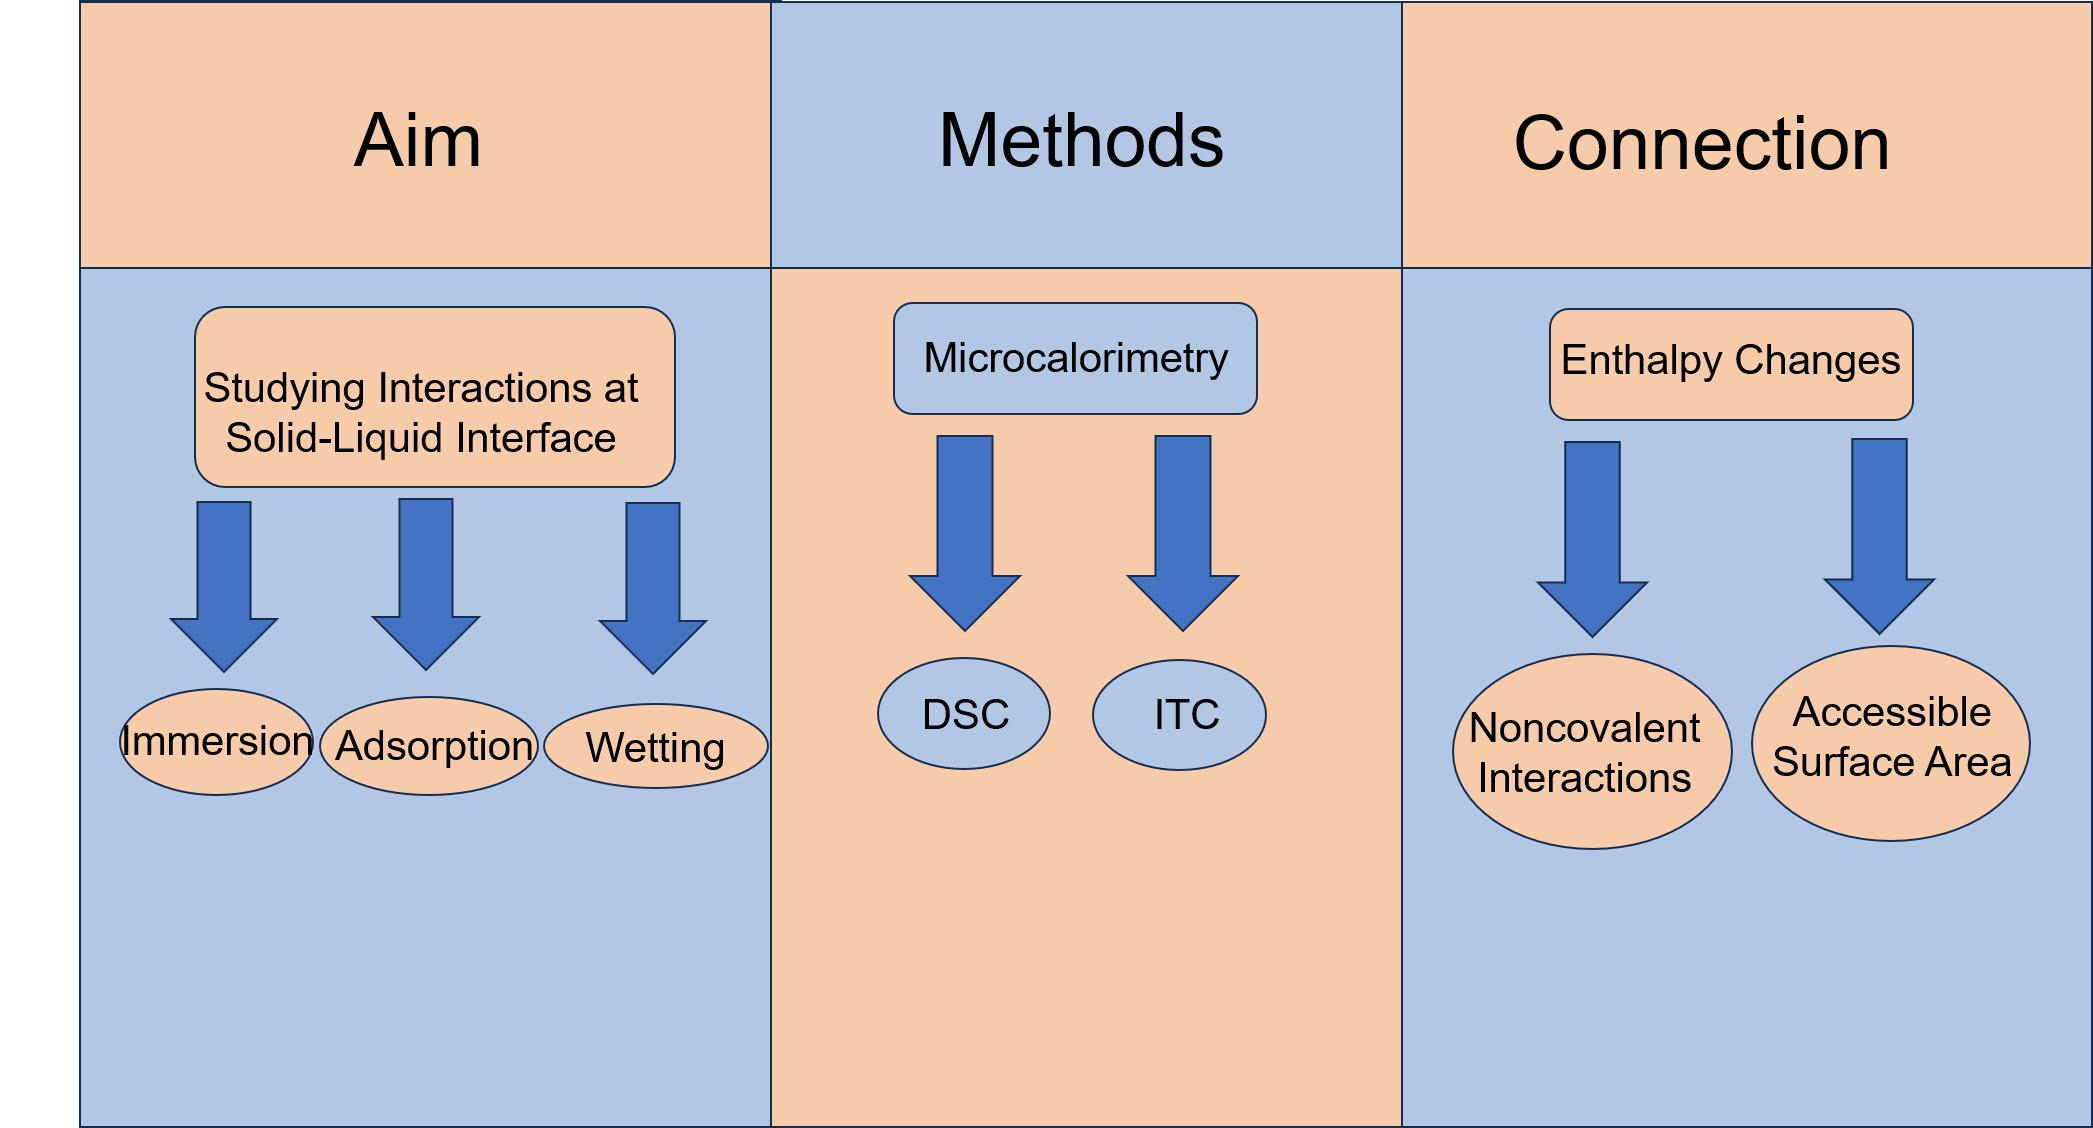
:Solid–liquid interfacial phenomena play an essential role in our everyday lives and are often regarded as the outcome of interactions at the solid–liquid interface. However, the intricately intrinsic mechanism underlying interfacial interactions renders in situ simulations and direct measurements challenging. As an effective analytic method for studying solid–liquid interfacial interactions, microcalorimetry can provide the most basic thermodynamic information (including changes in enthalpy, entropy, and Gibbs free energy during solid–liquid binding/separation processes), which is extremely crucial for understanding interaction directionality and limitation. This review is dedicated to highlighting the pivotal role of microcalorimetry in studying solid–liquid immersion and adsorption processes. Specifically, we provide an overview of the commonly employed microcalorimetric methods, including differential scanning calorimetry (DSC), isothermal titration calorimetry (ITC), and immersion microcalorimetry (IM), and delve into the influence factors of enthalpy change, and finally discuss the specific applications of microcalorimetry in studying various solid–liquid binding processes. There remains a vast expanse of thermodynamic information regarding solid–liquid interactions that await exploration via calorimetry.

1. Introduction
The solid–liquid interfacial phenomena are common occurrences in nature and human activities. For example, agglomerated water droplets on a lotus leaf, rain wetting the road surface, and the paint are required to spread evenly on the wall without falling off or forming bubbles. Fundamentally speaking, the interfacial phenomenon is resulted from the intermolecular interactions (covalent interaction or non-covalent interaction) at solid–liquid interface. Great progress has been achieved in the characterization techniques for studying solid–liquid interfacial interaction since the 1900s. Macroscopic analytic methods include the contact angle of the liquid on the solid surface, the zeta potential of the solid, and the interfacial tension between solid and liquid. Microscopic interaction information such as surface images, intermolecular forces, molecular orientations, and vibration frequencies can be obtained through atomic force microscopy (AFM) [1,2,3], scanning tunneling microscopy (STM) [4,5], sum frequency generation spectroscopy (SFG) [6,7], infrared spectroscopy (IR) [8,9], and magnetic resonance imaging (MRI) [10]. Calorimetry is an experimental technique and serves as an essential means to probe solid–liquid interactions from a thermodynamic perspective. It enables the interaction process to be tracked and quantified through directly measuring the associated enthalpy change. Most binding processes at the solid–liquid interface involve intermolecular interactions dominated by non-covalent forces, such as hydrogen bonding and van der Waals interactions, representing a distinctive type of process. Based on the heat partitioning measured by calorimetry, prevalent techniques include isothermal titration calorimetry (ITC), differential scanning calorimetry (DSC) [11], and immersion calorimetry (IM). These calorimetric methods allow us to gather heat information during various solid–liquid interface interactions. Immersion enthalpy stands out as the most pivotal parameter in the solid–liquid immersion process, exclusively measured by the heat emitted or absorbed during solid–liquid binding via titration calorimetry and immersion calorimetry. This then allows the determination of changes in enthalpy, entropy, and Gibbs free energy. However, these two calorimetric methods still face two inherent challenges. The first pertains to the fact that the heat obtained from these microcalorimetric tests represents the total heat of the entire process, lacking differentiation for specifics, such as the diffusion process or particular binding sites, which leads to the second issue concerning the theoretical validity of these thermodynamic concepts owing to the fact that minute errors can become amplified during derivations using thermodynamics. Thus, it is imperative to select appropriate materials for various experiments when utilizing calorimetry to investigate the interactions between solids and liquids at their interface, which aids in distinguishing the distinct impacts of dissolution, diffusion, and adsorption processes on the overall heat. Furthermore, it is essential to consider any potential experimental inaccuracies to attain more precision when determining thermodynamic values.
2. Fundamental Principles of ITC and DSC
The heat obtained via calorimetry is a process function, implying that the heat in a given process will depend on the constraints of the study in question. Both ITC and IM measure processes carried out at constant temperature (T) using a thermostat and constant pressure (P) using a pressure stabilizer. Under these constraints, the process is isothermal and isobaric, meaning the associated heat will be equivalent to the change in enthalpy (ΔH) of the system. The Gibbs energy (G) is the thermodynamic potential controlling system equilibrium, and its change (ΔG) determines the feasibility or spontaneity of a given process under constant temperature and pressure. The equilibrium constant (Ke) ascertains the system’s composition at equilibrium and quantifies the tendency to form the final products. ΔG0 is associated with the standard Gibbs energy of the process.
The affinity of a given interaction can be quantified using the equilibrium binding constant (Ka), equilibrium dissociation constant (Kd), and the Gibbs free energy of binding. A more negative Gibbs free energy indicates a higher affinity between the solid and liquid and better intermolecular binding stability at the solid–liquid interface. Microcalorimetric methods refer to calorimetric techniques capable of detecting extremely minute heat changes during a process. From this perspective, DSC, ITC, and IM can all be termed microcalorimetric methods. With technological advancements, calorimetry is no longer a technique confined to specialized labs using custom-built instruments and all available devices offer automated titrations in computer-controlled experiments, running in parallel with automated data collection. Sample loading and instrument cleaning can be accomplished manually, but some newer models possess semi-automatic maintenance kits and scripts, enabling automatic cleaning and minimizing operator intervention to the greatest extent possible.
The sample and reference cells of the ITC are enclosed within an insulating jacket, isolating them from the surrounding environment and maintaining a constant temperature (Figure 1) [12]. A stepping motor within the syringe holder controls the plunger of the airtight syringe, introducing the titrant into the sample cell. In addition, stirring ensures rapid mixing with the sample after each titrant addition. The temperature difference between the sample and reference cells is transformed into a voltage signal by thermocouples, which are then converted into a heat power signal. During an ITC measurement, titration is performed under constant temperature and pressure, gradually mixing one reactant into another while simultaneously measuring the heat associated with the binding reaction [13]. ITC is currently mainly used in the biological field for measuring interactions between proteins [14], proteins and nucleic acids [15], and proteins and lipids [16]. Some studies have also employed ITC for investigating the binding of solid substances such as activated carbon [17], metal organic framework (MOF) materials [18,19,20], and rare earth [21] with liquids. Considering the general solid–liquid binding process, it might be accompanied by equilibriums of numerous different solid surface sites with liquid molecules. If an experiment is conducted under a single set of conditions, then all binding parameters estimated and used to characterize the interaction must be considered as apparent binding parameters. On account of ITC measures, the total heat change encompassing all processes involved in the interaction, no further binding information can be inferred without additional experiments to clarify the contributions of different processes to the total heat. For instance, supposing activated carbon surface possesses both hydroxyl and carboxyl groups, these active sites would have different heat release contributions when binding with water. Typically, the binding process is described using total enthalpy and total entropy, wherein such a description seems overly simplistic and it is controversial over the general validity and usefulness of the interpretation of binding parameters [22,23,24,25]. Additionally, the IM method, similar to ITC, measures the heat released when a certain amount of solid is fully immersed in a liquid under isothermal and isobaric conditions.
DSC is a technique to measure the relationship of temperature/time with input energy difference between the sample and the reference material, wherein temperature is programmatically controlled within a specified range, exactly as the ICTAC Nomenclature Committee defines DSC as “a technique measuring the difference in heat flow between the sample and a reference material” [26]. In simpler terms, DSC measures the heat released or absorbed by a substance during its heating or cooling process. DSC has been extensively employed in characterizing and studying pharmaceuticals [27], graphite [28], and polymers [29], etc. Heat flux DSC is the most commonly used method, in which the heat of the reference and sample simultaneously flow through an electrically heated Constantine thermoelectric disk (Figure 2). Commonly recorded data include the glass transition temperature (Tg), melting temperature (Tm), and crystallization temperature (Tc). Furthermore, physical and chemical changes detected by DSC might encompass phase transitions, glass transitions, denaturation, melting, crystallization, and other characteristics like polymer transformations, oxidations, decompositions (either oxidatively or otherwise), thermal curing, and annealing. All these above transitions can be both qualitatively and quantitatively detected through DSC measurement. Such insights hold significance for the synthesis and development of new products [30], as well as for exploring the viability of applications ranging from food and drugs to novel materials. César Leyva Porras et al. [31] elucidated how DSC is employed for investigating intricate solid–solid and liquid–liquid interactions in food and medicines. There are also pertinent studies [32] highlighting the use of DSC in the characterization of graphene-based materials and understanding of solid surface state at the molecular scale. Due to its own inherent characteristics, DSC predominantly focuses on the characterization of solid materials and its application in studying solid–liquid interface interactions is comparatively rare. For certain solids that adsorb liquids, immersion calorimetry can measure the heat changes during the adsorption and desorption processes of the solid onto the liquid. The binding or adsorption behaviors that occurred during the solid–liquid immersion process are mainly explored through isothermal titration calorimetry and immersion calorimetry.
3. Calorimetric Insights into Enthalpy Changes during Solid–Liquid Immersion Processes
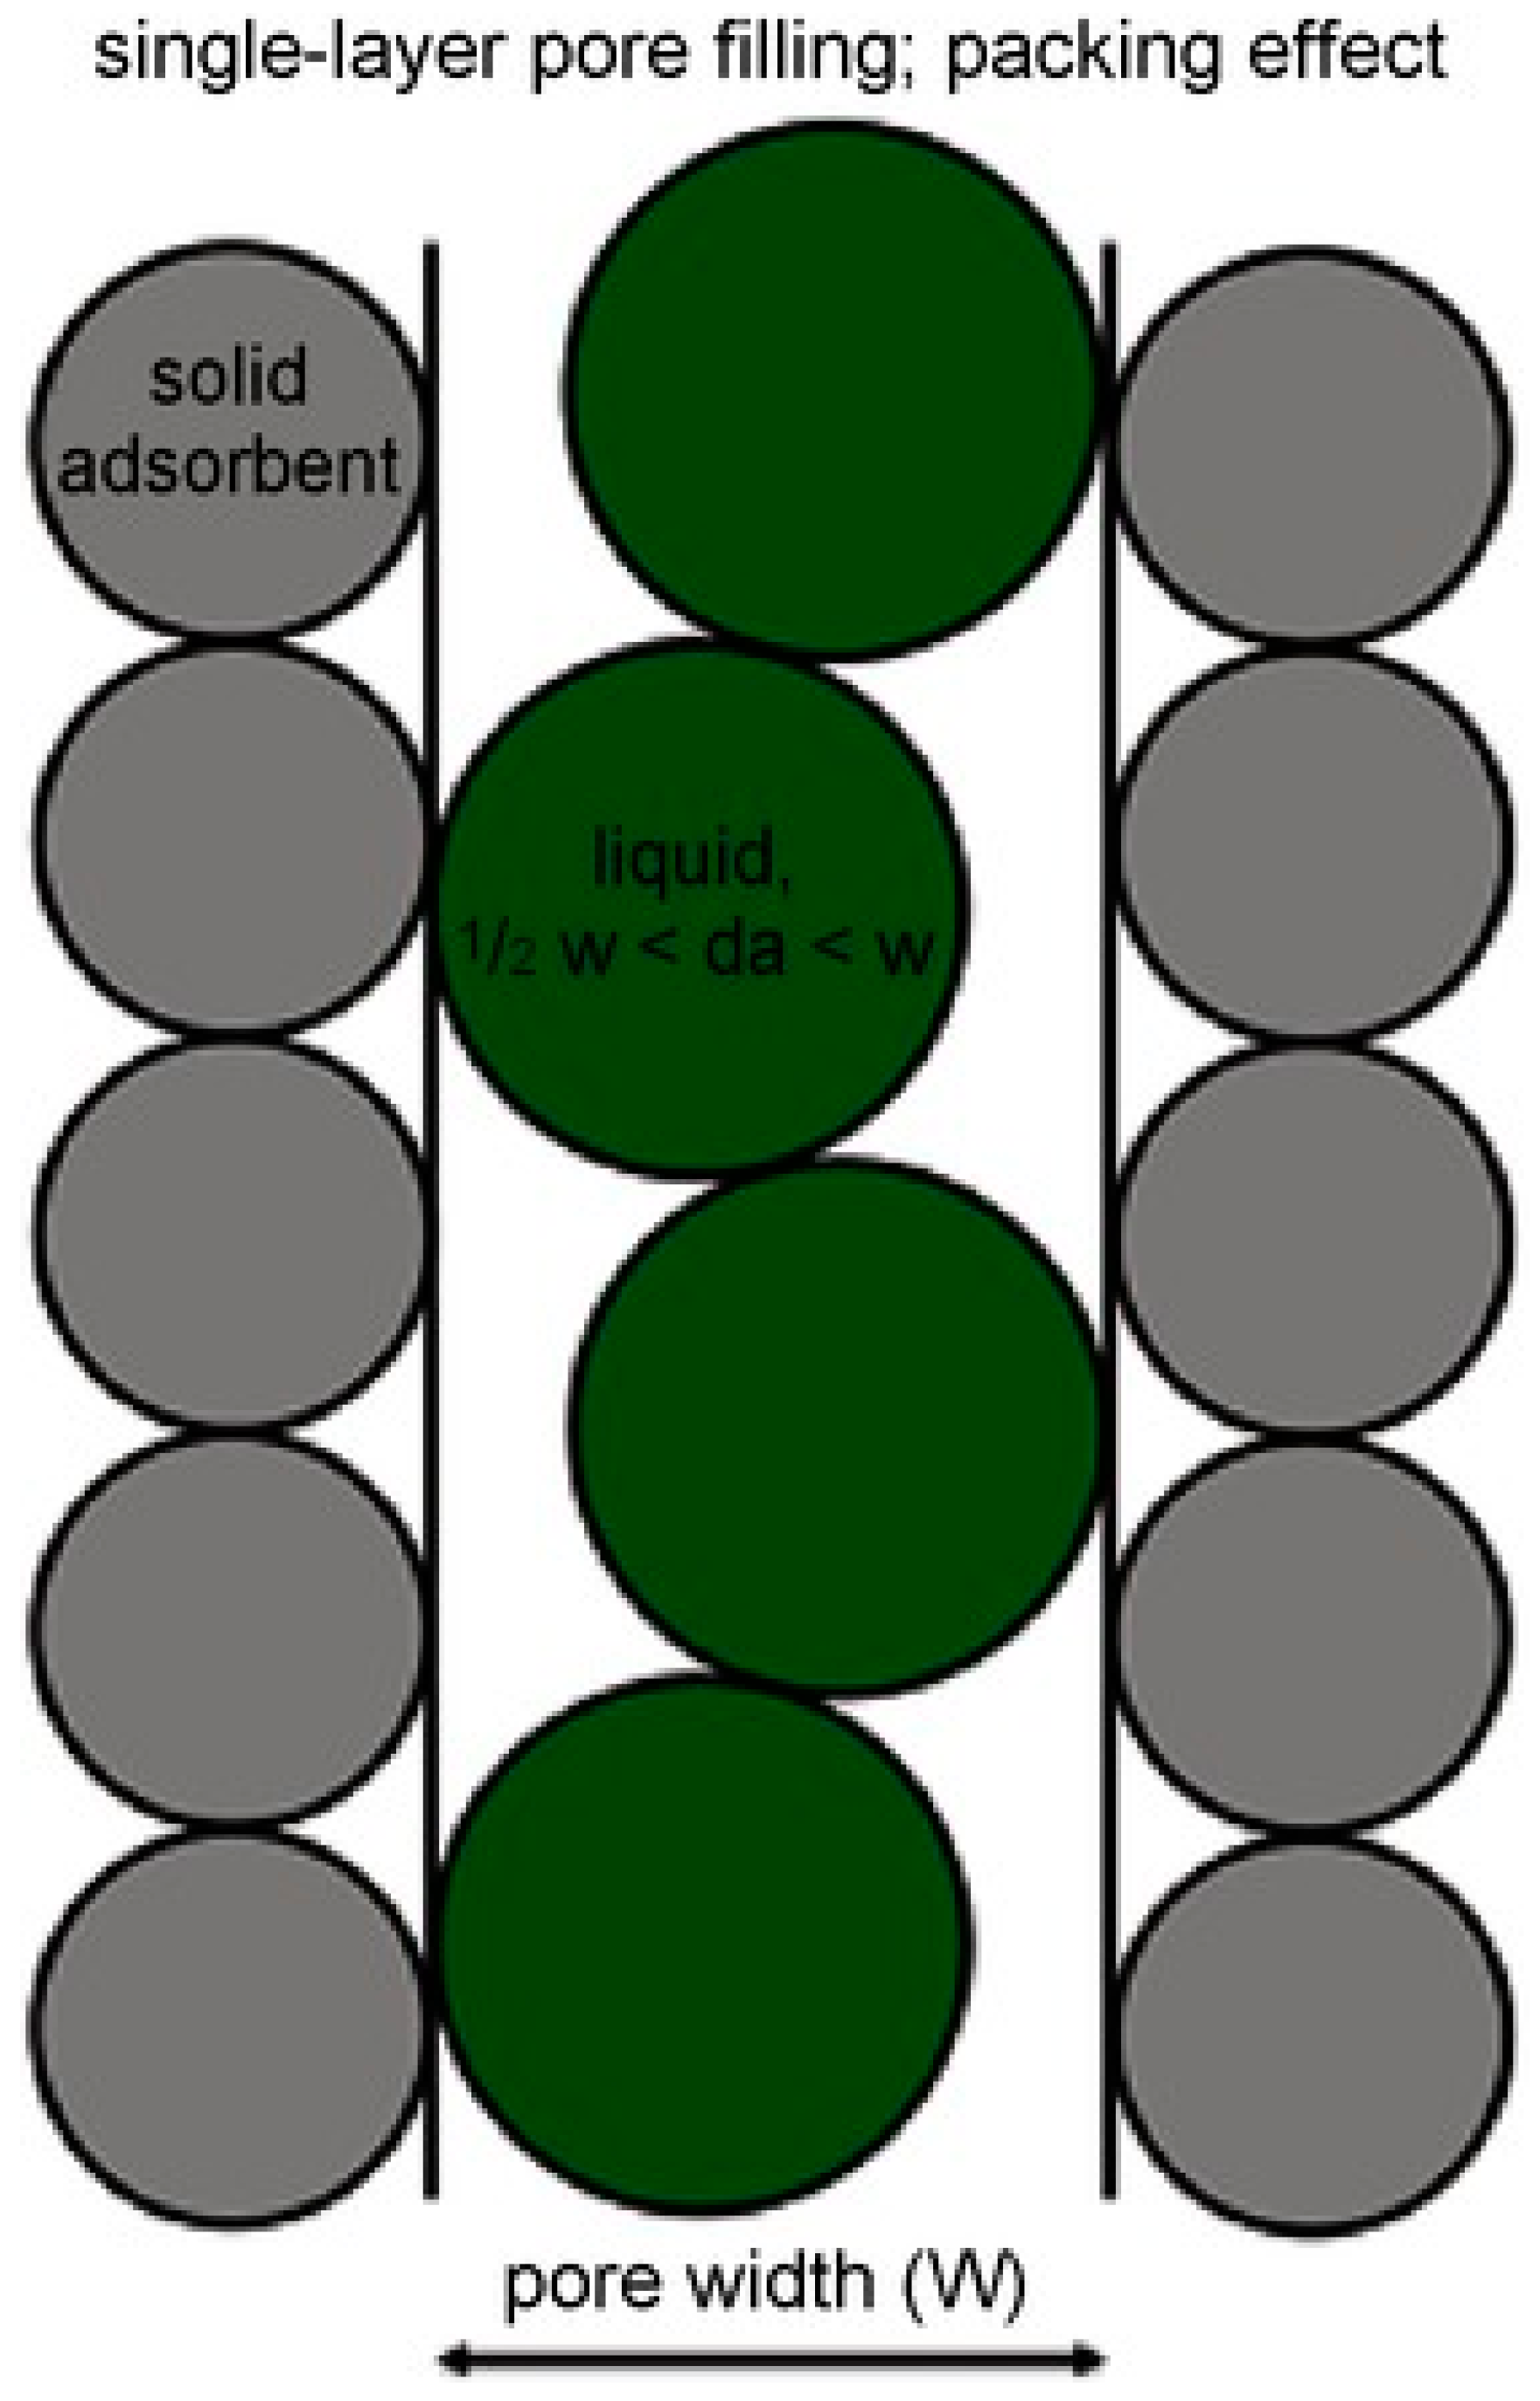
The process of solid–liquid immersion refers to the transformation of the gas–solid interface into a liquid–solid interface. Typically, if we assume the immersion area to be a unit surface area, the reduction in Gibbs function of the system during this process equates to the difference between the solid–liquid interfacial tension and the solid surface tension under isothermal and isobaric conditions, which also represents the immersion capacity countering the contraction of the liquid surface. The heat released during immersion under constant pressure, is termed immersion enthalpy. Therefore, what does the magnitude of the immersion enthalpy signify, and what insights regarding the solid–liquid interface can be deduced from the immersion enthalpy? Addressing these questions necessitates a discussion on the factors influencing immersion enthalpy. Rouquerol et al. [33] proposed that when a solid surface is degassed under a vacuum prior to measurement, the immersion enthalpy predominantly depends on the following parameters: (1) The accessible surface area of the solid. For a given solid–liquid system, immersion enthalpy increases with the augmentation of the available surface area. (2) The chemical nature of the liquid and the solid surface. Specific interaction between the solid surface and the liquid can enhance the immersion enthalpy. (3) The porous structure of the solid. Enhanced interactions can lead to an increase in immersion enthalpy when the molecular size of the liquid is proximate to the pore size (Figure 3). Additionally, the congruence between the shape of the liquid molecules and the pores must be considered.
In this review, two primary factors influencing immersion enthalpy were emphasized. The first is the surface area of the solid interface molecules accessible to the liquid molecules, which is related to the kinetic diameter of liquid molecules, and the structural features of solid like pore size, pore architecture, and porosity. The second determinant is the binding process dictated by chemical characteristics of the liquid molecules and the solid interface molecules. Herein, our emphasis leans more towards the non-covalent interaction relying on intermolecular forces, rarely involving the strong chemical bonds such as new covalent or ionic bonds between solid interface molecules and liquid molecules. It is recognized that bond formation is an exothermic process, while bond breaking is endothermic. For solid–liquid immersion, liquid molecules replace the gas molecules on the solid surface, which is accompanied by the binding of solid interface molecules with liquid molecules, and the detachment of solid interface molecules from gas molecules. Consequently, if the immersion process is exothermic, it suggests that the heat released due to the binding of solid interface molecules and liquid molecules exceeds the heat absorbed during their detachment from gas molecules. The stronger and more intimate the interaction between the solid interface molecules and the liquid molecules, the more heat is released during binding.
3.1. The Influence of Non-Covalent Interactions between Liquid Molecules and Solid Interface Molecules on Immersion Enthalpy
Non-covalent interactions between solid interface molecules and liquid molecules can be specifically categorized as hydrogen bonding, hydrophobic interactions, and van der Waals forces. In certain compounds, a hydrogen atom can bond simultaneously with two highly electronegative and smaller atomic radius atoms (e.g., O, F, N). Hydrogen bonds influence the water’s boiling point and the structure of proteins and DNA. In this article, hydrogen bonding refers to the connection between an X–H bond of one molecule and a Y atom of another. The genesis of hydrogen bonding is a result of various attractive and repulsive forces, with electrostatic interactions being paramount. Silanol groups Si–OH on zeolite or quartz surfaces can form hydrogen bonds with water molecules. Van der Waals forces mainly encompass induced forces (polar molecules with non-polar molecules), dispersion forces, and electrostatic forces (attraction between polar molecular dipoles).
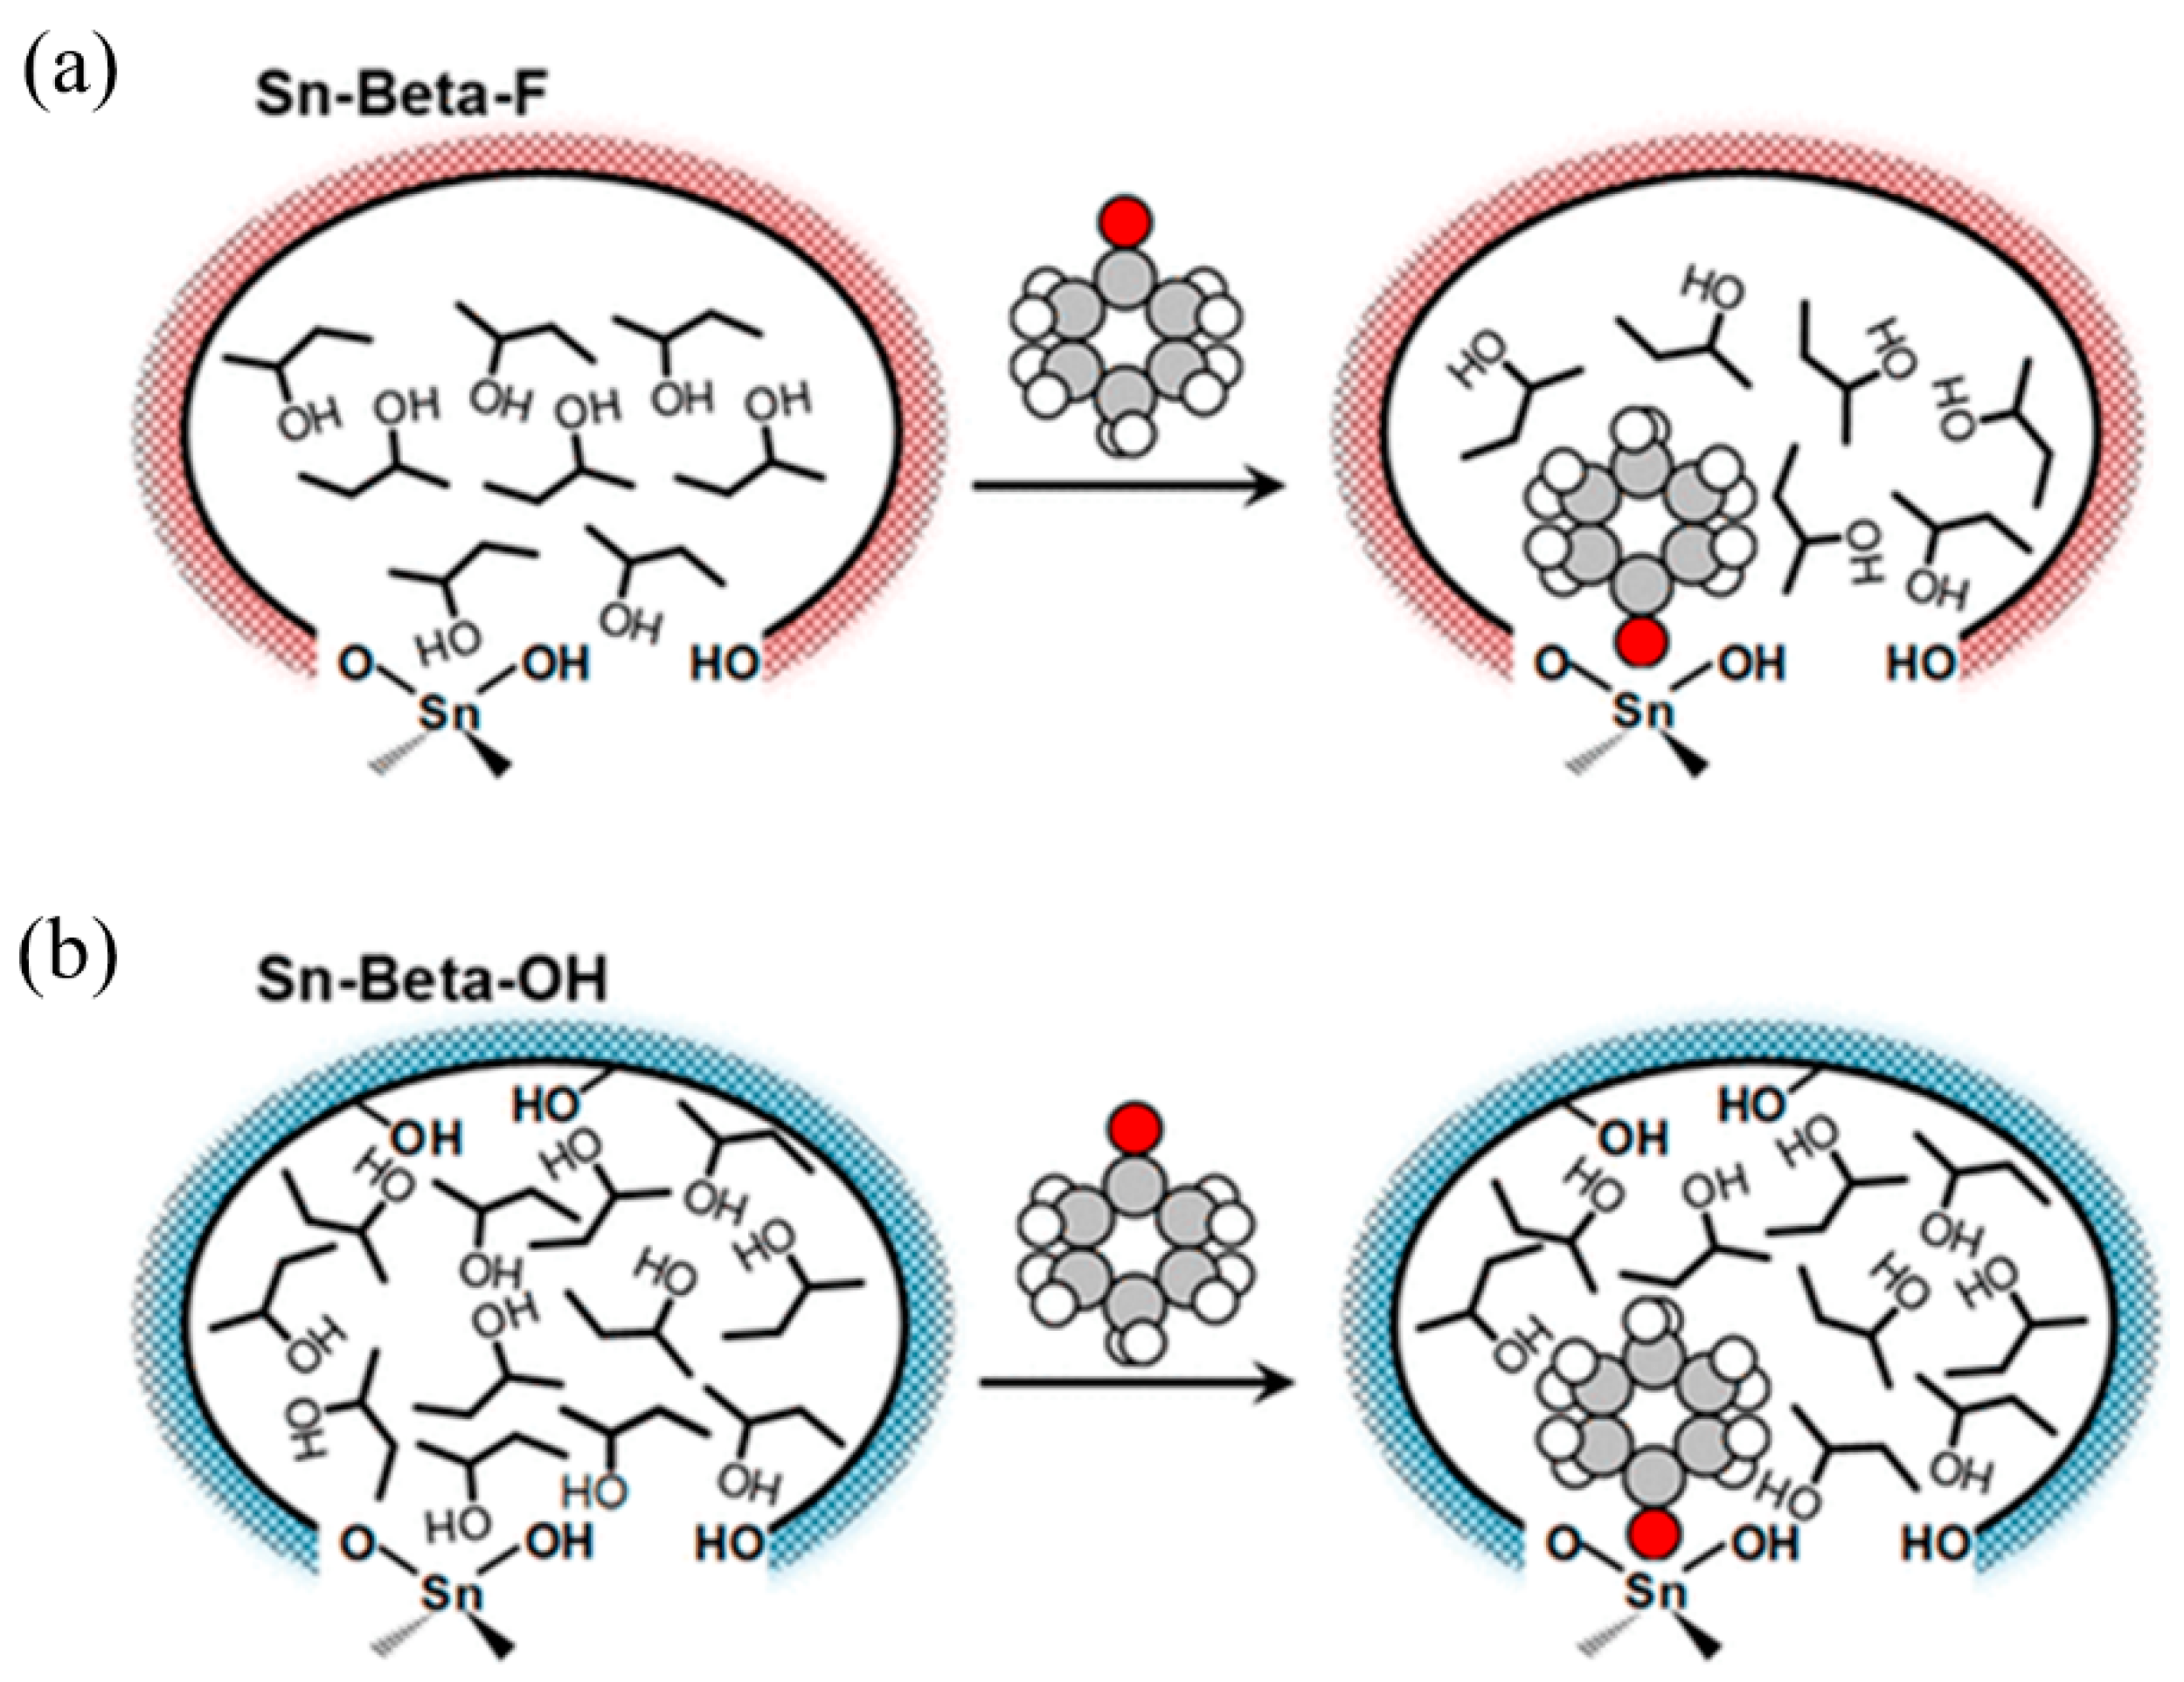
Román-Leshkov et al. [34] reported that cyclohexanone, in the presence of 2-butanol as a solvent, exhibits distinct adsorption behaviors in hydrophobic zeolites versus hydrophilic zeolites. Within hydrophilic zeolites, cyclohexanone interacts with a greater number of 2-butanol molecules, leading to a more ordered hydrogen-bonding network, which accelerates transfer hydrogenation turnover rates (Figure 4). Liliana Giraldo et al. [35] measured the immersion enthalpy of different types of activated carbon in benzene, cyclohexane, water, and phenol. For most activated carbons, the absolute adsorption enthalpy in benzene was higher than in cyclohexane, and slightly higher in phenol solutions than in water. However, immersion enthalpy in cyclohexane and phenol solutions varied based on the type of activated carbon. Similarly, D.A. Blanco-Martínez et al. [36] examined the relationship between the adsorption of phenol in activated carbon solutions at a pH of 7 and immersion enthalpy, finding that immersion enthalpy increased with adsorption. Blanco D et al. [37] studied the adsorption of catechol by modified activated carbon in water and the related changes in immersion enthalpy. They found the immersion enthalpy values increased with increasing adsorption. Giraldo L et al. [38] chemically prepared activated carbon and investigated its immersion enthalpy in tetrachloromethane, water, HCL, and NaOH. For most of the prepared activated carbon, immersion enthalpy was highest in tetrachloromethane, followed by acid or base, and least in water. Direct correlations were observed between immersion enthalpy in HCL and NaOH and the total acidity and alkalinity of the activated carbon. Giraldo L et al. [39] determined the immersion enthalpy of modified activated carbon in dichloromethane and tetrachloromethane, noting higher values in dichloromethane due to its smaller molecule size and lesser diffusion limitations. Giraldo et al. [40] applied immersion calorimetry to study interactions between benzene/cyclohexane and toluene/cyclohexane binary mixtures with three activated carbons of varying physicochemical properties. They found that immersion heat in aromatic compounds was higher than in cyclohexane. By selecting activated carbons with stable interfaces for the study and measuring their immersion enthalpy in different liquids, it was deduced that the binding strength between activated carbon interface molecules and benzene molecules was stronger than with cyclohexane. This could be attributed to the differences in bond formation between benzene and cyclohexane molecules, which subsequently affected their bonding with activated carbon surface molecules.
From another perspective, functional groups on the solid surface primarily dictate the binding sites of liquid molecules on the solid interface. Consequently, these functional groups contribute significantly to immersion enthalpy. The relationship between the amount of functional groups and immersion heat can be understood from the standpoint of chemical properties and affinity. For carbon-based material, functional groups (e.g., carboxyl, phenolic, lactonic) determine the chemical properties and surface activity. These functional groups can interact with molecules in immersion liquids through non-covalent forces such as hydrogen bonding and van der Waals forces. Some even form covalent bonds, releasing a considerable amount of heat, as observed in the interaction between the carboxyl groups on the surface of activated carbon and sodium hydroxide.
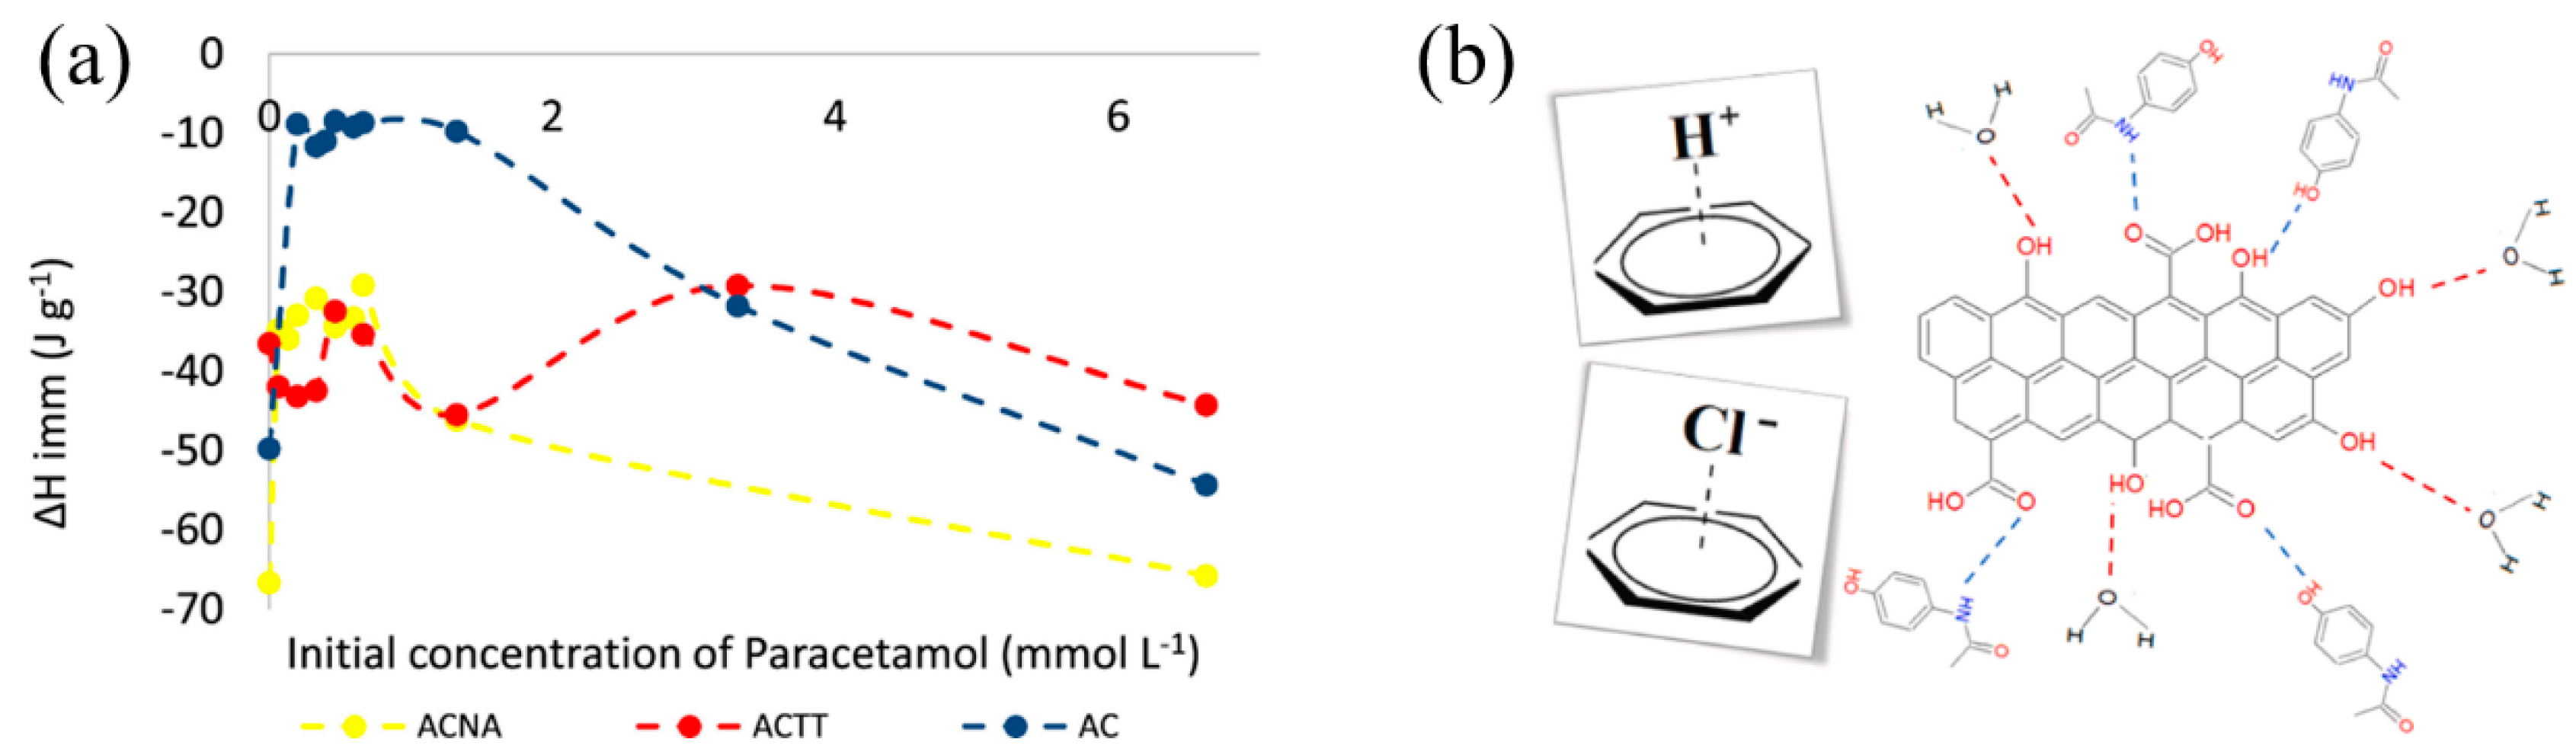
In order to elucidate how the functional groups on the surface of activated carbon influence its bonding with liquid molecules and consequent immersion enthalpy, numerous researchers have treated the surface of activated carbon and altered its functional groups. Bernal et al. [41] thermally and chemically treated a commercial activated carbon to modify its surface oxidation groups and further assessed the impact on the adsorption of paracetamol. They found that immersion enthalpy increased with a rise in overall alkalinity, indicating that π electrons have a low affinity for water. Conversely, the immersion enthalpy decreased as the total alkalinity reduced in acidic mediums (Figure 5). Rodríguez-Reinoso et al. [42] studied the influence of surface oxygen groups on immersion heat in activated carbon prepared from steam activation of olive stone and further oxidized with nitric acid. When measuring immersion enthalpy as a function of degassing temperature, they observed similar trends in both systems and the immersion heat in non-polar benzene was virtually unaffected by the removal of surface groups during thermal treatment. Acevedo et al. [43] chemically activated African palm shells to produce activated carbon and introduced the concept of a “hydrophobic factor”, which is defined as the ratio of the immersion enthalpy in benzene to that in water. It was observed that the immersion enthalpies of the activated carbon in benzene and dichloromethane were significantly higher than those in water, which indicates a strong hydrophobic character of the produced activated carbon. This underscores the general principle that a higher solid–liquid immersion enthalpy suggests stronger non-covalent interactions between the solid and the liquid. This concept has been widely accepted and acknowledged by many researchers. Bogeat et al. [44] immersed activated carbon in solutions with various ions to prepare samples coated with metal oxides and found the number and type of hydrophilic groups (functional groups containing oxygen on the activated carbon surface (like hydroxyl, carboxyl, and ketone groups) and coordinating groups and polarized bonds, such as metal–oxygen bonds in metal oxides) in the samples affected their affinity for water. Samples with more hydrophilic groups showed a stronger affinity for water, implying that activated carbon with more hydrophilic groups has higher immersion enthalpies in water. Diana et al. [45] discovered that when the oxygen-containing functional group content on the surface of activated carbon samples is reduced, there is a stronger interaction with toluene, resulting in an increased immersion enthalpy. This enhancement in interaction arises from the amplified non-covalent forces between the π electrons on the activated carbon surface and the electrons in the aromatic ring of toluene.
The emphasis of our discussion lies in these augmented non-covalent interactions. It is evident that due to the orders of magnitude difference between covalent and non-covalent interactions, one can readily differentiate between covalent and non-covalent interactions in their manifestations. Given that non-covalent forces are generally weaker in nature, the immersion enthalpy derived from immersion processes dominated by non-covalent interactions typically ranges from 5 J/g to 150 J/g. Similarly, Carvajal-Bernal et al. [46] pointed out that the interaction with water molecules can be intensified when there are more oxygen-containing groups on the surface of activated carbon. For the adsorption of phenol, water must first be displaced from its surface. This suggests that as the number of oxygen-containing groups on activated carbon increases, the enthalpy values obtained during phenol adsorption will decrease. Giraldo L et al. [47] modified activated carbon using nitric acid solutions to increase the content of acidic functional groups on its surface. They measured the immersion enthalpy of different activated carbons with lead nitrate and found that as the amount of acidic functional groups on the active surface increased, both the immersion enthalpy and the adsorption quantity of lead ions also rose.
Castillejos et al. [48] attributed the differences in immersion enthalpies of toluene between carbon nanotubes and graphite to the variations in the strength of non-covalent intermolecular interactions. Specifically, the π–π interactions of toluene with carbon nanotubes were found to be stronger. To discern which particular non-covalent interaction primarily contributes to the immersion enthalpies, it is essential to consider the molecular properties in the analysis. This highlights the influence of surface functional groups on immersion enthalpy, which is consistent with conclusions drawn from studies on activated carbon. Barton et al. [49] undertook studies on immersion calorimetry using various butyl derivatives of differing polarities, namely, n-butanol, n-butyric acid, n-butyl chloride, n-butanal, n-butyronitrile, and n-butylamine. For non-polar liquids, such as n-hexane, the immersion heat values for both oxidized and non-oxidized graphite were similar, suggesting that surface polarity has minimal impact on their interactions. However, the butyl derivatives presented a range of values with large differences, which can be attributed to the interplay between the electrostatic field on the graphite surface and the dipole moments of the liquid molecules. Additionally, Barton et al. [50] investigated the impact of different oxygen functional groups on the graphite surface concerning the immersion heat of various polar liquids, including benzene, water, and methanol. Stoeckli et al. [51] measured the immersion enthalpies of two non-porous illites in benzene and water. The per unit area immersion enthalpy for both illites in benzene was found to be comparable, approximately 73 mJ·m−2. However, in water, there was a significant disparity, registering at 371 mJ·m−2 and 782 mJ·m−2, respectively. Bernal et al. [52] employed immersion calorimetry to study the effect of sodium chloride solution concentration on the adsorption of acetaminophen and salicylic acid by activated carbon (Figure 6). With increasing ion concentration, the adsorption capacity of activated carbon for both acetaminophen and salicylic acid decreased, as reflected by the corresponding immersion enthalpies. This decrease was ascribed to the fact that the conjugation effects between π electrons and sodium ions diminished the adsorption affinity of activated carbon for acetaminophen and salicylic acid. Bursh et al. [53] established a correlation between the silica surface property and the immersion calorimetric data concerning the interaction between silica and water and further obtained evidence of potential variations in the surface bond characteristics across different silica samples. They found the content of hydroxyl groups on the silica surface is not directly related to immersion heat, even though typically, a silica surface with a high proportion of hydroxyl groups exhibited greater immersion heat.
3.2. Influence of Liquid-Accessible Surface Area on the Immersion Enthalpy at Solid Surfaces
A paramount concept in solid–liquid interface interaction is the total surface area of the solid that is accessible to the liquid molecules. This accessible surface area is primarily dictated by the pore structure, porosity, surface morphology of the solid, and the kinetic diameter and shape of the liquid molecules. Calorimetric methods can be employed to evaluate the pore size distribution of porous solids. For this, one needs to select probe molecules with varying kinetic diameters and measure their immersion enthalpy with the porous substrate. The pore size distribution acquired from calorimetry can then be compared relatively to results obtained from other methods, such as the determination of specific surface area through gas adsorption using the BET method.
Atkins et al. [54] investigated the immersion heat of a microporous activated carbon in an array of organic liquids and found that immersion enthalpy depends on the volume of the immersion liquid molecules that can enter the porous structure. This observation opened the possibility of utilizing calorimetric methods as tools for determining the pore size distribution of microporous carbon. Stoeckli and Kraehenbuehl [55] proposed a method to analyze immersion enthalpy data based on the Dubinin pore volume filling model. They established a mathematical relation describing the correlation between immersion enthalpy in liquid for microporous solids and the parameters from vapor adsorption based on the Dubinin–Radushkevich (DR) equation, where the immersion enthalpy is primarily governed by the micropore volume and the characteristic energy of the system. This equation suggests that the immersion enthalpy of microporous solids in a specific liquid is a function of the micropore network, in which characteristic energy is associated with the average pore diameter and is influenced not just by the micropore volume. The characteristic energy (E0) is a parameter describing the interaction strength between solid adsorbents, like activated carbon, and adsorbates (gaseous or liquid molecules), which is related to the microporous structure (including pore size and shape) of the adsorbent and surface functional groups (e.g., oxides or other chemical groups) affecting the interaction of adsorbate molecules with the solid surface. Moreover, the characteristic energy is also influenced by properties of the adsorbate molecule, such as molecular polarity and size. A higher E0 value indicates a stronger adsorbent–adsorbate interaction, which may lead to an enhanced adsorption capacity and selectivity.
Water is extensively used as a probe molecule for characterizing zeolites in terms of pore size distribution [56]. Water adsorption on hydrophilic zeolites has been utilized to measure its pore volume, indicating that the quantity of water adsorbed by zeolites is a linear function of its aluminum content [57]. Concurrently, in co-adsorption experiments, the relationship between hydrocarbons (e.g., toluene) and the weight of adsorbed water has been employed to define the hydrophobicity index (HI) of zeolites [58], which can be determined from the ratio of the weight of hydrocarbons to that of adsorbed water. Reinoso et al. [59] found that immersing carbonaceous materials (like microporous activated carbon and carbon molecular sieves) in non-polar or low-polarity liquids with different molecular sizes can estimate micropore size distribution and immersion in liquids of similar polarity (such as water or methanol) can characterize the hydrophilicity of the surface. Vargas et al. [60] prepared granular activated carbon by chemically activating African palm kernel and measured its immersion enthalpy with benzene. They found a relationship between immersion heat in benzene and accessible surface area, in which the immersion heat increased as the accessible surface area increased. Pendleton et al. [61] utilized microcalorimetry to measure the immersion enthalpies of baseline and reference carbons in various liquids at 30 °C with the aim to determine the specific surface area and pore size distribution of microporous polyvinyl alcohol-based activated carbon by conducting controlled and repetitive immersion calorimetry experiments. They discovered that the specific surface area obtained through immersion calorimetry closely resembled the pore size distribution and specific surface area derived from nitrogen gas adsorption (Figure 7). Giraldo et al. [62] investigated the pore size distribution and surface chemical properties of oxidized graphene via immersion calorimetry. They selected ten different probe molecules (including water, benzene, hexane, ethanol, and propanol) and conducted experiments on a laboratory-made calorimeter. They observed that molecules with smaller diameters exhibited larger immersion enthalpies with both graphite and oxidized graphene through plotting the relationship between the kinetic diameter of the liquid molecules and the immersion enthalpy of graphite and graphene. They also compared the pore size distribution results obtained from calorimetry with those derived using other methods. In conclusion, the use of calorimetry to study the specific surface area and pore size distribution of solid porous materials such as activated carbon, zeolites, and graphene has found considerable application. Moreover, this method shows promise for expansion to a wider range of porous materials.
4. Application of Calorimetry in the Study of Specific Solid–Liquid Interaction Processes
This section delves into the use of calorimetry for examining specific solid–liquid interface interaction processes, structured around two primary subsections.
4.1. Calorimetry in Investigating Adhesion and Adsorption Behavior during Solid–Liquid Immersion
Omar R. Harvey et al. [63] employed a flow adsorption microcalorimeter to probe the structural adsorption relationships between plant biochar with varying Lewis acidities and two metal ions. Zineb Fritah et al. [64] used mixed solution calorimetry to explore the impact of water molecules on the interactions of epoxyamines with metals ions. They found that the presence of water might significantly influence epoxyamine-based systems. Roth et al. [65] found that the mixing enthalpy of montmorillonite suspensions with LiCl, NaCl, and KCl correlates with the electrolyte solution concentration. They further pointed out that the enthalpy change is related to the collapse of montmorillonite layers, especially at specific interlayer spacings. Another observation was that the enthalpy change for LiCl with montmorillonite suspension was endothermic, while that for NaCl and KCl was exothermic. They speculated that the diffusion of ions to montmorillonite particles, ion penetration (adsorption) into the montmorillonite layers, and a restructuring of interlayered montmorillonite occurred during the mixing process of montmorillonite with the electrolyte solutions.
Douillard et al. [66] employed three distinct methods to analyze the enthalpy produced during the immersion of calcium ions or sodium ions saturated montmorillonite in water. In all cases, it was discerned that the interaction of calcium–ion saturated montmorillonite with water molecules was stronger than its sodium–ion counterpart. Sharma et al. [67] utilized immersion calorimetry at room temperature to determine the enthalpy of pseudo-clay Ti3C2Tx absorbing different cations (Li+, Na+, K+). They also examined the ion-exchange enthalpy and ascertained the insertion and release behavior of ions combined with pH measurements and ICP-MS analysis.
Drout et al. [68] studied the adsorption of pesticide toxins onto MOF materials using isothermal titration calorimetry (Figure 8). They deduced the changes in enthalpy, entropy, and Gibbs free energy during the adsorption process. Bernal et al. [69] gauged the immersion enthalpy of activated carbon in phenol, salicylic acid, and paracetamol and deliberated on the relationship between adsorption rates and enthalpy values. Additionally, the adsorption of organic toxins onto MOF materials investigated using isothermal titration calorimetry showed that the integrated heat data, aligned with the single-point model (depicted by the red line), validates that the adsorption processes for both toxins on MOF materials are exothermic in nature (Figure 9) [20].
4.2. Immersion Calorimetry as a Quantitative Method for Assessing Solid Particle Wettability
Wettability typically refers to the ability of a liquid to spread across a solid surface. The wettability of solid particles plays a pivotal role in areas such as mineral flotation [70], pharmaceutical engineering [71], catalysis [72], and petroleum extraction [73], etc. Contact angle method is the most direct and conventional method to evaluate the wettability between a solid and a liquid. However, utilizing the contact angle to describe wettability has several limitations. For instance, it requires the solid surface to be impeccably clean, and the reproducibility and precision of the obtained results need to be improved. Theoretically, one can deduce the solid–liquid immersion heat from the contact angle and vice versa. Indeed, immersion heat can provide a broader application scope than contact angle if wettability is defined as the affinity between the solid and the liquid.
4.2.1. Theoretical Derivation of the Contact Angle and Immersion Heat
According to the definition of the contact angle, when a droplet is placed on a uniform and smooth solid surface and achieves a stable form, the three interfacial angles between solid–liquid, solid–gas, and liquid–gas remain constant. At this point, the interfacial tensions between the three phases (solid, liquid, and gas) achieve equilibrium, and the forces at the trijunction comply with Young’s equation [74]:
Under constant temperature and pressure, the immersion process provides the following:
Equation (5) can be reformulated as follows:
Theoretically, the immersion enthalpy of a solid–liquid system is determined by the liquid surface tension and the solid–liquid contact angle. From Equation (6), the following can be deduced:
Let be denoted as K.
The relation becomes as follows:
The term K represents the change in interfacial tensions of solid–liquid and the solid surface with temperature under constant temperature and pressure conditions. According to Young’s equation, one only needs to measure the other three variables to calculate the surface energy of the solid. Contact angle θ and liquid surface tension can be directly measured using instruments. However, since the solid–liquid interfacial tension is difficult to be directly measured, several scholars have developed methods to solve for surface free energy based on the aforementioned rationale. Fowke et al. [75,76] posited that the liquid surface tension and the solid surface tension consist of dispersive component and polar component , as follows:
where is the molecular interaction produced by London forces, called dispersive interactions, which usually involve non-polar molecular interactions influenced by density. encompasses the molecular interactions produced by non-London forces, which include dipoles and hydrogen bonding, with its value influenced by surface polarity.
When only considering dispersive interactions between solid and liquid, it follows:
Combined with Equation (1), it becomes as follows:
where is the dispersive component of the liquid, and is the dispersive component of the solid. By Equation (12), measuring the angle θ between a known liquid with and and the tested solid will yield the dispersive component of the solid surface free energy. Aside from Fowke, other researchers [77,78,79,80,81,82,83,84,85,86,87,88,89] have also proposed methods to solve for solid surface free energy by considering molecular forces beyond dispersive forces. Overall, using immersion calorimetry to solve for the solid–liquid contact angle is theoretically feasible, but it proves complex in practical applications.
4.2.2. Practical Examples of Quantifying Solid Particle Wettability Using Immersion Calorimetry
Weston et al. [90] assessed the wettability of nano-silica utilized immersion calorimetry (Figure 9). Yan et al. [91] obtained immersion enthalpy data for water/nano-silica and toluene/silica systems through employing calorimetric techniques, in which the contact angles were derived by evaluating these data. Starting from the first principles of hydrophobic powders, Spagnolo et al. [72] established a relationship between immersion heat and contact angle. They also calculated the contact angle of pure water and fluorocarbon using the immersion enthalpy of pure water in fluorocarbon. Xu [92] measured the immersion enthalpies of three particles with varying wettability under different temperatures. Combined with accurate measurements of the interfacial tension as a function of temperature, they deduced the contact angle values from the immersion heat data. Taguta et al. [93] employed the obtained immersion enthalpy data as an indicator for evaluating the hydrophobicity of clay minerals and further used these data in their study on mineral flotation.
4.3. Characterization of Super-Hydrophobic Materials Using DSC
Through DSC analysis, researchers can obtain the thermal behavior of superhydrophobic materials, such as melting temperature (Tm), glass transition temperature (Tg), and heat of fusion (ΔHf). These parameters reflect the stability of the material’s internal structure and phase transition processes, which in turn affect the interaction between the material surface and water molecules. For instance, the thermal stability and crystallinity of a material can influence its surface microstructure and chemical properties, thereby altering its hydrophobic performance. Specific microstructures, such as micro or nano-scale rough structures, can enhance the material’s surface hydrophobicity by increasing the air layer, reducing direct contact between water molecules and the material surface.
Wang et al. [94] characterized the thermal behavior of a novel super-hydrophobic poly(methyl methacrylate) (PMMA)-polysulfone (PSF)-carbon nanofiber (CNF) composite material using DSC. Through DSC analysis, the research team was able to determine the melting temperature (Tm) and heat of fusion (ΔHf) of the composite material, providing crucial information on its thermal stability. Wu et al. [95] utilized DSC to reveal the impact of hydroxyl-rich silica particles addition on the thermal performance of polyvinylidene fluoride (PVDF) membranes, showing that the incorporation of silica particles not only induced the transition of PVDF chains from the α to the γ phase, but also facilitated the three-dimensional growth of polymeric spherulites through hydrogen bonding between hydroxyl groups and PVDF chains, thereby affecting the membrane’s thermal performance and crystallinity. Wu et al. [96] incorporated TMES-modified nano SiO2 into waterborne polyurethane (2K-WPU) to prepare coatings with high hydrophobicity. They employed DSC to evaluate the effect of modified nano SiO2 on the thermal properties of the substrate, particularly the change in glass transition temperature (Tg). Through DSC, they discovered that as the content of modified nano SiO2 increased, the Tg of the material rose, indicating that the inclusion of modified nano SiO2 enhanced the material’s thermal stability. Zhang et al. [97] prepared a biomass-based porous material using renewable beeswax, lignin, and cotton, which exhibited super-hydrophobicity and super-oleophilicity suitable for oil–water separation. They used DSC to assess the thermal stability and crystallinity of these porous materials. Additionally, DSC could reveal details of internal structural changes, such as phase separation behavior and changes in crystallinity.
5. Conclusions and Outlook
Calorimetry serves as an effective tool for probing solid–liquid interfacial interactions. It has been widely applied in studying the interactions between liquids such as water, organic solvents, and electrolyte solutions, and solids like activated carbon, zeolites, clay minerals, and silica. The immersion enthalpy values obtained through calorimetry are influenced both by the intensity of the solid–liquid interaction and by the accessible surface area of the solid to the liquid. Calorimetry offers thermodynamic insights into the solid–liquid binding process. Furthermore, the immersion enthalpy obtained from calorimetry can be employed as data for quantifying the wettability of solid–liquid systems, which is feasible both theoretically and practically. We anticipate that calorimetry will play an even more significant role in the research of solid–liquid interfacial interactions in fields such as petroleum extraction, mineral flotation, pharmaceuticals, and catalysis.
Author Contributions
Conceptualization, J.W. and M.Z.; writing—original draft preparation, H.H.; writing—review and editing, J.W. and M.Z.; visualization, M.Z.; supervision, J.W.; project administration, J.W.; funding acquisition, J.W. and M.Z. All authors have read and agreed to the published version of the manuscript.
Funding
This project was funded by the PetroChina Company Limited projects including Critical Technical Research of Functional Water Flooding Technology (2021DJ1302) and New Mechanism and New Method Research of Greatly Improving Oil Recovery in Low Permeability/Tight Reservoir (2023ZZ0404), and the Natural Science Foundation of Shaanxi Province (2021JQ-014).
Data Availability Statement
Not applicable.
Conflicts of Interest
The authors declare that they have no known competing financial interests or personal relationships that could have appeared to influence the work reported in this paper. The authors declare that this study received funding from the PetroChina Company Limited. The funder had the following involvement with the study: Critical Technical Research of Functional Water Flooding Technology (2021DJ1302) and New Mechanism and New Method Research of Greatly Improving Oil Recovery in Low Permeability/Tight Reservoir (2023ZZ0404).
References
- Yamada, Y.; Ichii, T.; Utsunomiya, T.; Sugimura, H. Visualizing polymeric liquid/solid interfaces by atomic force microscopy utilizing quartz tuning fork sensors. Jpn. J. Appl. Phys. 2020, 59, SN1009. [Google Scholar] [CrossRef]
- Bowles, A.P.; Honig, C.D.; Ducker, W.A. No-slip boundary condition for weak solid–liquid interactions. J. Phys. Chem. C 2011, 115, 8613–8621. [Google Scholar] [CrossRef]
- Shi, Z.; Ran, B.; Liu, L. Determining the interaction energy of a quartz–kaolinite system at different pH levels by atomic force microscopy and extended DLVO theory. Powder Technol. 2022, 409, 117842. [Google Scholar] [CrossRef]
- Ferreira, Q.; Delfino, C.L.; Morgado, J.; Alcácer, L. Bottom-Up Self-Assembled Supramolecular Structures Built by STM at the Solid/Liquid Interface. Materials 2019, 12, 382. [Google Scholar] [CrossRef] [PubMed]
- Kim, Y.; Kim, Y.J.; Park, J.Y. Scanning tunneling microscopy under chemical reaction at solid–liquid and solid–gas interfaces. Chem. Phys. Rev. 2023, 4, 031303. [Google Scholar] [CrossRef]
- Ngo, D.; He, X.; Luo, H.; Qu, J.; Kim, S.H. Competitive adsorption of lubricant base oil and ionic liquid additives at air/liquid and solid/liquid interfaces. Langmuir 2020, 36, 7582–7592. [Google Scholar] [CrossRef] [PubMed]
- Rodriguez, D.; Marquez, M.D.; Zenasni, O.; Han, L.T.; Baldelli, S.; Lee, T.R. Surface dipoles induce uniform orientation in contacting polar liquids. Chem. Mater. 2020, 32, 7832–7841. [Google Scholar] [CrossRef]
- Su, H.; Zhou, W.; Zhang, H.; Zhou, W.; Zhao, X.; Li, Y.; Liu, M.; Cheng, W.; Liu, Q. Dynamic evolution of solid–liquid electrochemical interfaces over single-atom active sites. J. Am. Chem. Soc. 2020, 142, 12306–12313. [Google Scholar] [CrossRef]
- Jiang, Y.; Huang, J.; Mao, B.; An, T.; Wang, J.; Cao, M. Inside solid-liquid interfaces: Understanding the influence of the electrical double layer on alkaline hydrogen evolution reaction. Appl. Catal. B 2021, 293, 120220. [Google Scholar] [CrossRef]
- Maillet, B.; Dittrich, G.; Huber, P.; Coussot, P. Diffusionlike drying of a nanoporous solid as revealed by magnetic resonance imaging. Phys. Rev. Appl. 2022, 18, 054027. [Google Scholar] [CrossRef]
- Verma, R.K.; Hill, J.O.; Niinistö, L.; Mojumdar, S.; Kumar, D.D. A curriculum framework for education in calorimetry. J. Mater. Educ. 2012, 34, 161–174. [Google Scholar]
- Bastos, M.; Abian, O.; Johnson, C.M.; Ferreira-da-Silva, F.; Vega, S.; Jimenez-Alesanco, A.; Ortega-Alarcon, D.; Velazquez-Campoy, A. Isothermal titration calorimetry. Nat. Rev. Methods. Prim. 2023, 3, 17. [Google Scholar] [CrossRef]
- Freire, E.; Mayorga, O.L.; Straume, M. Isothermal titration calorimetry. Anal. Chem. 1990, 62, 950A–959A. [Google Scholar] [CrossRef]
- Barranco-Medina, S.; Kakorin, S.; Lázaro, J.J.; Dietz, K.-J. Thermodynamics of the dimer−decamer transition of reduced human and plant 2-Cys peroxiredoxin. Biochemistry 2008, 47, 7196–7204. [Google Scholar] [CrossRef] [PubMed]
- Zhou, Y.; Larson, J.D.; Bottoms, C.A.; Arturo, E.C.; Henzl, M.T.; Jenkins, J.L.; Nix, J.C.; Becker, D.F.; Tanner, J.J. Structural basis of the transcriptional regulation of the proline utilization regulon by multifunctional PutA. J. Mol. Biol. 2008, 381, 174–188. [Google Scholar] [CrossRef] [PubMed]
- Alegre-Cebollada, J.; Cunietti, M.; Herrero-Galán, E.; Gavilanes, J.G.; Martínez-del-Pozo, Á. Calorimetric scrutiny of lipid binding by sticholysin II toxin mutants. J. Mol. Biol. 2008, 382, 920–930. [Google Scholar] [CrossRef]
- Penn, C.J.; Gonzalez, J.M.; Chagas, I. Investigation of atrazine sorption to biochar with titration calorimetry and flow-through analysis: Implications for design of pollution-control structures. Front. Chem. 2018, 6, 307. [Google Scholar] [CrossRef]
- Agostoni, V.; Anand, R.; Monti, S.; Hall, S.; Maurin, G.; Horcajada, P.; Serre, C.; Bouchemal, K.; Gref, R. Impact of phosphorylation on the encapsulation of nucleoside analogues within porous iron (iii) metal–organic framework MIL-100 (Fe) nanoparticles. J. Mater. Chem. B 2013, 1, 4231–4242. [Google Scholar] [CrossRef]
- Aykaç, A.; Noiray, M.; Malanga, M.; Agostoni, V.; Casas-Solvas, J.M.; Fenyvesi, E.; Gref, R.; Vargas-Berenguel, A. A non-covalent “click chemistry” strategy to efficiently coat highly porous MOF nanoparticles with a stable polymeric shell. Biochim. Biophys. Acta Gen. Subj. 2017, 1861, 1606–1616. [Google Scholar] [CrossRef]
- Kato, S.; Drout, R.J.; Farha, O.K. Isothermal titration calorimetry to investigate uremic toxins adsorbing onto metal-organic frameworks. Cell Rep. Phys. Sci. 2020, 1, 100006. [Google Scholar] [CrossRef]
- Wanhala, A.K.; Doughty, B.; Bryantsev, V.S.; Wu, L.; Mahurin, S.M.; Jansone-Popova, S.; Cheshire, M.C.; Navrotsky, A.; Stack, A.G. Adsorption mechanism of alkyl hydroxamic acid onto bastnäsite: Fundamental steps toward rational collector design for rare earth elements. J. Colloid Interface Sci. 2019, 553, 210–219. [Google Scholar] [CrossRef] [PubMed]
- Holdgate, G.A. Making cool drugs hot: Isothermal titration calorimetry as a tool to study binding energetics. Biotechniques 2001, 31, 164–166, 168, 170 passim. [Google Scholar]
- Geschwindner, S.; Ulander, J.; Johansson, P. Ligand binding thermodynamics in drug discovery: Still a hot tip? J. Med. Chem. 2015, 58, 6321–6335. [Google Scholar] [CrossRef]
- Klebe, G. Broad-scale analysis of thermodynamic signatures in medicinal chemistry: Are enthalpy-favored binders the better development option? Drug Discov. Today 2019, 24, 943–948. [Google Scholar] [CrossRef]
- Varghese, N.; Mogera, U.; Govindaraj, A.; Das, A.; Maiti, P.K.; Sood, A.K.; Rao, C. Binding of DNA nucleobases and nucleosides with graphene. ChemPhysChem 2009, 10, 206–210. [Google Scholar] [CrossRef]
- Lever, T.; Haines, P.; Rouquerol, J.; Charsley, E.L.; Van Eckeren, P.; Burlett, D.J. ICTAC nomenclature of thermal analysis (IUPAC Recommendations 2014). Pure. Appl. Chem. 2014, 86, 545–553. [Google Scholar] [CrossRef]
- Dołęga, A.; Juszyńska-Gałązka, E.; Deptuch, A.; Jaworska-Gołąb, T.; Zieliński, P.M. Thermoanalytical studies of a cytotoxic derivative of carbamazepine: Iminostilbene. J. Therm. Anal. Calorim. 2021, 146, 2151–2160. [Google Scholar] [CrossRef]
- Kumar, R.; Nirwan, A.; Mondal, B.; Kumar, R. Study on thermophysical properties of pentadecane and its composites with thermally expanded graphite as shape-stabilized phase change materials. J. Therm. Anal. Calorim. 2022, 147, 8689–8697. [Google Scholar] [CrossRef]
- Basko, A.V.; Pochivalov, K.V.; Chalykh, T.I.; Shandryuk, G.A.; Ezhov, A.A.; Artemov, V.V.; Kudryavtsev, Y.V. Combining optical microscopy, turbidimetry, and DSC to study structural transformations in the mixtures of semicrystalline polymers with low-molar-mass crystallizable substances. Thermochim. Acta 2020, 690, 178671. [Google Scholar] [CrossRef]
- Wang, C.; Wang, T.; Hu, Z.; Cai, Z. Facile synthesis and thermal performance of cety palmitate/nickel foam composite phase change materials for thermal energy storage. J. Energy Storage 2020, 28, 101179. [Google Scholar] [CrossRef]
- Leyva-Porras, C.; Cruz-Alcantar, P.; Espinosa-Solís, V.; Martínez-Guerra, E.; Piñón-Balderrama, C.I.; Martínez, I.C.; Saavedra-Leos, M.Z. Application of differential scanning calorimetry (DSC) and modulated differential scanning calorimetry (MDSC) in food and drug industries. Polymers 2019, 12, 5. [Google Scholar] [CrossRef]
- Rodríguez-Estupiñán, P.; Miranda-Carvajal, I.; Campos, P.C.; Guerrero-Fajardo, C.A.; Giraldo, L.; Moreno-Piraján, J.C. Graphene-based materials: Analysis through calorimetric techniques. J. Therm. Anal. Calorim. 2022, 147, 9301–9351. [Google Scholar] [CrossRef]
- Rouquerol, J.; Rouquerol, F.; Llewellyn, P.; Maurin, G.; Sing, K. Adsorption by Powders and Porous Solids: Principles, Methodology and Applications; Academic Press: Cambridge, MA, USA, 2013. [Google Scholar]
- Di Iorio, J.R.; Johnson, B.A.; Román-Leshkov, Y. Ordered hydrogen-bonded alcohol networks confined in Lewis acid zeolites accelerate transfer hydrogenation turnover rates. J. Am. Chem. Soc. 2020, 142, 19379–19392. [Google Scholar] [CrossRef]
- Giraldo, L.; Moreno-Piraján, J.C. Relation between immersion enthalpies of activated carbons in different liquids, textural properties, and phenol adsorption. J. Therm. Anal. Calorim. 2014, 117, 1517–1523. [Google Scholar] [CrossRef]
- Blanco-Martinez, D.; Giraldo, L.; Moreno-Pirajan, J. Effect of the pH in the adsorption and in the immersion enthalpy of monohydroxylated phenols from aqueous solutions on activated carbons. J. Hazard. Mater. 2009, 169, 291–296. [Google Scholar] [CrossRef]
- Moreno-Piraján, J.C.; Blanco, D.; Giraldo, L. Relation between the adsorbed quantity and the immersion enthalpy and the immersion enthalpy in catechol aqueous solutions on activated carbons. Int. J. Mol. Sci. 2011, 13, 44–55. [Google Scholar] [CrossRef] [PubMed]
- Rodríguez, G.; Giraldo, L.; Moreno, J. Calorimetric study of the immersion enthalpies of activated carbon cloths in different solvents and aqueous solutions. J. Therm. Anal. Calorim. 2009, 96, 547–552. [Google Scholar] [CrossRef]
- Rodríguez-Estupiñán, P.; Giraldo, L.; Moreno-Piraján, J.C. Modified surface chemistry of activated carbons: Correlation with immersion enthalpy. J. Therm. Anal. Calorim. 2013, 114, 245–251. [Google Scholar] [CrossRef]
- Hernández-Monje, D.; Giraldo, L.; Moreno-Piraján, J.C. Immersion enthalpy of benzene/cyclohexane and toluene/cyclohexane binary mixtures into modified activated carbons. J. Therm. Anal. Calorim. 2019, 138, 2565–2575. [Google Scholar] [CrossRef]
- Bernal, V.; Giraldo, L.; Moreno-Piraján, J.C. Understanding the solid-liquid equilibria between paracetamol and activated carbon: Thermodynamic approach of the interactions adsorbent-adsorbate using equilibrium, kinetic and calorimetry data. J. Hazard. Mater. 2021, 419, 126432. [Google Scholar] [CrossRef]
- Rodriguez-Reinoso, F.; Molina-Sabio, M.; Gonzalez, M. Effect of oxygen surface groups on the immersion enthalpy of activated carbons in liquids of different polarity. Langmuir 1997, 13, 2354–2358. [Google Scholar] [CrossRef]
- Acevedo, S.; Giraldo, L.; Moreno-Piraján, J.C. Adsorption of CO2 on activated carbons prepared by chemical activation with cupric nitrate. ACS Omega 2020, 5, 10423–10432. [Google Scholar] [CrossRef]
- Barroso-Bogeat, A.; Alexandre-Franco, M.; Fernández-González, C.; Gómez-Serrano, V. Physico-chemical characterization of activated carbon–metal oxide photocatalysts by immersion calorimetry in benzene and water. J. Therm. Anal. Calorim. 2016, 125, 65–74. [Google Scholar] [CrossRef]
- Hernandez-Monje, D.; Gutiérrez, L.G.; Moreno-Piraján, J.C. Immersion enthalpy of activated carbons with different oxygen content in toluene-hexane mixtures. J. Mol. Liq. 2020, 310, 113140. [Google Scholar] [CrossRef]
- Carvajal-Bernal, A.M.; Gómez-Granados, F.; Giraldo, L.; Moreno-Piraján, J.C. A study of the interactions of activated carbon-phenol in aqueous solution using the determination of immersion enthalpy. Appl. Sci. 2018, 8, 843. [Google Scholar] [CrossRef]
- Giraldo, L.; Moreno-Piraján, J. Immersion enthalpy variation of surface-modified mineral activated carbon in lead (II) aqueous solution adsorption: The relation between immersion enthalpy and adsorption capacity. Eclet. Quim. 2006, 31, 15–21. [Google Scholar] [CrossRef]
- Castillejos, E.; Bachiller-Baeza, B.; Rodríguez-Ramos, I.; Guerrero-Ruiz, A. An immersion calorimetry study of the interaction of organic compounds with carbon nanotube surfaces. Carbon 2012, 50, 2731–2740. [Google Scholar] [CrossRef]
- Barton, S.; Boulton, G.; Harrison, B. Surface studies on graphite: An estimation of the average polarity of the oxygen complexes. Carbon 1972, 10, 391–393. [Google Scholar] [CrossRef]
- Barton, S.; Harrison, B. Surface studies on carbon: Immersional energetics of spheron 6 in water. Carbon 1975, 13, 47–50. [Google Scholar] [CrossRef]
- Stoeckli, F.; Hugi-Cleary, D.; Centeno, T. The characterisation of solids by adsorption and immersion techniques and by AFM/STM. J. Eur. Ceram. Soc. 1998, 18, 1177–1185. [Google Scholar] [CrossRef]
- Bernal, V.; Giraldo, L.; Moreno-Piraján, J.C. Thermodynamic analysis of acetaminophen and salicylic acid adsorption onto granular activated carbon: Importance of chemical surface and effect of ionic strength. Thermochim. Acta 2020, 683, 178467. [Google Scholar] [CrossRef]
- Young, G.; Bursh, T. Immersion calorimetry studies of the interaction of water with silica surfaces. J. Colloid Sci. 1960, 15, 361–369. [Google Scholar] [CrossRef]
- Atkinson, D.; Mcleod, A.I.; Sing, K.; Capon, A. Physical adsorption and heat of immersion studies of microporous carbons. Carbon 1982, 20, 339–343. [Google Scholar] [CrossRef]
- Stoeckli, H.; Kraehenbuehl, F. The enthalpies of immersion of active carbons, in relation to the Dubinin theory for the volume filling of micropores. Carbon 1981, 19, 353–356. [Google Scholar] [CrossRef]
- Olson, D.; Haag, W.; Borghard, W. Use of water as a probe of zeolitic properties: Interaction of water with HZSM-5. Microporous Mesoporous Mater. 2000, 35, 435–446. [Google Scholar] [CrossRef]
- Sano, T.; Kasuno, T.; Takeda, K.; Arazaki, S.; Kawakami, Y. Sorption of water vapor on HZSM-5 type zeolites. Stud. Surf. Sci. Catal. 1997, 105, 1771–1778. [Google Scholar]
- Berke, C.H.; Kiss, A.; Kleinschmit, P.; Weitkamp, J. Der Hydrophobizitäts-Index: Eine neue Methode zur Charakterisierung der Oberflächeneigenschaften zeolithischer Adsorbentien. Chem. Ing. Tech. 1991, 63, 623–625. [Google Scholar] [CrossRef]
- Silvestre-Albero, J.; De Salazar, C.G.; Sepúlveda-Escribano, A.; Rodrıguez-Reinoso, F. Characterization of microporous solids by immersion calorimetry. Colloids Surf. A 2001, 187, 151–165. [Google Scholar] [CrossRef]
- Vargas, D.P.; Giraldo, L.; Moreno-Piraján, J.C. Characterisation of granular activated carbon prepared by activation with CaCl2 by means of gas adsorption and immersion calorimetry. Adsorption 2016, 22, 717–723. [Google Scholar] [CrossRef]
- Madani, S.H.; Silvestre-Albero, A.; Biggs, M.J.; Rodríguez-Reinoso, F.; Pendleton, P. Immersion calorimetry: Molecular packing effects in micropores. ChemPhysChem 2015, 16, 3984–3991. [Google Scholar] [CrossRef]
- Guerrero-Fajardo, C.A.; Giraldo, L.; Moreno-Piraján, J.C. Graphene oxide: Study of pore size distribution and surface chemistry using immersion calorimetry. Nanomaterials 2020, 10, 1492. [Google Scholar] [CrossRef]
- Harvey, O.R.; Herbert, B.E.; Rhue, R.D.; Kuo, L.-J. Metal interactions at the biochar-water interface: Energetics and structure-sorption relationships elucidated by flow adsorption microcalorimetry. Environ. Sci. Technol. 2011, 45, 5550–5556. [Google Scholar] [CrossRef]
- Fritah, Z.; Drouet, C.; Salles, F.; Marsan, O.; Aufray, M. Influence of water on an epoxy/amine-metal interphase: A combined DFT and mixing calorimetry approach. ACS Appl. Mater. Interfaces 2023, 15, 11342–11352. [Google Scholar] [CrossRef]
- Yan, L.; Low, P.F.; Roth, C.B. Enthalpy changes accompanying the collapse of montmorillonite layers and the penetration of electrolyte into interlayer space. J. Colloid Interface Sci. 1996, 182, 417–424. [Google Scholar] [CrossRef]
- Haouzi, A.; Salles, F.; Henry, M.; Douillard, J.-M. Thermodynamic analysis of the immersion of a smectite substituted with Na or Ca: Heat effect due to the cation. J. Colloid Interface Sci. 2007, 307, 531–542. [Google Scholar] [CrossRef]
- GSharma; Muthuswamy, E.; Naguib, M.; Gogotsi, Y.; Navrotsky, A.; Wu, D. Calorimetric study of alkali metal ion (K+, Na+, Li+) exchange in a clay-like Mxene. J. Phys. Chem. C 2017, 121, 15145–15153. [Google Scholar]
- Drout, R.J.; Kato, S.; Chen, H.; Son, F.A.; Otake, K.-I.; Islamoglu, T.; Snurr, R.Q.; Farha, O.K. Isothermal titration calorimetry to explore the parameter space of organophosphorus agrochemical adsorption in MOFs. J. Am. Chem. Soc. 2020, 142, 12357–12366. [Google Scholar] [CrossRef]
- Bernal, V.; Giraldo, L.; Moreno-Piraján, J.C. A new methodology to determine the effect of the adsorbate-adsorbent interactions on the analgesic adsorption onto activated carbon using kinetic and calorimetry data. Environ. Sci. Pollut. Res. 2020, 27, 36639–36650. [Google Scholar] [CrossRef]
- Wang, N.; Sasaki, M.; Yoshida, T.; Kotanigawa, T. Estimation of coal hydrophilicity by flow microcalorimetry. Colloids Surf. A 1998, 135, 11–18. [Google Scholar] [CrossRef]
- Hansford, D.T.; Grant, D.J.; Newton, J.M. Surface energetics of the wetting of a hydrophobic powder. J. Chem. Soc. Faraday Trans. 1980, 76, 2417–2431. [Google Scholar] [CrossRef]
- Spagnolo, D.A.; Maham, Y.; Chuang, K.T. Calculation of contact angle for hydrophobic powders using heat of immersion data. J. Phys. Chem. 1996, 100, 6626–6630. [Google Scholar] [CrossRef]
- Yan, N.; Masliyah, J.H. Characterization and demulsification of solids-stabilized oil-in-water emulsions Part 1. Partitioning of clay particles and preparation of emulsions. Colloids Surf. A 1995, 96, 229–242. [Google Scholar] [CrossRef]
- Young, T. An essay on the cohesion of fluids. In Abstracts of the Papers Printed in the Philosophical Transactions of the Royal Society of London; The Royal Society: London, UK, 1832; pp. 171–172. [Google Scholar]
- Fowkes, F.M. Additivity of intermolecular forces at interfaces. i. determination of the contribution to surface and interfacial tensions of dispersion forces in various liquids1. J. Phys. Chem. 1963, 67, 2538–2541. [Google Scholar] [CrossRef]
- Fowkes, F.M. Determination of interfacial tensions, contact angles, and dispersion forces in surfaces by assuming additivity of intermolecular interactions in surfaces. J. Phys. Chem. 1962, 66, 382. [Google Scholar] [CrossRef]
- Owens, D.K.; Wendt, R. Estimation of the surface free energy of polymers. J. Appl. Polym. Sci. 1969, 13, 1741–1747. [Google Scholar] [CrossRef]
- Jie-Rong, C.; Wakida, T. Studies on the surface free energy and surface structure of PTFE film treated with low temperature plasma. J. Appl. Polym. Sci. 1997, 63, 1733–1739. [Google Scholar] [CrossRef]
- Park, S.-M.; Roy, R.; Kweon, J.-H.; Nam, Y. Strength and failure modes of surface treated CFRP secondary bonded single-lap joints in static and fatigue tensile loading regimes. Compos. Part A 2020, 134, 105897. [Google Scholar] [CrossRef]
- Kaelble, D. Dispersion-polar surface tension properties of organic solids. J. Adhes. 1970, 2, 66–81. [Google Scholar] [CrossRef]
- Wu, S. Polar and nonpolar interactions in adhesion. J. Adhes. 1973, 5, 39–55. [Google Scholar] [CrossRef]
- van Oss, C.J.; Chaudhury, M.; Good, R.J. Monopolar surfaces. Adv. Colloid Interface. Sci. 1973, 5, 39–55. [Google Scholar] [CrossRef]
- Della Volpe, C.; Siboni, S. Acid–base surface free energies of solids and the definition of scales in the Good–van Oss–Chaudhury theory. J. Adhes. Sci. Technol. 2000, 14, 235–272. [Google Scholar] [CrossRef]
- Schultz, J.; Nardin, M. Determination of the Surface Energy of Solids by the Two-Liquid-Phase Method, Modern Approaches to Wettability: Theory and Applications; Springer: Berlin/Heidelberg, Germany, 1992; pp. 73–100. [Google Scholar]
- Shi, B.; Wang, Y.; Jia, L. Comparison of Dorris-Gray and Schultz methods for the calculation of surface dispersive free energy by inverse gas chromatography. J. Chromatogr. A 2011, 1218, 860–862. [Google Scholar] [CrossRef]
- Girifalco, L.; Good, R.J. A theory for the estimation of surface and interfacial energies. I. Derivation and application to interfacial tension. J. Phys. Chem. 1957, 61, 904–909. [Google Scholar] [CrossRef]
- Altay, B.N.; Ma, R.; Fleming, P.D.; Joyce, M.J.; Anand, A.; Chen, T.; Keskin, B.; Maddipatla, D.; Turkani, V.S.; Kotkar, P.R. Surface free energy estimation: A new methodology for solid surfaces. Adv. Mater. Interfaces 2020, 7, 1901570. [Google Scholar] [CrossRef]
- Li, D.; Neumann, A. Contact angles on hydrophobic solid surfaces and their interpretation. J. Colloid Interface. Sci. 1992, 148, 190–200. [Google Scholar] [CrossRef]
- Zhang, D. An Equation-of-State approach to measure the surface free energy (SFE) of bituminous binders. Measurement 2020, 158, 107715. [Google Scholar] [CrossRef]
- Weston, J.; Jentoft, R.; Grady, B.; Resasco, D.; Harwell, J. Silica nanoparticle wettability: Characterization and effects on the emulsion properties. Ind. Eng. Chem. Res. 2015, 54, 4274–4284. [Google Scholar] [CrossRef]
- Yan, N.; Maham, Y.; Masliyah, J.H.; Gray, M.R.; Mather, A.E. Measurement of contact angles for fumed silica nanospheres using enthalpy of immersion data. J. Colloid Interface Sci. 2000, 228, 1–6. [Google Scholar] [CrossRef]
- Xu, B. Further Exploration of Heat of Immersion as a Method to Quantify Wettability for Particulates: Effect of Temperature. Master’s Thesis, University of Oklahoma Graduate College, Norman, OK, USA, 2023. [Google Scholar]
- Taguta, J.; O’Connor, C.; McFadzean, B. The relationship between enthalpy of immersion and flotation response. Colloids Surf. A 2018, 558, 263–270. [Google Scholar] [CrossRef]
- Wang, H.; Sun, F.; Wang, C.; Zhu, Y.; Wang, H. A simple drop-casting approach to fabricate the super-hydrophobic PMMA-PSF-CNFs composite coating with heat-, wear-and corrosion-resistant properties. Colloid Polym. Sci. 2016, 294, 303–309. [Google Scholar] [CrossRef]
- Wu, C.; Tang, W.; Zhang, J.; Liu, S.; Wang, Z.; Wang, X.; Lu, X. Preparation of super-hydrophobic PVDF membrane for MD purpose via hydroxyl induced crystallization-phase inversion. J. Membrane Sci. 2017, 543, 288–300. [Google Scholar] [CrossRef]
- Wu, G.; Liu, D.; Chen, J.; Liu, G.; Kong, Z. Preparation and properties of super hydrophobic films from siloxane-modified two-component waterborne polyurethane and hydrophobic nano SiO2. Prog. Org. Coat. 2019, 127, 80–87. [Google Scholar] [CrossRef]
- Zhang, Y.; Zhang, Y.; Cao, Q.; Wang, C.; Yang, C.; Li, Y.; Zhou, J. Novel porous oil-water separation material with super-hydrophobicity and super-oleophilicity prepared from beeswax, lignin, and cotton. Sci. Total Environ. 2020, 706, 135807. [Google Scholar] [CrossRef] [PubMed]
Figure 1.
The graphic illustration of a simplified ITC instrument. (a) The ITC instruments are available in cylindrical (left) and coin-shaped (right) reaction pools. (b) When the reactant from the syringe is added to the reaction container (yellow squares), it combines with the reactant in the reaction pool (red circle with binding bag), and the excess remains in the solution in the reaction pool. Reprinted with permission from Ref. [12]. Copyright 2023 Springer Nature Ltd.

Figure 2.
Schematic diagram of the heat flux DSC principle. Reprinted with permission from Ref. [12]. Copyright 2022 Springer Nature Ltd.
Figure 2.
Schematic diagram of the heat flux DSC principle. Reprinted with permission from Ref. [12]. Copyright 2022 Springer Nature Ltd.

Figure 3.
Schematic diagram of the IM (1 sample; 2 glass bulb; 3 fragile tip; 4 fitting; 5 O-ring; 6 heat flowmeter; 7 immersion liquid). Reprinted with permission from Ref. [33]. Copyright 2014 Elsevier Ltd.
Figure 3.
Schematic diagram of the IM (1 sample; 2 glass bulb; 3 fragile tip; 4 fitting; 5 O-ring; 6 heat flowmeter; 7 immersion liquid). Reprinted with permission from Ref. [33]. Copyright 2014 Elsevier Ltd.

Figure 4.
Adsorption of cyclohexanone within the 2-butanol filled pores of (a) hydrophobic zeolite and (b) hydrophilic zeolite. Reprinted with permission from Ref. [34]. Copyright 2020 American Chemical Society.
Figure 4.
Adsorption of cyclohexanone within the 2-butanol filled pores of (a) hydrophobic zeolite and (b) hydrophilic zeolite. Reprinted with permission from Ref. [34]. Copyright 2020 American Chemical Society.

Figure 5.
(a) The immersion enthalpy of activated carbon in paracetamol solutions of varying concentrations; (b) the interaction between activated carbon and paracetamol in an acidic medium. Reprinted with permission from Ref. [41]. Copyright 2021 Elsevier B. V.
Figure 5.
(a) The immersion enthalpy of activated carbon in paracetamol solutions of varying concentrations; (b) the interaction between activated carbon and paracetamol in an acidic medium. Reprinted with permission from Ref. [41]. Copyright 2021 Elsevier B. V.

Figure 6.
The adsorption enthalpy of activated carbon for acetaminophen or salicylic acid in sodium chloride solutions of varying concentrations. Reprinted with permission from Ref. [52]. Copyright 2019 Elsevier B. V.
Figure 6.
The adsorption enthalpy of activated carbon for acetaminophen or salicylic acid in sodium chloride solutions of varying concentrations. Reprinted with permission from Ref. [52]. Copyright 2019 Elsevier B. V.

Figure 7.
The illustration of molecular optimal packing paradigm upon adsorption within the micropores. Reprinted with permission from Ref. [61]. Copyright 2015 WILEY-VCH.
Figure 7.
The illustration of molecular optimal packing paradigm upon adsorption within the micropores. Reprinted with permission from Ref. [61]. Copyright 2015 WILEY-VCH.

Figure 8.
Isothermal titration calorimetry investigation of organophosphorus pesticide adsorption onto MOF materials. Reprinted with permission from Ref. [68]. Copyright 2020 American Chemical Society.
Figure 8.
Isothermal titration calorimetry investigation of organophosphorus pesticide adsorption onto MOF materials. Reprinted with permission from Ref. [68]. Copyright 2020 American Chemical Society.

Figure 9.
Adsorption of p−CS potassium and potassium indoxyl sulfate on NU−1000 (a,c). The corresponding combined heat data (b,d) were fitted to the unit point model (red line) [20].
Figure 9.
Adsorption of p−CS potassium and potassium indoxyl sulfate on NU−1000 (a,c). The corresponding combined heat data (b,d) were fitted to the unit point model (red line) [20].

Disclaimer/Publisher’s Note: The statements, opinions and data contained in all publications are solely those of the individual author(s) and contributor(s) and not of MDPI and/or the editor(s). MDPI and/or the editor(s) disclaim responsibility for any injury to people or property resulting from any ideas, methods, instructions or products referred to in the content. |
© 2024 by the authors. Licensee MDPI, Basel, Switzerland. This article is an open access article distributed under the terms and conditions of the Creative Commons Attribution (CC BY) license (https://creativecommons.org/licenses/by/4.0/).
Share and Cite
MDPI and ACS Style
Hu, H.; Wu, J.; Zhang, M. Microcalorimetry Techniques for Studying Interactions at Solid–Liquid Interface: A Review. Surfaces 2024, 7, 265-282. https://doi.org/10.3390/surfaces7020018
AMA Style
Hu H, Wu J, Zhang M. Microcalorimetry Techniques for Studying Interactions at Solid–Liquid Interface: A Review. Surfaces. 2024; 7(2):265-282. https://doi.org/10.3390/surfaces7020018
Chicago/Turabian StyleHu, Heshu, Jiazhong Wu, and Minghui Zhang. 2024. "Microcalorimetry Techniques for Studying Interactions at Solid–Liquid Interface: A Review" Surfaces 7, no. 2: 265-282. https://doi.org/10.3390/surfaces7020018