The Effects of Adding Pyramidal and Convex Diffusers on Room Acoustic Parameters in a Small Non-Diffuse Room


1
School of Architecture, University of Florida, Gainesville, FL 32611, USA
2
Department of Computer Science, Aalto University, FI-02150 Espoo, Finland
*
Author to whom correspondence should be addressed.
†
These authors contributed equally to this work.
Acoustics 2019, 1(3), 618-643; https://doi.org/10.3390/acoustics1030037
Submission received: 23 June 2019
/
Revised: 19 July 2019
/
Accepted: 24 July 2019
/
Published: 2 August 2019
(This article belongs to the Special Issue Room Acoustics)
Abstract
:This paper presents an investigation of the effects of relatively large-scale pyramidal and convex-shaped diffusers on the acoustical properties of a small non-diffuse rectangular room. Room impulse responses (RIRs) were measured in various room configurations to extract the early decay time (EDT), reverberation time (T20), early-to-late arriving sound ratio (C50), and clarity (C80). The difference between the parameters measured in the empty room were chosen to be the reference, and those measured in other room configurations was calculated. Statistical analysis of the measurement results supplements the investigation to determine whether the coverage and type of diffusers contribute significantly to the variation of the acoustical parameters. The results show that adding diffusers in the room generally decreases EDT as well as T20, and increases C50 as well as C80 for both diffuser types. The statistical analysis shows that the coverage of diffusers significantly contributes to the variation of the acoustical parameters in most conditions (octave band, diffuser type). The effect of the diffuser shape is only significant for some of the conditions (at 4 kHz, the number of diffusers). The data presented demonstrate that in a small non-diffuse room the reverberation can be controlled efficiently by redirecting the sound energy towards the most absorbing surfaces.
1. Introduction
Sound waves reflected back from diffusing surfaces are temporally and spatially dispersed. Therefore, the inclusion of such surfaces in an enclosed space plays a key role in its acoustic quality. For example, these types of surfaces have proven to be effective at preventing echoes in auditoriums and concert halls [1], and at reducing coloration in small rooms used for sound reproduction [2]. Another application example is the reduction of focusing effects of concave surfaces [3].
While research on the quantification and characterization of the surface scattering is well documented (e.g., two international standards focusing on methods to measure the directional uniformity of the surface scattering have been published [4,5]), fewer studies focus on the effects of these surfaces on the acoustical properties of enclosed spaces. Several of these studies employed scale models and in-situ measurements to determine the effects of diffusing surfaces on the sound field. Jeon et al. [6] investigated the effects of wall diffusing elements on the diffuseness of sound-fields in both a 1:10 scale model hall and in a real recital hall. Among the results, it was found that diffusive surfaces enhanced effective absorption and therefore decreased mainly early decay time (EDT) for both halls. However, other objective acoustical parameters did not show any consistent tendencies with respect to the presence of diffusers. In another work, Jeon and Kim [7] measured EDT, reverberation time (T30), and clarity (C80), in two scale models (1:50 and 1:25) of a concert hall. These parameters were measured for eight configurations of the hall created using hemispherical diffusers with different geometrical height and a reference configuration without diffusers. It was concluded that the acoustical parameters were inconsistently changing across the configurations as a result of adding diffusers. Choi [8] studied the effects of periodic type diffusers on classroom acoustics by adding different amounts of absorptive and diffusing materials to one or more of five surfaces of a 1:10 scale model classroom. The comparison of the most successful treatment with a typical acoustical treatment of a classroom led to early-to-late arriving sound ratio (C50) values increased by more than one just noticeable difference (JND) while EDT and T30 values decreased by more than one JND. Shtrepi et al. [9] measured the acoustic scattering effects produced by a lateral diffusive wall in a small variable-acoustics hall. Four objective acoustic parameters were compared between a diffusive and a reflective condition of the wall. It was found that, as the acoustic scattering increased, the values of EDT and T30 increased while these of C80 and definition (D50) decreased.
Computer simulations have also been performed to determine the effects of diffusing surfaces on the sound field. Shtrepi et al. [10] investigated both objectively and perceptually the effects of different scattering coefficients applied to the walls and ceiling of a simulated concert hall, using three prediction models based on geometrical acoustics. The authors reported that the values of the analyzed acoustic parameters (T30, EDT, C80, and sound strength G) depend mainly on the source-to-receiver distance and on the scattering coefficient variation, rather than on the distance from the considered lateral wall. An increase in EDT and a decrease in C80 have also been observed for increasing scattering coefficient values for all three software, while no similar trend was observed for the other parameters. Table 1 shows a summary of the findings of the previous studies in regard to the change of the acoustical parameters as a result of the addition of diffusing surfaces in the room.
Despite recent advances in understanding why and where diffusers should be applied, there is a need to further investigate the right placement, amount, or shape of these surfaces as it still seems to be guided by “guess-work” in the design process of rooms [16]. One difference that causes this research to stand out from the previous similar studies is the large number (35) of different measured scattered sound fields or configurations that allowed for a more in-depth analysis of the results and more solid conclusions. Additionally, rather than using a metric characterizing the scattering produced by the diffusers, the effects produced by the inclusion of the diffusers in the room on its acoustical parameters are investigated by changing the placement, number, and type (shape) of the diffusers. Furthermore, the differences in acoustical parameters between comparable room configurations and a reference, that is the empty room (i.e., without diffusers), are statistically analyzed. Another feature of the present work is the non-diffuse nature of the empty room characterized by a distribution of hard, thus reflective, materials on the walls and absorptive materials on the ceiling and floor. The aim of this work is to investigate the effect of the inclusion of diffusing surfaces with respect to their placement, amount, and shape in small non-diffuse spaces. As such, the scope of the present paper is restricted to this type of room as the volume of the room as well as the distribution of hard and absorptive materials will affect how the diffusers impact the sound field.
The remaining sections of this paper are organized as follows. Section 2 describes the room impulse response (RIR) measurement procedure along with the measured room configurations and the two types of diffuser used. Section 3 presents the acoustical parameter measurement results. In Section 4, the results are analyzed both in terms of differences with respect to the empty room and statistically to compare the effect of the number of diffusing elements and their shape on the measured acoustical parameters. Section 4 discusses these results before concluding on the study in Section 5.
2. Impulse Response Measurements
2.1. Measurement Procedure
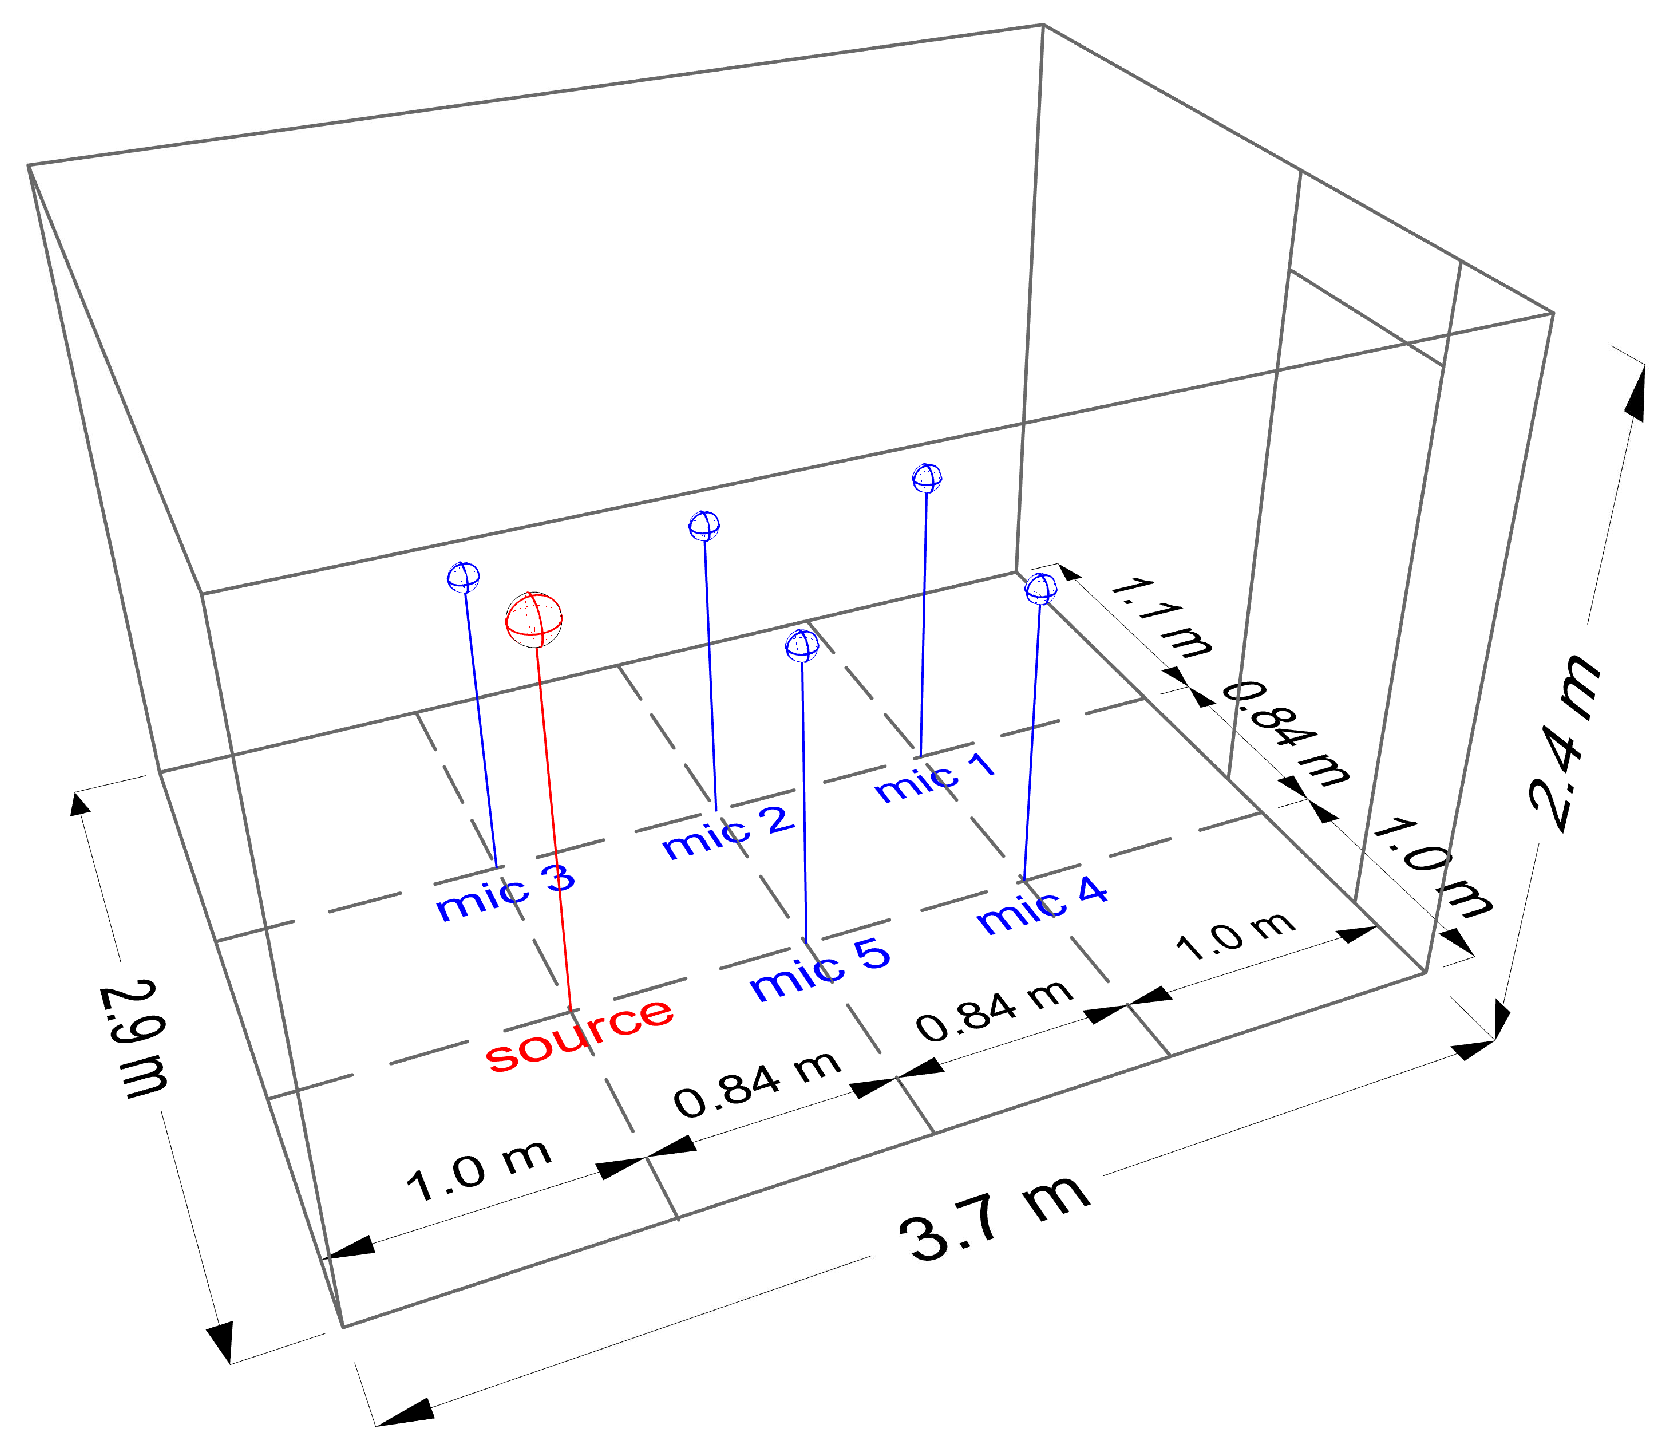
Impulse response measurements were carried out according to ISO 3382-2:2008 [17] in an unfurnished room of volume V = 25.2 m having no other use than testing purposes. All measurements were conducted with no people inside the room in a few sessions spread over several days. In order to achieve an appropriate coverage in the room and to account for influences likely to cause differences in reverberation time (RT) throughout the room, one omni-directional class 1 microphone (NTi Audio M2230) placed at a height of 1.2 m was moved between five different and evenly distributed positions across the room. The output of the signal recorded by the microphone was taken by a signal recorder for later analysis. The distance from any microphone position to any reflecting surface of the room and to the source was set to be 1.0 m and 0.84 m, respectively, which complies with the minimum requirement set in the ISO standard [17]. To make sure that all measurement positions were independent, the minimum distance between two microphones was set to be 0.84 m. Because the room used for conducting the measurements has no other special use than testing purposes, a single source position was used (height was set at 1.5 m). To improve the signal-to-noise ratio, each source-receiver measurement was repeated four times for each room configuration, thus resulting in a total of 4 × 5 = 20 impulse responses to compute for each room configuration. The source and receiver positions, as well as the room dimensions are illustrated in Figure 1.
The source signal fed to the dodecahedron loudspeaker (Larson Davis, Type BAS001) was a logarithmic sweep of a duration of 4.5 s from 100 Hz to 8 kHz that was generated using a personal laptop. A 100 ms fade-in and fade-out was applied to smooth the amplitude of the excitation signal fed to the loudspeaker. A silence of 3 s was also added in the excitation signal between each sweep repetition to allow for the room response to be fully recorded. Finally, a click was introduced 1 s before the start of the sweep so that the source and recorded signals could be synchronized for the calculation of the impulse response taking into account any delays introduced by the measurement chain.
Impulse responses were calculated after all measurement data were collected from the signals recorded at the microphone positions. To obtain the impulse responses, the microphone recordings were first synchronized with the full source excitation signal (including the click at its beginning). This synchronization was done by aligning visually the two channels corresponding to the emitted and recorded signals, thus removing any delays between the full source excitation signal and the recorded signals. After synchronization, recorded signals were convolved with the inverse sweep to result in the impulse response [18].
2.2. Measured Configurations
As part of a bigger study, a total of 69 room configurations, including the empty room serving as the reference, were measured following the procedure described in Section 2.1. These configurations were sketched out such that the effects of scattered reflections on the room acoustic parameters were investigated in regard to i. the placement of the diffusers, i.e., the distribution pattern of the diffusers over the wall surfaces; ii. the coverage of the diffusers, i.e., the number of diffusers added in the room; iii. the type of diffuser between a pyramidal and a convex-shaped diffuser acquired from a manufacturer (AVL Systems, Inc., Ocala, FL, USA); iv. the size of the diffusers, either “full-scale” (1.2 m × 1.2 m) or “half-scale” (0.6 m × 0.6 m) diffusers; v. the combination of different types of diffusers. In the present paper, the investigation solely focuses on the contribution of the placement, coverage, and type of the diffusers in the change of the room acoustic parameters, thus reducing the number of configurations to analyze from 69 to 35 (including the empty room).
In the empty room (reference configuration), the structure of the wall assembly is comprised of two layers of 13 mm plasterboards on frame with a cavity of 10 cm in between filled with mineral wool. A 80 cm × 200 cm solid wooden door located on one of the walls discontinues the homogeneous structure of the walls. The floor is covered with loop pile tufted carpet (1.4 kg/m) with no underlay, and the ceiling is made of acoustical tiles (USG Radar Ceramic 5/8"). As such, while the wall finishes are made of reflective surfaces, the floor and ceiling are absorptive, resulting in a non-diffuse room. The absorption coefficients of the aforementioned materials are reported in Table 2.
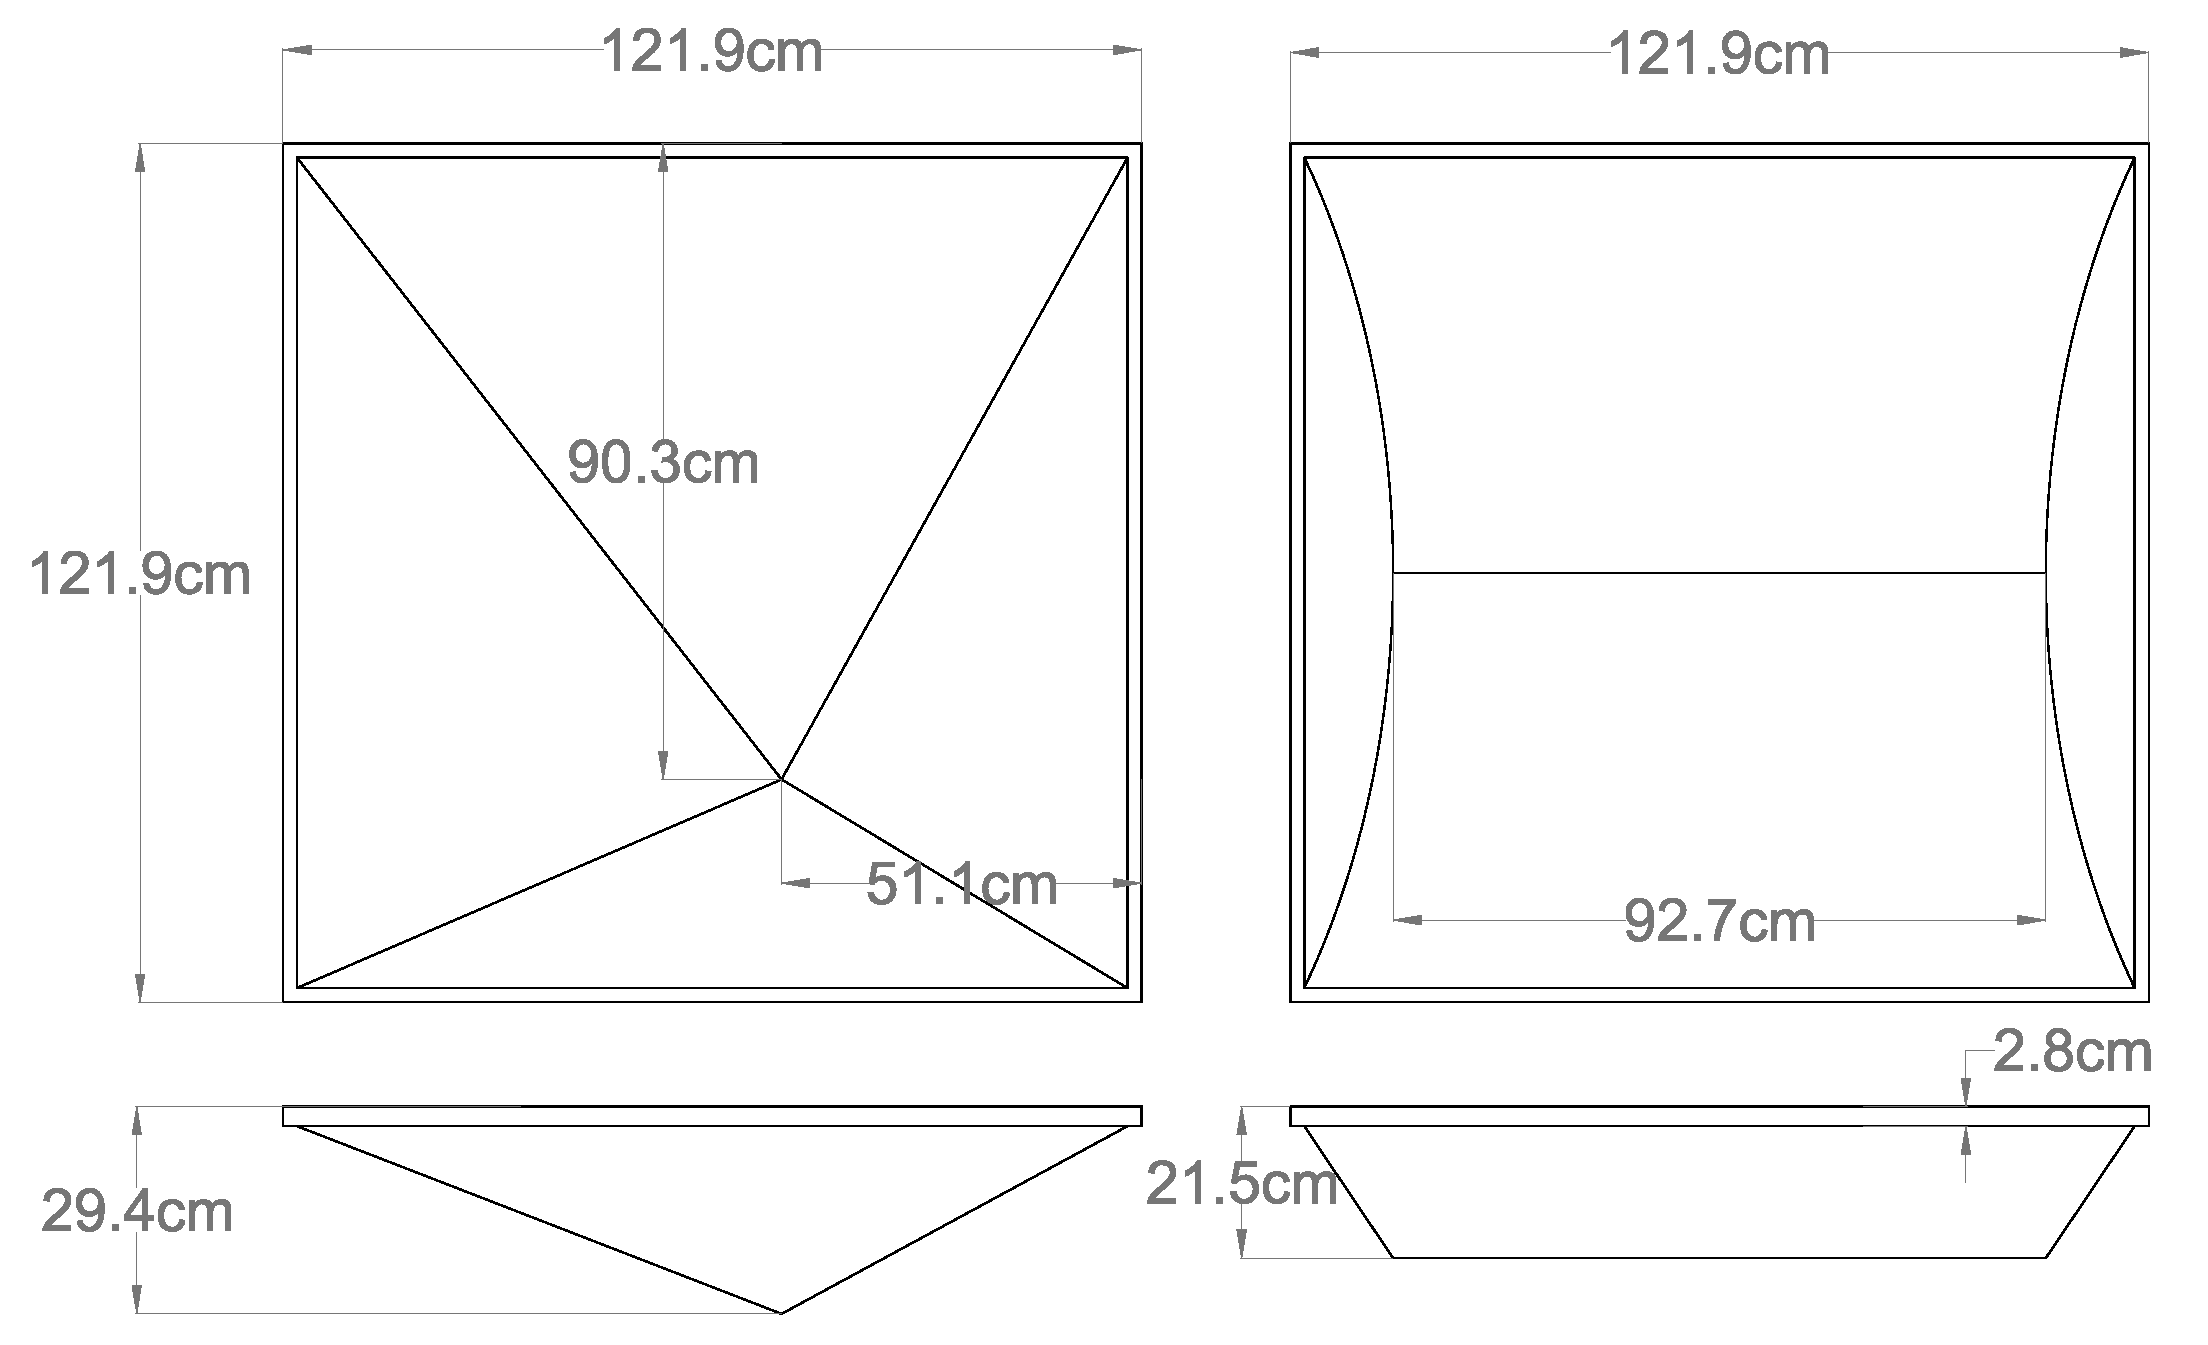
The maximum number of diffusers added in the room was set to three for both the pyramidal and convex-shaped diffusers, and only one size, the “full-scale”, was used. The 3D models and dimensions of the pyramidal and convex-shaped diffusers, from now referred to as pyramid and convex diffusers, respectively, are shown in Figure 2. The pyramid and convex diffusers have a volume of 0.17 m and 0.20 m, respectively, and rounded up to one decimal their volume is the same (0.2 m). Their surface area, as seen from inside the room, is also approximately the same (1.5 m for pyramid and 1.6 m for convex). Additionally, both diffuser types are made of the same finishes and similar materials as confirmed by visual inspection and discussion with the manufacturer. Given these observations and since the absorption coefficients of the diffusers were not provided by the manufacturer for the size in use, these were found from other manufacturers’ databases producing the same diffuser types. The average absorption coefficients across four different manufacturers’ databases [19,20,21,22] for the pyramidal diffuser (maximum standard deviation (SD) across octave bands of 0.02) was used to estimate the absorption area of both diffuser types, and is reported in Table 2.
The location, especially in height, of the diffusers on the walls was constrained by the placement of racks to mount the diffusing geometries. The area centroid point of the diffusers was located at approximately half of the height of the room, i.e., ∼1.3 m from the floor. The mounting clips attached to the back of the diffusers also constrained the convex diffuser to be oriented horizontally in all configurations. As for the pyramid diffusers, the clips constrained the positioning on the wall to some specific orientations visible in Figure 3 and on the 3D models of the configurations (see Table A1, Table A2, Table A3, Table A4, Table A5 and Table A6).
2.3. Assumptions
Three assumptions were made prior to analyzing the data. First, the maximum change in the volume of the room as a result of mounting three diffusers is considered negligible since it is of 2.4% with respect to the empty room.
Second, the maximum change in the total absorption area of the room due to the mounted diffusers is also considered negligible. This assumption is based on the results calculated using Equation (1) and presented in Table 2. As can be seen in Table 2, the maximum change in the total absorption area of the room varies from 0.3% to 2.6% across all octave bands, which can be considered negligible.
where and denote the absorption area of the room containing three diffusers and the empty room, respectively. and have been calculated using the definition of the absorption area given by A = , where i is the material in the room and and are its absorption coefficient and surface area, respectively. It should be noted that this formula applies only in a diffuse sound field and we are assuming a roughly diffuse sound field in this context.
Third, the net absorption due to the gap between the diffusers and the walls is neglected. The diffusers were installed on the walls using the mounting clips fixed at the back of the diffusers, with a measured width of 10 mm. This resulted in the slightly slanted installation of the diffusers with a gap varying from 10 mm to 0 mm in size over a length of 1.05 m, that is a slope of <1%. The small size of the gap along with the reduction of its size to zero across the height of the diffusers provided enough evidence to assume that the net absorption due to this gap can be neglected.
3. Acoustical Parameter Results
3.1. Groups and Configurations
A total of six groups were defined for analysis. These groups are reported in Table 3 along with the configurations they contain. The 3D views of the configurations are shown in the Appendix A. The configurations were specifically designed for this investigation in a way that the effects of the coverage, type, and placement of the diffusers were to be easily considered by comparing certain groups of configurations with each other.
3.2. Acoustical Parameters
From the measured impulse responses, four acoustical parameters, namely EDT, T20, C50 and C80, were calculated according to the standard [17]. More specifically, these acoustical parameters were calculated from the decay curves corresponding to the backward integrated squared IRs. Measurements were averaged across microphone positions per octave band by finding the individual acoustical parameters for all the decay curves and taking the mean value. The calculated acoustical parameters per octave band are reported in Table 4 for the empty room and Table A1, Table A2, Table A3, Table A4, Table A5 and Table A6 for the configurations with added diffusers, that can be found below and in the Appendix A, respectively.
4. Results Analysis
The data was analyzed using two approaches. In the first approach, referred to hereafter as amount change, the amounts of variation of objective acoustical parameters due to the addition of the diffusers to the empty room are analyzed for the different groups reported in Table 3. In the second approach, a series of statistical tests (Kruskal–Wallis tests) were carried out to examine the significance of difference in the acoustical parameters between the groups of configurations with the intention to analyze the effects of the type and coverage of the diffusers. As a way of data reduction with the caution of not losing important data, three frequency ranges were defined: a low frequency range comprising center frequencies ranging from 250 to 500 Hz, a mid frequency range including 1 k and 2 kHz octave bands, and a high frequency range including the center frequency 4 kHz. The choice of splitting the data into these three frequency ranges was intentionally made prior to analyzing it such that no bias was introduced in the data analysis while the frequency-dependency of the results could be maintained. For each defined frequency range, the data was averaged across corresponding octave bands, thus resulting in a single value for each of the three defined (low, mid, and high) frequency ranges.
4.1. Amount Change
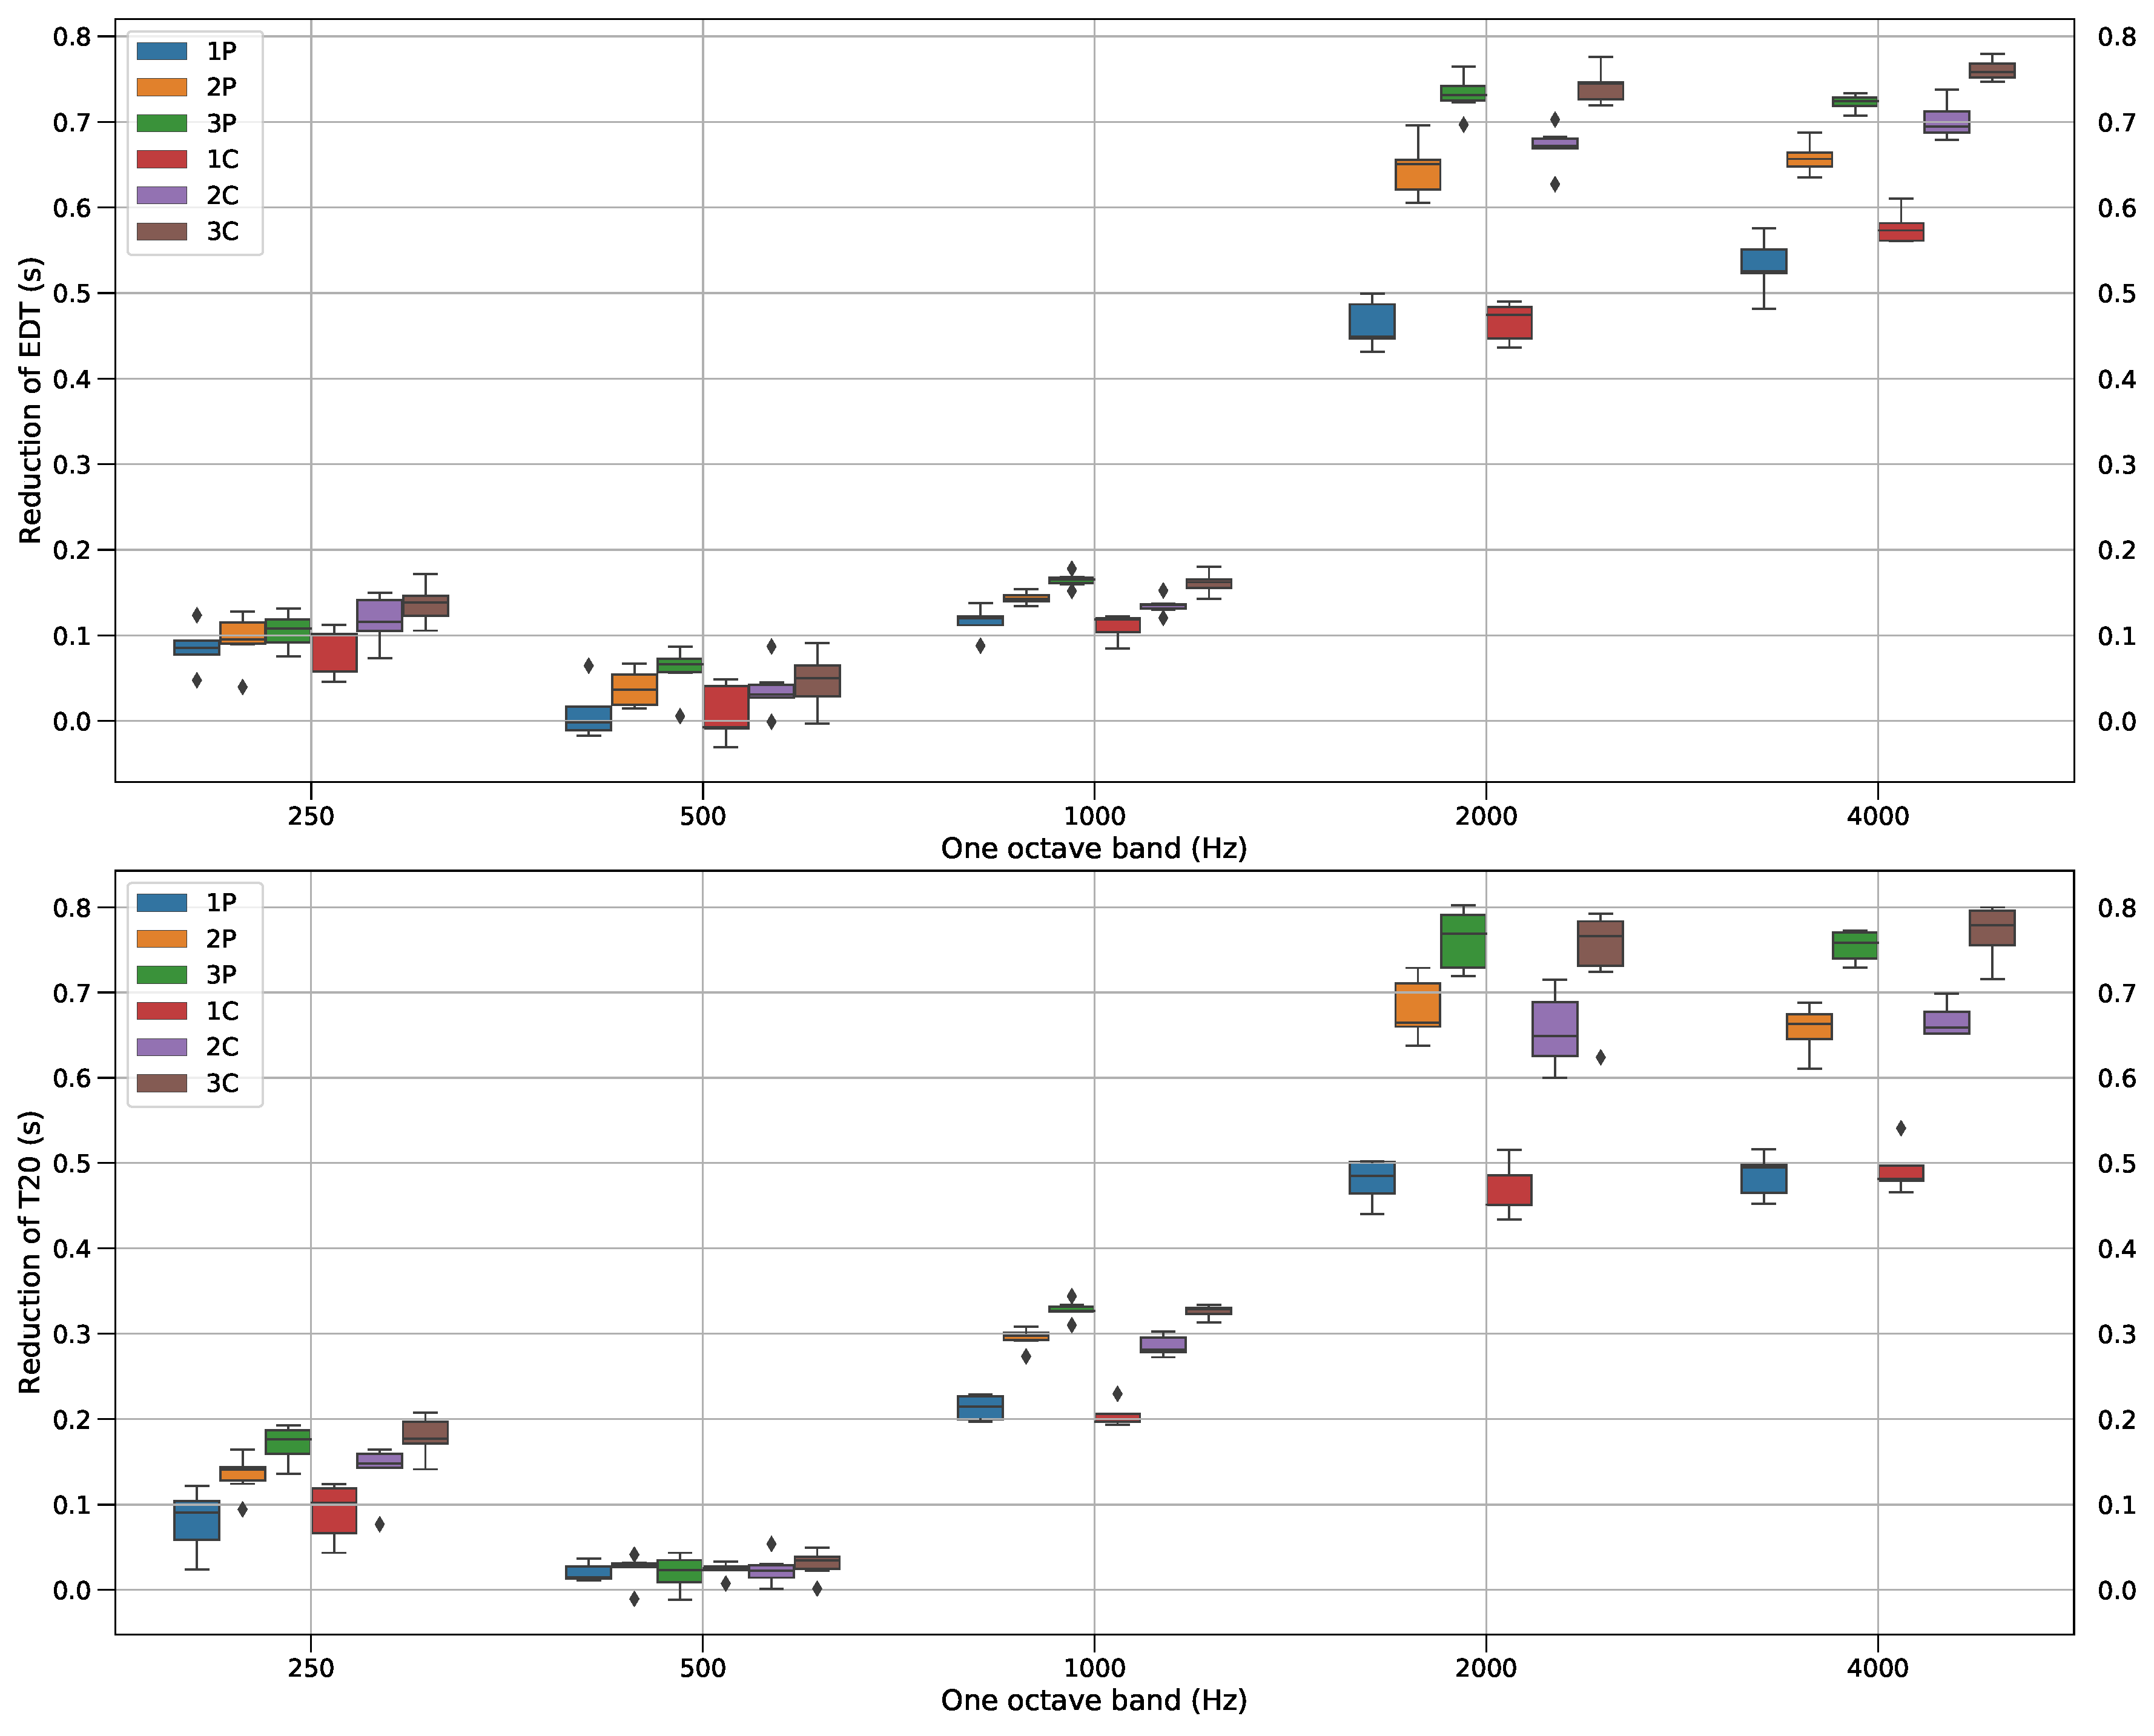
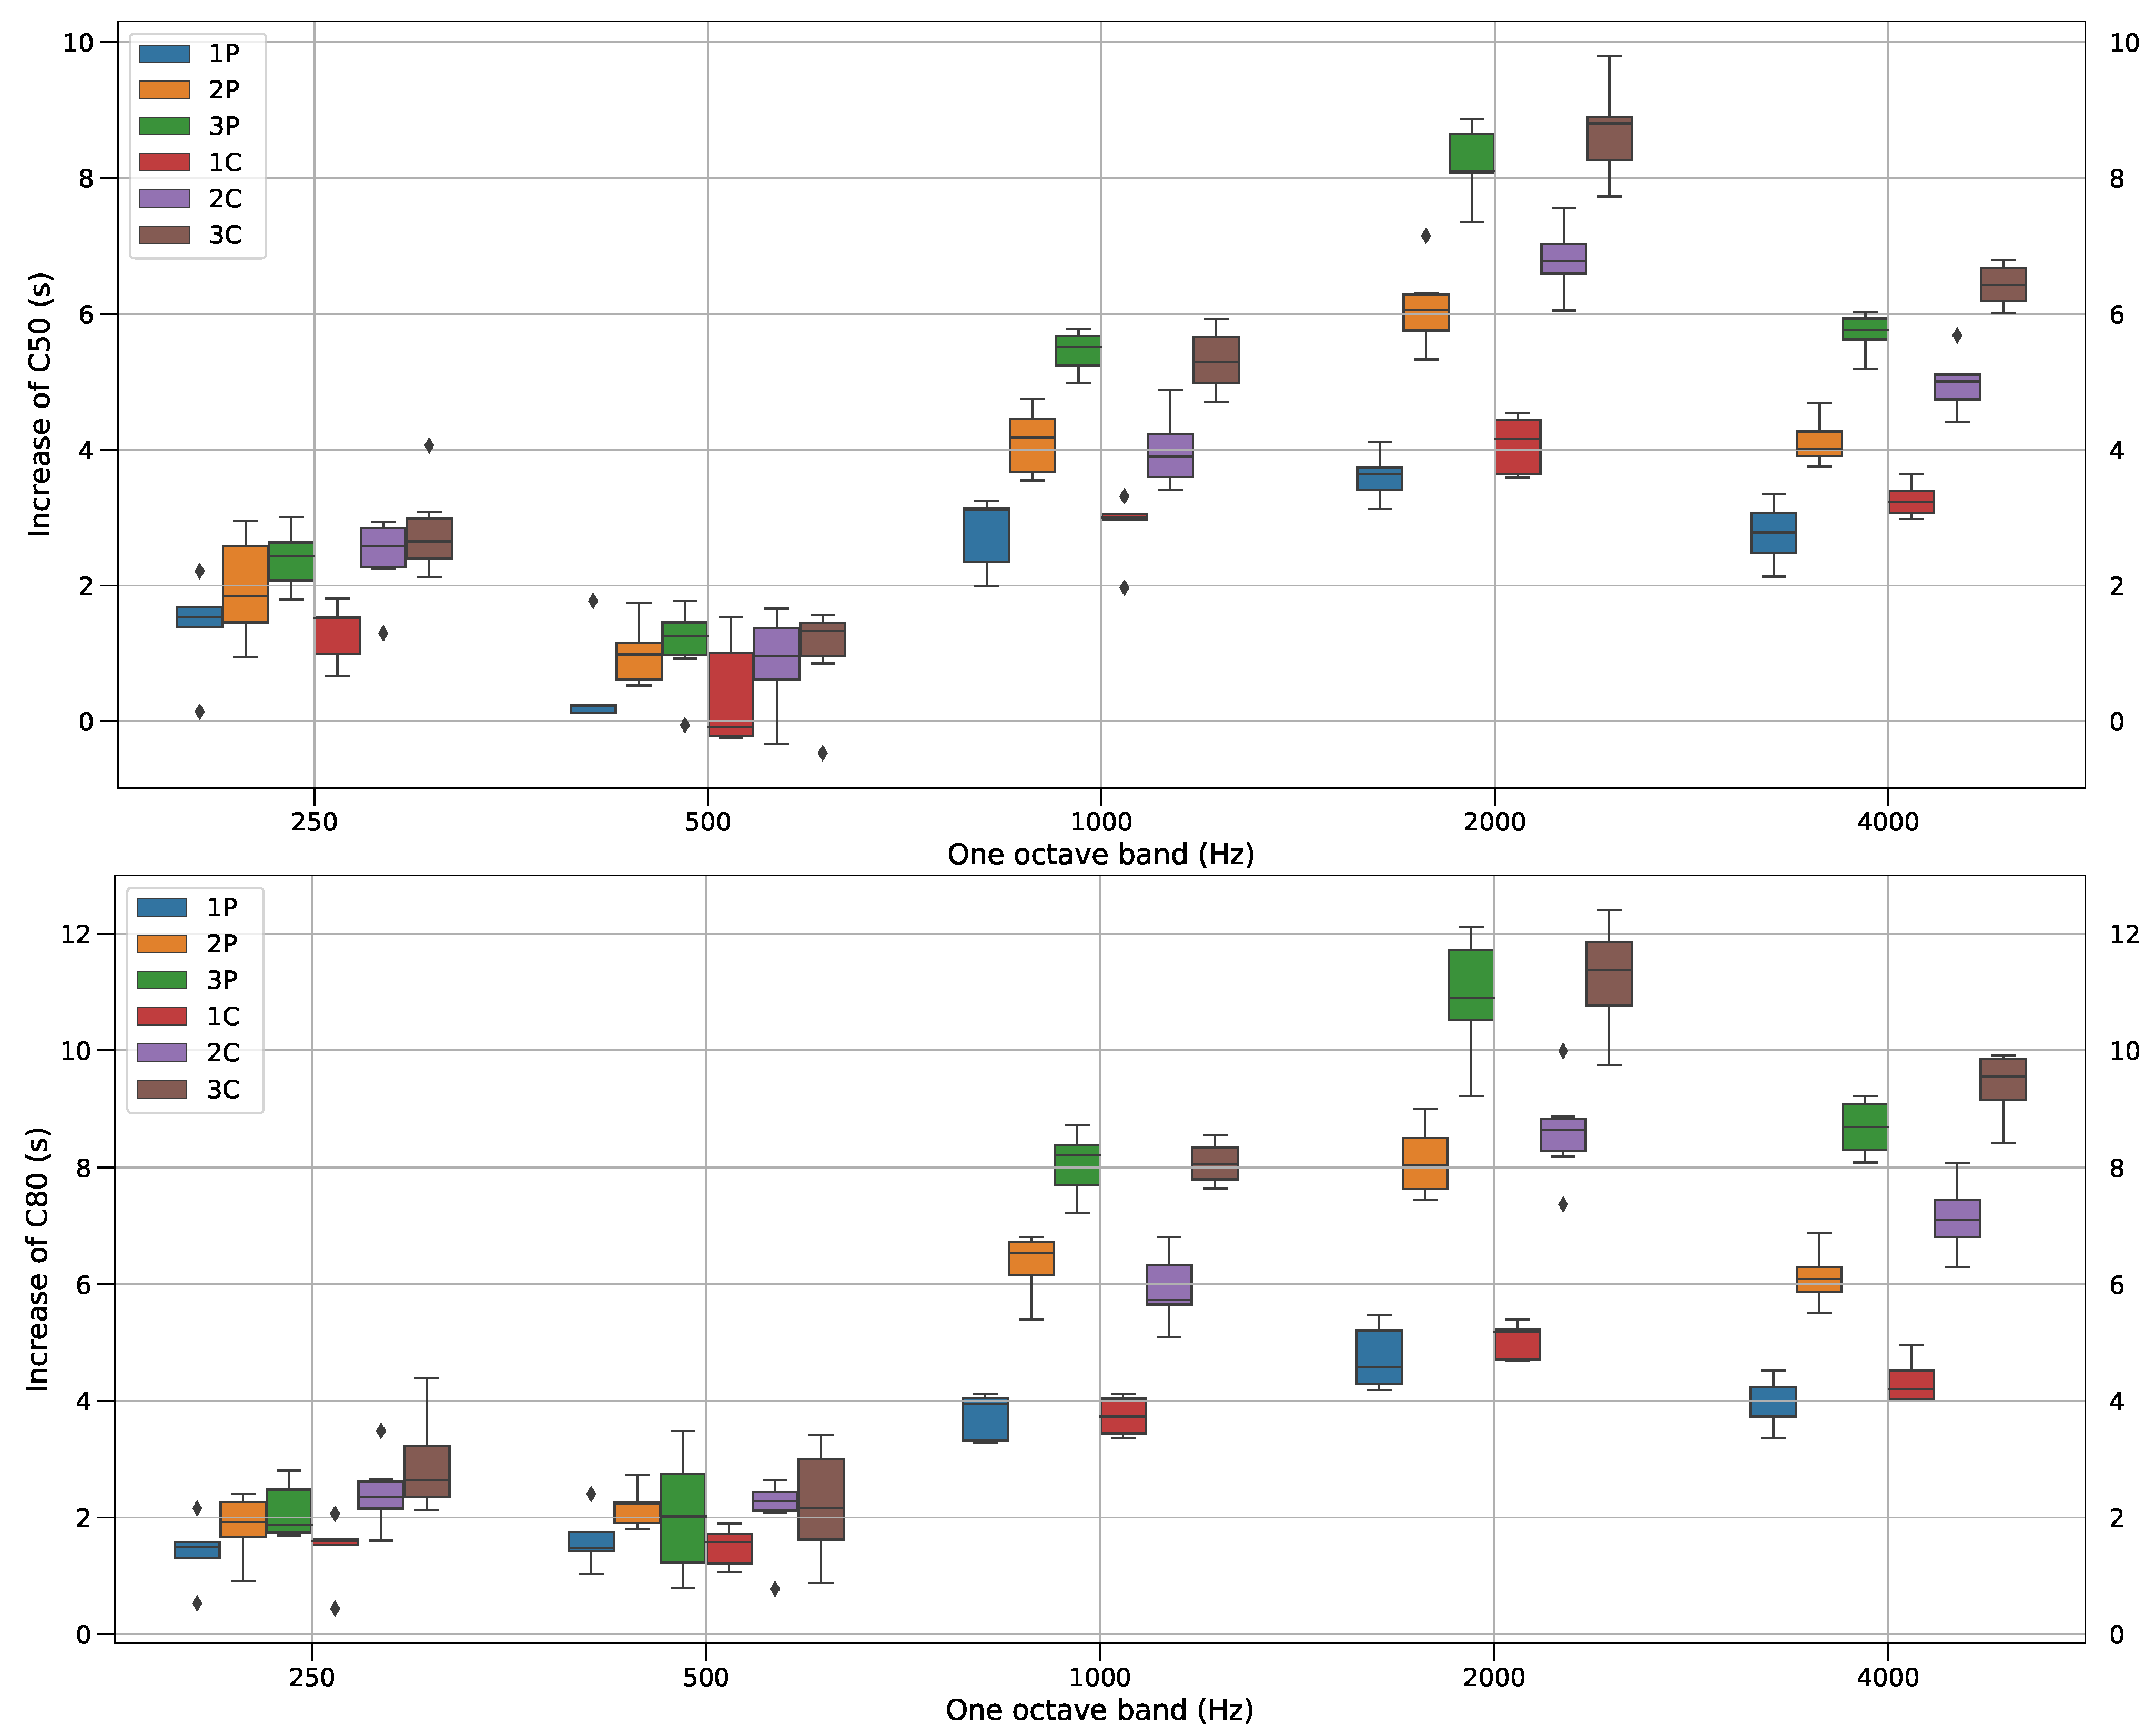
In this approach, the mean value of each acoustical parameter (average across microphone positions) measured in each room configuration was subtracted from this of the empty room. The resulting difference representing the amount of change of each parameter for the configurations of each group with respect to the reference is expressed in seconds for EDT and T20, and in decibels for C50 and C80. These amounts of change are shown in Figure 4 and Figure 5 per octave band and discussed in the following paragraphs.
From the plots in Figure 4 and Figure 5, it can be seen that the change in the acoustical parameters with respect to the reference generally resulted in the reduction of both EDT and T20 and in the increase of both C50 and C80. Over 34 configurations, only five resulted in an increase of EDT, two resulted in an increase of T20, and six in a reduction of C50, at the center frequency of 500 Hz only. The maximum amount of change across these configurations was only of 0.03 s for EDT, 0.01 s for T20, and 0.5 dB for C50.
The amounts of change in the acoustical parameters with respect to the reference were more significant in the mid and high frequency ranges than in the low frequency range. More specifically, the reduction of EDT varied from 0 to 0.17 s in the low frequency range while it varied from 0.08 to 0.78 s and from 0.48 to 0.78 s in the mid and high frequency ranges, respectively. A similar trend was observed for T20 for which the reduction fluctuated between 0 to 0.21 s in the low frequency range, from 0.19 to 0.80 s in the mid frequency range and from 0.45 to 0.80 s in the high frequency range. As for C50, it increased from 0.1 to 4.1 dB in the low frequency range, while it increased from 2.0 to 9.8 dB and from 2.1 to 6.8 dB in the mid and high frequency ranges, respectively. Similarly to C50, C80 increased from 0.4 to 4.4 dB, from 3.3 to 12.4 dB, and from 3.4 to 9.9 dB in the low, mid and high frequency ranges, respectively.
Studying the effect of the diffusers placement on the acoustical parameters is not straightforward. To consider the effect of the placement only, an introductory analysis comparing the two configurations having the maximum and minimum values of change in the acoustical parameters for each octave band in each group was made. The latter showed that the maximum change due to the placement was 0.09 s for EDT (groups 1PF at 4 kHz, 2PF at 2 kHz, 2CF and 3CF at 500 Hz), 0.17 s for T20 (group 3CF at 2 kHz), 2.1 dB for C50 (groups 1PF at 250 Hz and 3CF at 2 kHz), 2.9 dB for C80 (group 3PF at 2 kHz). This introductory analysis also suggested that the configurations with one diffuser with the greatest distance between the source and the diffuser (those named with the letters e and c) have the lowest amounts of change in the acoustical parameters. Another brief analysis focusing on configurations with three diffusers was made to investigate if differences exist on the amount change of the acoustical parameters between configurations with a clustered diffuser installation design (those named with the letters a and m) and these having a distributed diffuser installation design (configurations named with the letters k, l, n, and o). However, the results from this brief analysis did not show any clear differences between the effect of the two defined diffuser installation designs (clustered vs. distributed) on the amount change of the acoustical parameters.
Because a maximum of three diffusers only were added in the room, the effect of placement on the change of the acoustical parameters was neglected when considering the effect of the coverage or type. Considering the coverage of the diffusers, the amounts of change averaged across both pyramid and convex diffuser types were increased as the number of diffuser varied from one to three for all the four acoustical parameters and for all the three frequency ranges. In particular, as the number of diffuser increased from one to three, EDT decreased by 0.04, 0.16, and 0.19 s in the low, mid, and high frequency range, respectively. T20 decreased even more significantly than EDT with reduction values of 0.05, 0.2, and 0.27 s in the low, mid, and high frequency range, respectively. C50 and C80 were increased as the number of diffuser varied from one to three by 0.9 and 0.8 dB in the low, 3.6 and 5.3 dB in the mid, and 3.1 and 4.9 dB in the high frequency range, respectively.
Considering the type of the diffusers, the amounts of change were slightly higher for the convex type compared to the pyramidal type in all the measured acoustical parameters and at most of the center frequencies. More specifically, for EDT and T20, the differences in the amount of reduction between the two diffuser types varied from 0 s in the 500 Hz octave band to 0.05 s in the 2 kHz octave band. The amount of increase between the two diffuser types for C50 and C80 ranged from 0 dB in the 500 Hz octave band to 1.1 dB in both 2 and 4 kHz octave bands.
4.2. Statistical Analysis
A series of 60 statistical hypothesis tests were performed to examine the significance of the effect of the coverage and type of the diffusers on the measured acoustical parameters. More precisely, this statistical analysis is done to determine if significant differences exist between groups 1P, 2P, and 3P (and between 1C, 2C, and 3C similarly) to investigate the effect of coverage, and between groups 1P vs. 1C, 2P vs. 2C, and 3P vs. 3C to investigate the effect of the diffuser type. In other words, for analyzing the effect of the coverage and excluding the effect of the type, the data points for the configurations with pyramid diffusers were grouped separately from the ones for the configurations including convex diffusers. As a result, two tests per frequency range were performed for each acoustical parameter, resulting in an aggregate of 24 statistical tests. Alternatively, in order to analyze the effect of the type of the diffusers, the data points were grouped such that the configurations with one, two, and three diffusers were separately studied to exclude the effect of coverage, thus resulting in three groups to analyze. For each of these groups, one test per frequency range was performed for each of the four acoustical parameters, resulting in a total of 36 statistical tests.
For each of the aforementioned 60 tests, the data points were examined for the conformity with the assumptions of the analysis of variance (ANOVA), namely the normality of the residuals and homogeneity of the variance, to be able to confirm if ANOVA is a suitable candidate for the purpose of the presented statistical analysis. The Shapiro–Wilk and Levene tests [23,24] were performed to verify if the former and the latter assumptions were met, respectively. The results demonstrated that among the 60 tests, 35 (58.33%) were not complying with the normality assumption. As for the homogeneity assumption, this percentage was 21.66%. Consequently, the Kruskal–Wallis test was selected as an appropriate substitute to the ANOVA test. The results of the Kruskal–Wallis tests are reported in Table 5 and Table 6 for the analysis of the coverage and the type of the diffusers, respectively.
The results for the analysis of the coverage of the diffusers showed that for EDT, significant differences were observed between the configurations of all the groups in all the frequency ranges except for the group containing pyramid diffusers in the low frequency range. A same analysis for T20, C50, and C80 confirmed the existence of significant differences between all the groups only in the mid and high frequency ranges. In other words, these results indicated that increasing the number of either pyramid or convex diffusers from one to two or three had significant effect on the values of all the four acoustical parameters of the study in the mid and high frequency ranges.
The results for the analysis of the type of the diffusers indicated that the values of EDT for the configurations with one, two, and three pyramid diffusers were significantly different from the values for the corresponding convex-contained configurations only in the high frequency range. The same analysis for the values of T20 showed a significant difference only for the configurations with three diffusers and only in the high frequency range. For C50 and C80, significant differences were observed only between the configurations with two and three pyramid diffusers and their corresponding convex-contained configurations and only in the high frequency range.
4.3. Discussion
Although the statistical analysis revealed that the change of the acoustical parameters with respect to the type of diffuser (pyramid or convex) is significant in the high frequency range for all acoustical parameters, the number of diffusers also seem to play a role since the significance is mainly achieved for groups containing more than one diffuser. Moreover, the differences observed in the change of the acoustical parameters due to the change of the diffuser type cannot be fully conclusive since their respective absorption area differs by 0.1 m for a single diffuser added to the room and by 0.3 m for three diffusers. However, both types seem to have the same effect on the change of the acoustical parameters (i.e., a reduction of EDT and T20, and an increase of C50 and C80).
Introducing even a single diffuser to any walls of such a non-diffuse room is enough to significantly change the reverberation time in the room as seen in the measurement results and confirmed by the statistical analysis. This is because when such a room is empty, the sound keeps bouncing between the walls for a considerable amount of time while the sound field is mainly in the lateral plane. However, when a diffuser is introduced on a wall, the sound energy is directed down to the floor and up to the ceiling which are highly absorptive surfaces. The role of diffusers in this particular room is therefore much greater than in a room in which all boundaries have the same material. Consistently, as the number of added diffuser increases, the faster the sound energy is directed towards absorptive boundaries (floor/ceiling), which is in fact observed in the measurement results.
The changes in the acoustical parameters observed in the measurement results are in line with the trends observed in previous studies investigating scale models when switching from a reflective to a diffuse condition [6,14]. However, these results also differ from other publications [9,10]. Finally, it could be generally concluded that the effects produced by scattering surfaces on the acoustic parameters depend on several factors such as the amount of diffusion already present in the space, the position of the scattering surfaces, the position and amount of the absorptive surfaces, as well as the presence of mirrored reflective surfaces. Furthermore, the size and shape of the space are important parameters influencing the sound field diffusivity [14,25].
5. Conclusions and Future Work
This paper presented an investigation on the effects created by the inclusion of relatively large-scale pyramidal and convex-shaped diffusers in an empty non-diffuse room of small size on four acoustical parameters (EDT, T20, C50, and C80) measured in the room. A total of 35 room configurations were measured such that the inclusion of the diffusers was controlled and analyzed in terms of their placement, number and shape.
The measurement results showed that adding the diffusers in the room generally decreases EDT and T20, and increases C50 and C80 for both diffuser types. The results also showed that the control of reverberation is possible in small non-diffuse rooms by directing the sound energy towards absorbing surfaces. The statistical analysis showed that adding the diffusing elements in the room significantly changed the sound field at most octave bands regardless of the diffuser shape. The statistical analysis also showed that the influence of the diffuser type on the change of the room acoustic parameters was significant at high frequencies for groups with different number of diffusing elements. This conclusion is supported by all the presented measurement results and analysis as the convex-shaped diffusers caused larger impact on the sound at high frequencies. It is worth mentioning that from the presented results, which are restricted to the measured space and conditions, only tendencies are clear and quantitative rules for room acoustical parameters in non-diffuse sound fields cannot be extrapolated to other cases.
The contributions made by this paper can be divided into two items. Firstly, a large body of measurement data is presented in the Appendix A that can be used by researchers for further (statistical, e.g., regression) analysis in the area of sound diffusers and room acoustics. Secondly, although the study of the effects of diffusers’ installation on the room acoustical parameters has already been done in several studies, this paper takes this approach into a more in-depth level by increasing the number of tests and configurations and choosing a room that had no prior assigned use that allowed for an abstract and systematic approach in this area of study.
There have been some areas of future challenges that are of interest to the authors of this paper. Using bigger rooms with various volumetric shapes, playing with the diffusivity of the room by changing the amount of absorption area, and incorporating the type of use of the rooms into the study as one more variable, are among those future studies. With the growing interest in the area of wave-based time domain modeling, e.g. finite-difference time-domain (FDTD) in room acoustics in recent years as reflected in [26,27], an additional area of future research using the FDTD method as a complementary technique to in-situ measurement can be considered for similar investigations to the present paper, thus offering more flexibility in testing numerous configurations. This area of future research was previously investigated by the present paper’s authors in similar studies [28,29].
Author Contributions
Conceptualization, H.A.;Formal analysis, H.A. and J.M.; Investigation, H.A. and J.M.; Measurement, H.A.; Writing—Original draft preparation, H.A. and J.M.; Writing—Review and editing, T.L.; Supervision, G.S.
Funding
The first author Hassan Azad has received funding from the University of Florida Jeremy J Hill Memorial Fund over the course of the experiments carried out in this research. The co-author Julie Meyer is part of a project that has received funding from the European Union’s Horizon 2020 research and innovation programme under the Marie Skłodowska-Curie grant agreement No. 721536.
Acknowledgments
The authors are grateful to Siebein Associates Inc. for providing the equipment and the physical space for conducting the measurements. The manufacturer AVL Systems, Inc. is also thanked for providing the diffusers used in this work.
Conflicts of Interest
The authors declare no conflict of interest.
Abbreviations
The following abbreviations are used in this manuscript:
| RIR | Room impulse response |
| EDT | Early decay time |
| RT, T20 | Reverberation time |
| C50 | Early-to-late arriving sound ratio |
| C80 | Clarity |
| SD | Standard deviation |
| ANOVA | Analysis Of variance |
Appendix A. Acoustical Parameters

Table A1.
3D view, mean and SD over the five source-receiver combinations of the EDT, T20, C50, and C80 for group 1P.
Table A1.
3D view, mean and SD over the five source-receiver combinations of the EDT, T20, C50, and C80 for group 1P.

| Freq. | Cnfg | EDT (s) | T20 (s) | C50 (dB) | C80 (dB) |
|---|---|---|---|---|---|
| 250 Hz | 1Pa | 0.42 (0.07) | 0.43 (0.05) | 6.2 (1.5) | 11.4 (2.2) |
| 1Pb | 0.41 (0.02) | 0.46 (0.03) | 6.5 (1.7) | 11.2 (1.2) | |
| 1Pc | 0.41 (0.08) | 0.44 (0.05) | 6.3 (2.4) | 11.4 (1.4) | |
| 1Pd | 0.45 (0.03) | 0.49 (0.04) | 4.9 (1.3) | 10.4 (1.1) | |
| 1Pe | 0.38 (0.08) | 0.52 (0.04) | 9.6 (2.1) | 14.0 (1.3) | |
| 500 Hz | 1Pa | 0.34 (0.10) | 0.30 (0.04) | 9.8 (2.9) | 16.8 (1.7) |
| 1Pb | 0.31 (0.06) | 0.29 (0.01) | 9.7 (1.0) | 17.2 (1.0) | |
| 1Pc | 0.35 (0.05) | 0.28 (0.02) | 9.7 (0.9) | 17.5 (1.2) | |
| 1Pd | 0.33 (0.03) | 0.27 (0.02) | 9.8 (0.7) | 17.3 (2.0) | |
| 1Pe | 0.27 (0.04) | 0.29 (0.02) | 13.2 (0.6) | 18.8 (1.2) | |
| 1000 Hz | 1Pa | 0.24 (0.01) | 0.39 (0.02) | 11.0 (0.9) | 16.0 (0.5) |
| 1Pb | 0.27 (0.04) | 0.40 (0.04) | 10.7 (0.8) | 16.0 (1.2) | |
| 1Pc | 0.23 (0.05) | 0.38 (0.02) | 11.8 (0.7) | 16.7 (1.2) | |
| 1Pd | 0.22 (0.04) | 0.37 (0.01) | 12.0 (0.7) | 16.6 (0.6) | |
| 1Pe | 0.24 (0.05) | 0.36 (0.02) | 11.8 (1.3) | 15.9 (1.1) | |
| 2000 Hz | 1Pa | 0.55 (0.07) | 0.69 (0.02) | 5.8 (1.4) | 9.1 (1.3) |
| 1Pb | 0.51 (0.06) | 0.71 (0.03) | 6.8 (0.7) | 10.4 (0.9) | |
| 1Pc | 0.57 (0.06) | 0.73 (0.03) | 6.1 (1.0) | 9.2 (1.1) | |
| 1Pd | 0.55 (0.06) | 0.67 (0.04) | 6.3 (1.6) | 9.5 (1.2) | |
| 1Pe | 0.50 (0.04) | 0.67 (0.03) | 6.4 (1.2) | 9.5 (0.8) | |
| 4000 Hz | 1Pa | 0.53 (0.05) | 0.73 (0.02) | 7.1 (1.0) | 9.9 (0.8) |
| 1Pb | 0.49 (0.06) | 0.74 (0.01) | 7.4 (1.1) | 10.2 (1.0) | |
| 1Pc | 0.44 (0.05) | 0.70 (0.02) | 8.3 (0.6) | 11.0 (0.9) | |
| 1Pd | 0.49 (0.07) | 0.70 (0.02) | 7.7 (0.9) | 10.3 (1.1) | |
| 1Pe | 0.46 (0.06) | 0.68 (0.04) | 5.8 (0.9) | 8.0 (1.0) |
Table A2.
3D view, mean and SD over the five source-receiver combinations of the EDT, T20, C50, and C80 for group 2P.
Table A2.
3D view, mean and SD over the five source-receiver combinations of the EDT, T20, C50, and C80 for group 2P.

| Freq. | Cnfg | EDT (s) | T20 (s) | C50 (dB) | C80 (dB) |
|---|---|---|---|---|---|
| 250 Hz | 2Pa | 0.38 (0.07) | 0.41 (0.03) | 7.6 (2.5) | 12.3 (1.7) |
| 2Pf | 0.37 (0.06) | 0.41 (0.04) | 7.8 (2.6) | 12.2 (1.5) | |
| 2Pg | 0.41 (0.04) | 0.42 (0.06) | 6.6 (1.5) | 12.0 (1.3) | |
| 2Ph | 0.40 (0.02) | 0.40 (0.05) | 6.1 (1.5) | 11.6 (1.2) | |
| 2Pi | 0.46 (0.04) | 0.38 (0.04) | 5.7 (1.0) | 10.8 (1.7) | |
| 2Pj | 0.41 (0.05) | 0.45 (0.07) | 6.7 (1.5) | 11.5 (1.6) | |
| 500 Hz | 2Pa | 0.29 (0.09) | 0.28 (0.02) | 10.7 (2.9) | 18.0 (1.1) |
| 2Pf | 0.30 (0.04) | 0.28 (0.02) | 10.1 (0.7) | 17.6 (2.6) | |
| 2Pg | 0.27 (0.05) | 0.28 (0.03) | 11.3 (0.5) | 18.5 (1.6) | |
| 2Ph | 0.32 (0.03) | 0.27 (0.03) | 10.1 (0.9) | 18.1 (2.8) | |
| 2Pi | 0.32 (0.08) | 0.28 (0.03) | 10.4 (2.2) | 18.0 (0.9) | |
| 2Pj | 0.26 (0.01) | 0.32 (0.02) | 10.7 (0.6) | 17.6 (1.1) | |
| 1000 Hz | 2Pa | 0.22 (0.04) | 0.29 (0.03) | 13.1 (1.5) | 19.3 (1.7) |
| 2Pf | 0.22 (0.02) | 0.29 (0.02) | 13.5 (0.7) | 19.5 (1.5) | |
| 2Pg | 0.21 (0.03) | 0.32 (0.01) | 12.3 (1.1) | 18.1 (1.6) | |
| 2Ph | 0.21 (0.02) | 0.28 (0.02) | 13.2 (0.6) | 19.4 (0.7) | |
| 2Pi | 0.20 (0.02) | 0.30 (0.02) | 12.6 (0.8) | 18.8 (0.5) | |
| 2Pj | 0.22 (0.02) | 0.30 (0.02) | 12.3 (1.0) | 19.1 (0.6) | |
| 2000 Hz | 2Pa | 0.34 (0.04) | 0.51 (0.03) | 8.6 (1.2) | 12.6 (1.0) |
| 2Pf | 0.30 (0.04) | 0.51 (0.05) | 9.8 (0.9) | 13.9 (1.1) | |
| 2Pg | 0.39 (0.06) | 0.51 (0.02) | 8.0 (1.1) | 12.6 (0.9) | |
| 2Ph | 0.35 (0.03) | 0.44 (0.02) | 9.0 (0.5) | 13.3 (0.6) | |
| 2Pi | 0.34 (0.05) | 0.45 (0.02) | 8.9 (1.3) | 13.5 (0.8) | |
| 2Pj | 0.39 (0.08) | 0.54 (0.02) | 8.4 (1.5) | 12.4 (1.4) | |
| 4000 Hz | 2Pa | 0.36 (0.02) | 0.54 (0.02) | 8.7 (0.9) | 12.5 (1.0) |
| 2Pf | 0.32 (0.01) | 0.52 (0.02) | 9.6 (0.8) | 13.4 (0.8) | |
| 2Pg | 0.38 (0.01) | 0.58 (0.02) | 8.9 (0.6) | 12.3 (0.7) | |
| 2Ph | 0.35 (0.02) | 0.51 (0.01) | 9.3 (0.6) | 12.8 (0.4) | |
| 2Pi | 0.35 (0.03) | 0.52 (0.02) | 9.1 (1.0) | 12.7 (0.9) | |
| 2Pj | 0.37 (0.07) | 0.55 (0.02) | 8.9 (1.5) | 12.0 (1.1) |
Table A3.
3D view, mean and SD over the five source-receiver combinations of the EDT, T20, C50, and C80 for group 3P.
Table A3.
3D view, mean and SD over the five source-receiver combinations of the EDT, T20, C50, and C80 for group 3P.

| Freq. | Cnfg | EDT (s) | T20 (s) | C50 (dB) | C80 (dB) |
|---|---|---|---|---|---|
| 250 Hz | 3Pa | 0.39 (0.05) | 0.39 (0.04) | 7.2 (1.7) | 11.6 (1.2) |
| 3Pk | 0.42 (0.03) | 0.36 (0.06) | 6.6 (1.5) | 11.7 (1.5) | |
| 3Pl | 0.37 (0.05) | 0.37 (0.06) | 7.8 (2.0) | 12.7 (1.8) | |
| 3Pm | 0.38 (0.06) | 0.36 (0.04) | 7.3 (1.7) | 12.5 (1.5) | |
| 3Pn | 0.39 (0.03) | 0.41 (0.03) | 7.5 (1.6) | 11.7 (1.5) | |
| 3Po | 0.41 (0.04) | 0.37 (0.03) | 6.8 (1.4) | 11.5 (1.9) | |
| 500 Hz | 3Pa | 0.33 (0.02) | 0.27 (0.02) | 9.5 (1.0) | 16.8 (1.4) |
| 3Pk | 0.28 (0.09) | 0.27 (0.03) | 10.5 (1.9) | 18.7 (1.0) | |
| 3Pl | 0.27 (0.05) | 0.30 (0.04) | 11.3 (1.7) | 17.6 (2.1) | |
| 3Pm | 0.26 (0.05) | 0.26 (0.04) | 10.9 (1.7) | 19.3 (2.1) | |
| 3Pn | 0.26 (0.06) | 0.29 (0.04) | 10.7 (1.3) | 18.0 (1.5) | |
| 3Po | 0.24 (0.03) | 0.32 (0.01) | 11.0 (1.4) | 16.6 (1.8) | |
| 1000 Hz | 3Pa | 0.19 (0.02) | 0.27 (0.02) | 14.1 (1.4) | 20.8 (0.6) |
| 3Pk | 0.19 (0.03) | 0.25 (0.02) | 13.9 (0.7) | 21.4 (1.1) | |
| 3Pl | 0.19 (0.02) | 0.27 (0.03) | 14.4 (0.8) | 21.0 (1.6) | |
| 3Pm | 0.20 (0.04) | 0.28 (0.02) | 13.7 (0.6) | 19.9 (0.6) | |
| 3Pn | 0.20 (0.04) | 0.27 (0.02) | 14.5 (0.8) | 20.2 (1.0) | |
| 3Po | 0.18 (0.04) | 0.26 (0.03) | 14.3 (0.7) | 21.1 (1.2) | |
| 2000 Hz | 3Pa | 0.27 (0.02) | 0.45 (0.05) | 10.8 (1.3) | 15.5 (1.6) |
| 3Pk | 0.23 (0.03) | 0.37 (0.03) | 11.5 (1.1) | 17.1 (1.5) | |
| 3Pl | 0.27 (0.03) | 0.38 (0.04) | 10.8 (1.1) | 16.2 (1.4) | |
| 3Pm | 0.27 (0.03) | 0.43 (0.04) | 10.8 (1.0) | 15.5 (1.2) | |
| 3Pn | 0.30 (0.04) | 0.45 (0.06) | 10.0 (1.2) | 14.2 (1.1) | |
| 3Po | 0.25 (0.04) | 0.38 (0.06) | 11.5 (1.3) | 16.8 (1.6) | |
| 4000 Hz | 3Pa | 0.29 (0.03) | 0.44 (0.02) | 10.6 (1.1) | 15.2 (1.0) |
| 3Pk | 0.28 (0.02) | 0.42 (0.02) | 11.0 (0.7) | 15.7 (0.7) | |
| 3Pl | 0.28 (0.02) | 0.43 (0.01) | 10.8 (0.9) | 15.2 (0.7) | |
| 3Pm | 0.31 (0.03) | 0.46 (0.02) | 10.1 (0.9) | 14.6 (0.7) | |
| 3Pn | 0.29 (0.04) | 0.46 (0) | 10.6 (0.8) | 14.7 (0.6) | |
| 3Po | 0.28 (0.04) | 0.42 (0.02) | 10.9 (1.5) | 15.7 (1.2) |
Table A4.
3D view, mean and SD over the five source-receiver combinations of the EDT, T20, C50, and C80 for group 1C.
Table A4.
3D view, mean and SD over the five source-receiver combinations of the EDT, T20, C50, and C80 for group 1C.

| Freq. | Cnfg | EDT (s) | T20 (s) | C50 (dB) | C80 (dB) |
|---|---|---|---|---|---|
| 250 Hz | 1Ca | 0.44 (0.07) | 0.42 (0.06) | 5.8 (1.3) | 11.4 (2.1) |
| 1Cb | 0.40 (0.03) | 0.45 (0.04) | 6.3 (1.5) | 11.5 (1.3) | |
| 1Cc | 0.40 (0.08) | 0.43 (0.04) | 6.3 (2.2) | 11.4 (1.1) | |
| 1Cd | 0.45 (0.04) | 0.48 (0.02) | 5.5 (1.5) | 10.3 (1.2) | |
| 1Ce | 0.39 (0.07) | 0.51 (0.03) | 6.6 (2.0) | 11.9 (1.3) | |
| 500 Hz | 1Ca | 0.34 (0.08) | 0.28 (0.03) | 9.5 (3.1) | 17.0 (2.4) |
| 1Cb | 0.34 (0.05) | 0.27 (0.02) | 9.4 (1.3) | 17.4 (1.3) | |
| 1Cc | 0.36 (0.04) | 0.28 (0.01) | 9.3 (0.5) | 16.8 (0.6) | |
| 1Cd | 0.29 (0.03) | 0.28 (0.03) | 10.5 (0.4) | 17.7 (2.4) | |
| 1Ce | 0.28 (0.03) | 0.30 (0.03) | 11.1 (0.3) | 17.5 (1.9) | |
| 1000 Hz | 1Ca | 0.24 (0.02) | 0.40 (0.01) | 11.7 (1.0) | 16.4 (0.6) |
| 1Cb | 0.27 (0.04) | 0.40 (0.03) | 10.7 (1.0) | 16.0 (1.2) | |
| 1Cc | 0.24 (0.02) | 0.40 (0.04) | 11.7 (0.3) | 16.7 (1.2) | |
| 1Cd | 0.25 (0.03) | 0.39 (0.04) | 11.8 (1.1) | 16.1 (1.2) | |
| 1Ce | 0.23 (0.05) | 0.36 (0.01) | 12.0 (0.5) | 16.8 (0.5) | |
| 2000 Hz | 1Ca | 0.52 (0.08) | 0.72 (0.03) | 7.1 (0.6) | 10.3 (0.8) |
| 1Cb | 0.56 (0.07) | 0.72 (0.05) | 6.3 (1.3) | 9.6 (1.1) | |
| 1Cc | 0.55 (0.06) | 0.74 (0.02) | 6.3 (1.0) | 9.7 (1.0) | |
| 1Cd | 0.51 (0.05) | 0.69 (0.02) | 6.8 (1.0) | 10.2 (1.0) | |
| 1Ce | 0.51 (0.11) | 0.66 (0.03) | 7.2 (1.5) | 10.1 (1.5) | |
| 4000 Hz | 1Ca | 0.45 (0.06) | 0.71 (0.02) | 7.9 (1.2) | 10.7 (1.0) |
| 1Cb | 0.44 (0.04) | 0.73 (0.02) | 8.0 (0.9) | 10.5 (0.5) | |
| 1Cc | 0.40 (0.04) | 0.71 (0.02) | 8.6 (0.7) | 11.5 (0.8) | |
| 1Cd | 0.45 (0.09) | 0.70 (0.01) | 8.2 (1.2) | 10.5 (0.9) | |
| 1Ce | 0.43 (0.06) | 0.65 (0.02) | 8.4 (0.9) | 11.0 (1.0) |
Table A5.
3D view, mean and SD over the five source-receiver combinations of the EDT, T20, C50, and C80 for group 2C.
Table A5.
3D view, mean and SD over the five source-receiver combinations of the EDT, T20, C50, and C80 for group 2C.

| Freq. | Cnfg | EDT (s) | T20 (s) | C50 (dB) | C80 (dB) |
|---|---|---|---|---|---|
| 250 Hz | 2Ca | 0.38 (0.09) | 0.41 (0.03) | 7.6 (2.2) | 12.3 (1.8) |
| 2Cf | 0.35 (0.04) | 0.39 (0.05) | 7.7 (2.0) | 12.5 (1.6) | |
| 2Cg | 0.35 (0.03) | 0.40 (0.04) | 7.7 (1.3) | 13.3 (1.5) | |
| 2Ch | 0.40 (0.04) | 0.40 (0.04) | 7.0 (1.5) | 12.0 (1.4) | |
| 2Ci | 0.44 (0.05) | 0.38 (0.05) | 6.1 (1.4) | 11.5 (2.0) | |
| 2Cj | 0.39 (0.05) | 0.47 (0.05) | 7.2 (1.8) | 12.1 (1.7) | |
| 500 Hz | 2Ca | 0.30 (0.08) | 0.25 (0.01) | 10.1 (2.8) | 18.1 (2.0) |
| 2Cf | 0.33 (0.04) | 0.28 (0.03) | 9.2 (0.6) | 16.6 (2.1) | |
| 2Cg | 0.29 (0.04) | 0.30 (0.02) | 11.2 (1.0) | 18.2 (0.9) | |
| 2Ch | 0.30 (0.04) | 0.28 (0.05) | 10.4 (0.6) | 17.9 (1.6) | |
| 2Ci | 0.31 (0.08) | 0.29 (0.02) | 10.6 (2.2) | 18.0 (1.0) | |
| 2Cj | 0.24 (0.05) | 0.31 (0.03) | 11.0 (0.8) | 18.4 (1.7) | |
| 1000 Hz | 2Ca | 0.22 (0.05) | 0.31 (0.02) | 12.1 (0.8) | 18.4 (0.7) |
| 2Cf | 0.24 (0.02) | 0.31 (0.02) | 12.2 (1.0) | 18.3 (1.1) | |
| 2Cg | 0.23 (0.02) | 0.32 (0.02) | 12.6 (0.7) | 17.8 (0.8) | |
| 2Ch | 0.22 (0.03) | 0.29 (0.03) | 13.0 (1.1) | 19.2 (1.2) | |
| 2Ci | 0.21 (0.03) | 0.29 (0.01) | 13.6 (0.9) | 19.5 (0.7) | |
| 2Cj | 0.22 (0.05) | 0.31 (0.02) | 12.6 (1.8) | 18.5 (1.0) | |
| 2000 Hz | 2Ca | 0.33 (0.07) | 0.57 (0.03) | 9.2 (1.4) | 13.1 (1.7) |
| 2Cf | 0.31 (0.03) | 0.54 (0.02) | 9.8 (0.8) | 13.7 (0.9) | |
| 2Cg | 0.33 (0.04) | 0.50 (0.02) | 9.4 (0.6) | 13.5 (1.1) | |
| 2Ch | 0.32 (0.06) | 0.48 (0.06) | 9.5 (1.3) | 13.8 (1.5) | |
| 2Ci | 0.33 (0.05) | 0.46 (0.03) | 10.2 (1.5) | 14.9 (1.0) | |
| 2Cj | 0.37 (0.07) | 0.55 (0.05) | 8.7 (1.3) | 12.3 (1.5) | |
| 4000 Hz | 2Ca | 0.32 (0.06) | 0.54 (0.02) | 9.9 (1.3) | 13.7 (1.1) |
| 2Cf | 0.27 (0.03) | 0.53 (0.02) | 10.6 (1.2) | 14.6 (0.9) | |
| 2Cg | 0.31 (0.01) | 0.54 (0.01) | 10.1 (0.4) | 13.5 (0.5) | |
| 2Ch | 0.33 (0.05) | 0.51 (0.03) | 9.4 (1.1) | 13.3 (1.0) | |
| 2Ci | 0.33 (0.05) | 0.50 (0.01) | 10.1 (1.1) | 14.0 (1.1) | |
| 2Cj | 0.33 (0.07) | 0.54 (0.03) | 9.6 (1.3) | 12.8 (1.1) |
Table A6.
3D view, mean and SD over the five source-receiver combinations of the EDT, T20, C50, and C80 for group 3C.
Table A6.
3D view, mean and SD over the five source-receiver combinations of the EDT, T20, C50, and C80 for group 3C.

| Freq. | Cnfg | EDT (s) | T20 (s) | C50 (dB) | C80 (dB) |
|---|---|---|---|---|---|
| 250 Hz | 3Ca | 0.36 (0.03) | 0.37 (0.03) | 7.5 (1.4) | 12.1 (1.1) |
| 3Ck | 0.39 (0.02) | 0.37 (0.03) | 7.1 (1.1) | 12.0 (1.6) | |
| 3Cl | 0.33 (0.03) | 0.34 (0.04) | 8.9 (2.0) | 14.2 (2.3) | |
| 3Cm | 0.36 (0.05) | 0.35 (0.04) | 7.4 (1.9) | 13.3 (2.0) | |
| 3Cn | 0.36 (0.03) | 0.41 (0.03) | 7.9 (1.0) | 12.5 (1.9) | |
| 3Co | 0.38 (0.02) | 0.38 (0.04) | 6.9 (1.3) | 12.4 (2.1) | |
| 500 Hz | 3Ca | 0.33 (0.05) | 0.28 (0.02) | 9.1 (1.4) | 16.7 (1.3) |
| 3Ck | 0.31 (0.06) | 0.27 (0.03) | 10.4 (1.7) | 18.9 (1.6) | |
| 3Cl | 0.28 (0.04) | 0.29 (0.04) | 10.9 (0.9) | 17.5 (1.6) | |
| 3Cm | 0.28 (0.06) | 0.26 (0.03) | 10.8 (1.7) | 18.4 (1.6) | |
| 3Cn | 0.27 (0.04) | 0.27 (0.03) | 11.0 (0.7) | 19.2 (2.2) | |
| 3Co | 0.24 (0.04) | 0.31 (0.03) | 11.1 (1.1) | 17.4 (1.3) | |
| 1000 Hz | 3Ca | 0.21 (0.02) | 0.28 (0.02) | 13.6 (0.7) | 20.3 (0.6) |
| 3Ck | 0.19 (0.03) | 0.26 (0.01) | 14.0 (0.6) | 20.7 (0.9) | |
| 3Cl | 0.20 (0.02) | 0.26 (0.02) | 14.5 (1.4) | 21.1 (1.6) | |
| 3Cm | 0.20 (0.02) | 0.26 (0.01) | 13.4 (0.8) | 20.4 (1.0) | |
| 3Cn | 0.21 (0.01) | 0.27 (0.02) | 14.6 (0.6) | 20.8 (0.8) | |
| 3Co | 0.18 (0.04) | 0.26 (0.04) | 14.0 (1.2) | 21.2 (0.9) | |
| 2000 Hz | 3Ca | 0.25 (0.02) | 0.55 (0.06) | 11.5 (1.0) | 15.7 (1.5) |
| 3Ck | 0.22 (0.03) | 0.38 (0.04) | 12.5 (0.8) | 17.4 (1.0) | |
| 3Cl | 0.25 (0.03) | 0.39 (0.04) | 11.6 (1.2) | 16.7 (1.5) | |
| 3Cm | 0.28 (0.04) | 0.42 (0.05) | 10.8 (1.4) | 15.9 (1.6) | |
| 3Cn | 0.30 (0.03) | 0.45 (0.03) | 10.4 (1.4) | 14.7 (1.2) | |
| 3Co | 0.25 (0.04) | 0.39 (0.06) | 11.5 (1.3) | 16.8 (1.5) | |
| 4000 Hz | 3Ca | 0.27 (0.02) | 0.48 (0.03) | 11.3 (1.1) | 15.6 (1.2) |
| 3Ck | 0.23 (0.01) | 0.40 (0.01) | 11.7 (0.7) | 16.3 (0.8) | |
| 3Cl | 0.24 (0.03) | 0.39 (0.02) | 11.8 (0.8) | 16.4 (0.6) | |
| 3Cm | 0.26 (0.03) | 0.43 (0.01) | 11.1 (0.9) | 15.8 (0.9) | |
| 3Cn | 0.29 (0.02) | 0.44 (0.02) | 11.0 (0.7) | 14.9 (0.4) | |
| 3Co | 0.25 (0.03) | 0.40 (0.02) | 11.5 (1.1) | 16.4 (0.9) |
References
- D’Antonio, P.; Cox, T. Two Decades of Sound Diffusor Design and Development, Part 1: Applications and Design. J. Audio Eng. Soc. 1998, 46, 955–976. [Google Scholar]
- D’Antonio, P.; Konnert, J.H. The RFZ/RPG approach to control room monitoring. In Audio Engineering Society Convention 76; Audio Engineering Society: New York, NY, USA, 1984. [Google Scholar]
- Cox, T.; d’Antonio, P. Acoustic Absorbers and Diffusers: Theory, Design and Application; Crc Press: Boca Raton, FL, USA, 2016. [Google Scholar]
- D’Antonio, P.; Cox, T. AES information document for room acoustics and sound reinforcement systems-characterization and measurement of surface scattering uniformity. J. Audio Eng. Soc. 2001, 49, 149–165. [Google Scholar]
- ISO. 17497-2:2012 Acoustics—Sound-Scattering Properties of Surfaces—Part 2: Measurement of the Directional Diffusion Coefficient in a Free Field; International Organization for Standardization: Geneva, Switzerland, 2012. [Google Scholar]
- Jeon, J.Y.; Jang, H.S.; Kim, Y.H.; Vorländer, M. Influence of wall scattering on the early fine structures of measured room impulse responses. J. Acoust. Soc. Am. 2015, 137, 1108–1116. [Google Scholar] [CrossRef] [PubMed]
- Jeon, J.Y.; Kim, Y.H. Diffuser Design for the New Ifez Arts Center Concert Hall Using Scale Models. In Proceedings of the 7th International Conference on Auditorium Acoustics, Oslo, Norway, 3–5 October 2008; Institute of Acoustics: Milton Keynes, UK, 2008; Volume 30, pp. 357–363. [Google Scholar]
- Choi, Y.J. Effects of periodic type diffusers on classroom acoustics. Appl. Acoust. 2013, 74, 694–707. [Google Scholar] [CrossRef]
- Shtrepi, L.; Astolfi, A.; D’Antonio, G.; Guski, M. Objective and perceptual evaluation of distance-dependent scattered sound effects in a small variable-acoustics hall. J. Acoust. Soc. Am. 2016, 140, 3651–3662. [Google Scholar] [CrossRef] [PubMed]
- Shtrepi, L.; Astolfi, A.; Pelzer, S.; Vitale, R.; Rychtáriková, M. Objective and perceptual assessment of the scattered sound field in a simulated concert hall. J. Acoust. Soc. Am. 2015, 138, 1485–1497. [Google Scholar] [CrossRef] [PubMed]
- Suzumura, Y.; Sakurai, M.; Ando, Y.; Yamamoto, I.; Iizuka, T.; Oowaki, M. An evaluation of the effects of scattered reflections in a sound field. J. Sound Vib. 2000, 232, 303–308. [Google Scholar] [CrossRef]
- Chiles, S. Sound Behaviour in Proportionate Spaces and Auditoria. Ph.D. Thesis, University of Bath, Bath, UK, 2004. [Google Scholar]
- Ryu, J.K.; Jeon, J.Y. Subjective and objective evaluations of a scattered sound field in a scale model opera house. J. Acoust. Soc. Am. 2008, 124, 1538–1549. [Google Scholar] [CrossRef] [PubMed]
- Kim, Y.H.; Kim, J.H.; Jeon, J.Y. Scale model investigations of diffuser application strategies for acoustical design of performance venues. Acta Acust. United Acust. 2011, 97, 791–799. [Google Scholar] [CrossRef]
- Kim, Y.H.; Kim, J.H.; Rougier, C.; Scmich, I.; Jeon, J.Y. In-situ measurements of diffuse reflections from lateral walls in concert halls. In Proceedings of the 8th International Conference on Auditorium Acoustics, Dublin, Ireland, 20–22 May 2011; Institute of Acoustics: Milton Keynes, UK, 2011. [Google Scholar]
- Jeon, J.Y.; Lee, S.C.; Vorländer, M. Development of scattering surfaces for concert halls. Appl. Acoust. 2004, 65, 341–355. [Google Scholar] [CrossRef]
- ISO EN. 3382-2, 2008, “Acoustics—Measurement of Room Acoustic Parameters—Part 2: Reverberation Time in Ordinary Rooms”; International Organization for Standardization: Brussels, Belgium, 2008. [Google Scholar]
- Farina, A. Simultaneous measurement of impulse response and distortion with a swept-sine technique. In Audio Engineering Society Convention 108; Audio Engineering Society: New York, NY, USA, 2000. [Google Scholar]
- Wenger Corporation. Traditional Acoustic Panel Series: Diffuser Panels. Available online: https://www.wengercorp.com/Lit/Wenger%20Traditional%20Acoustic%20Panels-Diffusers-TS.pdf (accessed on 19 March 2019).
- Kinetics Noise Control. Kinetics Geometric Diffusers. Available online: https://kineticsnoise.com/interiors/pdf/geometricDiffusers.pdf (accessed on 19 March 2019).
- AcousticsFirst Corporation. TechSpecs. p. 25. Available online: http://www.acousticsfirst.com/docs/AF-TECSPECS.pdf (accessed on 19 March 2019).
- Acoustical Solutions. Technical Data Sheet—Pyramid Sound Diffuser. p. 25. Available online: https://acousticalsolutions.com/wp-content/uploads/2015/01/as-pyramid-sound-diffuser-data-sheet.pdf (accessed on 19 March 2019).
- Shapiro, S.S.; Wilk, M.B. An analysis of variance test for normality (complete samples). Biometrika 1965, 52, 591–611. [Google Scholar] [CrossRef]
- Levene, H. Contributions to probability and statistics. In Essays in Honor of Harold Hotelling; Stanford University Press: Redwood City, CA, USA, 1960; pp. 278–292. [Google Scholar]
- Shtrepi, L.; Astolfi, A.; Rychtáriková, M. Influence of a volume scale factor on the scattering coefficient effects on the prediction of room acoustic parameters. In Proceedings of the International Symposium on Room Acoustics, Toronto, ON, Canada, 9–11 June 2013. [Google Scholar]
- Hamilton, B.; Bilbao, S. FDTD Methods for 3-D Room Acoustics Simulation with High-order Accuracy in Space and Time. Ieee/Acm Trans. Audio Speech Lang. Process. 2017, 25, 2112–2124. [Google Scholar] [CrossRef]
- Saarelma, J. Finite-Difference TIME-domain Solver for Room Acoustics Using Graphics Processing Units. Master’s Thesis, Aalto University, Helsinki, Finland, 2013. [Google Scholar]
- Meyer, J.; Lokki, T. Optimization of a diffuser geometry using parametric modeling tools and finite-difference time-domain simulations. Audit. Acoust. 2018, 638–645. [Google Scholar]
- Azad, H.; Ketabi, R.; Siebein, G. A Study of Diffusivity in Concert Halls Using Large Scale Acoustic Wave-Based Modeling and Simulation. In Proceedings of the INTER-NOISE and NOISE-CON Congress and Conference, Chicago, IL, USA, 26–29 August 2018; Institute of Noise Control Engineering: Reston, VA, USA, 2018; Volume 258, pp. 5431–5442. [Google Scholar]
Figure 1.
The 3D model of the empty room indicating the room dimensions and the impulse response measurement setup.
Figure 1.
The 3D model of the empty room indicating the room dimensions and the impulse response measurement setup.

Figure 2.
Dimensions and front (top) and top (bottom) views of the 3D models of the pyramid (left) and convex (right) diffusers.
Figure 2.
Dimensions and front (top) and top (bottom) views of the 3D models of the pyramid (left) and convex (right) diffusers.

Figure 3.
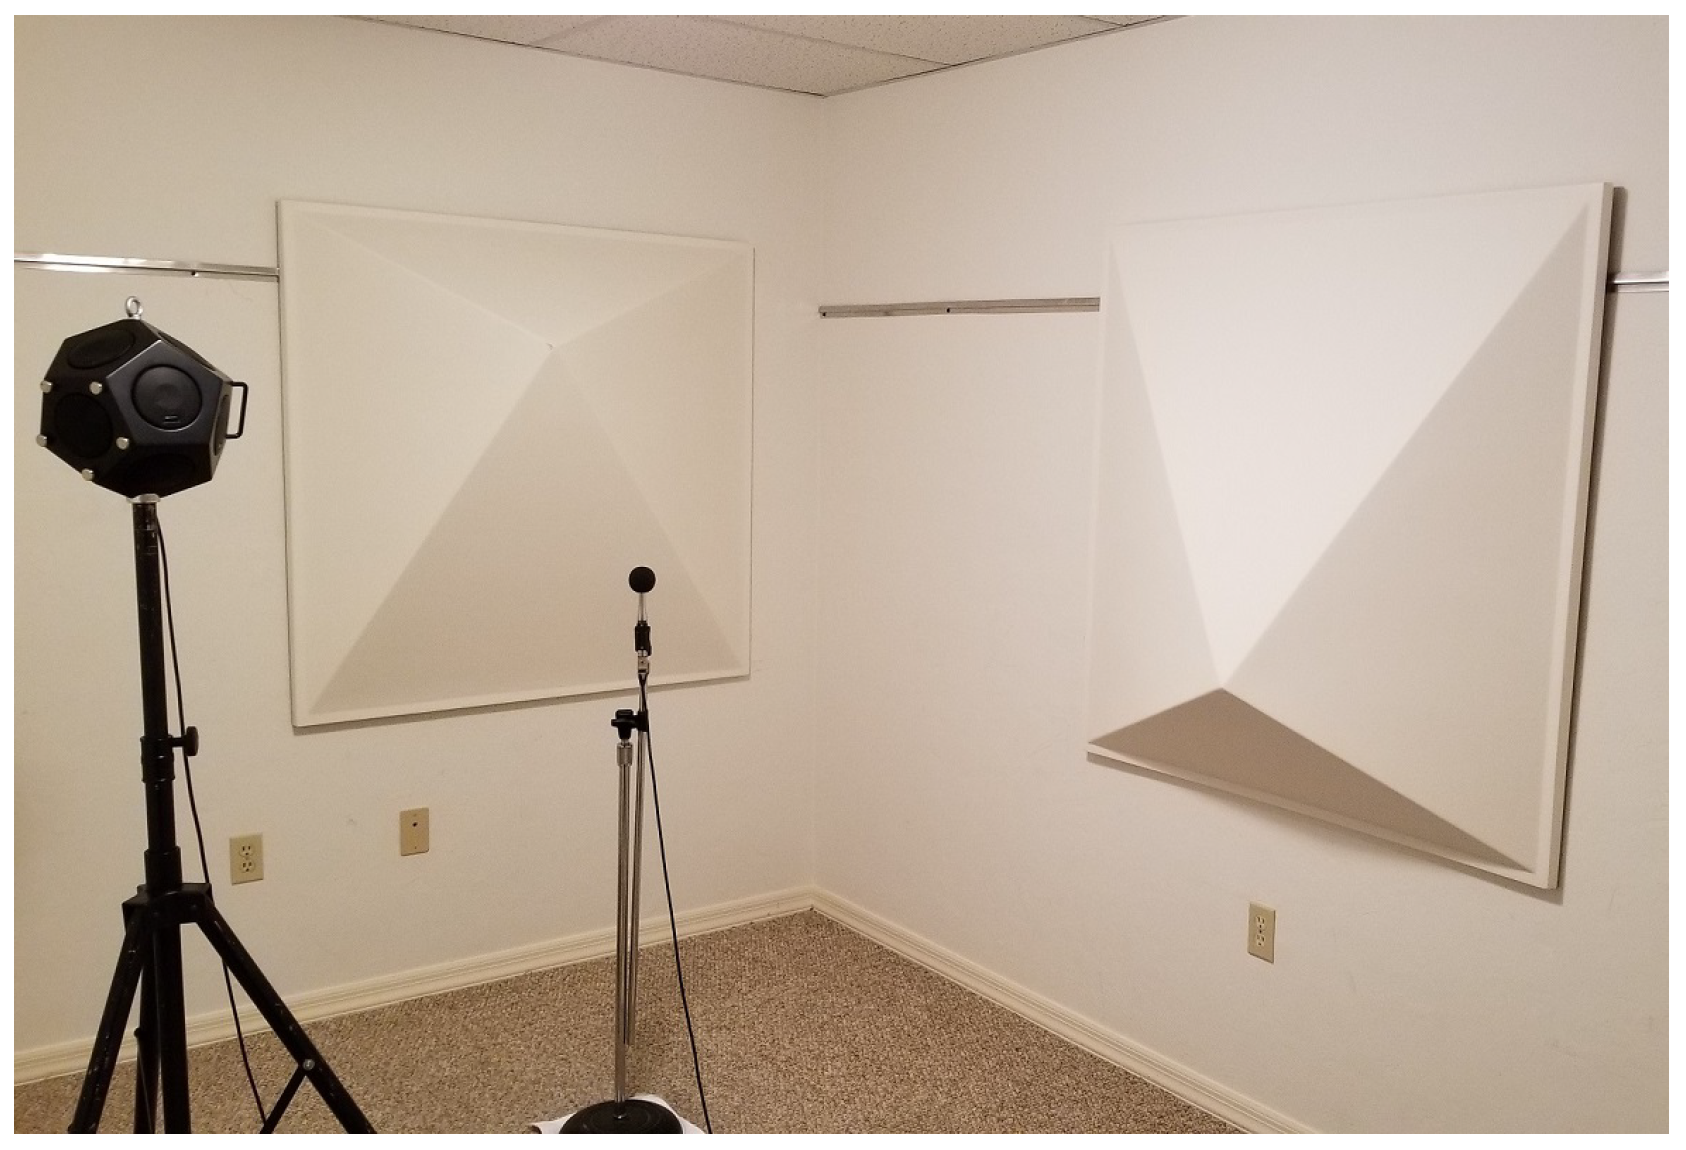
Photo of the measurement setup for one of the configurations of study (2Pi) with receiver at location 3. The source and receiver height is 1.5 and 1.2 m, respectively.
Figure 3.
Photo of the measurement setup for one of the configurations of study (2Pi) with receiver at location 3. The source and receiver height is 1.5 and 1.2 m, respectively.

Figure 4.
Reduction of early decay time (EDT) (top) and T20 (bottom) with respect to the reference per octave band for all the groups.
Figure 4.
Reduction of early decay time (EDT) (top) and T20 (bottom) with respect to the reference per octave band for all the groups.

Figure 5.
Increase of C50 (top) and C80 (bottom) with respect to the reference per octave band for all the groups.
Figure 5.
Increase of C50 (top) and C80 (bottom) with respect to the reference per octave band for all the groups.

Table 1.
Summary of the findings of the background studies. The +, -, and ∘ signs indicate that with the addition of the diffusers the values were increased, decreased, and inconsistently changed, respectively. The results consistent with those of the present paper are indicated with the marker *. This table is adapted from [10].
| Reference (Year) | Room | Diffuser Shape | Method | EDT | RT | C50 | C80 |
|---|---|---|---|---|---|---|---|
| Suzumura et al. [11] (2000) | Concert Hall | Column | 1:10 Scale Model | ∘ | |||
| Chiles [12] (2004) | Concert Hall | Hemisphere/Batten | 1:25 Scale Model | + | - * | ||
| Jeon and Kim [7] (2008) | Concert Hall | Hemisphere | 1:25 Scale Model | ∘ | ∘ | ∘ | |
| Concert Hall | Hemisphere | 1:50 Scale Model | - * | - * | |||
| Ryu and Jeon [13] (2008) | Concert Hall | Hemisphere | 1:10 Scale Model | - * | - * | ∘ | |
| Kim et al. [14] (2011) | Concert Hall | Hemisphere | 1:50 Scale Model 1 | - * | - * | + * | |
| Concert Hall | Hemisphere | 1:50 Scale Model 2 | - * | - * | + * | ||
| Kim et al. [15] (2011) | Concert Hall | Wave-shape | 1:25 Scale Model | + | |||
| Concert Hall | Convex | In-situ 1 | - * | ∘ | - | ||
| Concert Hall | Stepped | In-situ 2 | + | - * | |||
| Choi [8] (2013) | Classroom | Periodic | 1:10 Scale Model | - * | - * | + * | |
| Jeon et al. [6] (2015) | Concert Hall | Polygon | 1:10 Scale Model 1 | - * | - * | + * | |
| Chamber Hall | Saw-tooth | 1:10 Scale Model 2 | - * | ∘ | - | ||
| Shtrepi et al. [10] (2015) | Concert Hall | Simulated | Ray-based 1 | + | - * | - | |
| Concert Hall | Simulated | Ray-based 2 | + | - * | ∘ | ||
| Concert Hall | Simulated | Ray-based 3 | + | + | - | ||
| Shtrepi et al. [9] (2016) | Multi-purpose | Triangle | In-situ | + | + | - |
Different scattering coefficients were applied to the ceiling and walls to model scattered reflections.
Table 2.
Absorption coefficients of the room surfaces and diffusers materials, and the maximum change in the total absorption area of the room with respect to the empty room (in %).
Table 2.
Absorption coefficients of the room surfaces and diffusers materials, and the maximum change in the total absorption area of the room with respect to the empty room (in %).
| Room Surface | Area (m) | One Octave Band (Hz) | ||||
|---|---|---|---|---|---|---|
| 250 | 500 | 1000 | 2000 | 4000 | ||
| 3 Convex/3 Pyramid | 4.9/4.6 | 0.16 | 0.09 | 0.05 | 0.04 | 0.04 |
| Ceiling | 10.7 | 0.28 | 0.38 | 0.60 | 0.76 | 0.77 |
| Floor [3] | 10.7 | 0.08 | 0.17 | 0.33 | 0.59 | 0.75 |
| Walls [3] | 29.4 | 0.12 | 0.08 | 0.06 | 0.06 | 0.05 |
| Door [3] | 1.7 | 0.10 | 0.06 | 0.08 | 0.10 | 0.10 |
| 7.7 | 8.4 | 11.8 | 16.3/16.2 | 17.8 | ||
| 7.5 | 8.3 | 11.8 | 16.3 | 17.9 | ||
| Maximum percentage change | 2.6 | 0.6 | 0.5 | 0.7 | 0.3 | |
Data adopted from the manufacturer (USG) https://www.usg.com/content/dam/USG_Marketing_Communications/united_states/product_promotional_materials/finished_assets/usg-ceilings-systems-catalog-en-SC2000.pdf.
Table 3.
Groups and their corresponding configurations. The naming of the configurations corresponds to Integer: number of diffusers in the configuration, P: pyramid diffuser, C: convex diffuser, letter: location and pattern of the installation on the walls of the room (a, m: clustered; k, l, n, o: distributed).
| # | Group Name | Configurations |
|---|---|---|
| 1 | 1P | 1Pa, 1Pb, 1Pc, 1Pd, 1Pe |
| 2 | 2P | 2Pa, 2Pf, 2Pg, 2Ph, 2Pi, 2Pj |
| 3 | 3P | 3Pa, 3Pk, 3Pl, 3Pm, 3Pn, 3Po |
| 4 | 1C | 1Ca, 1Cb, 1Cc, 1Cd, 1Ce |
| 5 | 2C | 2Ca, 2Cf, 2Cg, 2Ch, 2Ci, 2Cj |
| 6 | 3C | 3Ca, 3Ck, 3Cl, 3Cm, 3Cn, 3Co |
Table 4.
Mean and SD over the five source-receiver combinations of the early decay time (EDT), T20, C50, and C80 for the empty room.
Table 4.
Mean and SD over the five source-receiver combinations of the early decay time (EDT), T20, C50, and C80 for the empty room.
| Freq. (Hz) | EDT (s) | T20 (s) | C50 (dB) | C80 (dB) |
|---|---|---|---|---|
| 250 | 0.50 (0.08) | 0.55 (0.06) | 4.8 (1.8) | 9.8 (1.5) |
| 500 | 0.33 (0.05) | 0.31 (0.03) | 9.5 (0.9) | 15.8 (1.1) |
| 1000 | 0.36 (0.07) | 0.59 (0.07) | 8.7 (0.8) | 12.7 (1.2) |
| 2000 | 1.00 (0.05) | 1.17 (0.04) | 2.7 (0.7) | 4.9 (0.7) |
| 4000 | 1.01 (0.06) | 1.19 (0.02) | 5.0 (1.2) | 6.5 (1.1) |
Table 5.
Results of the Kruskal–Wallis tests for the analysis of the coverage characteristics (significant p-values at the 5% significance level are indicated in bold).
Table 5.
Results of the Kruskal–Wallis tests for the analysis of the coverage characteristics (significant p-values at the 5% significance level are indicated in bold).
| Acoustical Parameter | Freq. Range | Groups | Chi-Squared | df | p-Value |
|---|---|---|---|---|---|
| EDT | Low | 1P-3P | 3.70 | 2 | 0.158 |
| 1C-3C | 8.18 | 2 | 0.017 | ||
| Mid | 1P-3P | 31.21 | 2 | <0.001 | |
| 1C-3C | 39.44 | 2 | <0.001 | ||
| High | 1P-3P | 62.20 | 2 | <0.001 | |
| 1C-3C | 57.39 | 2 | <0.001 | ||
| T20 | Low | 1P-3P | 3.57 | 2 | 0.167 |
| 1C-3C | 5.73 | 2 | 0.057 | ||
| Mid | 1P-3P | 44.27 | 2 | <0.001 | |
| 1C-3C | 44.57 | 2 | <0.001 | ||
| High | 1P-3P | 74.47 | 2 | <0.001 | |
| 1C-3C | 72.51 | 2 | <0.001 | ||
| C50 | Low | 1P-3P | 2.10 | 2 | 0.350 |
| 1C-3C | 4.48 | 2 | 0.107 | ||
| Mid | 1P-3P | 43.01 | 2 | <0.001 | |
| 1C-3C | 47.43 | 2 | <0.001 | ||
| High | 1P-3P | 49.56 | 2 | <0.001 | |
| 1C-3C | 50.00 | 2 | <0.001 | ||
| C80 | Low | 1P-3P | 0.82 | 2 | 0.665 |
| 1C-3C | 3.03 | 2 | 0.220 | ||
| Mid | 1P-3P | 46.96 | 2 | <0.001 | |
| 1C-3C | 52.20 | 2 | <0.001 | ||
| High | 1P-3P | 68.45 | 2 | <0.001 | |
| 1C-3C | 66.63 | 2 | <0.001 |
Table 6.
Results of the Kruskal–Wallis tests for the analysis of the type characteristics (significant p-values at the 5% significance level are indicated in bold).
Table 6.
Results of the Kruskal–Wallis tests for the analysis of the type characteristics (significant p-values at the 5% significance level are indicated in bold).
| Acoustical Parameter | Freq. Range | Groups | Chi-Squared | df | p-Value |
|---|---|---|---|---|---|
| EDT | Low | 1P, 1C | 0.03 | 1 | 0.874 |
| 2P, 2C | 0.38 | 1 | 0.537 | ||
| 3P, 3C | 0.57 | 1 | 0.456 | ||
| Mid | 1P, 1C | 0.03 | 1 | 0.863 | |
| 2P, 2C | 0.16 | 1 | 0.692 | ||
| 3P, 3C | 0.12 | 1 | 0.725 | ||
| High | 1P, 1C | 5.56 | 1 | 0.018 | |
| 2P, 2C | 12.98 | 1 | <0.001 | ||
| 3P, 3C | 16.78 | 1 | <0.001 | ||
| T20 | Low | 1P, 1C | 0.10 | 1 | 0.754 |
| 2P, 2C | 0.02 | 1 | 0.881 | ||
| 3P, 3C | 0.49 | 1 | 0.483 | ||
| Mid | 1P, 1C | 0.39 | 1 | 0.533 | |
| 2P, 2C | 1.11 | 1 | 0.291 | ||
| 3P, 3C | 0.18 | 1 | 0.674 | ||
| High | 1P, 1C | 0.63 | 1 | 0.426 | |
| 2P, 2C | 1.09 | 1 | 0.297 | ||
| 3P, 3C | 6.52 | 1 | 0.011 | ||
| C50 | Low | 1P, 1C | 0.08 | 1 | 0.775 |
| 2P, 2C | 0.14 | 1 | 0.711 | ||
| 3P, 3C | 0.14 | 1 | 0.711 | ||
| Mid | 1P, 1C | 0.26 | 1 | 0.608 | |
| 2P, 2C | 0.41 | 1 | 0.522 | ||
| 3P, 3C | 0.10 | 1 | 0.753 | ||
| High | 1P, 1C | 2.29 | 1 | 0.130 | |
| 2P, 2C | 8.27 | 1 | 0.004 | ||
| 3P, 3C | 5.39 | 1 | 0.020 | ||
| C80 | Low | 1P, 1C | 0.05 | 1 | 0.820 |
| 2P, 2C | 0.23 | 1 | 0.635 | ||
| 3P, 3C | 0.49 | 1 | 0.482 | ||
| Mid | 1P, 1C | 0.08 | 1 | 0.777 | |
| 2P, 2C | 0.03 | 1 | 0.871 | ||
| 3P, 3C | 0.16 | 1 | 0.690 | ||
| High | 1P, 1C | 1.93 | 1 | 0.165 | |
| 2P, 2C | 12.23 | 1 | <0.001 | ||
| 3P, 3C | 6.06 | 1 | 0.014 |
© 2019 by the authors. Licensee MDPI, Basel, Switzerland. This article is an open access article distributed under the terms and conditions of the Creative Commons Attribution (CC BY) license (http://creativecommons.org/licenses/by/4.0/).
Share and Cite
MDPI and ACS Style
Azad, H.; Meyer, J.; Siebein, G.; Lokki, T. The Effects of Adding Pyramidal and Convex Diffusers on Room Acoustic Parameters in a Small Non-Diffuse Room. Acoustics 2019, 1, 618-643. https://doi.org/10.3390/acoustics1030037
AMA Style
Azad H, Meyer J, Siebein G, Lokki T. The Effects of Adding Pyramidal and Convex Diffusers on Room Acoustic Parameters in a Small Non-Diffuse Room. Acoustics. 2019; 1(3):618-643. https://doi.org/10.3390/acoustics1030037
Chicago/Turabian StyleAzad, Hassan, Julie Meyer, Gary Siebein, and Tapio Lokki. 2019. "The Effects of Adding Pyramidal and Convex Diffusers on Room Acoustic Parameters in a Small Non-Diffuse Room" Acoustics 1, no. 3: 618-643. https://doi.org/10.3390/acoustics1030037