Ultrasonic Transceiver with a Regular/Periodic 1-3 Piezocomposite Based on the SAW Resonance Mode on Damping Backing

Abstract
1. Introduction
2. Boundary SAW Resonance Performance of the Piezoelectric 1-3 Composite Bonded to Backing
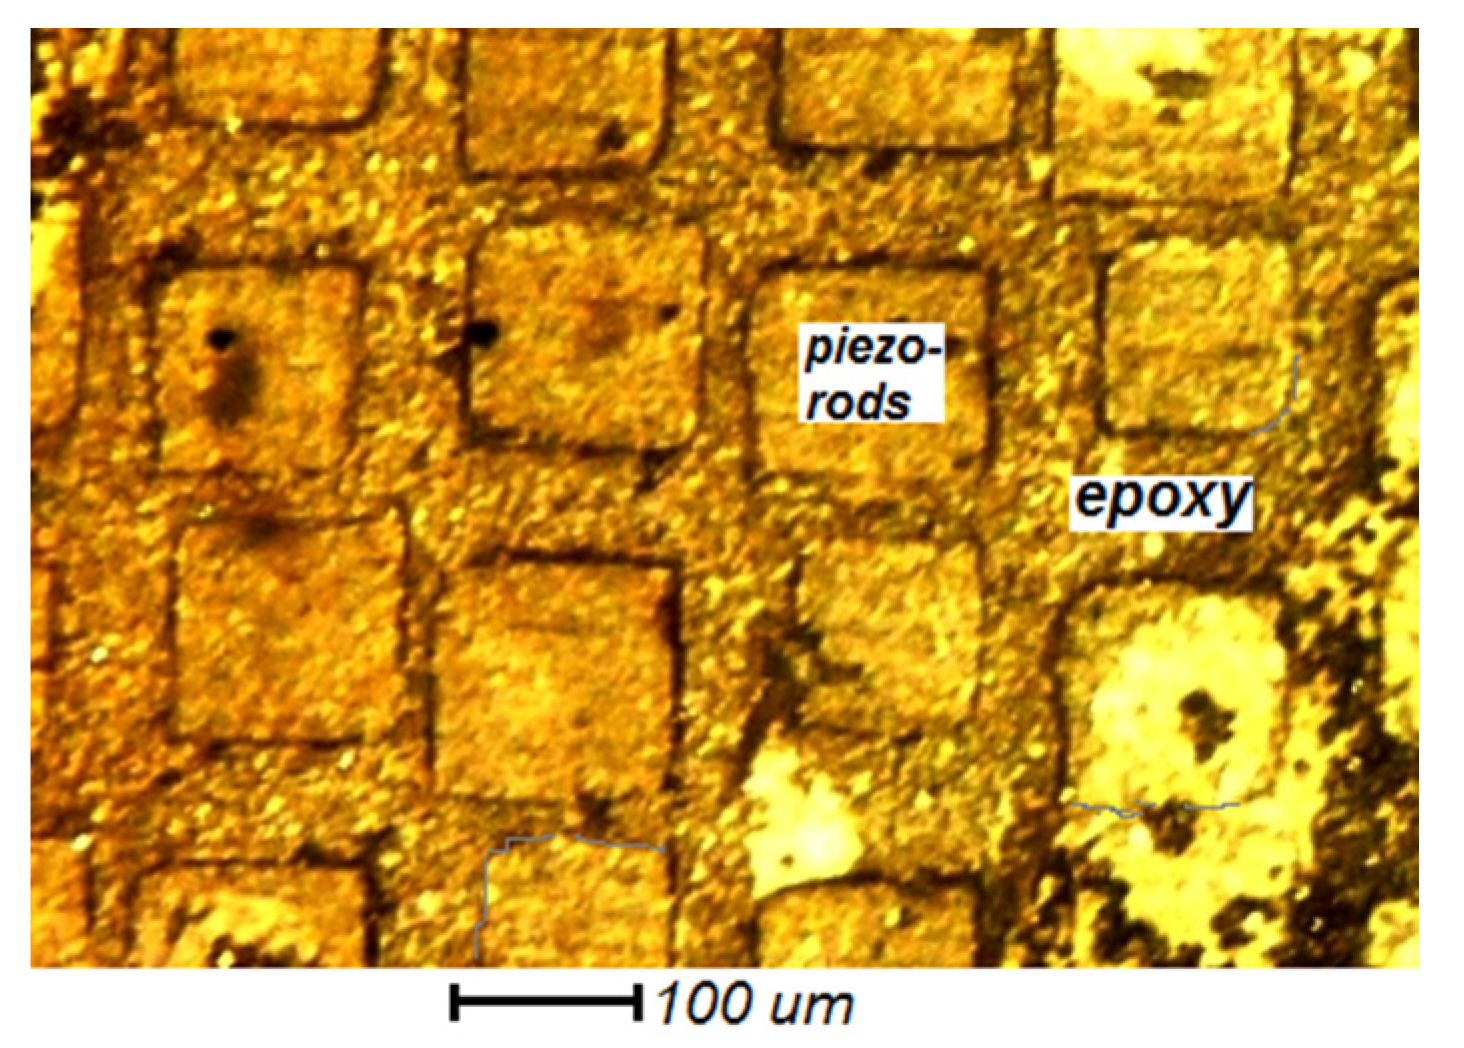
2.1. 1-3 Piezocomposites with Regular Structure for the Experiments
2.2. SAW on the Backing Boundary—Acoustical Effect Prediction
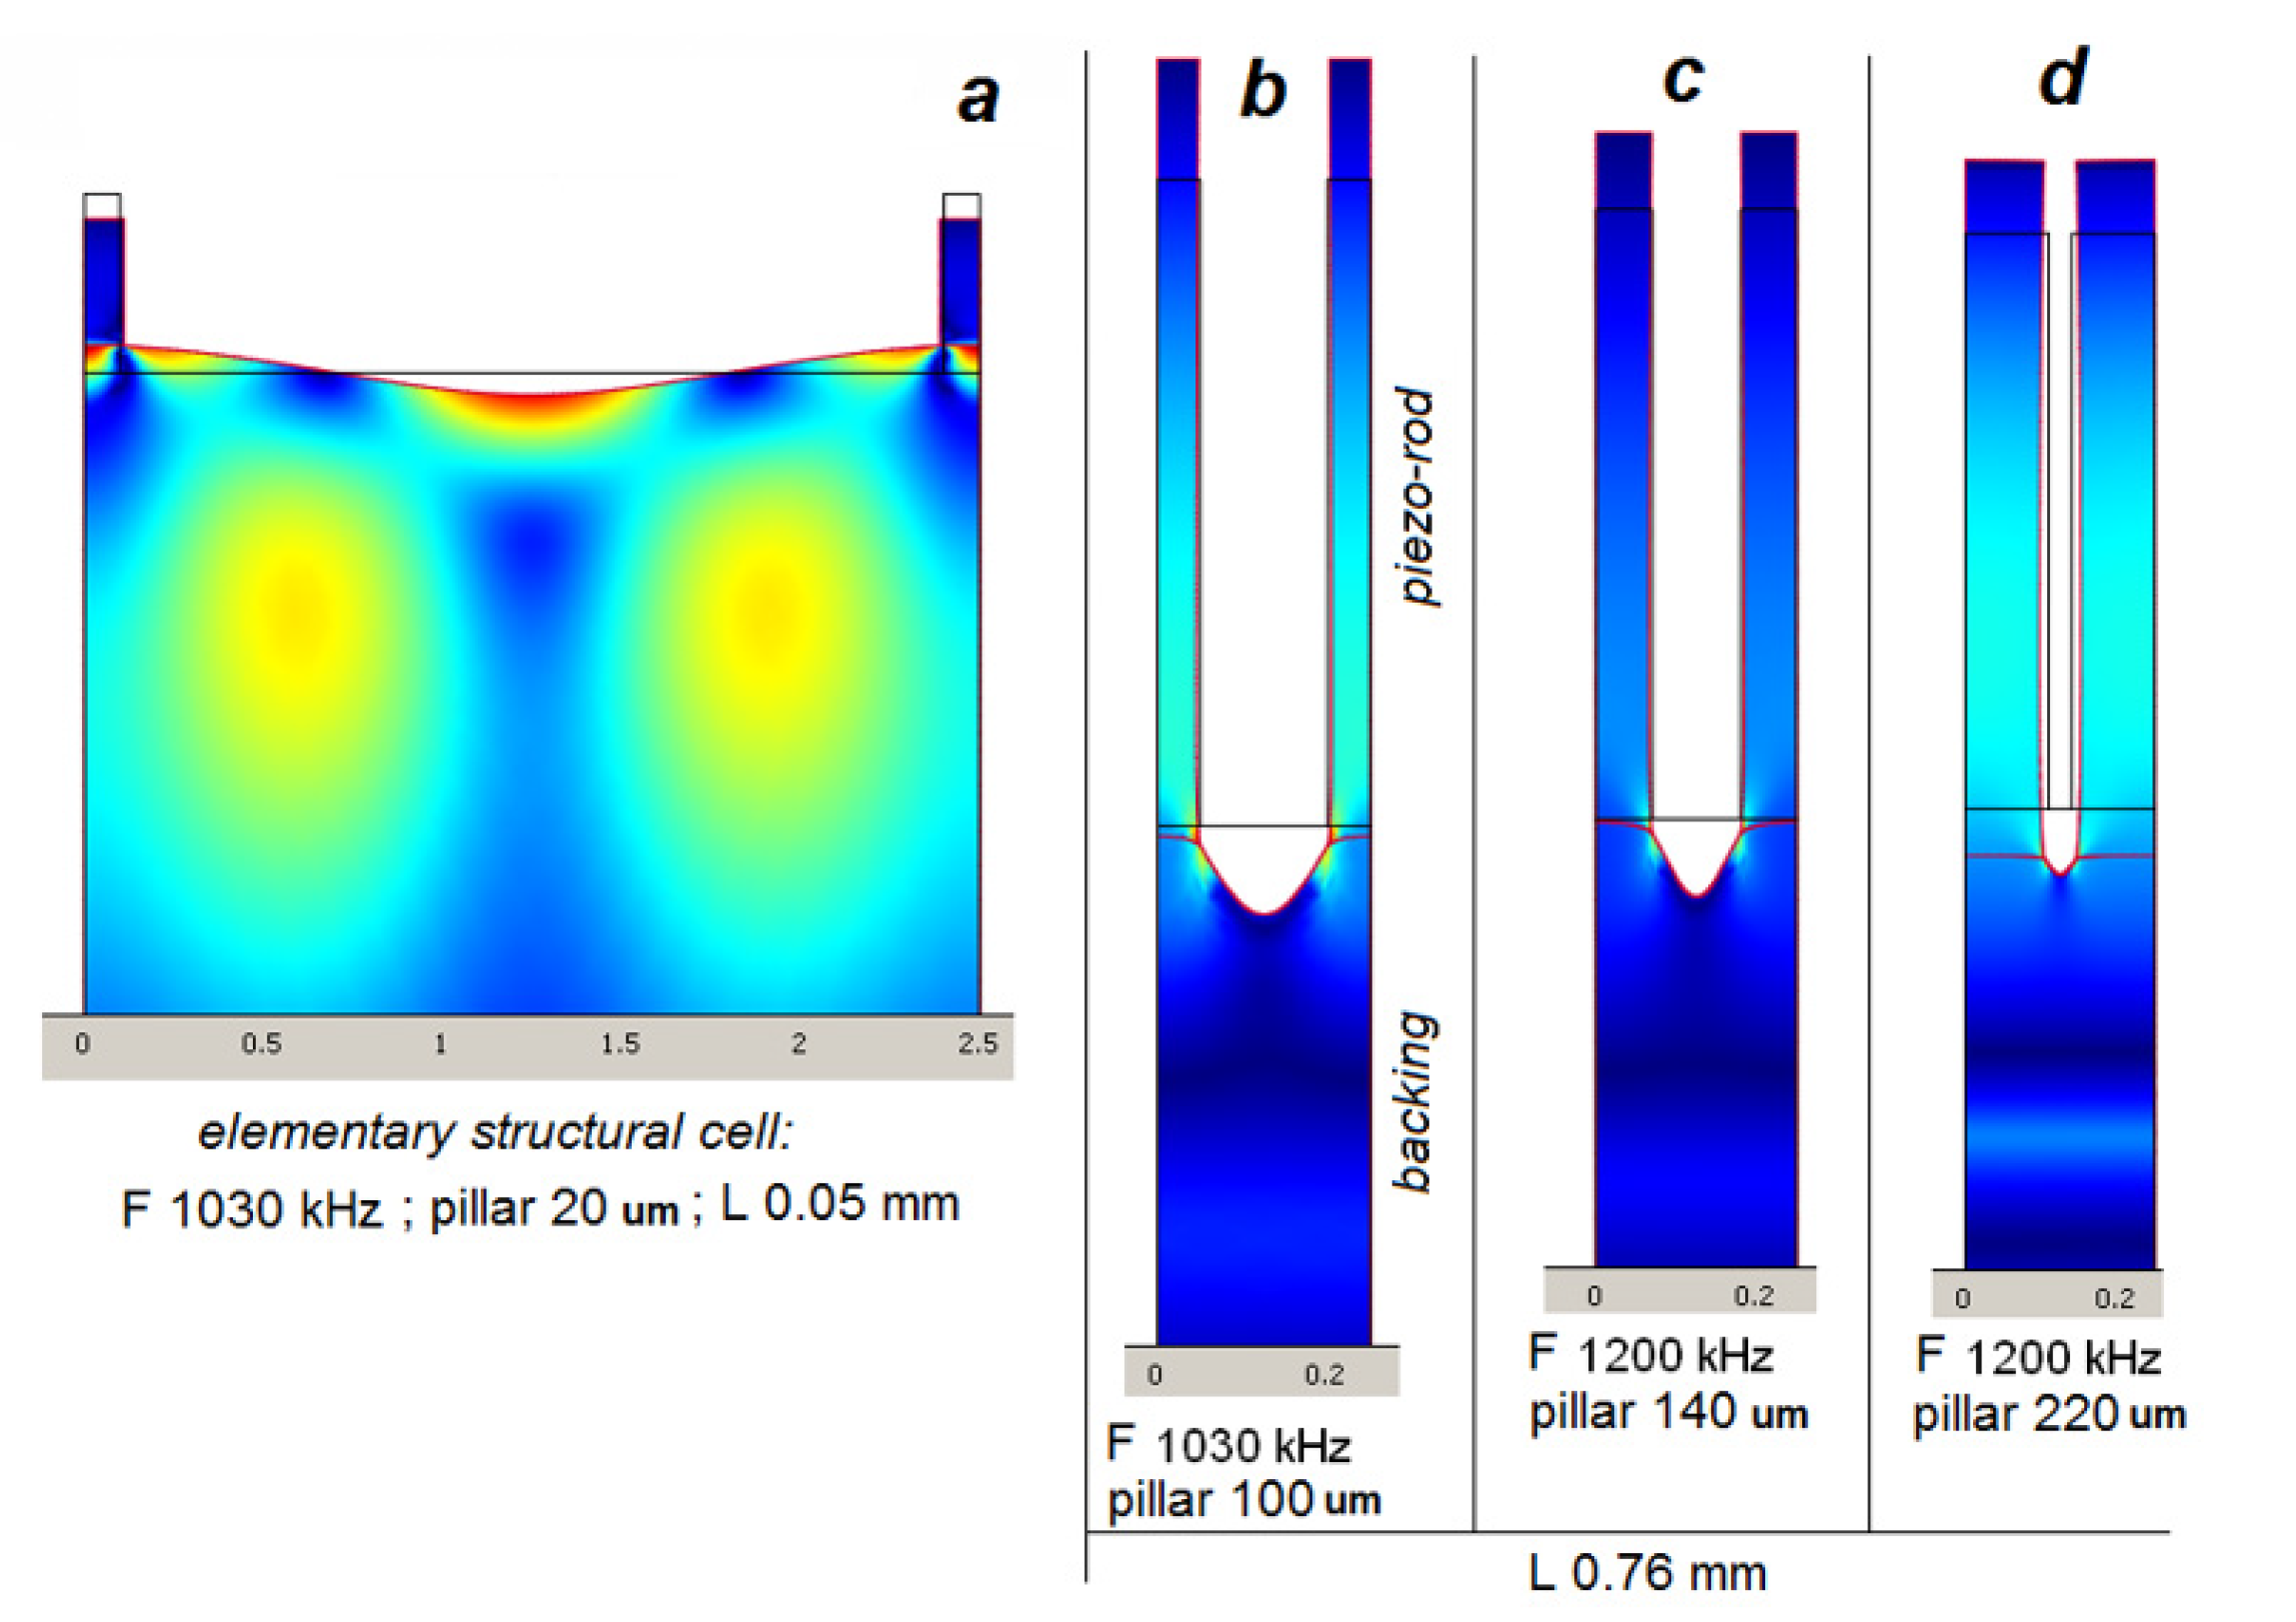
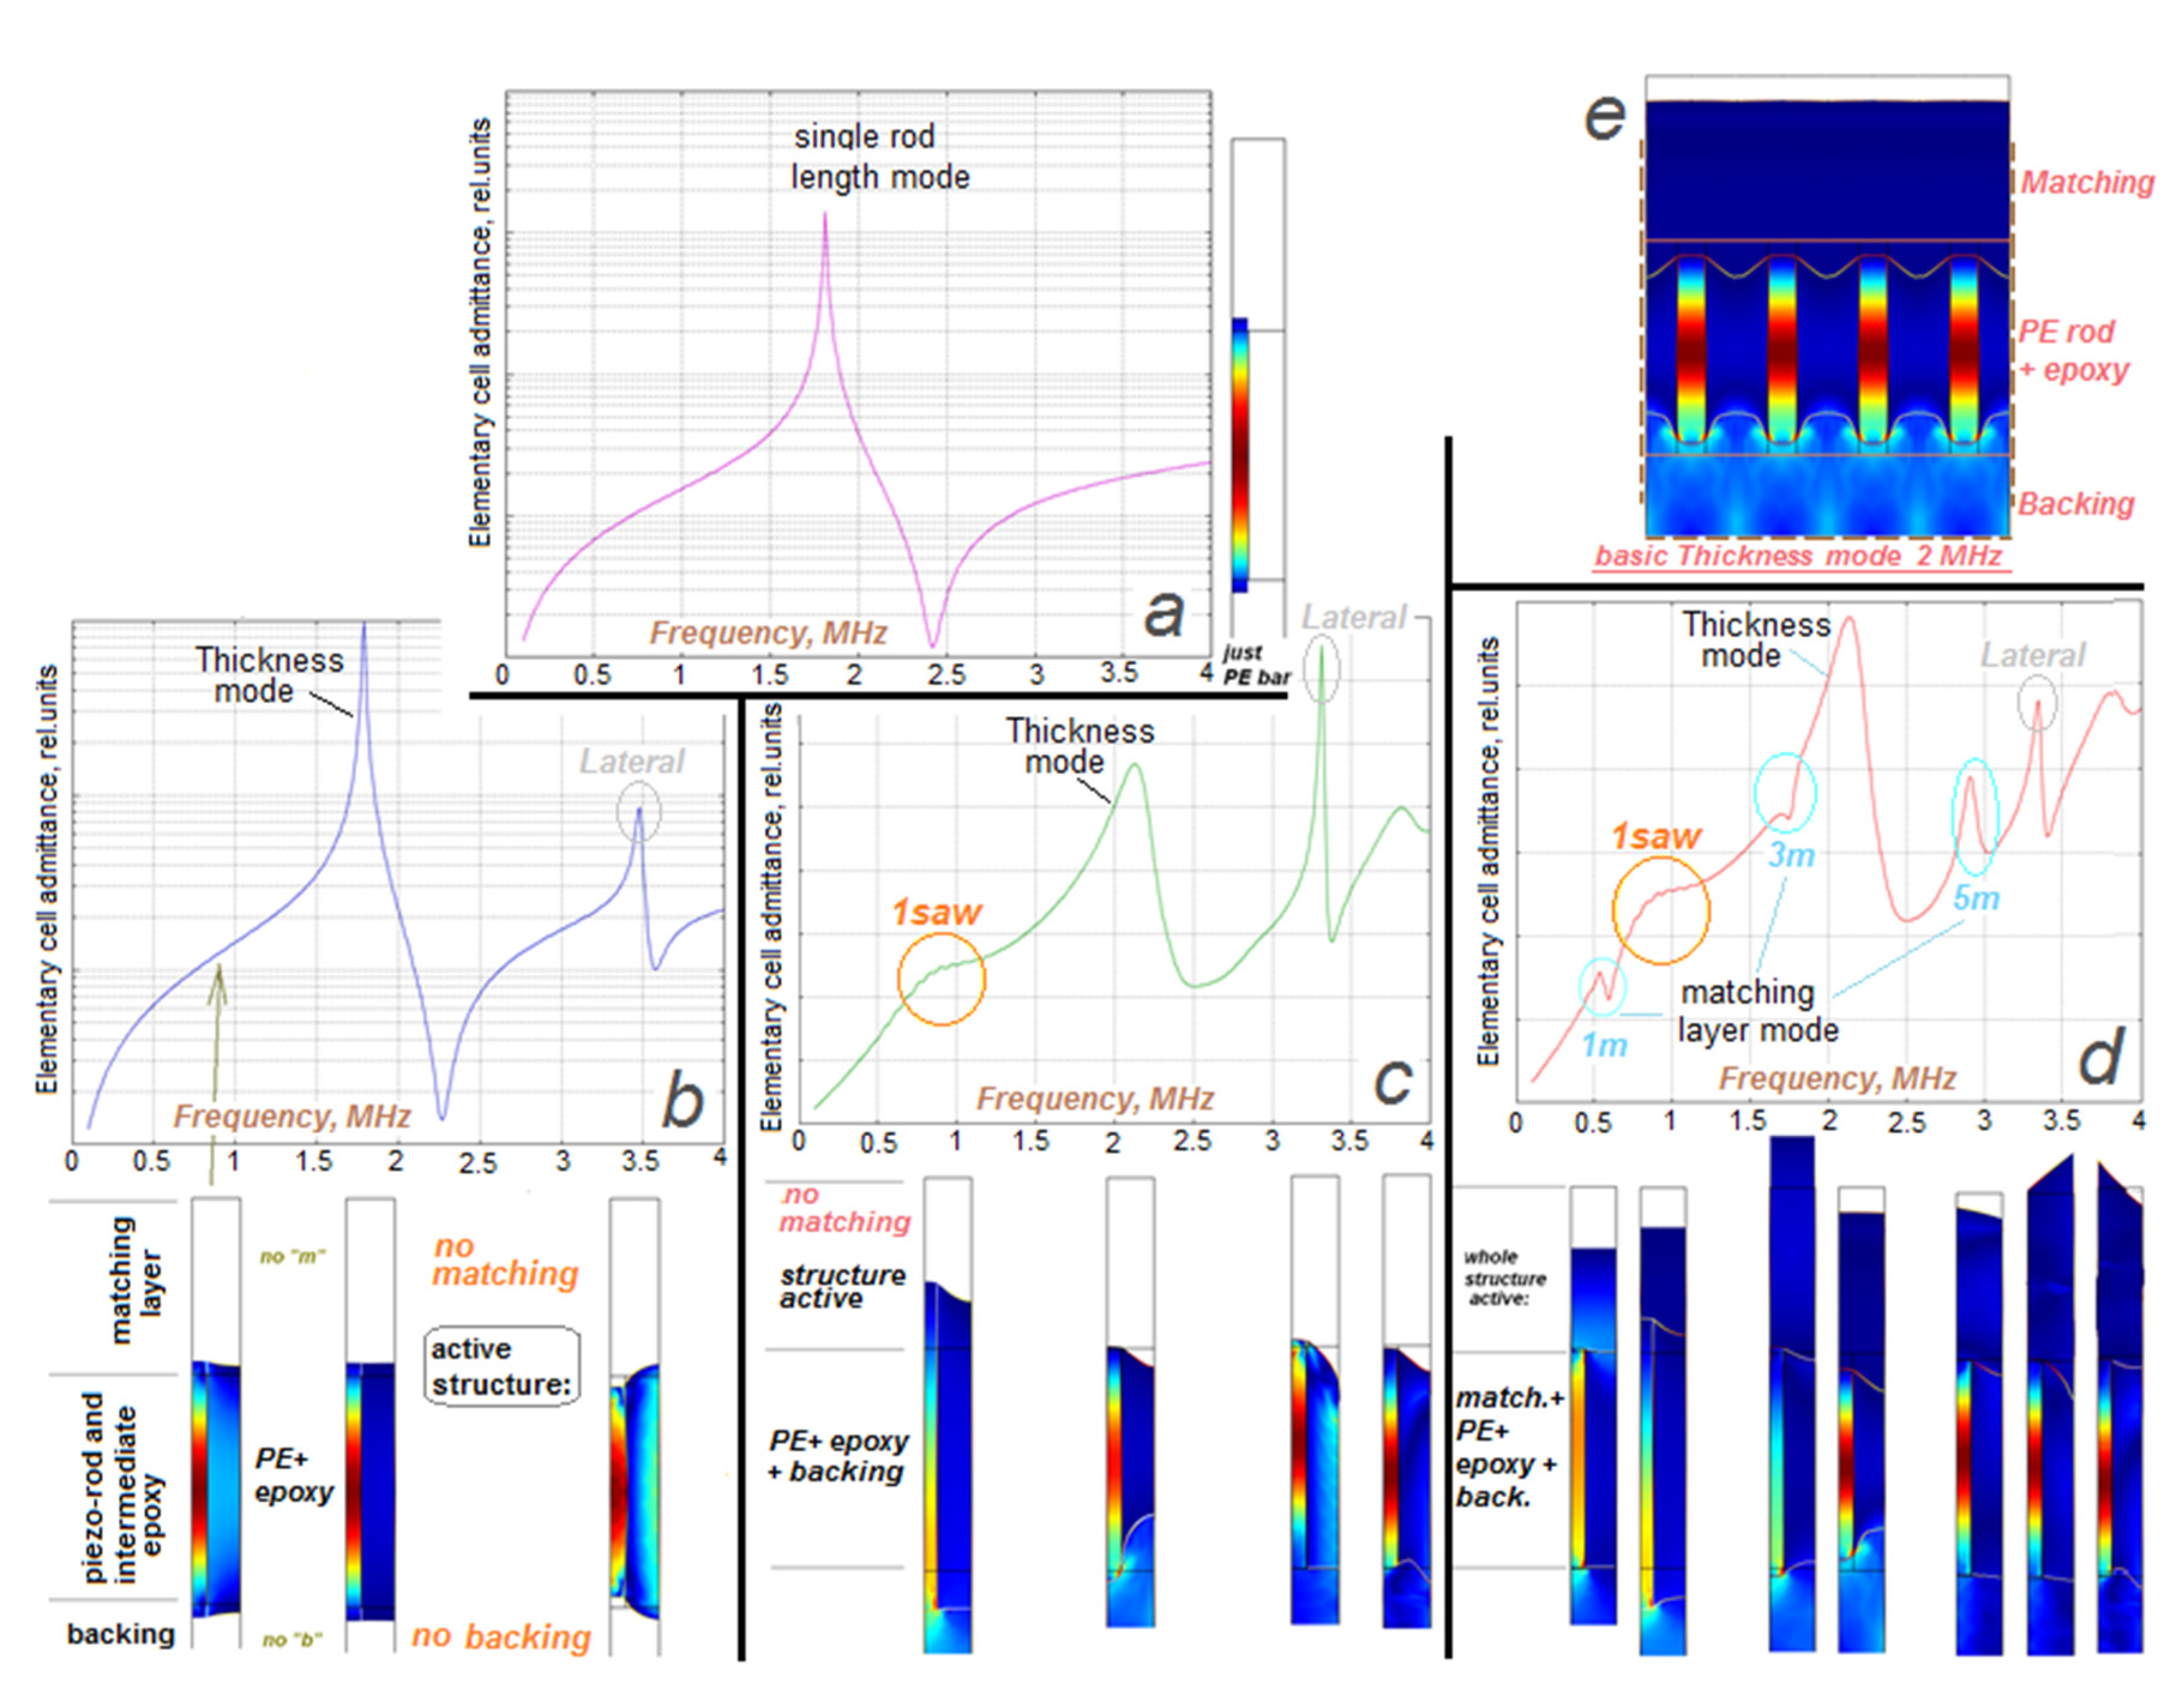
2.3. FEA Simulation of SAW Resonances on Backing with 1-3 Piezocomposite Rod Structure
2.4. Basic Estimation for the 1-3 Piezocomposite Rod Structure with SAW Vibrational Mode on Backing
2.5. Consecutive FEA Simulation of Air-Coupled 1-3 Piezocomposite Transducer with SAW Resonance on Backing
3. Experimental Performance of a Transceiver with Piezoelectric 1-3 Composite Bonded to the Backing Layer—SAW Mode
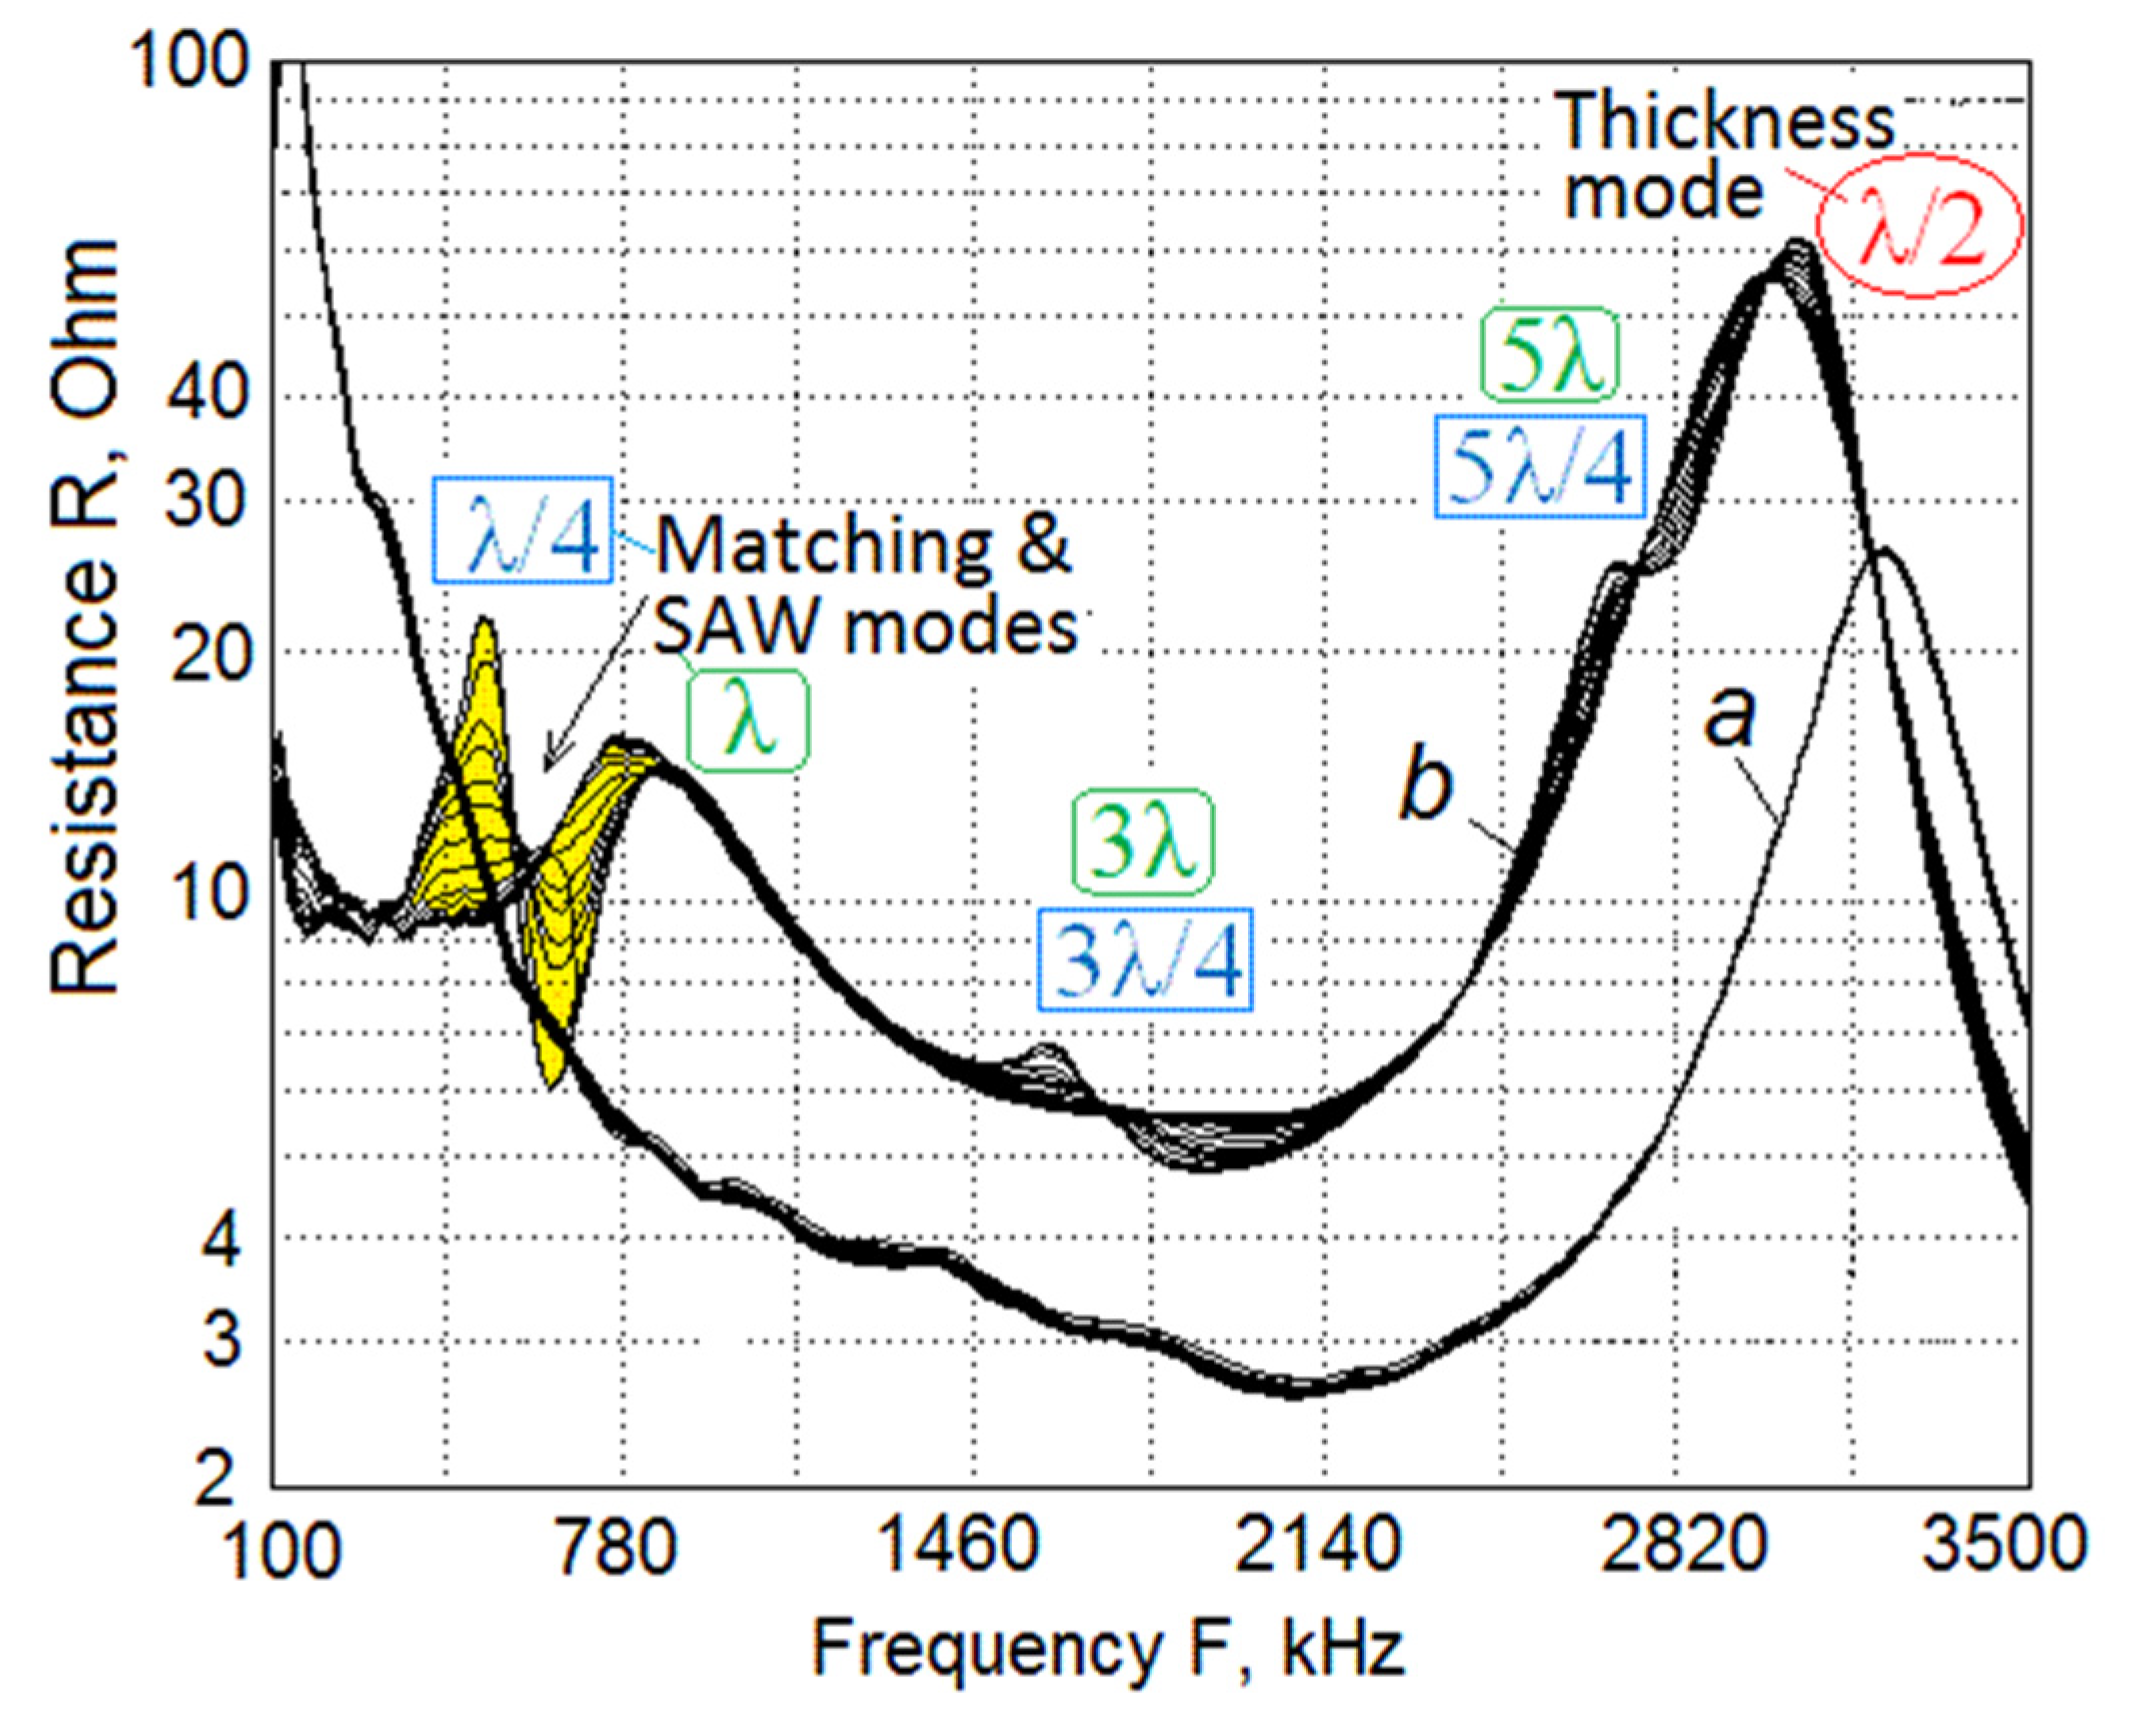
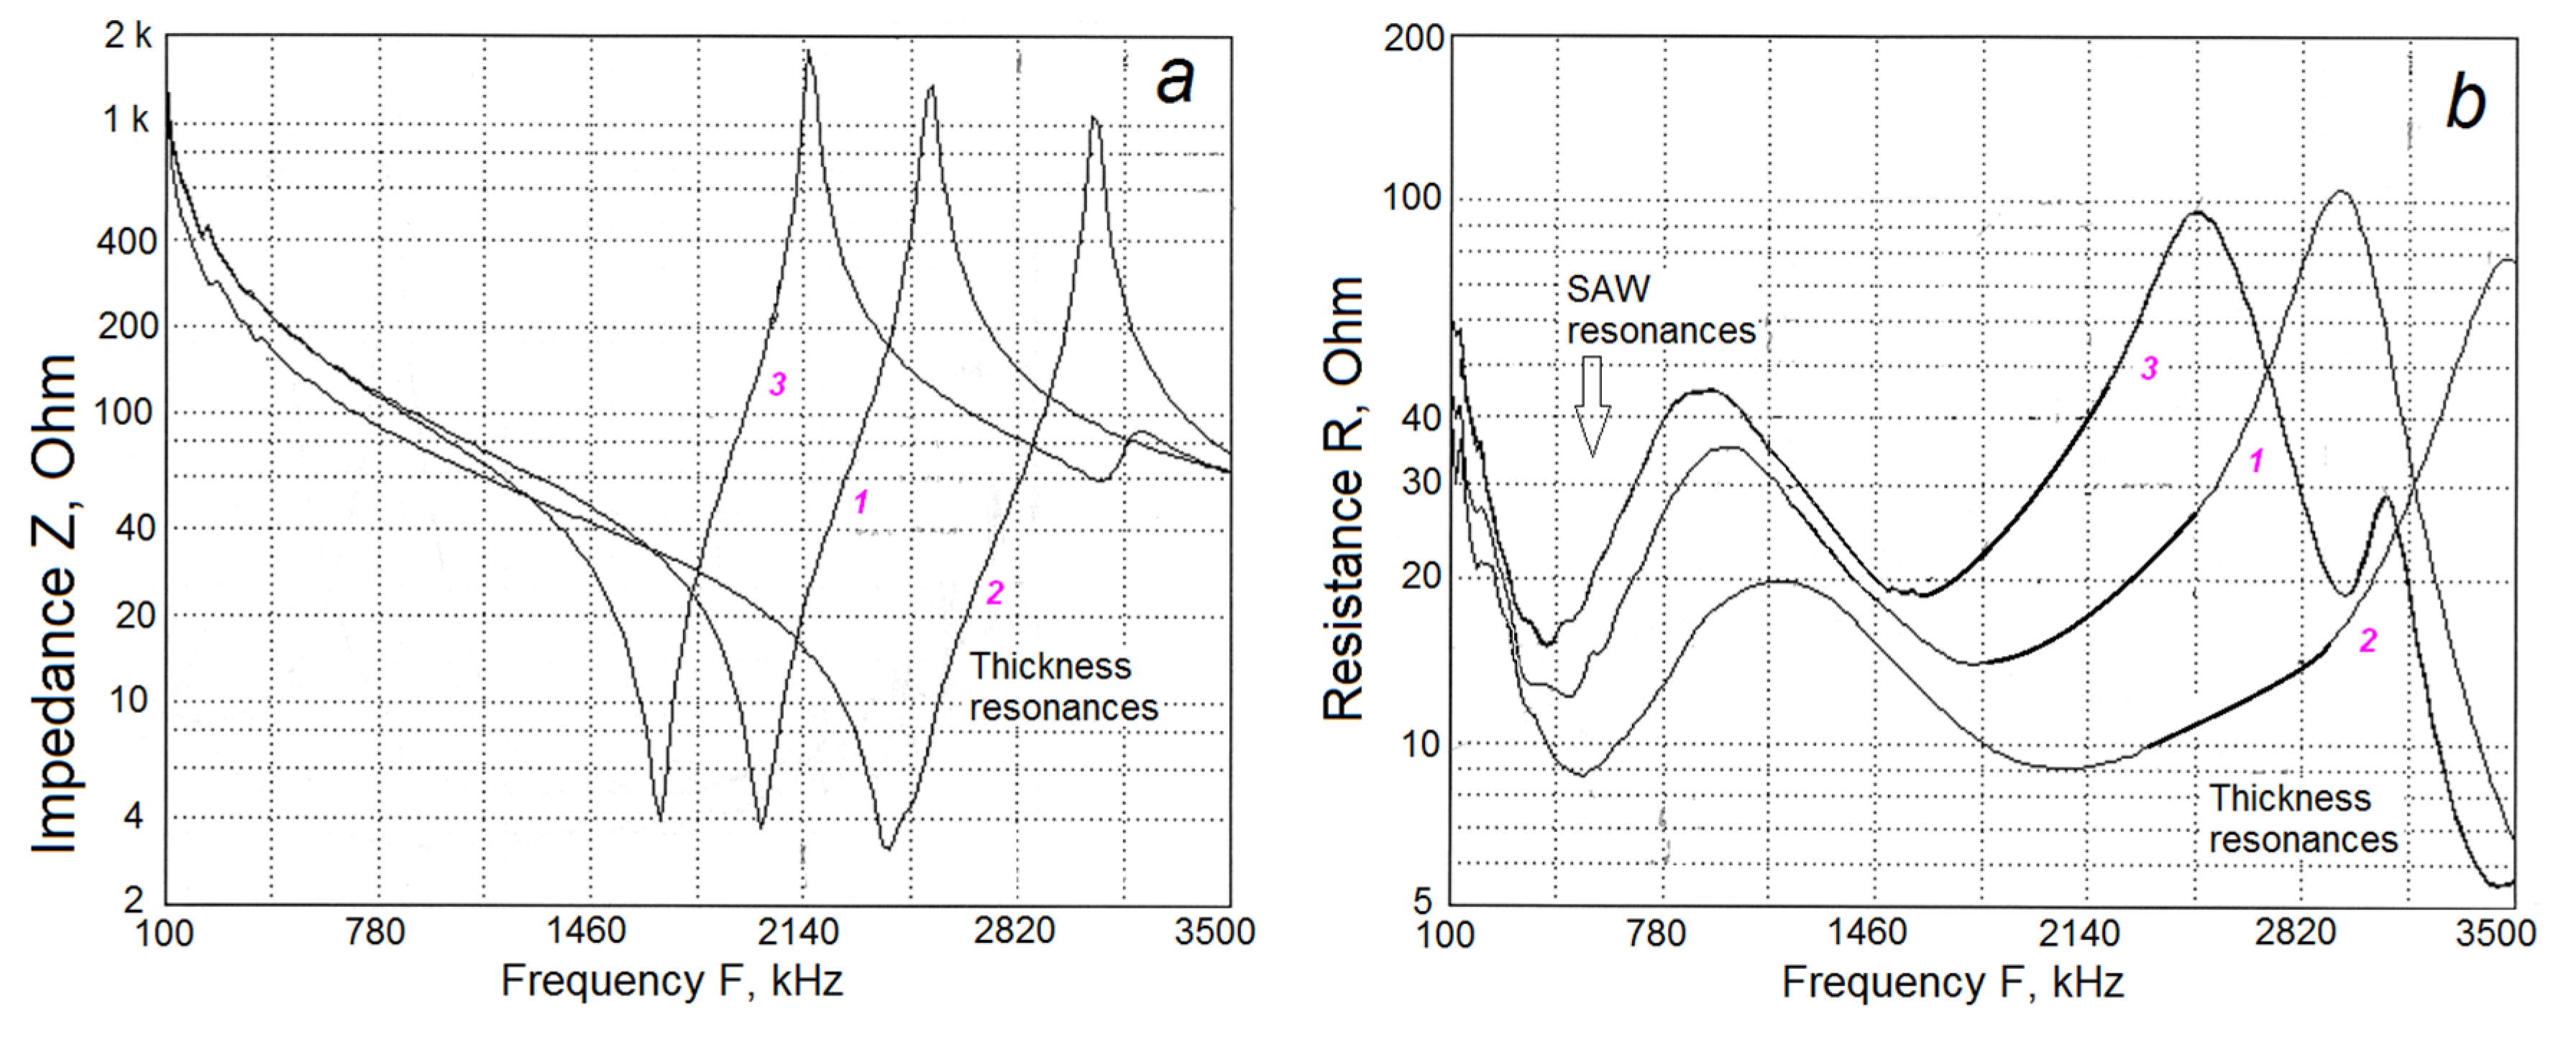
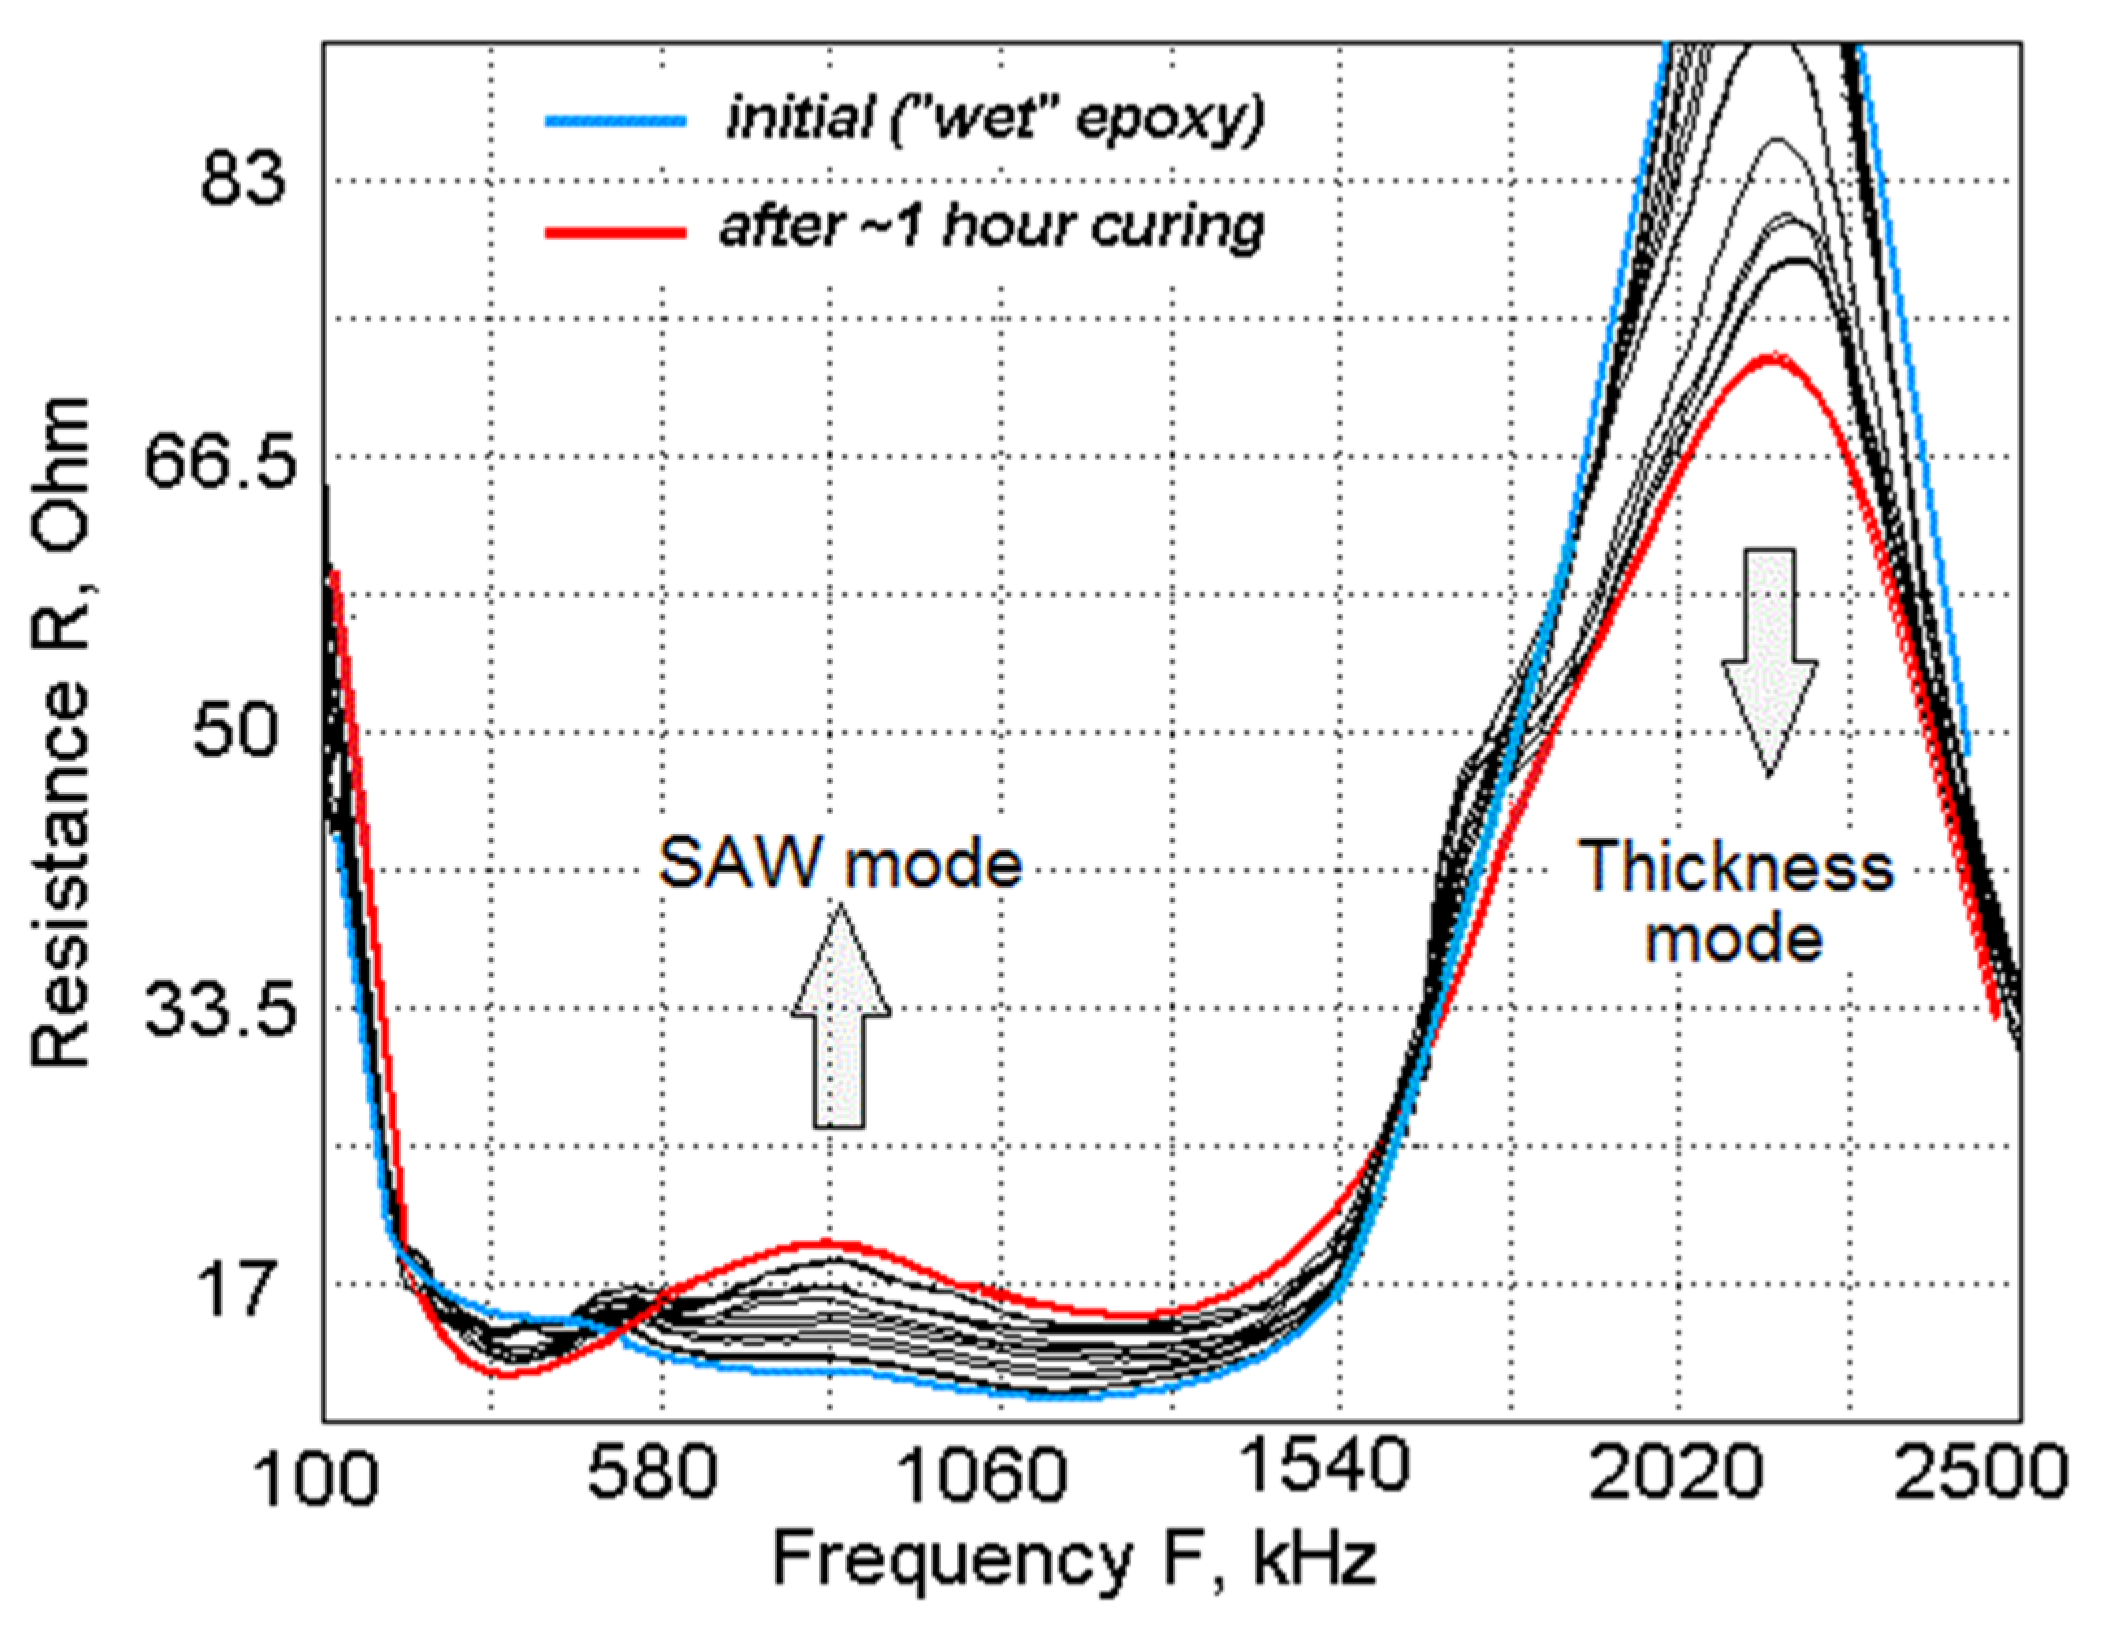
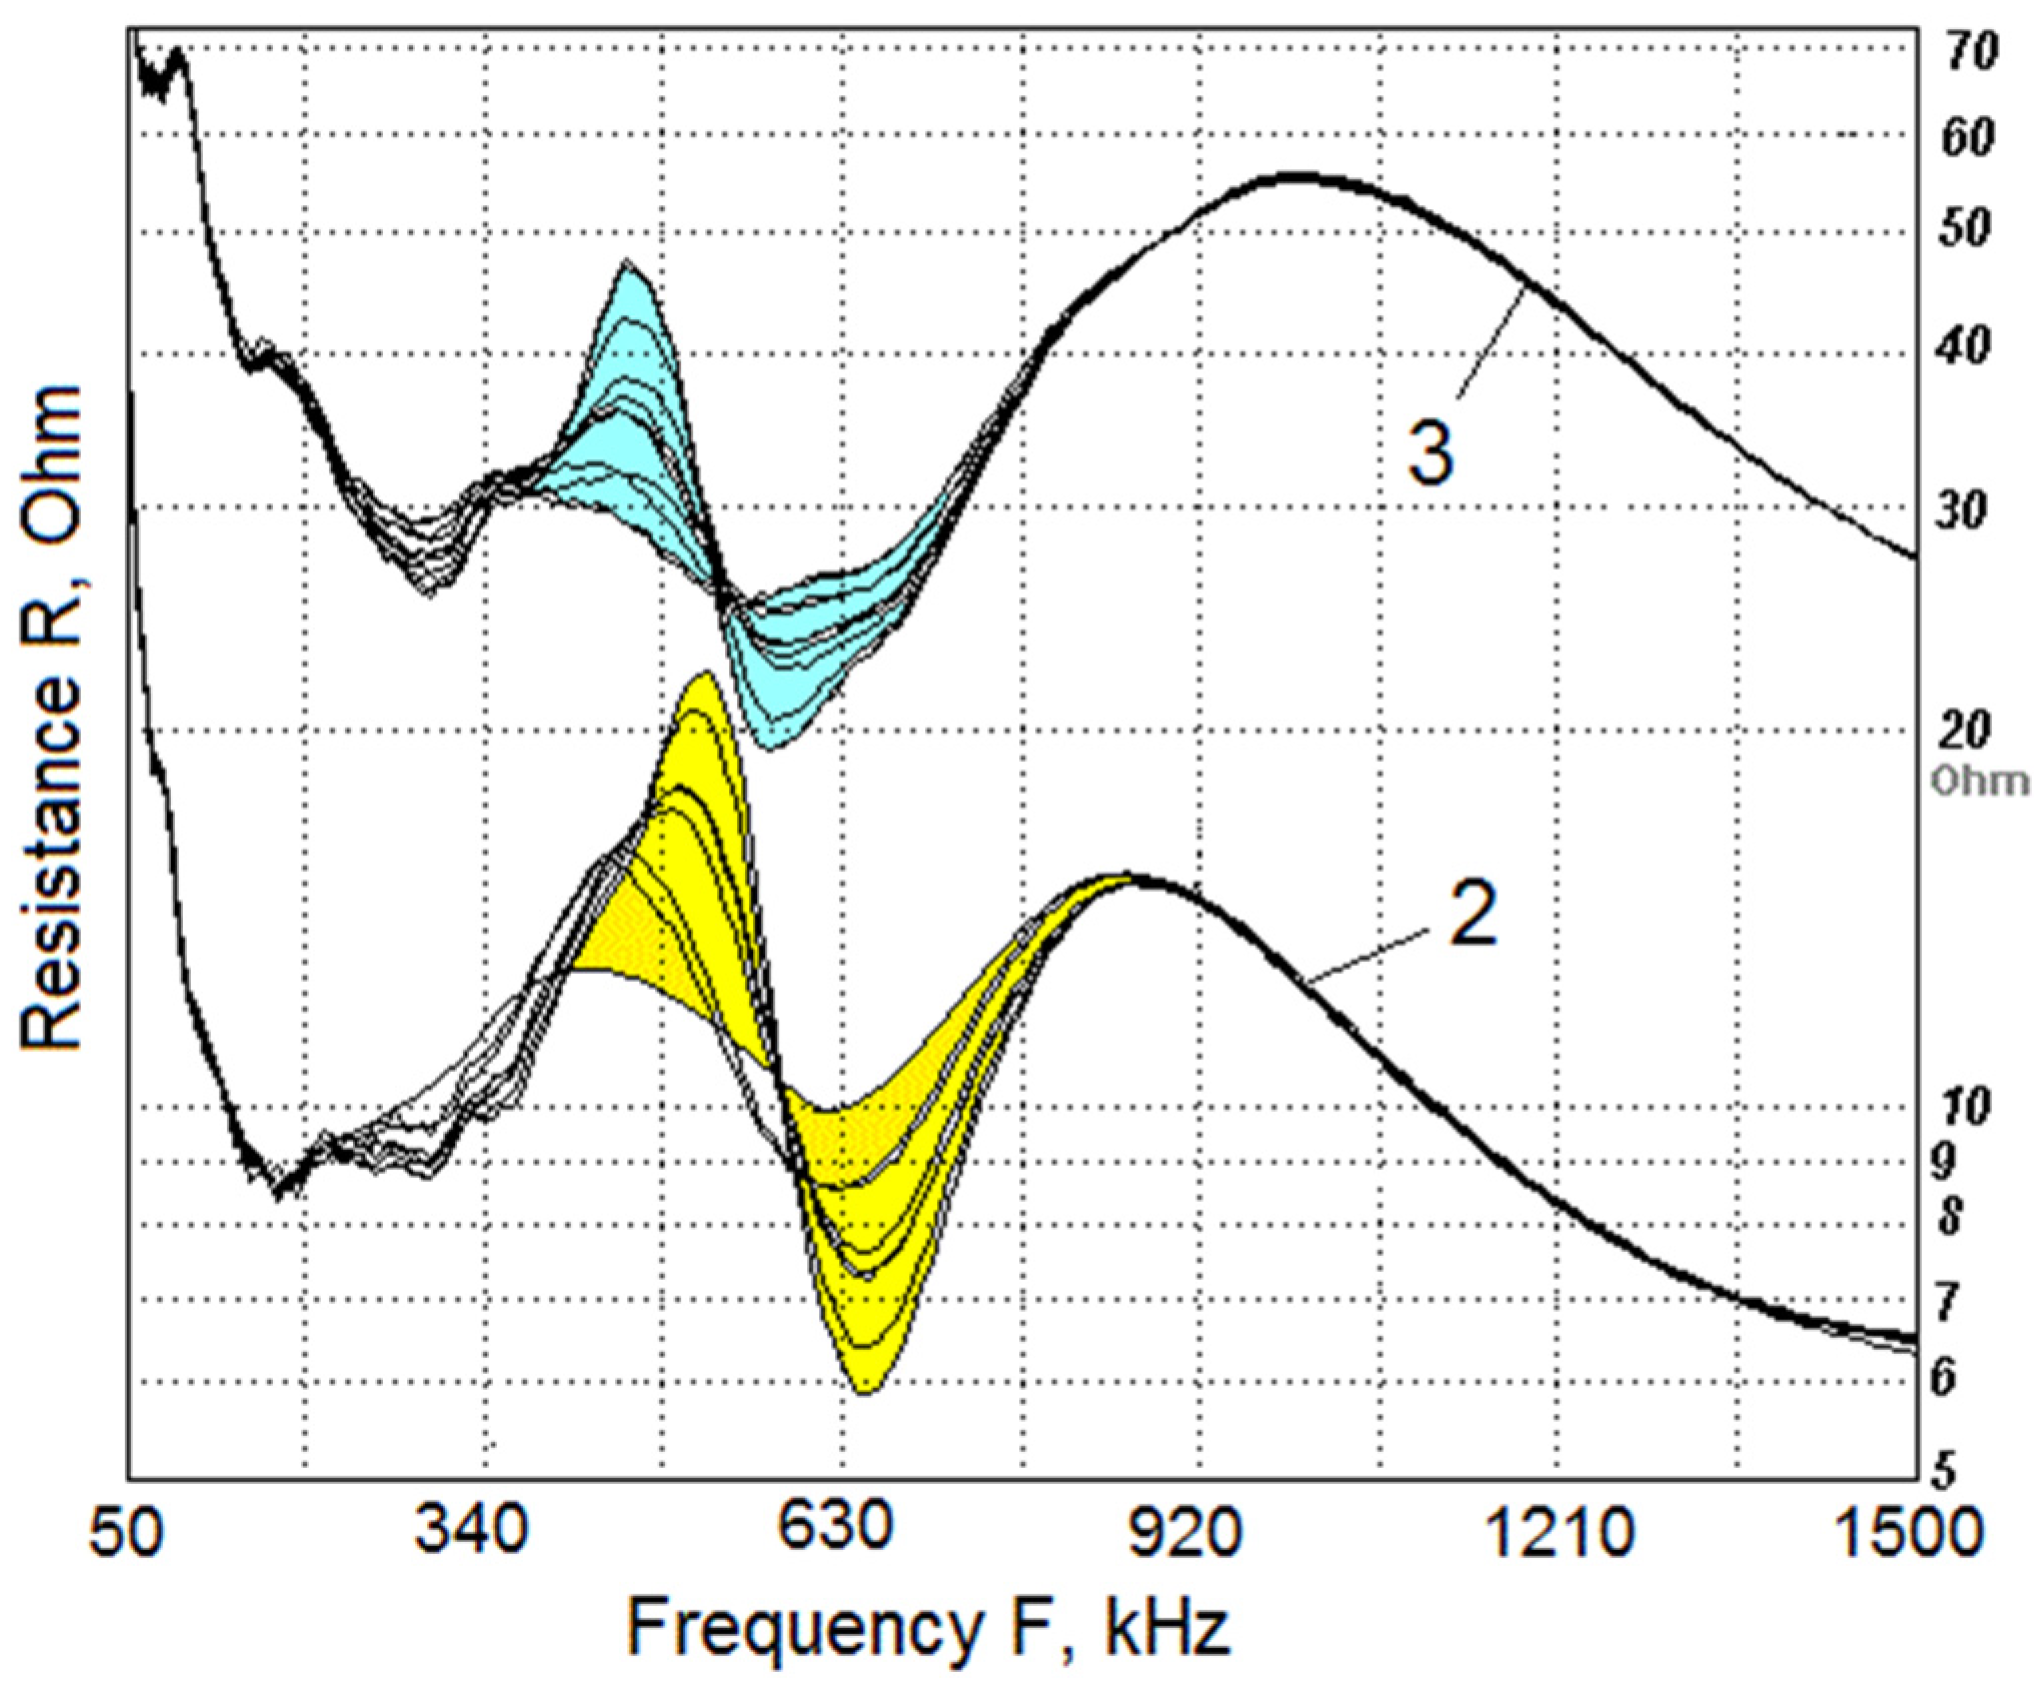
3.1. Impedance Characteristics
3.2. Backing SAW Resonance Mode Strength in 1-3 Piezocomposite Transceiver
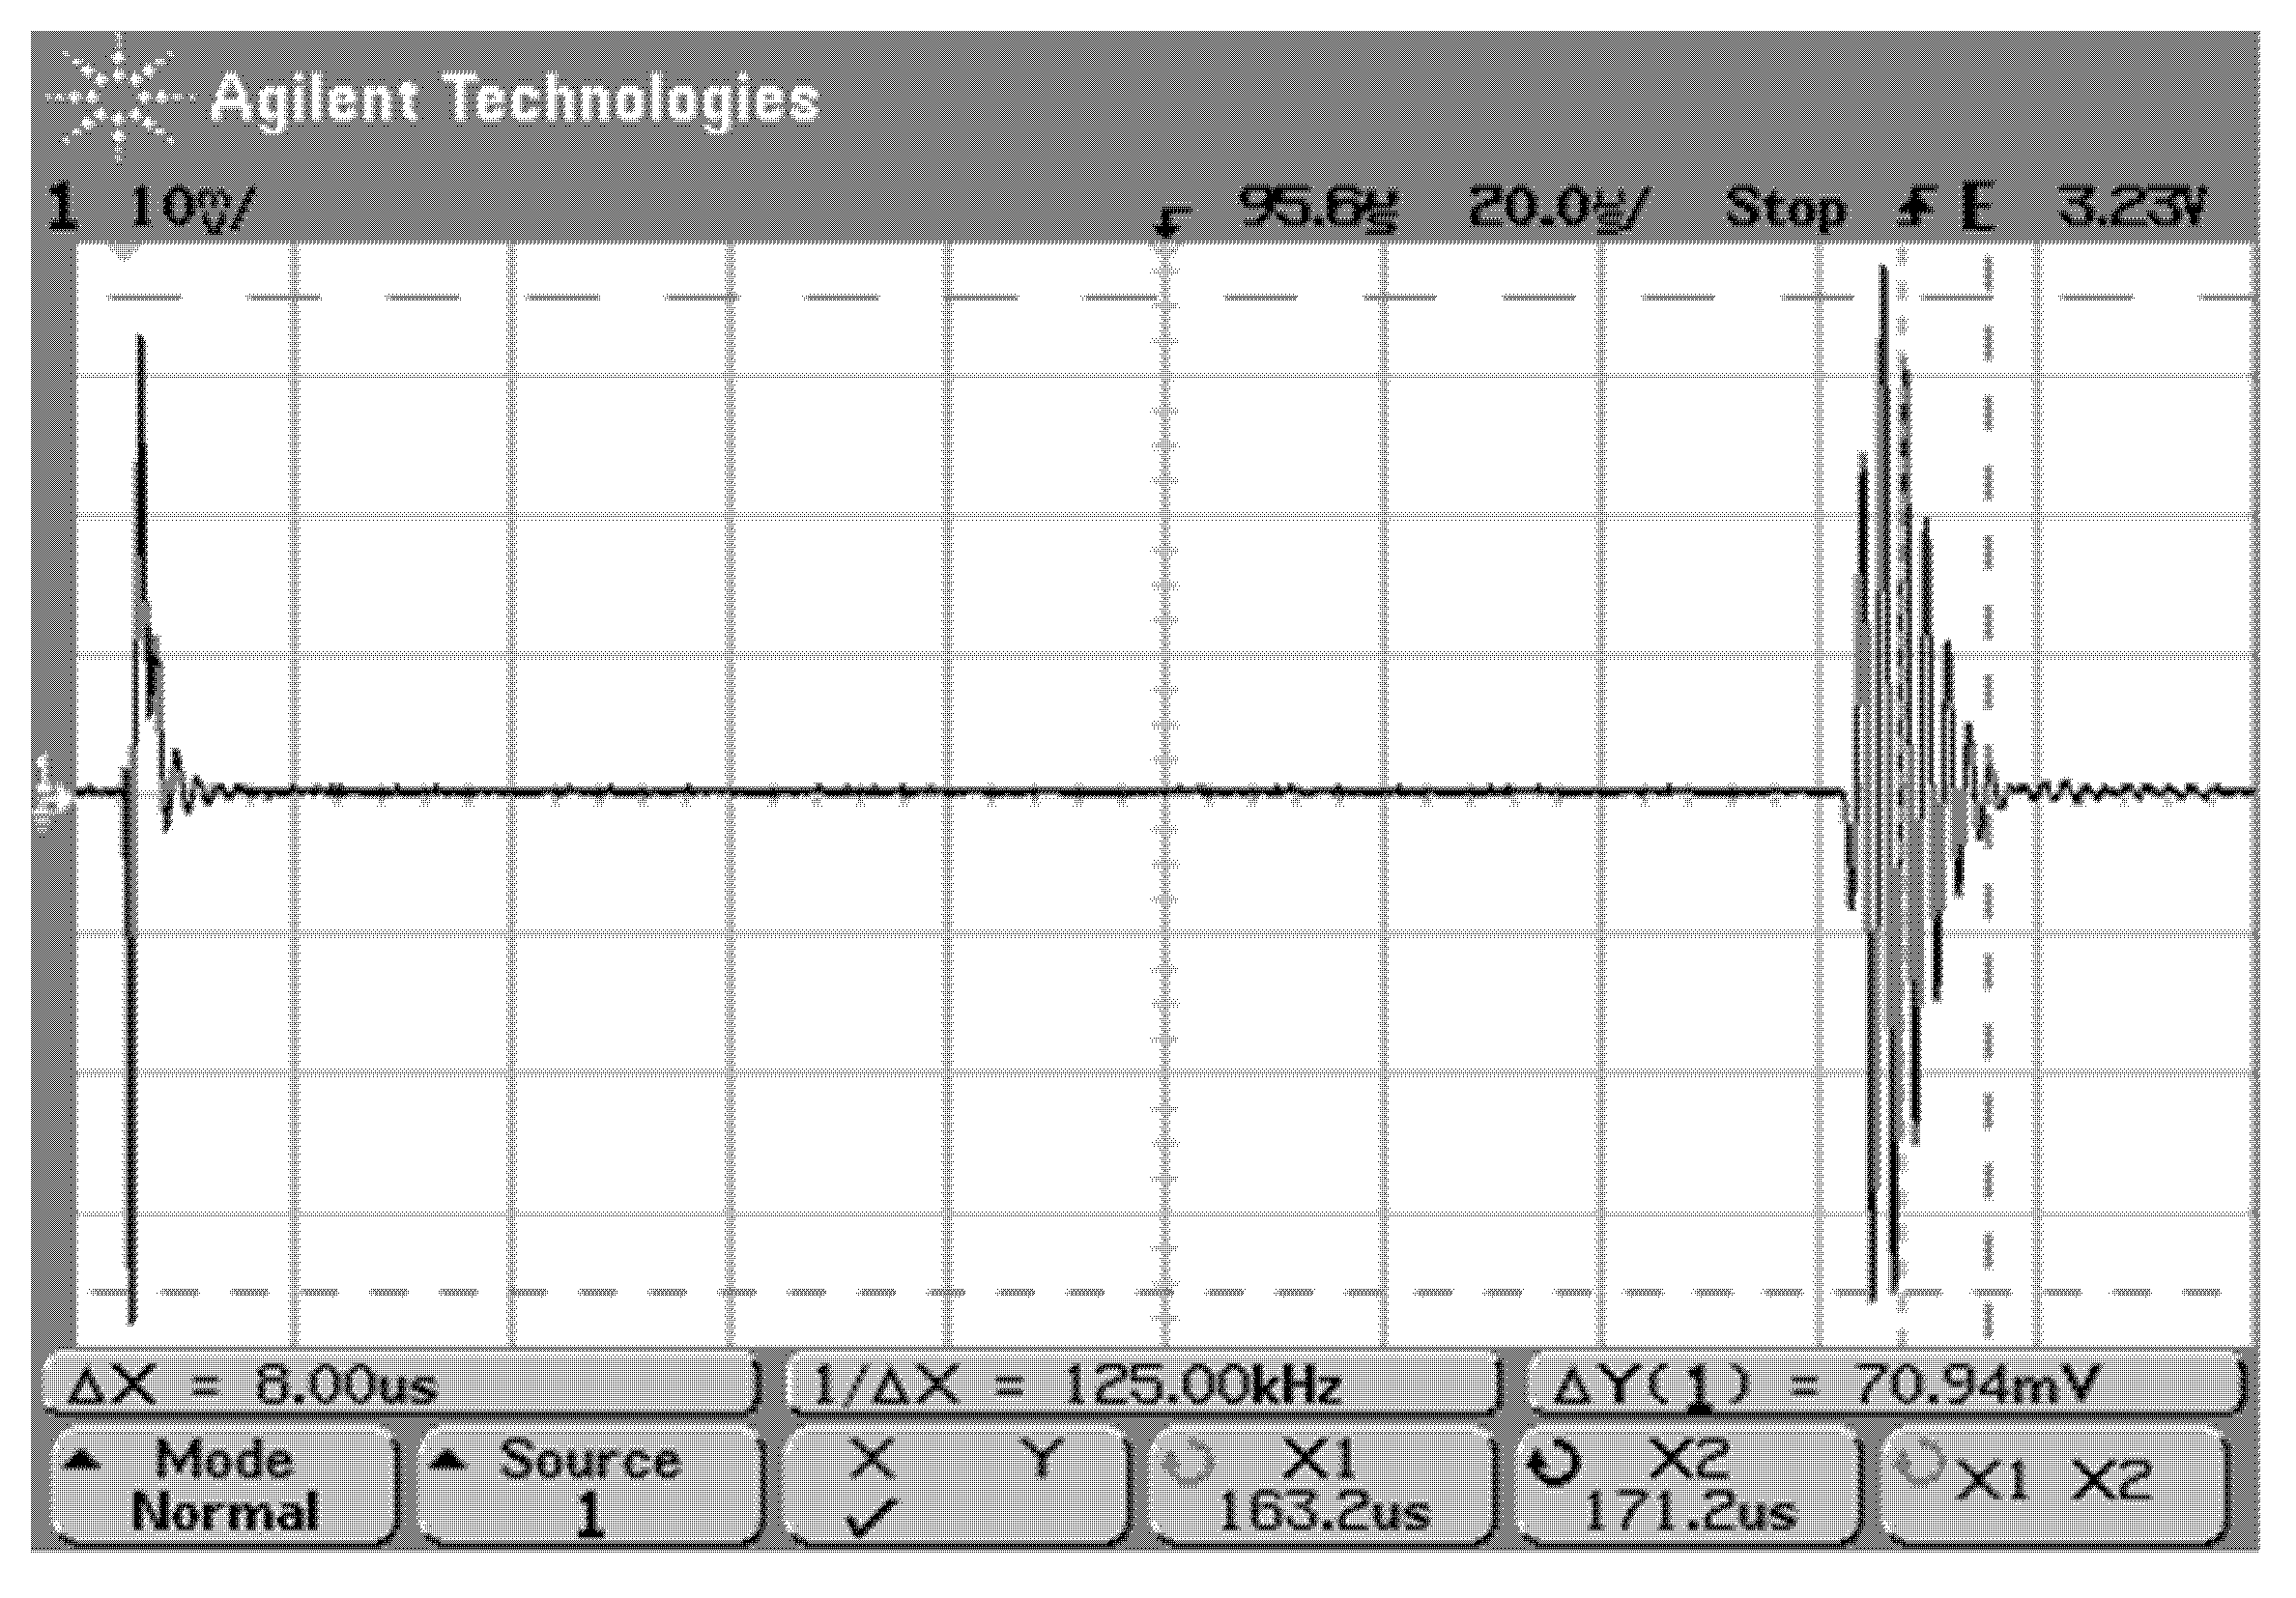
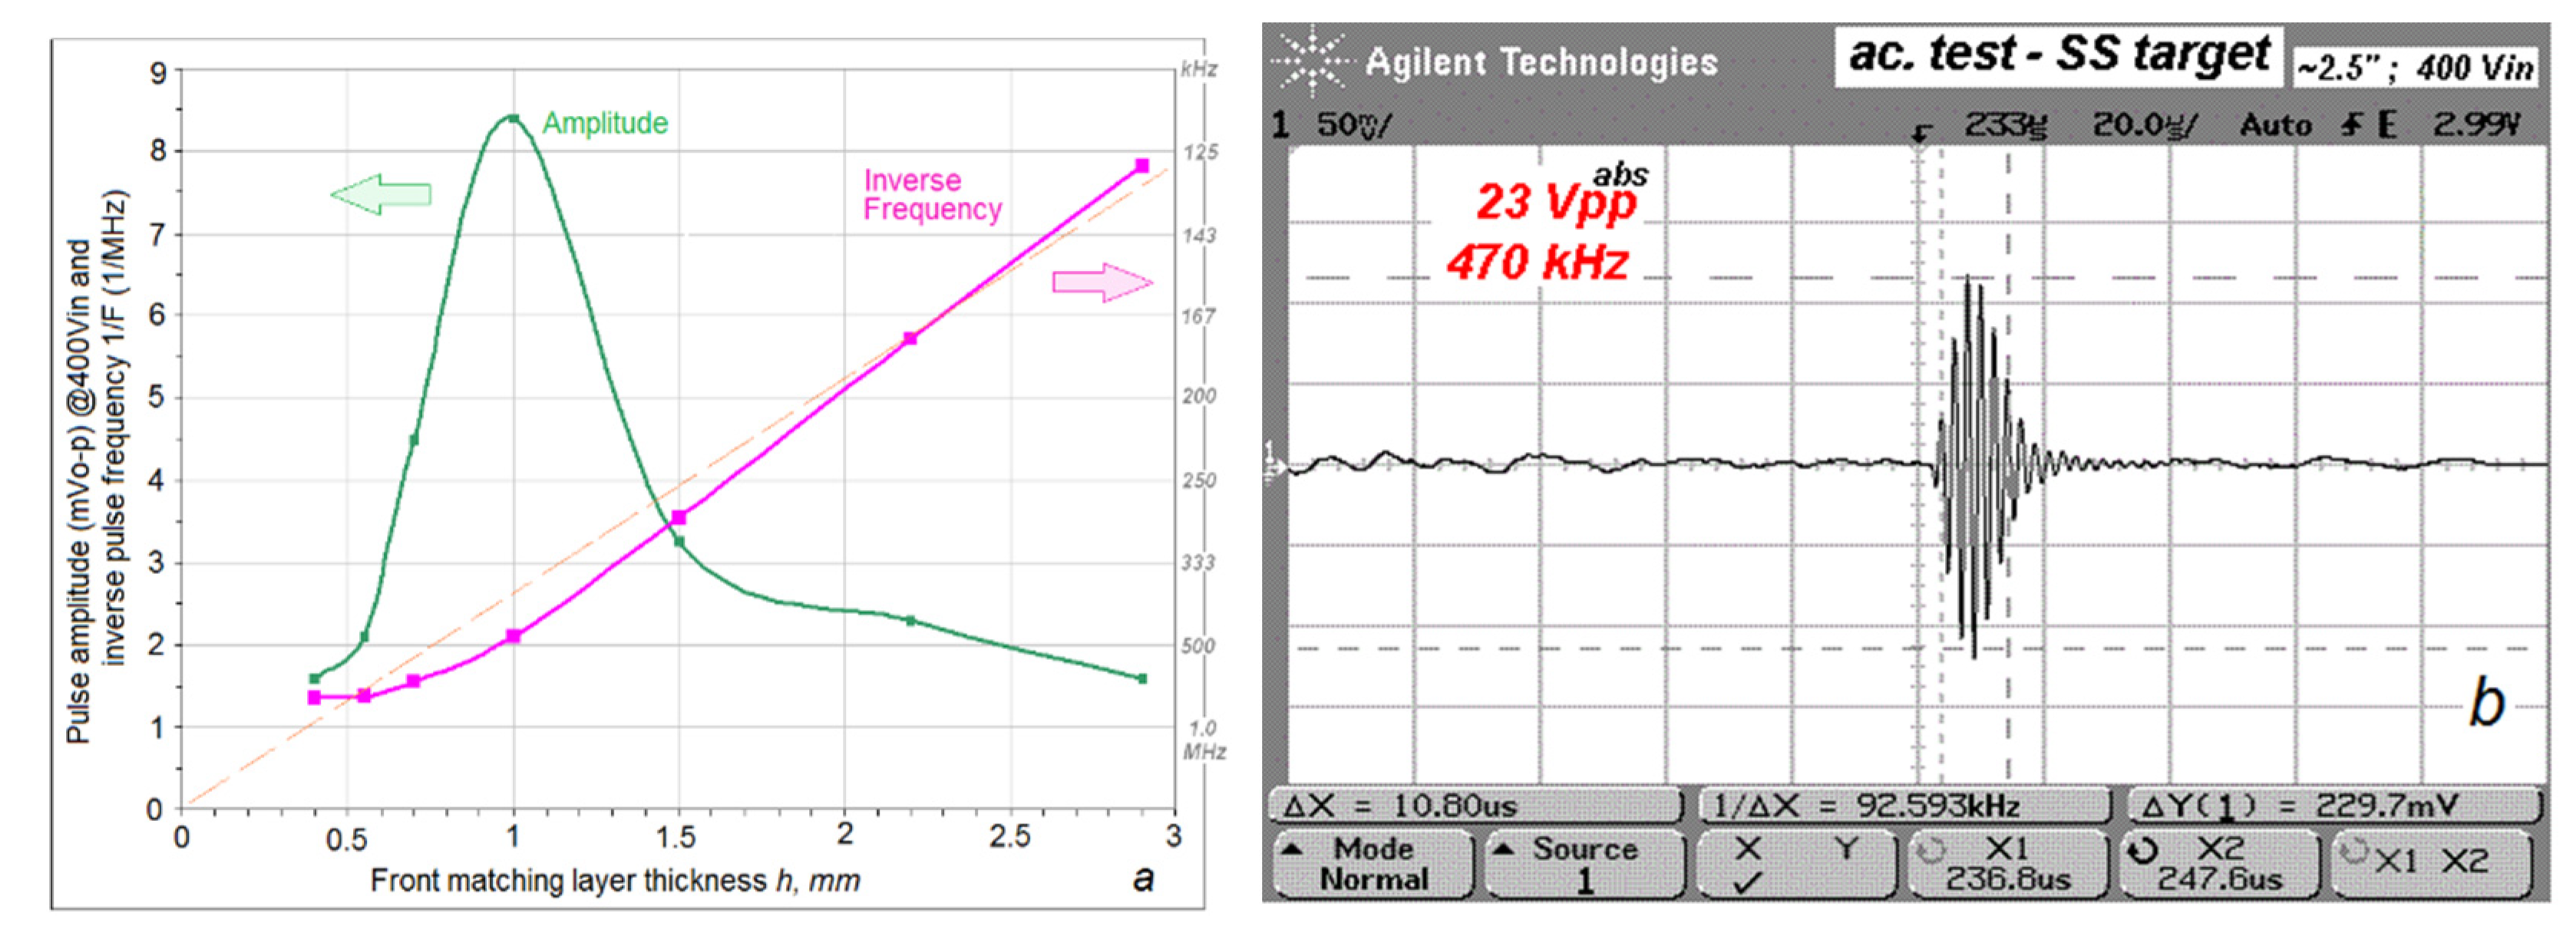
3.3. Pulse-Echo Characteristics of 1-3 Piezocomposite Transceiver in Air operating at the SAW Mode on the Backing Boundary
4. Discussion
5. Conclusions
Author Contributions
Funding
Conflicts of Interest
Nomenclature
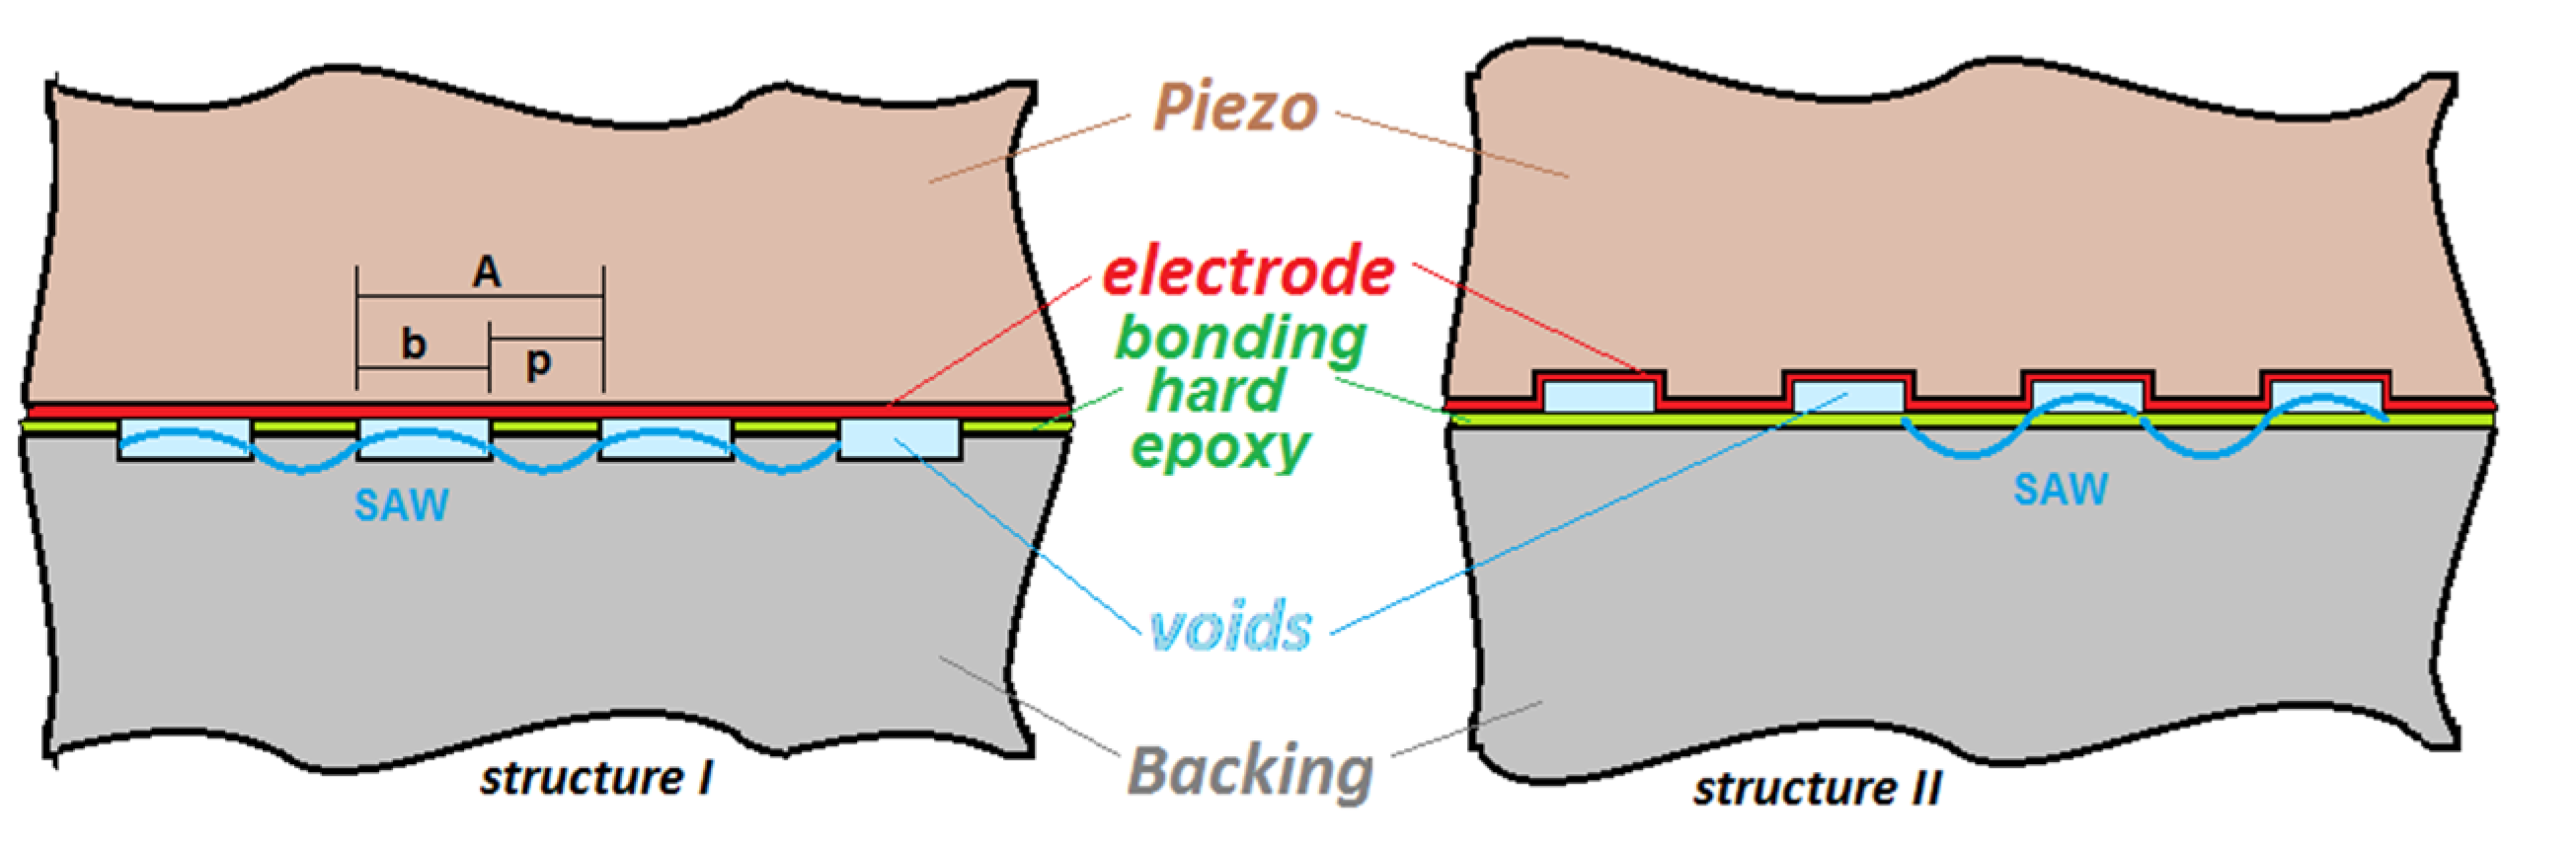
| pillar | piezoceramic rod (with length L and width p) in piezocomposite structure, with its length-to-width aspect ratio (L/p); |
| kerf | cut/dicing width (b), particularly for an orthogonal (square) array filled with epoxy; |
| pitch (kerf plus pillar width A ≡ b + p) | a shift between piezocomposite cuts, or structural periodicity; |
| CW | continuous wave; |
| SAW | surface acoustic wave; |
| BAW | bulk acoustic wave; |
| BW | frequency bandwidth; |
| PE | piezoelement; |
| SOS | speed of sound; |
| SPL | sound pressure level; |
| SS | metal stainless steel reflecting target in acoustic test; |
| IDT | interdigital transducer; |
| F | current frequency; |
| R | electrical resistance R = ReZ component of impedance Z; |
| saw1-Y and saw1-D | fundamental (lowest) SAW resonance determined from the piezocomposite electrical admittance (Y = 1/Z) and from the piezo-rod top displacement (D); |
| N | SAW harmonic order 1,2,3…; |
| L1-Y and L1-D | fundamental (lowest) longitudinal resonance of the piezo-rod in piezocomposite; |
| FsawN-Y and FsawN-D | SAW resonance harmonics (N = 1,2,3…) determined from the piezocomposite electrical admittance (Y = 1/Z) and from the piezo-rod top displacement (D); |
| λ | wave-length, used for SAW, matching layer, and piezorod longitudinal resonances; |
| FL | fundamental λ/2 rod resonance frequency; |
| nm | matching layer vibrational mode of the nm = 1,3,5… order; |
| Zac, Z0, ZR, Zm, Z | acoustical impedance, particularly of piezoelectric material, loading fluid, front matching, and backing layers, respectively; |
| c, cb, csaw, cL | speed of sound (SOS), particularly bulk and SAW on backing, and longitudinal SOS in piezo-rod; |
| density, particularly backing and piezoceramic density; | |
| E, σ, Q | Young module, Poisson coefficient, and material quality factor; |
| M, m | mass in the vibrational models. |
References
- Lee, H.J.; Zhang, S. Design of low-loss 1-3 piezoelectric composites for high-power transducer applications. IEEE Trans. Ultrason. Ferroelectr. Freq. Control. 2012, 59, 1969–1975. [Google Scholar] [PubMed]
- Smith, W.; Auld, B. Modeling 1-3 composite piezoelectrics: Thickness-mode oscillations. IEEE Trans. Ultrason. Ferroelectr. Freq. Control. 1991, 38, 40–47. [Google Scholar] [CrossRef] [PubMed]
- CeramTec GmbH. Piezo Ceramic Components. Materials; CeramTec GmbH: Ebersbach, Germany, 2019; Available online: https://www.ceramtec.com/ceramic-materials/soft-pzt/ (accessed on 16 February 2020).
- Hayward, G.; Gachagan, A. An evaluation of 1-3 connectivity composite transducers for air-coupled ultrasonic applications. J. Acoust. Soc. Am. 1996, 99, 2148–2157. [Google Scholar] [CrossRef]
- Mezheritsky, A.V. Invariants of coupling coefficients in piezoceramics. IEEE Trans. Ultrason. Ferroelectr. Freq. Control. 2003, 50, 1742–1751. [Google Scholar] [CrossRef] [PubMed]
- Toda, M. New type of matching layer for air-coupled ultrasonic transducer. IEEE Trans. Ultrason. Ferroelectr. Freq. Control. 2002, 49, 972–976. [Google Scholar] [CrossRef] [PubMed]
- Certon, D.; Casula, O.; Patat, F.; Royer, D. Theoretical and experimental investigations of lateral modes in 1-3 piezocomposites. IEEE Trans. Ultrason. Ferroelectr. Freq. Control. 1997, 44, 643–651. [Google Scholar] [CrossRef]
- Gururaja, T.; Schulze, W.; Cross, L.; Newnham, R.; Auld, B.; Wang, Y. Piezoelectric Composite Materials for Ultrasonic Transducer Applications. Part I: Resonant Modes of Vibration of PZT Rod-Polymer Composites. IEEE Trans. Sonics Ultrason. 1985, 32, 481–498. [Google Scholar] [CrossRef]
- Robertson, D.; Hayward, G.; Gachagan, A.; Murray, V. Comparison of the frequency and physical nature of the lowest order parasitic mode in single crystal and ceramic 2-2 and 1-3 piezoelectric composite transducers. IEEE Trans. Ultrason. Ferroelectr. Freq. Control. 2006, 53, 1503–1512. [Google Scholar] [CrossRef] [PubMed]
- Certon, D.; Patat, F.; Casula, O.; Tran Hu Hue, L.P. Two dimensional modeling of lateral modes in 1-3 piezocomposites. In Proceedings of the IEEE Ultrasonics Symposium, Cannes, France, 31 October–3 November 1994; pp. 991–994. [Google Scholar]
- Rouffaud, R.; Hladky-Hennion, A.-C.; Pham-Thi, M.; Bantignies, C.; Levassort, F. Influence of 1-3 piezocomposite fabrications on lateral modes. In Proceedings of the 2012 IEEE International Ultrasonics Symposium, Dresden, Germany, 7–10 October 2012; pp. 1–4. [Google Scholar]
- Smart Materials. 1-3 Random Fiber Piezocomposites; Smart Materials: Sarasota, FL, USA, 2019; Available online: https://www.smart-material.com/13Crand-product-main.html (accessed on 16 February 2020).
- Qi, W.; Cao, W. Finite element analysis of periodic and random 2-2 piezocomposite transducers with finite dimensions. IEEE Trans. Ultrason. Ferroelectr. Freq. Control. 1997, 44, 1168–1171. [Google Scholar]
- Ruddle, J.; Cass, R.; Mohammadi, F. Advanced cerametrics harvests clean energy. Am. Ceram. Soc. Bull. 2007, 86, 24–27. [Google Scholar]
- Mezheritsky, A.V. A method of “weak resonance” for piezoelectrics quality factor and coupling coefficient measurements. IEEE Trans. Ultrason. Ferroelectr. Freq. Control. 2005, 52, 2120–2130. [Google Scholar] [CrossRef] [PubMed]
- Ramakrisnan, N.; Nemade, H.B.; Palathinkal, R.P. Resonant frequency characteristics of a SAW device attached to resonating micropillars. Sensors 2012, 12, 3789–3797. [Google Scholar] [CrossRef] [PubMed]
- Pomorska, A.; Schukin, D.; Hammond, R.; Cooper, M.A.; Grundmeier, G.; Johannsmann, D. Positive frequency shift observed upon absorbing icro-sized solid objects to a quartz crystal microbalance from the liquid phase. Anal. Chem. 2010, 82, 2237–2242. [Google Scholar] [CrossRef] [PubMed]
- Alhazmi, H.; Guldiken, R. Quantification of Bolt Tension by Surface Acoustic Waves: An Experimentally Verified Simulation Study. Acoustics 2019, 1, 794–807. [Google Scholar] [CrossRef]
- Plessky, V.; Koskela, J. Coupling-of-modes analysis of SAW devices. Int. J. High Speed Electron. Syst. 2000, 10, 867–947. [Google Scholar] [CrossRef]
- Quality Material Inspection (QMI), Inc. Huntington Beach, CA, USA, 2019. Available online: https://www.qmi-inc.com/airscan.php (accessed on 16 February 2020).


| # | L, mm | p, µm | b, µm | p + b, mm | L/p | L/p + b | p2/(p + b)2 | F, kHz |
|---|---|---|---|---|---|---|---|---|
| 1 | 0.76 | 120 | 80 | 0.20 | 6.3 | 3.8 | 0.36 | ~500 kHz |
| 2 | 0.63 | 180 | 80 | 0.26 | 3.5 | 2.4 | 0.48 | ~500 kHz |
| 3 | 0.88 | 540 | 160 | 0.70 | 1.6 | 1.3 | 0.60 | ~500 kHz |
| D1/D2 | 2.7/5.0 | 1000 | 400 | 1.40 | 2.7/5.0 | 2…3 | 0.51 | ~150 kHz |
| E, GPa | ρ, kg/m3 | c, m/s | Zac, MRayl | σ | 1/Q | |
|---|---|---|---|---|---|---|
| Piezoceramic | 122 | 7800 | 3960 (rod) | 30 | 0.35 | 1/100 |
| Epoxy in composite | 8.1 | 1200 | 2600 (rod) | 3 | ~0.40 | 1/10 |
| Matching (glass bubbles and epoxy) | 2.4 | 390 | 2500 (plate) | 0.9 | ~0.40 | 1/5 |
| Backing (W powder and epoxy) | 22 | 13,000 | 1300 (600 SAW) | 17 | ~0.35 | 1/6 |
| Air | 0.00015 | 1.25 | 350 | 0.00045 | - | - |
© 2020 by the author. Licensee MDPI, Basel, Switzerland. This article is an open access article distributed under the terms and conditions of the Creative Commons Attribution (CC BY) license (http://creativecommons.org/licenses/by/4.0/).
Share and Cite
Mezheritsky, A. Ultrasonic Transceiver with a Regular/Periodic 1-3 Piezocomposite Based on the SAW Resonance Mode on Damping Backing. Acoustics 2020, 2, 110-127. https://doi.org/10.3390/acoustics2010008
Mezheritsky A. Ultrasonic Transceiver with a Regular/Periodic 1-3 Piezocomposite Based on the SAW Resonance Mode on Damping Backing. Acoustics. 2020; 2(1):110-127. https://doi.org/10.3390/acoustics2010008
Chicago/Turabian StyleMezheritsky, Alex. 2020. "Ultrasonic Transceiver with a Regular/Periodic 1-3 Piezocomposite Based on the SAW Resonance Mode on Damping Backing" Acoustics 2, no. 1: 110-127. https://doi.org/10.3390/acoustics2010008
APA StyleMezheritsky, A. (2020). Ultrasonic Transceiver with a Regular/Periodic 1-3 Piezocomposite Based on the SAW Resonance Mode on Damping Backing. Acoustics, 2(1), 110-127. https://doi.org/10.3390/acoustics2010008