
Visionary Nature-Based Solutions Evaluated through Social Return on Investment: The Case Study of an Italian Urban Green Space

Abstract
:1. Introduction
1.1. Positive Effects Provided by UGSs
1.2. Communicating Co-Benefits and the Role of Stakeholders
1.3. Importance of Assessing UGS Interventions: Synergies between NBSs and DSs
1.4. Aim and Scope
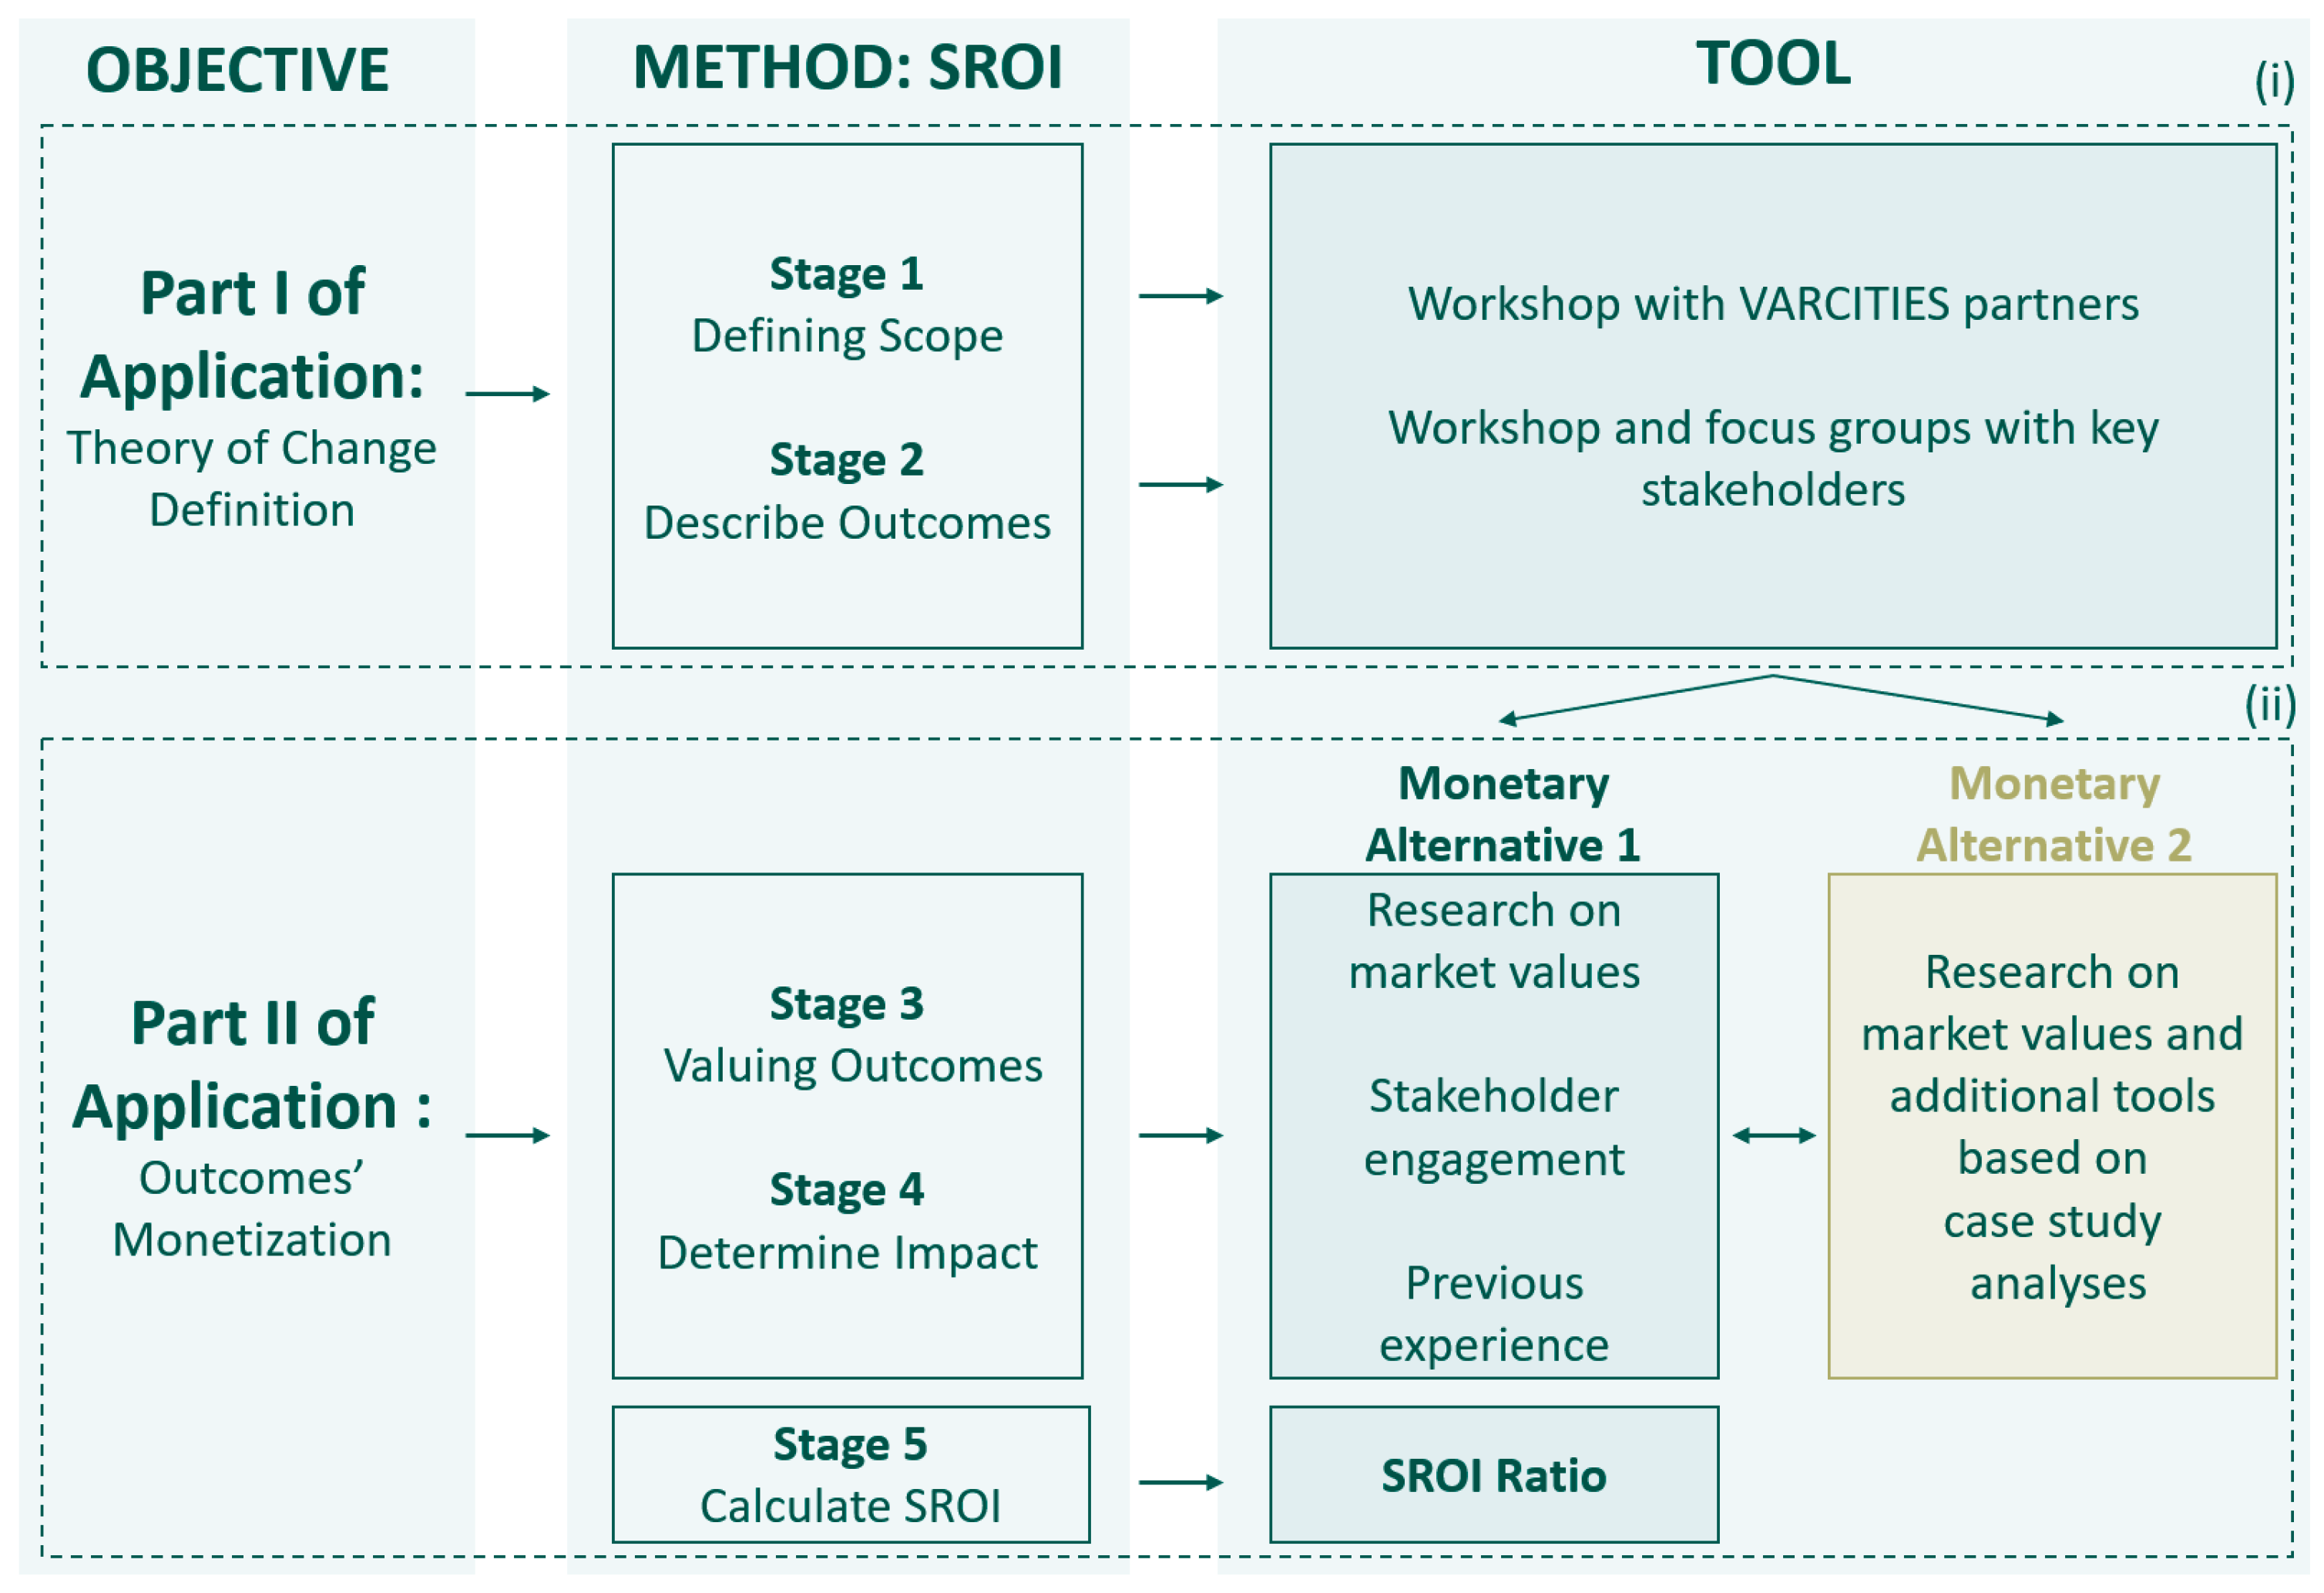
2. Materials and Methods
2.1. Methodology
2.1.1. SROI in UGS Applications
2.1.2. CBA and SROI: Cross Comparison
2.1.3. Methodological Steps
- (i)
- “Part I of Application”, in which the intervention’s ToC is determined by engaging with local stakeholders and project partners.
- (ii)
- “Part II of Application”, which foresees the development of an improved SROI method within the monetization phase, i.e., Monetary Alternative 2, compared to the first solution developed, Monetary Alternative 1. A comparison between the two monetary alternatives in “Part II of Application” is performed, and it will be discussed in the Section 3, to determine which of the two is more suitable to lead decision-making processes. Additionally, the analyzed case studies provide ranges of values associated with some of the VARCITIES outcomes.
2.1.4. The Case Study
2.2. SROI Application for Visionary Nature Based Solutions
2.2.1. Part I of the Application—Theories of Change definition
2.2.2. Part II of the Application—Outcomes’ Monetization
3. Results
3.1. Part I of Application—Theories of Change
3.1.1. Focus Group 1—Non-Fragile Visitors
3.1.2. Focus Group 2—Fragile Visitors
3.1.3. Focus Group 3—Caregivers
3.2. Part II of Application—Outcomes’ Monetization
3.2.1. Monetary Alternative 1
3.2.2. Monetary Alternative 2
4. Discussion
- The monetary values can significantly vary based on the proxy chosen, whilst the relevance of the body of knowledge gained from the engagement with stakeholders stays unchanged.
- The financial proxies assigned can guide decision-making by identifying the outcomes linked to a higher social value, without overlooking stakeholders’ perceptions.
- Monetary value is not the main focus of the SROI; nonetheless, having more precise financial proxies can empower the decision-making process based on the performed analysis and increase credibility.
- While, in Monetary Alternative 1, the values are similar to each other, as they express a weighted value rather than a market price or direct stakeholders’ willingness to pay, and the impact depends mostly on the number of people that will experience each outcome and on the discount factors, Monetary Alternative 2 gives better guidance on where to direct investments, since it counts as independent variables not only the stakeholders’ rankings, the qualitative information obtained, and the discount factors, but also the monetary worth. Therefore, Monetary Alternative 2 gives a more credible basis for the prioritization of one outcome compared to another.
5. Conclusions
Supplementary Materials
Author Contributions
Funding
Data Availability Statement
Acknowledgments
Conflicts of Interest
Abbreviations
| BAU | Business as Usual |
| CBA | Cost Benefit Analysis |
| DS | Digital Solutions |
| ENPV | Economic Net Present Value |
| ERR | Economic Return Rate |
| ES | Ecosystem Services |
| ESA | Ecosystem Services Analysis |
| HACT | Housing Associations’ Charitable Trust |
| HEAT | Health Assessment Tool |
| ICT | Information and Communication Technology |
| IoT | Internet of Things |
| KPI | Key Performance Indicator |
| MCDA | Multi-Criteria Decision Analysis |
| NBS | Nature Based Solutions |
| NPV | Net Present Value |
| ROI | Return on Investment |
| SDR | Social Discount |
| SROI | Social Return on Investment |
| STK | Stakeholders |
| SuROI | Sustainable Return on Investment |
| ToC | Theory of Change |
| UGS | Urban Green Spaces |
| VS | Visionary Nature Based Solutions |
| WHO | World Health Organization |
| WTP | Willingness to Pay |
Appendix A
- All values have been transformed in the same currency, i.e., “£”
- Values referred to different durations of the activities and therefore of the benefits, thus it was decided to consider weekly values, as the outcome indicator is the number of visitors, without information on the recurrence of the visits of the same stakeholders. Only in the outcome related to an increase in physical activity an annual value was used.
- In all cases where the benefits were expressed annually, the values were transformed into a weekly value, dividing the proxies by the number of weeks in a year simplified into four per month, therefore 48 weeks. Vice versa, in case values were expressed in weekly terms, they were multiplied by 48. The proxies that described a single session of an activity were considered as weekly values.

Appendix B
| Case 2 | Case 6 | Case 4 | Case 5 | Case 3 | |
|---|---|---|---|---|---|
| Outcome | Walkers have more social contacts and are now more confident, experience less isolation and take part in new experiences | The project increased candidates’ ability and confidence to meet new people |
Improved
interpersonal relationships | Feeling happier as a result of increased opportunities, meeting new people, establishing new friendships and social connections | Walkers have more social contacts and are now more confident, experience less isolation and take part in new experiences |
| Output | 18 walking groups—35 walking sessions a year | min 20 h outside—4 challenges to accomplish in discovering a natural site | mobile walking application | 30 walking sessions provided each year | 30 sessions of walking groups a year |
| Outcome Indicator | No of walkers reporting additional social contacts | Number of new opportunities for socializing and meeting people | No of people experiencing more walks with family and friends | No of walkers reporting additional social contacts | No of walkers reporting additional social contacts |
| Quantity | 137 persons 90% | 56 times (8 days × 7 candidates) | 1455 persons 10% | 24 persons 75% | 66 persons 26% |
| Financial Proxy | average cost of joining a club/organization in Glasgow | Average weekly spend on social activities (broken down from annual average spend) | Weighted average of budget and activities for achieving same level of outcomes: Scenario A/B/C |
Average cost of various different local
sports and social clubs | cost of a sports social club in Stirling |
| Value (£) | £50.00 | £10.00 | £50.06/56.64/ 106.70 | £5.00 | £320.00 |
| Deadweight | 7% | 10% | 62% | 0% | 7% |
| Deadweight Determination |
|
|
|
|
|
| Attribution | 5% | 25% | 51% | 0% | 10% |
| Attribution Determination |
|
|
|
|
|
Appendix C
| Case 9 | Case 2 | Case 4 | Case 3 | Case 8 | Case 10 | |
|---|---|---|---|---|---|---|
| Outcome | Regular attendance brings mental stimulation, a more positive outlook, and reduced levels of anxiety and depression | Walkers and walk leaders who have experienced mental health problems are able to engage in physical activity and feel happier and positive | Stress relief | Walkers who have experienced mental health problems are able to engage in physical activity and feel happier and positive | Greater propensity in carrying out recreational activities—Isolation Reduction | Emotional wellbeing (LEAF) |
| Output | art classes | 35 walking sessions provided each year | mobile walking application | 30 walking sessions provided each year | caregiving assistance | caregiving assistance |
| Outcome Indicator | No. reporting feeling less down, depressed, or hopeless; No. reporting improved concentration; No. reporting reduced use of anti-depressants. | “No. of walkers with clinically diagnosed mental health problems who have an increased sense of wellbeing” | No of people stating that walking makes them feel less worried and stressed, while feeling more energetic and that The Cathay Walker campaign relieves work stress | No. of walkers with clinically diagnosed mental health problems who have an increased sense of wellbeing | No of persons who experience the change | No of persons who experience the change |
| Quantity | 68 persons 98% | 60 persons 39% | 5527 persons 39% | 16 persons 6% | 1.196 persons 100% | 110 persons 56% |
| Financial Proxy | Weekly stress counselling sessions | 75% increase in average spend on social trips out | Weighted average of budget and activities for achieving same level of out- comes | Increase in spend on social trips and events | value of hours spent on recreational activities and/or participation in social life (monthly) | Value for relief from depression and anxiety (adult) |
| Value (£) | £2080.00 | £43.20 | £4925.00 | £655.20 | £40.00 | £353.00 |
| Deadweight | 17% | 15% | 64% | 7% | 35% | 0% |
| Deadweight Determination |
| STK feedback |
|
| STK feedback | experts’ assumption based on LEAF questionnaires |
| Attribution | 19% | 21% | 50% | 10% | 20% | 50% |
| Attribution Determination |
| STK feedback—consultation |
|
|
|
|
Appendix D
| Case 2 | Case 6 | Case 4 | Case 5 | Case 3 | |
|---|---|---|---|---|---|
| Outcome | Walkers have more social contacts and are now more confident, experience less isolation and take part in new experiences | The project increased candidates’ ability and confidence to meet new people | Improved interpersonal relationships | Feeling happier as a result of increased opportunities, meeting new people, establishing new friendships and social connections | Walkers have more social contacts and are now more confident, experience less isolation and take part in new experiences |
| Output | 18 walking groups—35 walking sessions a year | min 20 h outside—4 challenges to accomplish in discovering a natural site | mobile walking application | 30 walking sessions provided each year | 30 sessions of walking groups a year |
| Outcome Indicator | No of walkers reporting additional social contacts | Number of new opportunities for socializing and meeting people | No of people experiencing more walks with family and friends | No of walkers reporting additional social contacts | No of walkers reporting additional social contacts |
| Quantity | 137 persons 90% | 56 times (8 days × 7 candidates) | 1455 persons 10% | 24 persons 75% | 66 persons 26% |
| Financial Proxy | average cost of joining a club/ organization in Glasgow | Average weekly spend on social activities (broken down from annual average spend) | Weighted average of budget and activities for achieving same level of out- comes (annual values) Scenario A/B/C | Average cost of various different local sports and social clubs | cost of a sports social club in Stirling |
| Value (£) | £50.00 | £10.00 | £50.06/56.64/ 106.70 | £5.00 | £320.00 |
| Deadweight | 7% | 10% | 62% | 0% | 7% |
| Deadweight Determination |
|
|
|
|
|
| Attribution | 5% | 25% | 51% | 0% | 10% |
| Attribution Determination |
|
|
|
|
|
Appendix E
| Case 6 | Case 3 | Case 4 | Case 3 | Case 1 | Case 5 | |
|---|---|---|---|---|---|---|
| Outcome | Candidates are more physically active due to use of the outdoors for recreation | Walkers with diagnosed physical medical conditions are able to engage in physical activity and as a result feel fitter and become healthier | Better physical health | Walkers are fitter and have improved physical health as a result of becoming more regularly physically active | Health improving | Maintaining or not eroding current physical health and fitness levels |
| Output | min 20 h outside—4 challenges to accomplish in discovering a natural site | 30 walking sessions provided each year | mobile walking application | 30 walking sessions provided each year | The construction of a greenway | 30 walking sessions provided each year |
| Outcome Indicator | “Number of hours candidates report they are more physically active” | No. of walkers reporting clinical improvements in their medical condition | “Helps get into habit of exercise/walking. Feel more energetic and less fatigued. Better cardiovascular function Lose weight Lowered BMI” | No. of walkers who report improved levels of physical fitness | Percentage of inactive population at baseline that begins making physical activity | Number of participants reporting an Increase in fitness levels |
| Quantity | 7 persons 100% | 16 persons 6% | 5850 persons 42% | 99 persons 40% | hypothesis: 5%—60 persons | 32 persons 100% |
| Financial Proxy | Equivalent of paying to attend a gym | 20% reduction on spend on health per year | Weighted average of budget and activities for achieving same level of outcomes (weekly value) | Cost of a swimming session | Multiplying the total number of deaths each year, for each disease by the value of a statistical life | Cost of a swimming session as a form of low impact physical activity |
| Value (£) | £5.73 | £67.60 | £413.28 | £120.00 | £11,562.73 | £2.33 |
| Deadweight | 0% | 7% | 64% | 7% | 0% | 15% |
| Deadweight Determination |
|
|
|
|
|
|
| Attribution | 25% | 10% | 49% | 10% | 0% | 0% |
| Attribution Determination |
|
|
|
|
|
|
Appendix F
| Case 9 | Case 11 | Case 7 | |
|---|---|---|---|
| Outcome | Family members worry less about their loved one | Carers experience a reduction in stress and burden of care | Reduction of stress and anxiety |
| Output | art classes | group activities, and games | transportation service to hospital patients |
| Outcome Indicator | No. of instances of worry or concern for the older person in an average week; No. reporting a more positive outlook about the older person’s prospects. | Proportion of carers reporting decrease in stress over worrying about their relative wellbeing. | percentage of persons who declared this outcome happened |
| Quantity | 64 persons 89% | 10 persons 100% | 88% |
| Financial Proxy | Stress counselling sessions | Average cost of mental health services per individual per year (anxiety and depression). | Cost of a cycle of individual stress management sessions |
| Value (£) | £480.00 | £1122.47 | £735 |
| Deadweight | 5% | 66% | 45% |
| Deadweight Determination |
|
|
|
| Attribution | 0% | 50% | 20% |
| Attribution Determination |
|
|
|
References
- United Nations, Department of Economic and Social Affairs. World Urbanization Prospects: 2018: Highlights (ST/ESA/SER.A/421); United Nations: New York, NY, USA, 2019; ISBN 978-92-1-148318-5. [Google Scholar]
- Kotzeva, M.M.; Brandmüller, T. Urban Europe: Statistics on Cities, Towns and Suburbs; Kotzeva, M.M., Ed.; Publications office of the European Union: Luxembourg, 2016; p. 282. ISBN 978-92-79-60139-2. [Google Scholar]
- Secretariat of the Convention on Biological Diversity. Global Biodiversity Outlook 5; Hirsch, T., Mooney, K., Cooper, D., Eds.; Secretariat of the Convention on Biological Diversity: Montreal, QC, Canada, 2020; ISBN 978-92-9225-688-3.
- Mahmoud, I.; Morello, E.; Bisello, A.; Kolokotsa, D. Augmented Nature-Based Solutions: A Possible Taxonomy of Technologies “in” and “for” Urban Greening Strategies. In Smart and Sustainable Planning for Cities and Regions; Bisello, A., Vettorato, D., Bottero, M., Kolokotsa, D., Eds.; Green Energy and Technology; Springer Nature Switzerland: Cham, Switzerland, 2024; pp. 125–139. ISBN 978-3-031-39205-4. [Google Scholar]
- Kolokotsa, D.; Lilli, A.; Tsekeri, E.; Gobakis, K.; Katsiokalis, M.; Mania, A.; Baldacchino, N.; Polychronaki, S.; Buckley, N.; Micallef, D.; et al. The Intersection of the Green and the Smart City: A Data Platform for Health and Well-Being through Nature-Based Solutions. Smart Cities 2023, 7, 1–32. [Google Scholar] [CrossRef]
- Zilio, S.; Borsari, A.; Bisello, A.; Segata, A.; Alonzo, V.D.; Croce, S. D3.4: Report on Multiple Benefits Expected from Visionary Solutions. Available online: https://varcities.eu/resources/deliverables/d3-4-report-on-multiple-benefits-expected-from-visionary-solutions/ (accessed on 20 February 2024).
- Pânzaru, D.M.R.; Iojă, I.-C.; Pleșoianu, A.-I.; Hossu, C.-A.; Diaconu, D.-C. Nature-Based Solutions for Urban Waters in Romanian Cities. Nat.-Based Solut. 2022, 2, 100036. [Google Scholar] [CrossRef]
- Park, J.; Kim, J.H.; Sohn, W.; Lee, D.K. Urban Cooling Factors: Do Small Greenspaces Outperform Building Shade in Mitigating Urban Heat Island Intensity? Urban For. Urban Green. 2021, 64, 127256. [Google Scholar] [CrossRef]
- Zuniga-Teran, A.A.; Gerlak, A.K. A Multidisciplinary Approach to Analyzing Questions of Justice Issues in Urban Greenspace. Sustainability 2019, 11, 3055. [Google Scholar] [CrossRef]
- Alves, A.; Gómez, J.P.; Vojinovic, Z.; Sánchez, A.; Weesakul, S. Combining Co-Benefits and Stakeholders Perceptions into Green Infrastructure Selection for Flood Risk Reduction. Environments 2018, 5, 29. [Google Scholar] [CrossRef]
- Robinson, J.; Breed, M. Green Prescriptions and Their Co-Benefits: Integrative Strategies for Public and Environmental Health. Challenges 2019, 10, 9. [Google Scholar] [CrossRef]
- Schmidt, K.; Walz, A. Ecosystem-Based Adaptation to Climate Change through Residential Urban Green Structures: Co-Benefits to Thermal Comfort, Biodiversity, Carbon Storage and Social Interaction. One Ecosyst. 2021, 6, e65706. [Google Scholar] [CrossRef]
- Wang, R.; Browning, M.H.E.M.; Kee, F.; Hunter, R.F. Exploring Mechanistic Pathways Linking Urban Green and Blue Space to Mental Wellbeing before and after Urban Regeneration of a Greenway: Evidence from the Connswater Community Greenway, Belfast, UK. Landsc. Urban Plan. 2023, 235, 104739. [Google Scholar] [CrossRef]
- Barron, S.; Nitoslawski, S.; Wolf, K.L.; Woo, A.; Desautels, E.; Sheppard, S.R.J. Greening Blocks: A Conceptual Typology of Practical Design Interventions to Integrate Health and Climate Resilience Co-Benefits. Int. J. Environ. Res. Public Health 2019, 16, 4241. [Google Scholar] [CrossRef]
- Sun, F.; Xiang, J.; Tao, Y.; Tong, C.; Che, Y. Mapping the Social Values for Ecosystem Services in Urban Green Spaces: Integrating a Visitor-Employed Photography Method into SolVES. Urban For. Urban Green. 2019, 38, 105–113. [Google Scholar] [CrossRef]
- Mayrhofer, J.P.; Gupta, J. The Science and Politics of Co-Benefits in Climate Policy. Environ. Sci. Policy 2016, 57, 22–30. [Google Scholar] [CrossRef]
- Dumitru, A.; Wendling, L. Evaluating the Impact of Nature-Based Solutions: A Handbook for Practitioners; Publications Office of the European Union: Luxembourg, 2021; ISBN 978-92-76-22821-9. [Google Scholar]
- Pauleit, S.; Zölch, T.; Hansen, R.; Randrup, T.B.; Konijnendijk van den Bosch, C. Nature-Based Solutions and Climate Change—Four Shades of Green; Springer: Cham, Switzerland, 2017; pp. 29–49. [Google Scholar]
- World Bank. A Catalogue of Nature-Based Solutions for Urban Resilience; World Bank: Washington, DC, USA, 2021. [Google Scholar]
- Sharifi, A. Co-Benefits and Synergies between Urban Climate Change Mitigation and Adaptation Measures: A Literature Review. Sci. Total Environ. 2021, 750, 141642. [Google Scholar] [CrossRef] [PubMed]
- Grilli, G.; Tomasi, S.; Bisello, A. Assessing Preferences for Attributes of City Information Points: Results from a Choice Experiment. In Green Energy and Technology; Springer: Cham, Switzerland, 2018; pp. 197–209. [Google Scholar] [CrossRef]
- Anguluri, R.; Narayanan, P. Role of Green Space in Urban Planning: Outlook towards Smart Cities. Urban For. Urban Green. 2017, 25, 58–65. [Google Scholar] [CrossRef]
- Hunter, R.F.; Cleland, C.; Cleary, A.; Droomers, M.; Wheeler, B.W.; Sinnett, D.; Nieuwenhuijsen, M.J.; Braubach, M. Environmental, Health, Wellbeing, Social and Equity Effects of Urban Green Space Interventions: A Meta-Narrative Evidence Synthesis. Environ. Int. 2019, 130, 104923. [Google Scholar] [CrossRef] [PubMed]
- Uzonnah, O.E.; Chukwu, I.N.; Ibem, E.O. Influence of Perceived Social Benefits on Motives for Visiting Urban Green Infrastructure Spaces in Small and Medium-Sized Towns in Southeast Nigeria. Cities 2023, 135, 104240. [Google Scholar] [CrossRef]
- Sharifi, A.; Pathak, M.; Joshi, C.; He, B.J. A Systematic Review of the Health Co-Benefits of Urban Climate Change Adaptation. Sustain. Cities Soc. 2021, 74, 103190. [Google Scholar] [CrossRef]
- Chen, S.; Wang, Y.; Ni, Z.; Zhang, X.; Xia, B. Benefits of the Ecosystem Services Provided by Urban Green Infrastructures: Differences between Perception and Measurements. Urban For. Urban Green. 2020, 54, 126774. [Google Scholar] [CrossRef]
- Wai, A.T.P.; Nitivattananon, V.; Kim, S.M. Multi-Stakeholder and Multi-Benefit Approaches for Enhanced Utilization of Public Open Spaces in Mandalay City, Myanmar. Sustain. Cities Soc. 2018, 37, 323–335. [Google Scholar] [CrossRef]
- He, B.J.; Zhu, J.; Zhao, D.X.; Gou, Z.H.; Qi, J.D.; Wang, J. Co-Benefits Approach: Opportunities for Implementing Sponge City and Urban Heat Island Mitigation. Land Use Policy 2019, 86, 147–157. [Google Scholar] [CrossRef]
- Esfandi, S.; Tayebi, S.; Byrne, J.; Taminiau, J.; Giyahchi, G.; Alavi, S.A. Smart Cities and Urban Energy Planning: An Advanced Review of Promises and Challenges. Smart Cities 2024, 7, 414–444. [Google Scholar] [CrossRef]
- Lombardi, P.; Abastante, F.; Torabi Moghadam, S.; Toniolo, J. Multicriteria Spatial Decision Support Systems for Future Urban Energy Retrofitting Scenarios. Sustainability 2017, 9, 1252. [Google Scholar] [CrossRef]
- Bisello, A.; Grilli, G.; Balest, J.; Stellin, G.; Ciolli, M. Co-Benefits of Smart and Sustainable Energy District Projects: An Overview of Economic Assessment Methodologies. In Smart and Sustainable Planning for Cities and Regions; Springer: Cham, Switzerland, 2017; pp. 127–164. ISBN 978-3-319-44899-2. [Google Scholar]
- Bisello, A.; Vettorato, D. Multiple Benefits of Smart Urban Energy Transition. In Urban Energy Transition; Elsevier: Amsterdam, The Netherlands, 2018; pp. 467–490. [Google Scholar]
- Raymond, C.M.; Frantzeskaki, N.; Kabisch, N.; Berry, P.; Breil, M.; Nita, M.R.; Geneletti, D.; Calfapietra, C. A Framework for Assessing and Implementing the Co-Benefits of Nature-Based Solutions in Urban Areas. Environ. Sci. Policy 2017, 77, 15–24. [Google Scholar] [CrossRef]
- Fruth, E.; Kvistad, M.; Marshall, J.; Pfeifer, L.; Rau, L.; Sagebiel, J.; Soto, D.; Tarpey, J.; Weir, J.; Winiarski, B. Economic Valuation of Street-Level Urban Greening: A Case Study from an Evolving Mixed-Use Area in Berlin. Land Use Policy 2019, 89, 104237. [Google Scholar] [CrossRef]
- Tinch, R.; Beaumont, N.; Sunderland, T.; Ozdemiroglu, E.; Barton, D.; Bowe, C.; Börger, T.; Burgess, P.; Cooper, C.N.; Faccioli, M.; et al. Economic Valuation of Ecosystem Goods and Services: A Review for Decision Makers. J. Environ. Econ. Policy 2019, 8, 359–378. [Google Scholar] [CrossRef]
- Bottero, M.; Comino, E.; Dell’Anna, F.; Dominici, L.; Rosso, M. Strategic Assessment and Economic Evaluation: The Case Study of Yanzhou Island (China). Sustainability 2019, 11, 1076. [Google Scholar] [CrossRef]
- Bottero, M.; Ambrosini, G.; Callegari, G. Valuing the Impact of Social Housing Renovation Programs: An Application of the Social Return on Investment (SROI). In Green Energy and Technology; Springer: Cham, Switzerland, 2017; pp. 291–302. [Google Scholar] [CrossRef]
- Hunter, R.F.; Dallat, M.A.T.; Tully, M.A.; Heron, L.; O’Neill, C.; Kee, F. Social Return on Investment Analysis of an Urban Greenway. Cities Health 2022, 6, 693–710. [Google Scholar] [CrossRef]
- Lami, I.M.; Mecca, B. Assessing Social Sustainability for Achieving Sustainable Architecture. Sustainability 2020, 13, 142. [Google Scholar] [CrossRef]
- Watson, K.J.; Whitley, T. Applying Social Return on Investment (SROI) to the Built Environment. Build. Res. Inf. 2017, 45, 875–891. [Google Scholar] [CrossRef]
- Nicholls, J. A Guide to Social Return on Investment. 2012. Available online: www.socialvaluelab.org.uk/wp-content/uploads/2016/09/SROI-a-guide-to-social-return-on-investment.pdf (accessed on 9 March 2024).
- Cordes, J.J. Using Cost-Benefit Analysis and Social Return on Investment to Evaluate the Impact of Social Enterprise: Promises, Implementation, and Limitations. Eval. Program Plan. 2017, 64, 98–104. [Google Scholar] [CrossRef]
- Millar, R.; Hall, K. Social Return on Investment (SROI) and Performance Measurement: The Opportunities and Barriers for Social Enterprises in Health and Social Care. Public Manag. Rev. 2013, 15, 923–941. [Google Scholar] [CrossRef]
- Nicholls, A. “We Do Good Things, Don’t We?”: “Blended Value Accounting” in Social Entrepreneurship. Account. Organ. Soc. 2009, 34, 755–769. [Google Scholar] [CrossRef]
- Watson, K.J. Establishing Psychological Wellbeing Metrics for the Built Environment. Build. Serv. Eng. Res. Technol. 2018, 39, 232–243. [Google Scholar] [CrossRef]
- Yates, B.T.; Marra, M. Social Return on Investment (SROI): Problems, Solutions … and Is SROI a Good Investment? Eval. Program Plan. 2017, 64, 136–144. [Google Scholar] [CrossRef] [PubMed]
- Edwards, R.T.; Lawrence, C.L. ‘What You See Is All There Is’: The Importance of Heuristics in Cost-Benefit Analysis (CBA) and Social Return on Investment (SROI) in the Evaluation of Public Health Interventions. Appl. Health Econ. Health Policy 2021, 19, 653–664. [Google Scholar] [CrossRef] [PubMed]
- Commonwealth of Australia. Handbook of Cost Benefit Analysis; Department of Finance and Administration: Canberra, Australia, 2006.
- Sartori, D.; Catalano, G.; Genco, M.; Pancotti, C.; Sirtori, E.; Vignetti, S. Guide to Cost-Benefit Analysis of Investment Projects: Economic Appraisal Tool for Cohesion Policy 2014–2020; European Commission, Directorate-General for Regional and Urban Policy: Brussels, Belgium, 2015; ISBN 978-92-79-34796-2.
- Nielsen, J.G.; Lueg, R.; Van Liempd, D. Challenges and Boundaries in Implementing Social Return on Investment: An Inquiry into Its Situational Appropriateness. Nonprofit Manag. Leadersh. 2021, 31, 413–435. [Google Scholar] [CrossRef]
- Trotter, L.; Vine, J.; Leach, M.; Fujiwara, D. Measuring the Social Impact of Community Investment: A Guide to Using the Wellbeing Valuation Approach. Available online: https://www.ceci.org.uk/wp-content/uploads/2019/03/MeasuringSocialImpactHACT2014.pdf (accessed on 14 March 2024).
- SFT. Guidance: Measuring Social Value Using the SFT TOMs Developed in Conjunction with the Social Value Portal. 2020. Available online: http://161.35.36.72/downloads/6437b9c4ca13b_vich_guidanceoctober2020.pdf (accessed on 20 March 2023).
- Bichard, A. Developing an Approach to Sustainable Return on Investment Title Developing an Approach to Sustainable Return on Investment; RICS: London, UK, 2015. [Google Scholar]
- Kahlmeier, S.; Götschi, T.; Cavill, N.; Castro Fernandez, A.; Brand, C. Health Economic Assessment Tool (HEAT) for Walking and for Cycling Methods and User Guide on Physical Activity, Air Pollution, Injuries and Carbon Impact Assessments; WHO Regional Office for Europe: Copenhagen, Denmark, 2017. [Google Scholar]
- Carrick, K. Glasgow Health Walks Social Return on Investment Analysis. 2013. Available online: https://socialvalueuk.org/reports/glasgow-health-walks-social-return-on-investment-analysis-1st-april-2011-to-31st-march-2012/ (accessed on 14 March 2024).
- Carrick, K.; Lindhof, J. The Value of Walking: A Social Return on Investment Study of a Walking Project. 2011. Available online: www.socialvalueuk.org/report/the-value-of-walking-a-sroi-study-of-a-walking-project/ (accessed on 14 March 2024).
- Greenspace Scotland. Woods for Health on Kinnoull Hill Perth Greenspace. 2011. Available online: www.socialvalueuk.org/report/sroi-urban-nature-sites-woods-health-kinnoull-hill-perth/ (accessed on 14 March 2024).
- Lobley, N.; Carrick, K. Social Return on Investment Evaluation Report: Bums off Seats Executive Summary. 2011. Available online: www.socialvalueuk.org/report/bums-off-seats-sroi-evaluation-report/ (accessed on 14 March 2024).
- Price Water House Cooper. Cathay Life Cathay Walker Health Incentive Project: Social Return on Investment Report. 2020. Available online: www.socialvalueuk.org/reports/cathay-life-cathay-walker-health-incentive-project-social-return-on-investment-report/ (accessed on 14 March 2024).
- AUSER Piemonte. L’impatto Sociale Dell’AUSER Piemonte Tramite Il Progetto “I Pony Della Solidarietà”. 2018. Available online: www.auserpiemonte.org/wp-content/uploads/2020/02/VALUTAZIONE-IMPATTO-SOCIALE-PONY-DELLA-SOLIDARIETA.pdf (accessed on 14 March 2024).
- Bagnall, A.; Raine, G.; Kinsella, K.; Southby, K.; Spoor, C.; South, J.; Giuntoli, G. Measuring Well-Being Outcomes in Older People Receiving Help from the Age UK ‘Together for Health’ Initiative: A Social Return on Investment Analysis: Final Report. Available online: www.eprints.leedsbeckett.ac.uk (accessed on 14 March 2024).
- Human Foundation. La Valutazione SROI Dei Servizi Di Assistenza Sanitaria e Sociale Di AIL Bologna Sui Pazienti Onco-Ematologici, Sulle Loro Famiglie e Sui Volontari, 2020. Available online: www.ailbologna.it/kdocs/2049758/valutazionesroi_ail_bologna_human_foundation_web.pdf (accessed on 14 March 2024).
- Social Value Lab. CraftCafé: Creative Solutions to Isolation and Loneliness. Social Return on Investment Evaluation. 2011. Available online: www.socialvaluelab.org.uk/wp-content/uploads/2013/05/CraftCafeSROI.pdf (accessed on 14 March 2024).
- Health Innovation Network. Peer Support for People with Dementia: A social return on investment study. 2015. Available online: https://healthinnovationnetwork.com/resources/peer-support-for-people-with-dementia-a-social-return-on-investment-study/?cn-reloaded=1# (accessed on 14 March 2024).
- Poppe, L.; Van Dyck, D.; De Keyser, E.; Van Puyvelde, A.; Veitch, J.; Deforche, B. The Impact of Renewal of an Urban Park in Belgium on Park Use, Park-Based Physical Activity, and Social Interaction: A Natural Experiment. Cities 2023, 140, 104428. [Google Scholar] [CrossRef]
- Yang, X.; Li, H. Community Attachment in the Context of Urban Settlement Regeneration: Mediating Role of Resident Interaction. Cities 2023, 140, 104398. [Google Scholar] [CrossRef]
- Rohde, C.; Toth, Z.; Glenting, C.; Rapf, O. Multiple Benefits of Energy Efficiency Investments for Financial Institutions; Publications Office of the European Union: Luxembourg, 2022. [Google Scholar]
- Chau, K.W.; Choy, L.H.T.; Chua, M.H.; Lai, L.W.C.; Yung, E.H.K. Pro Profits or Non-Profits? A Principal-Agent Model for Analyzing Public Sector Planning Decisions and Empirical Results from Planning Applications in Hong Kong. Cities 2023, 137, 104291. [Google Scholar] [CrossRef]
- Dyakova, M.; Hamelmann, C.; Bellis, M.A.; Besnier, E.; Grey, C.N.B.; Ashton, K.; Schwappach, A.; Clar, C. Investment for Health and Well-Being: A Review of the Social Return on Investment from Public Health Policies to Support Implementing the Sustainable Development Goals by Building on Health 2020; WHO Regional Office for Europe: Copenhagen, Denmark, 2017. [Google Scholar]


| Objective | SROI Stages | Description |
|---|---|---|
| Theory of Change Definition (ToC) | Stage 1—Establishing scope and identifying key stakeholders | Prioritization of a main goal and placing at the center the local actors who will experience the changes that a project aims to achieve. |
| Stage 2—Mapping outcomes | Constitution of a causal chain between the outcomes hypothesized for stakeholders, the measurable activities proposed, and the investments made. | |
| Outcomes’ Monetization | Stage 3—Evidencing outcomes and giving them value | Quantification of outcomes by associating to each of them an indicator, a duration of the effects, and assigning a financial proxy. |
| Stage 4—Establishing impact | Discount of the value obtained by considering four context-related factors: deadweight, displacement, attribution, and drop off. | |
| Stage 5—Calculating the SROI | Calculation of the social return of each euro invested. | |
| Report and Use of Results | Stage 6—Reporting, using, and embedding | Dissemination of the analysis results in a transparent way to guide the decision-making process. |
| Objective | CBA | SROI |
|---|---|---|
| Predominant scale | Large scale: Public projects, policies, and programs | Local scale: Organization scale |
| Evaluation time | Ex-ante preferred | Ex-post preferred |
| Beneficiaries | Society as a whole | Specific local stakeholder groups |
| Outcomes determination | Determination through analyses run by experts | Determination through key stakeholder engagement |
| Intangible benefits value determination | Determination of shadow prices and WTP approach: predominantly the revealed preference method | WTP approach: Predominantly the stated preference method |
| Discount rates | Social Discount Rate (SDR) | Conventionally used 3.5%—Discount rate established by the HM Treasury’s Green Book |
| Determination of the counterfactual | Business as usual scenario (BAU) Do minimum scenario | Deadweight Attribution Displacement |
| Indicators | Economic Net Present Value (ENPV) Economic Return Rate (ERR) Benefit/Cost ratio | Net Present Value (NPV) Benefit/Cost ratio |
| Risk determination | Sensitivity analysis Qualitative risk analysis Probabilistic risk analysis Risk prevention and mitigation | Sensitivity analysis Payback Period |
| Description | SROI Inclusion | |
|---|---|---|
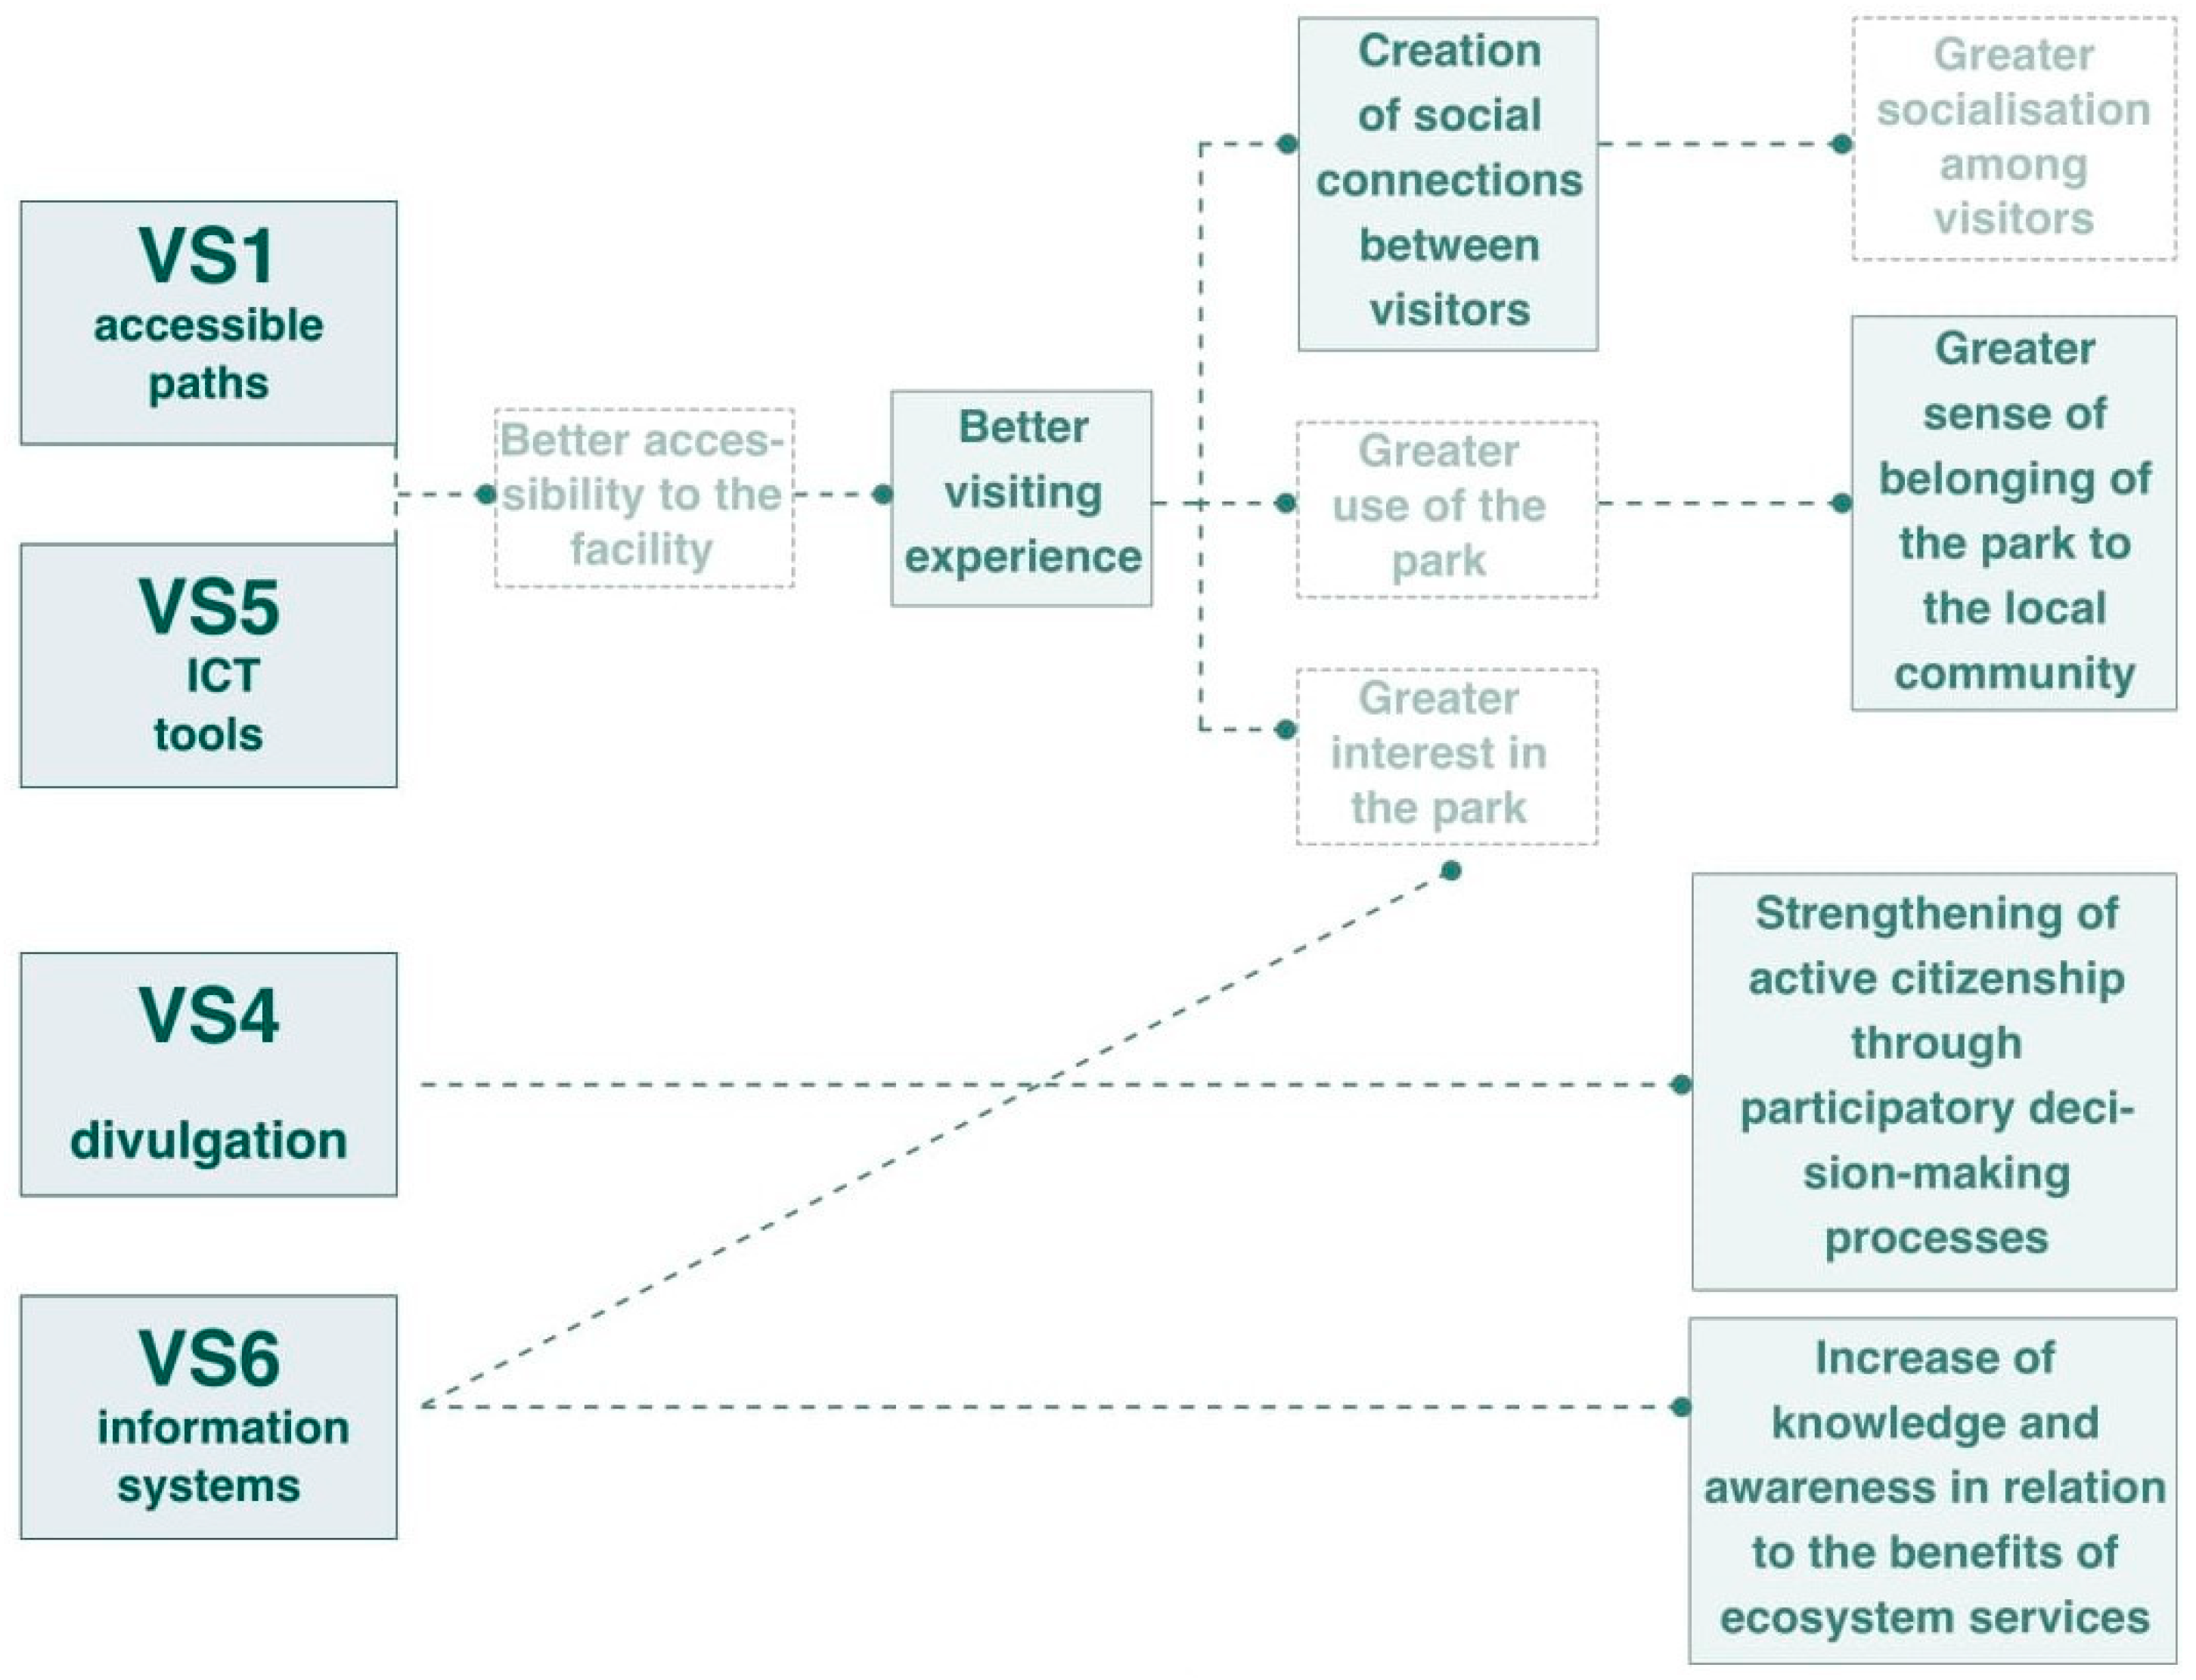
| VS1 | Creation of accessible paths and building of new parking lots to facilitate the access to the park | x |
| VS2 | Monitoring of the psychological and physiological wellbeing of the elderly and people with Alzheimer’s in relation to environmental conditions to support evidence-based information on the positive effects of UGSs. | |
| VS3 | Monitoring of microclimatic and environmental conditions in the different areas of the garden, necessary as project’s database support. | |
| VS4 | Development of guidelines for the re-design of green public spaces as a useful tool to guarantee the project’s results upscaling and future exploitation; establishment of the Local Landscape Observatory in the building close to the entrance of the park. | x |
| VS5 | Movement tracing smartphones and sensor-equipped benches for the assistance of visitors with disabilities to increase safety. | x |
| VS6 | Intelligent and adaptive information systems to offer a more enriching and rewarding visiting experience (the so-called “virtual window” on the garden). | x |
| Inputs | Value |
|---|---|
| Total financial inputs, including operating cost and subtracted revenues per year | 1,141,500.0 € |
| Total direct personnel costs | 456,252.0 € |
| Total indirect costs | 173,297.4 € |
| Total | 1,771,049.4 € |
| Stakeholder | Outcome | Discount Factors | Impact | |||||
|---|---|---|---|---|---|---|---|---|
| Description | Total Quantity | Discounted Quantity | Ranking | Value (€) | Deadweight | Attribution | Value (€) | |
| Non-fragile visitors | Increase of knowledge and awareness in relation to the benefits of ecosystem services | 3609 | 2165 | 4.45 (100%) | 48.9 | 30% | 40% | 44,473.0 |
| Strengthening of active citizenship through participatory decision-making processes | 3609 | 2165 | 3.82 (85.8%) | 41.9 | 20% | 80% | 14,521.8 | |
| Better visiting experience | 12,032 | 9144 | 3.64 (81.7%) | 39.9 | 25% | 20% | 219,015.8 | |
| Creation of social connections between visitors | 3609 | 2093 | 3.55 (79.7%) | 38.9 | 30% | 80% | 11,405.7 | |
| Greater sense of belonging of the park to the local community | 3609 | 2093 | 3.45 (77.5%) | 37.9 | 10% | 60% | 28,576.8 | |
| Fragile visitors | Reduction of loneliness | 645 | 419 | 4.20 (101.2%) | 45.5 | 30% | 80% | 2673.1 |
| Greater psycho-emotional wellbeing | 645 | 535 | 4.15 (100%) | 45.0 | 35% | 80% | 3131.8 | |
| Better visiting experience | 645 | 439 | 4.05 (97.5%) | 43.9 | 25% | 20% | 11,556.9 | |
| Greater socialization among visitors | 645 | 419 | 4.00 (96.3%) | 43.4 | 30% | 80% | 2545.8 | |
| Caregivers | Reduction of stress and anxiety associated with the caregiving experience | 720 | 468 | 4.29 (100%) | 45.0 | 20% | 80% | 3369.6 |
| Better visiting experience | 720 | 540 | 4.14 (96.5%) | 43.5 | 25% | 20% | 14,094.0 | |
| Greater socialization among visitors | 720 | 468 | 4.05 (94.4%) | 42.5 | 30% | 80% | 2784.6 | |
| Considered Scenario | SROI Ratio | New Scenario | SROI Ratio * |
|---|---|---|---|
| Displacement assumed 0% | 1:2.04 | Displacement is raised to 40% for all outcomes. | 1:1.22 |
| Deadweight is below 60% | 1:2.04 | Deadweight is raised to 60% for all outcomes | 1:1.08 |
| Stakeholder Group | Outcome | Type | Monetary Value Range (£) |
|---|---|---|---|
| Non-fragile visitors | Creation of social connections between visitors | Weekly | 1.04–10.00 |
| Fragile visitors | Greater psycho-emotional wellbeing | Weekly | 7.15–102.60 |
| Greater socialization among visitors | Weekly | 1.04–10.00 | |
| Better accessibility to the facility, i.e., increased physical activity | Annually | 111.84–11,562.73 | |
| Caregivers | Reduction of stress associated to the caregiving experience | Weekly | 10.00–23.38 |
| Monetary Alternative 1 | Monetary Alternative 2 | ||||||||
|---|---|---|---|---|---|---|---|---|---|
| Outcomes | Financial Proxy | Reference | Value (€) | Financial Proxy | Reference | Value (€) | Financial Proxies from Case Studies | Case Studies Used | Financial Proxies from Market Prices |
| Increase of knowledge and awareness in relation to the benefits of ecosystem services | Annual subscription to National Geographic magazine | National Geographic website | 48.9 | One hour of guided visit on Ecosystem Services learning | Botanic garden website | 50.0 | X | ||
| Strengthening of active citizenship through participatory decision-making processes | Calculated from anchor value | N/A | 41.9 | Value of being active among tenants | Housing Associations’ Charitable Trust (HACT) Social Value Bank | 10.0 | |||
| Better visiting experience | Calculated from anchor value | N/A | 39.9 | The cost of a local sensorial and/or digital guided tour garden | Sensorial and/or digital garden websites | 8.0 | X | ||
| Creation of social connections between visitors | Calculated from anchor value | N/A | 38.9 | Cost of one day of vacation in 2020 | ISTAT (Italian National Statistical Institute) 2020 | 76.0 | X | [55,56,57,58,59] | |
| Greater sense of belonging of the park to the local community | Calculated from anchor value | N/A | 37.9 | NOT FOUND | |||||
| Monetary Alternative 1 | Monetary Alternative 2 | ||||||||
|---|---|---|---|---|---|---|---|---|---|
| Outcomes | Financial Proxy | Reference | Value (€) | Financial Proxy | Reference | Value (€) | Financial Proxies from Case Studies | Case Studies Used | Financial Proxies from Market Prices |
| Reduction of loneliness | Calculated from anchor value | N/A | 45.5 | Minimum cost of an individual session of stress management | According to the Italian Order of Psychologists’ tariff | 35.0 | X | [55,56,59,60,61,62,63] | |
| Greater psycho-emotional wellbeing | Monthly yoga course | Local yoga website | 45.0 | ||||||
| Better visiting experience | Calculated from anchor value | N/A | 43.9 | The cost of a local sensorial and/or digital guided tour garden | Sensorial and/or digital garden websites | 8.0 | X | ||
| Greater socialization among visitors | Calculated from anchor value | N/A | 43.4 | Cost of one day of party in the square | Elderly club tariff | 26.5 | X | [55,56,57,58,59] | |
| Better accessibility to the facility—increased physical activity | N/A | Not considered | Yearly value of elderly people making mild physical exercise | HEAT (Health Assessment Tool) from World Health Organization | 2362.4 | X | [38,56,57,58,59] | ||
| Monetary Alternative 1 | Monetary Alternative 2 | ||||||||
|---|---|---|---|---|---|---|---|---|---|
| Outcomes | Financial Proxy | Reference | Value (€) | Financial Proxy | Reference | Value (€) | Financial Proxies from Case Studies | Case Studies Used | Financial Proxies from Market Prices |
| Reduction of stress and anxiety associated with the caregiving experience | Minimum cost of a couple session of stress management | According to the Italian Order of Psychologists’ tariff | 45.0 | Minimum cost of a couple session of stress management | According to the Italian Order of Psychologists’ tariff | 45.0 | X | [62,63,64] | |
| Better visiting experience | Calculated from anchor value | 43.9 | The cost of a local sensorial and/or digital guided tour garden | Sensorial and/or digital garden websites | 8.0 | X | |||
| Greater socialization among visitors | Calculated from anchor value | 43.4 | Cost of a day of vacation in 2020 | ISTAT (Italian National Statistical Institute) 2020 | 76.0 | X | |||
Disclaimer/Publisher’s Note: The statements, opinions and data contained in all publications are solely those of the individual author(s) and contributor(s) and not of MDPI and/or the editor(s). MDPI and/or the editor(s) disclaim responsibility for any injury to people or property resulting from any ideas, methods, instructions or products referred to in the content. |
© 2024 by the authors. Licensee MDPI, Basel, Switzerland. This article is an open access article distributed under the terms and conditions of the Creative Commons Attribution (CC BY) license (https://creativecommons.org/licenses/by/4.0/).
Share and Cite
Vasiliu, E.-E.; Torabi Moghadam, S.; Bisello, A.; Lombardi, P. Visionary Nature-Based Solutions Evaluated through Social Return on Investment: The Case Study of an Italian Urban Green Space. Smart Cities 2024, 7, 946-972. https://doi.org/10.3390/smartcities7020040
Vasiliu E-E, Torabi Moghadam S, Bisello A, Lombardi P. Visionary Nature-Based Solutions Evaluated through Social Return on Investment: The Case Study of an Italian Urban Green Space. Smart Cities. 2024; 7(2):946-972. https://doi.org/10.3390/smartcities7020040
Chicago/Turabian StyleVasiliu, Elisa-Elena, Sara Torabi Moghadam, Adriano Bisello, and Patrizia Lombardi. 2024. "Visionary Nature-Based Solutions Evaluated through Social Return on Investment: The Case Study of an Italian Urban Green Space" Smart Cities 7, no. 2: 946-972. https://doi.org/10.3390/smartcities7020040