
Evaluating the Feasibility of Intelligent Blind Road Junction V2I Deployments
 , , , and
Abstract
:1. Introduction
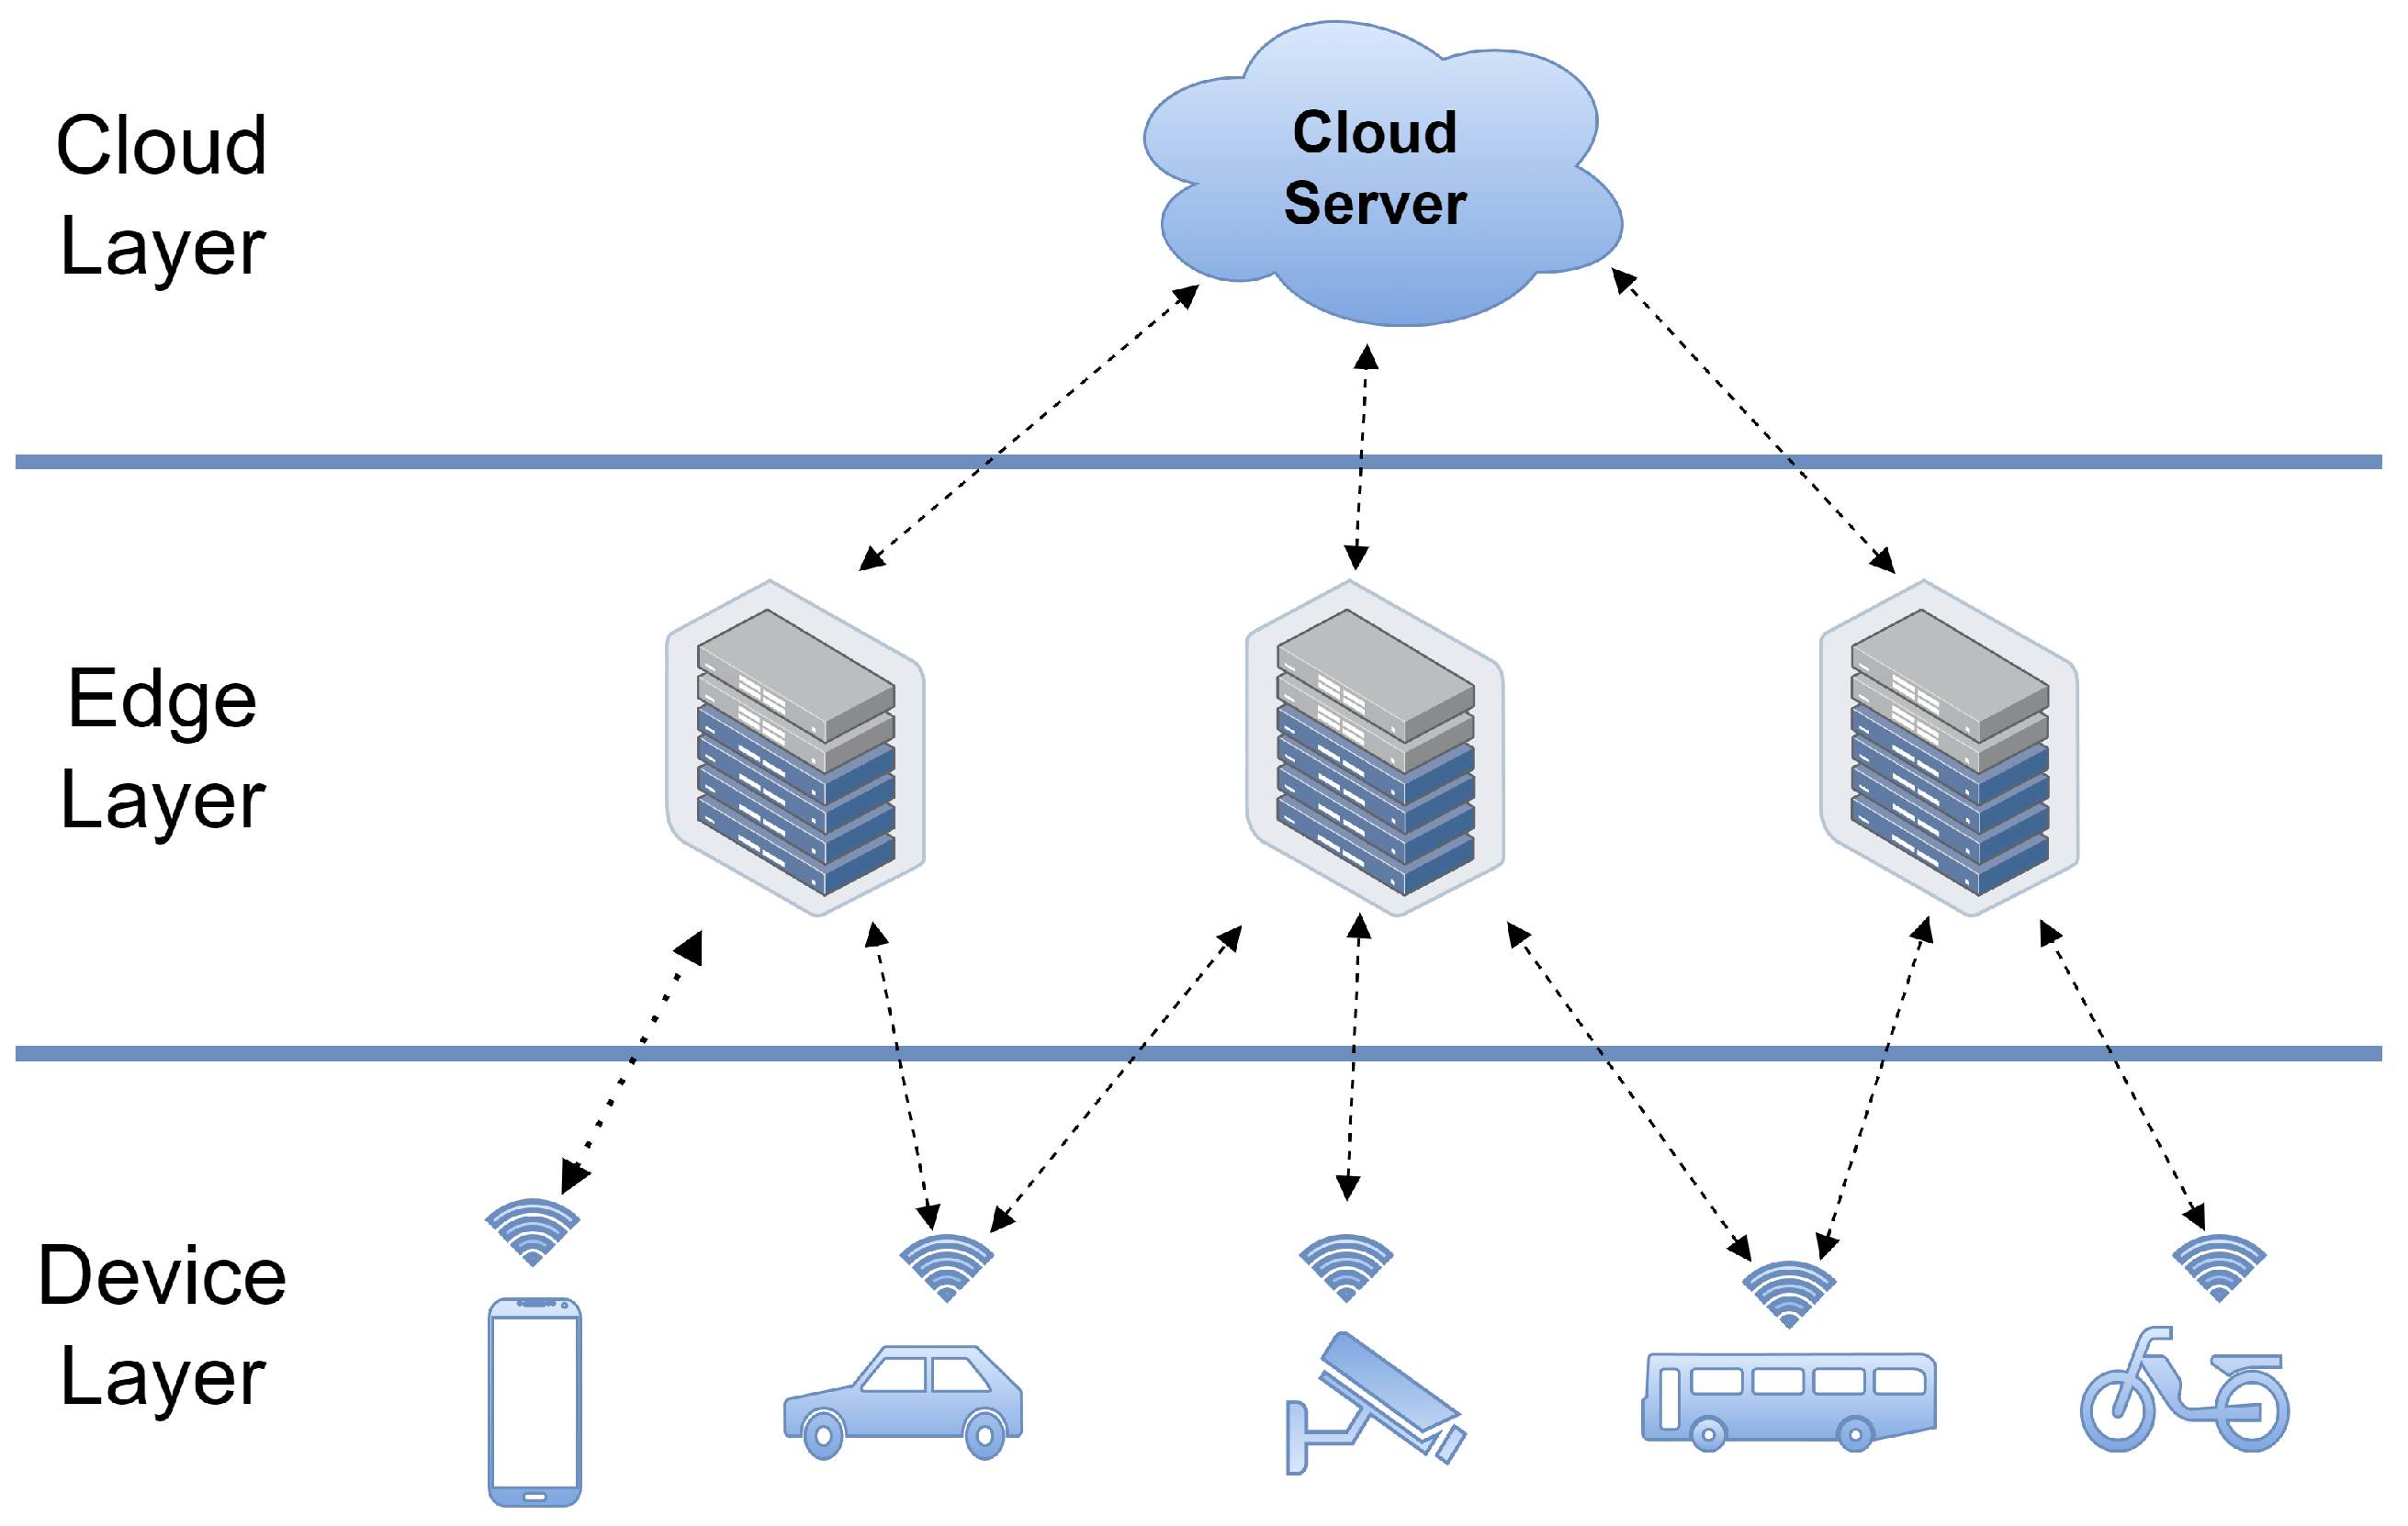
2. Intelligent Perception System (IPS) Overview
2.1. Measurement Scenarios
2.1.1. Configuration 1: Edge Computing
2.1.2. Configuration 2: Fog Computing
3. Experimental Methodology
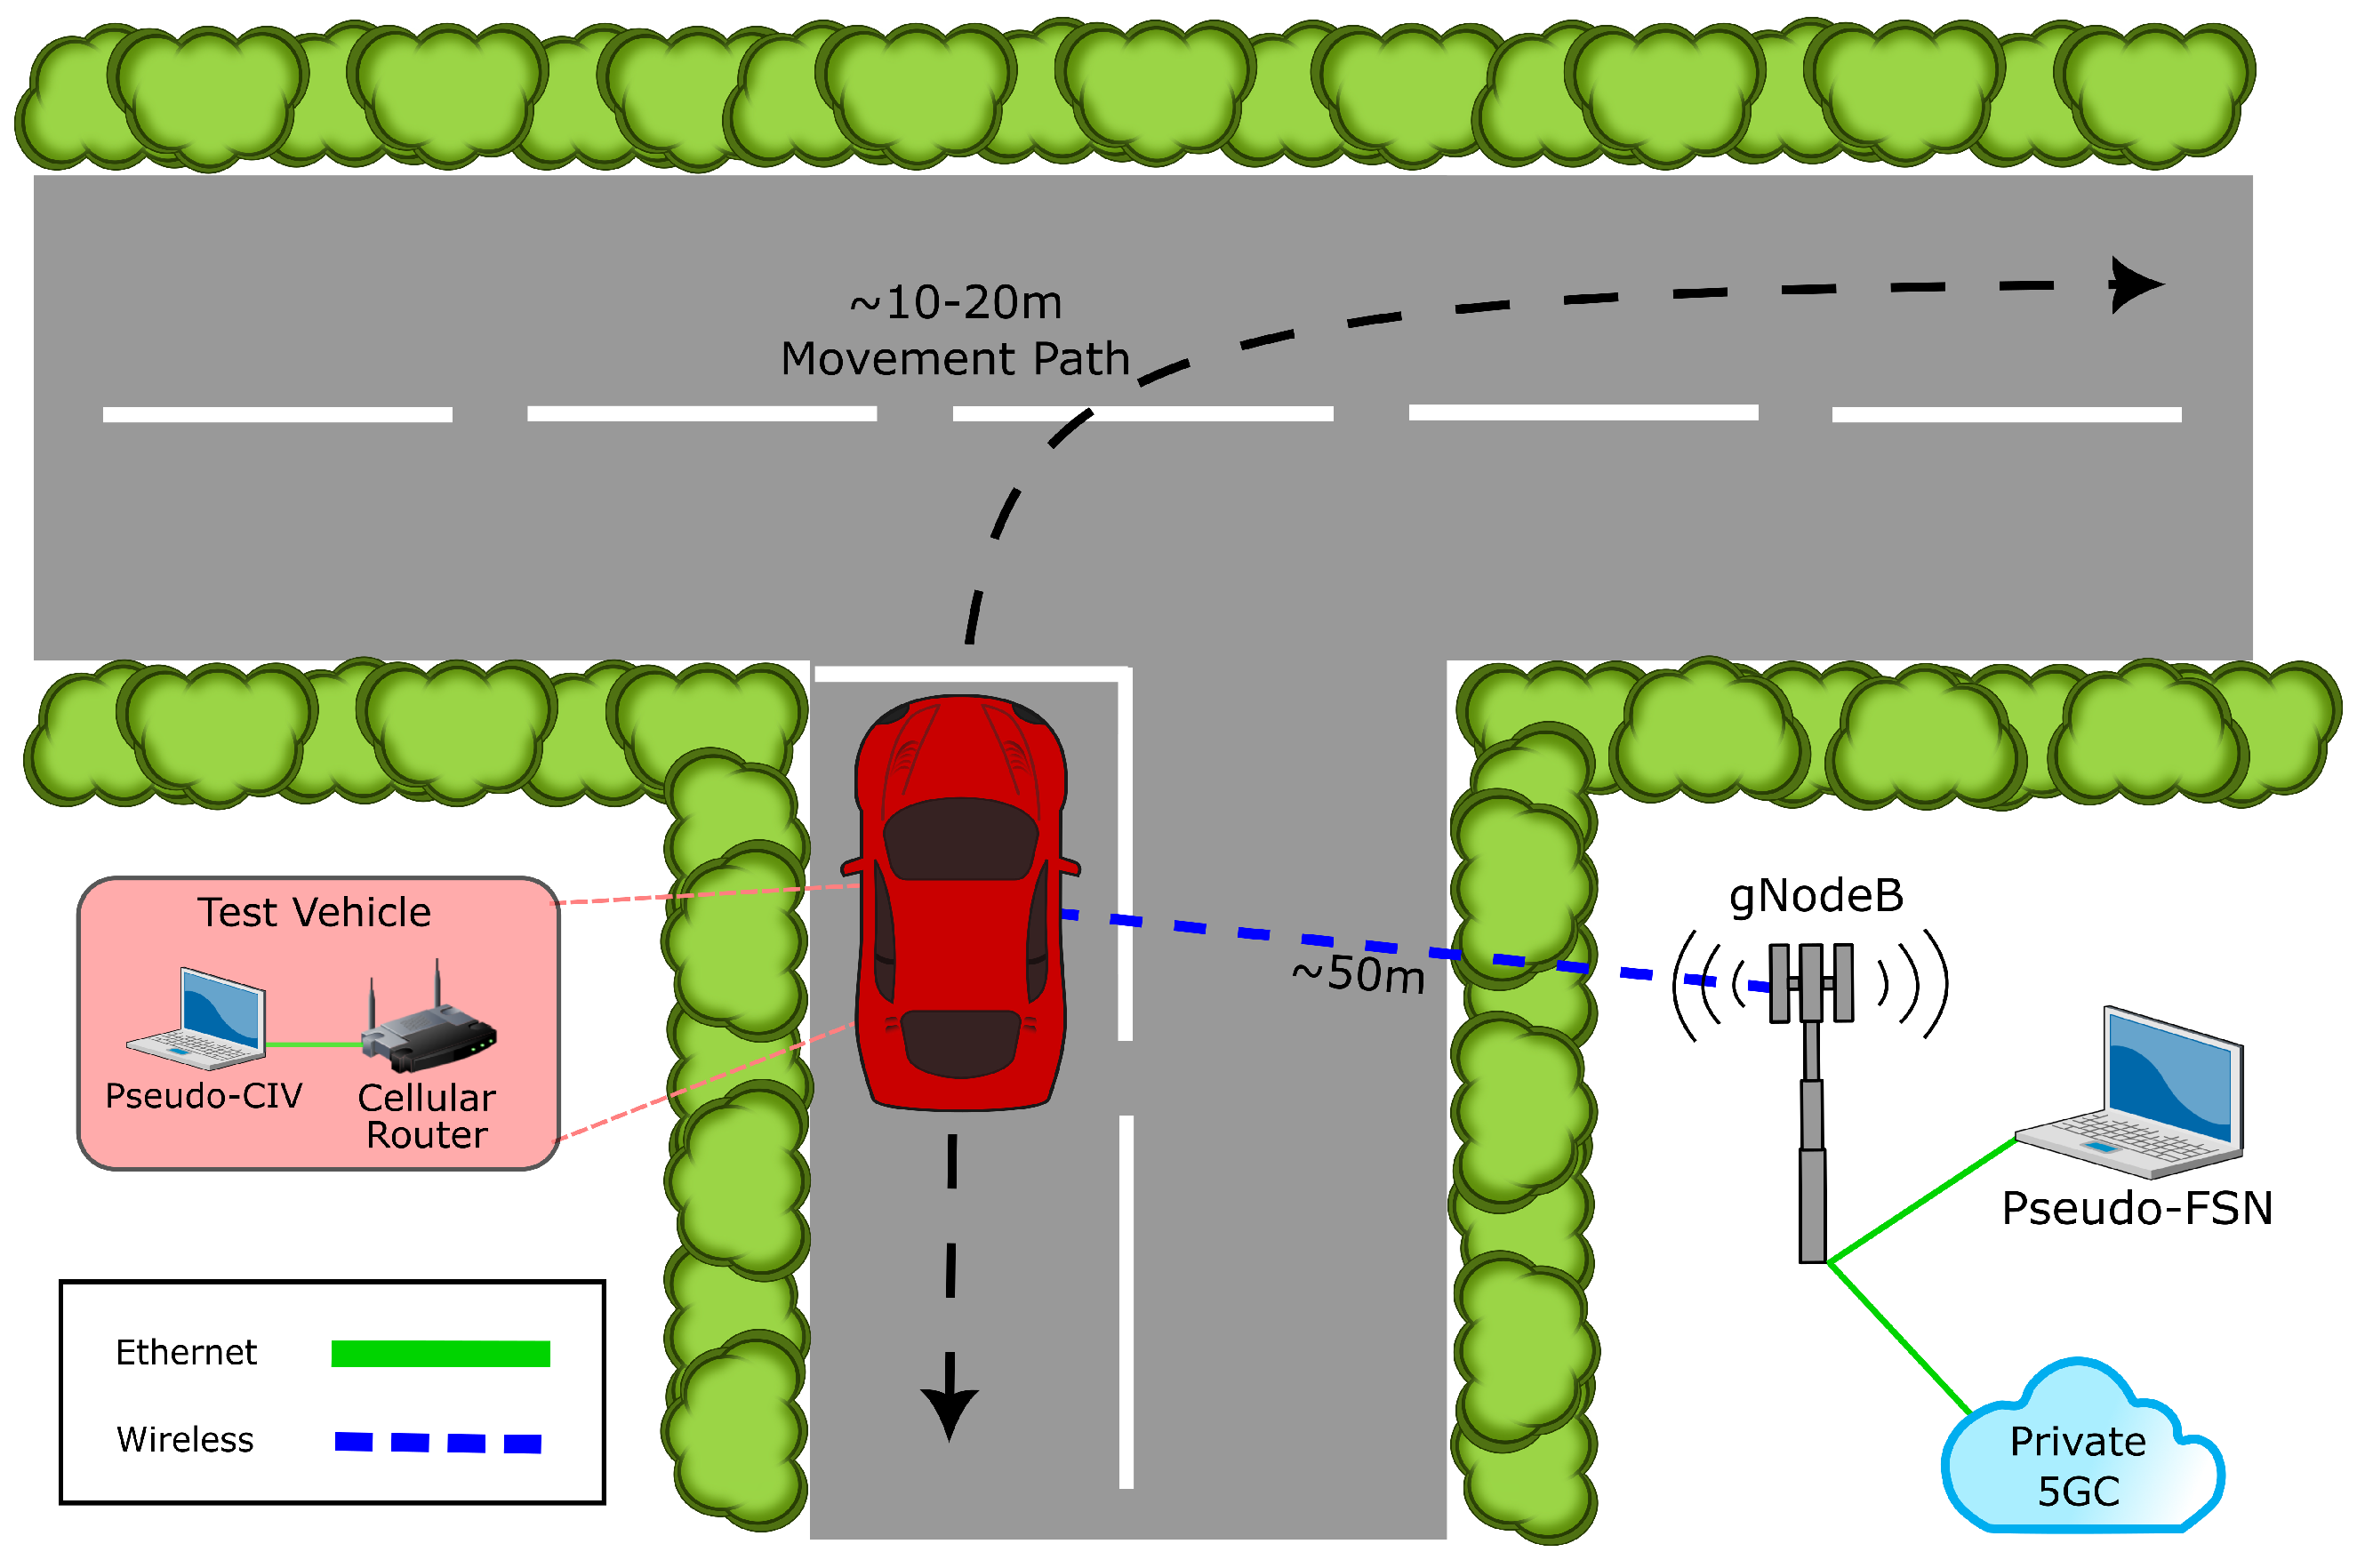
3.1. Measurement Setup
3.2. Measurement Plan
4. Results
4.1. Latency
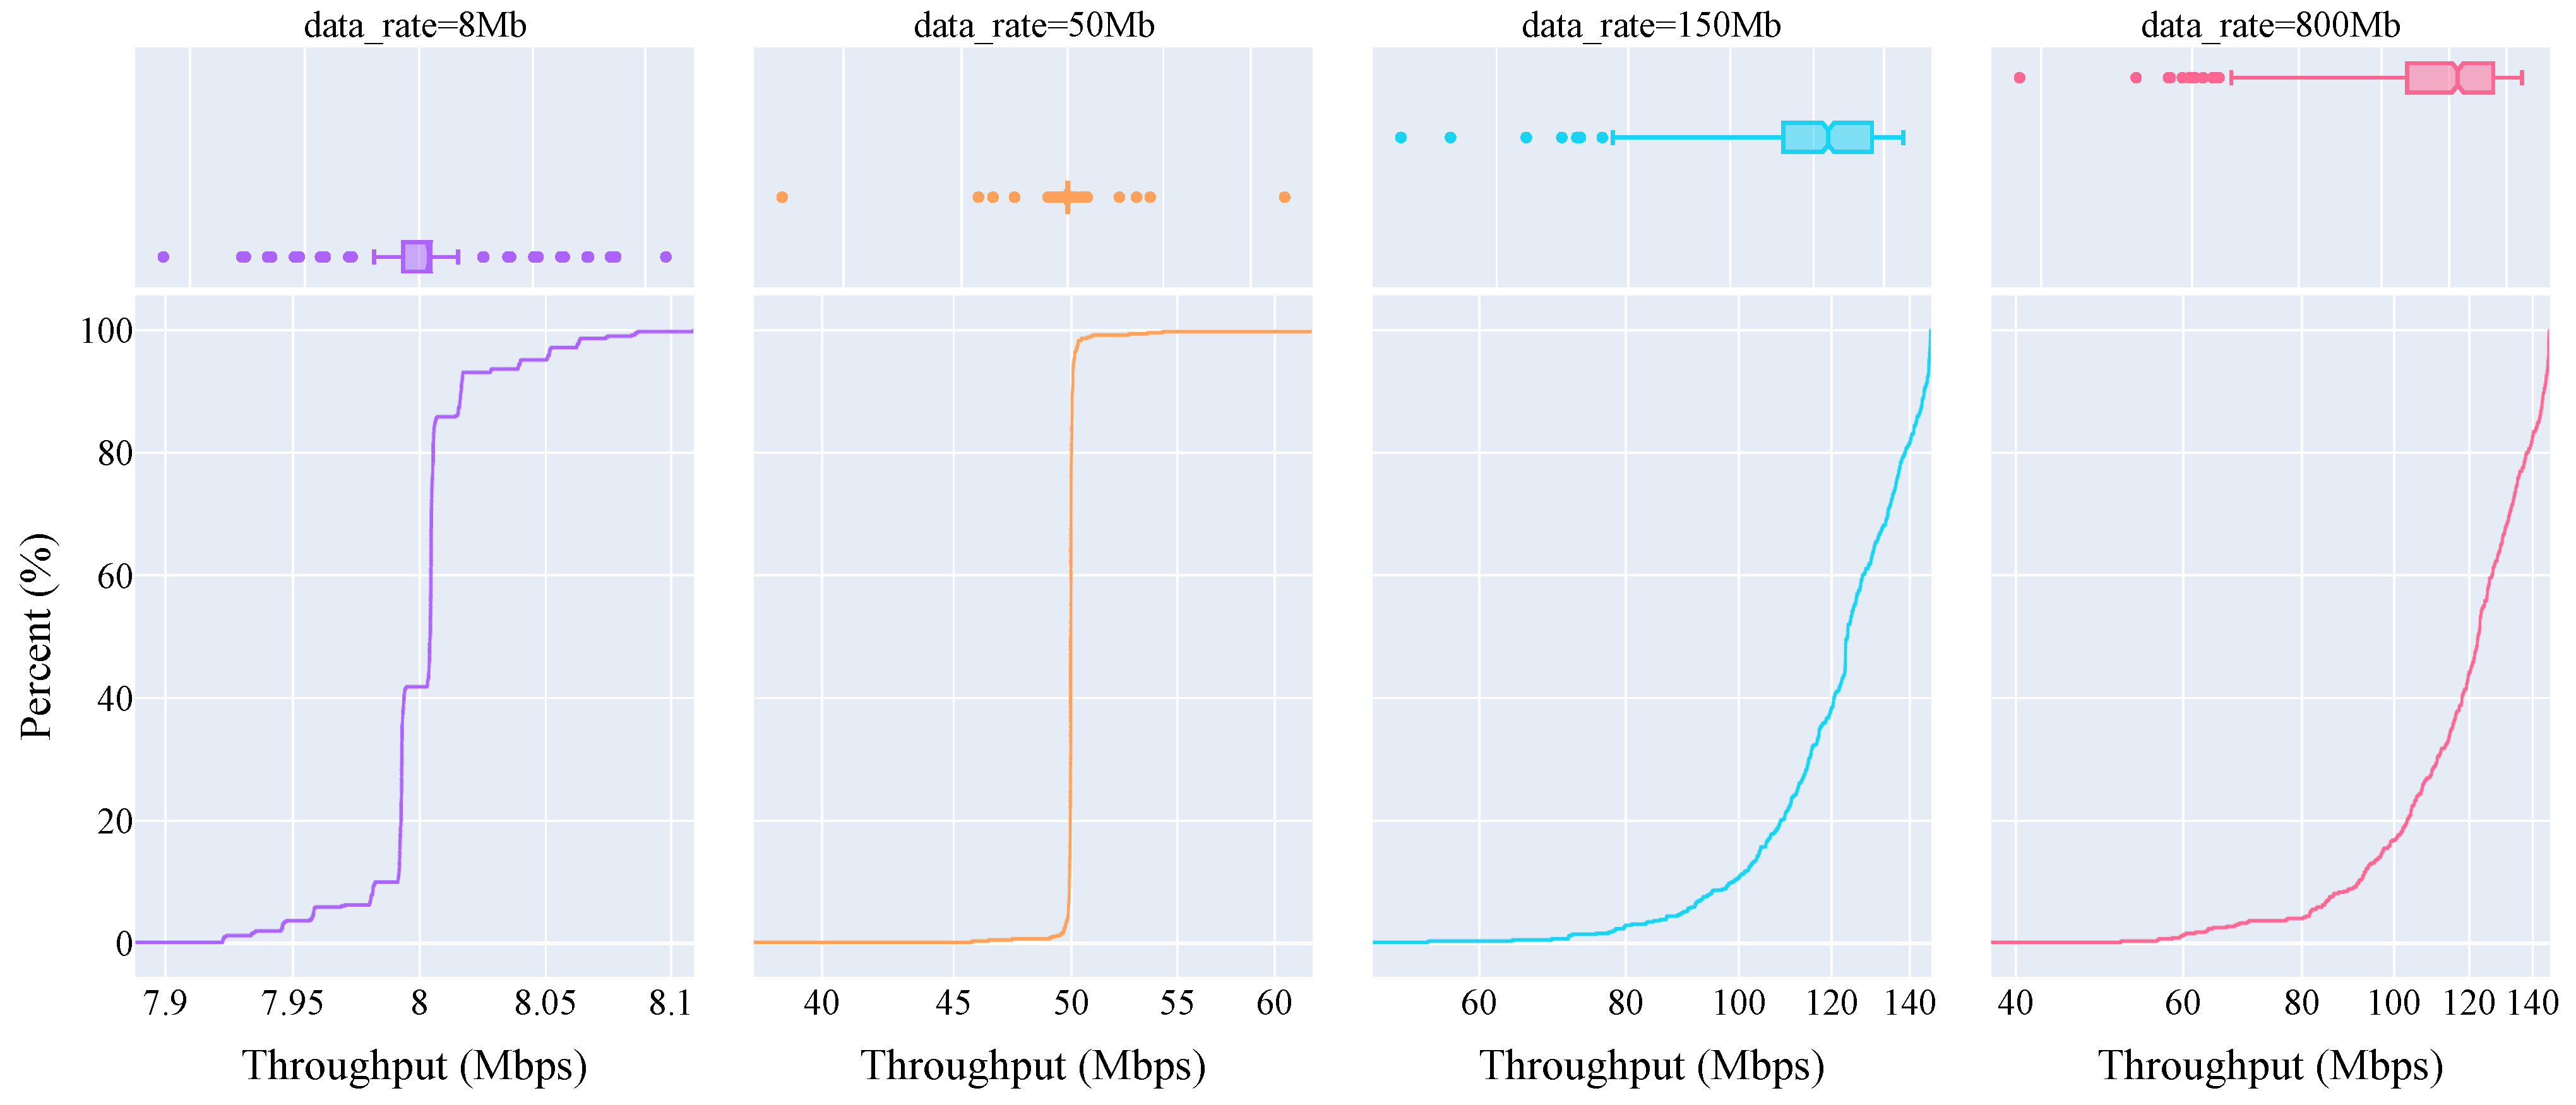
4.2. Throughput
4.3. Discussion
5. Limitations and Future Work
6. Conclusions
Author Contributions
Funding
Data Availability Statement
Conflicts of Interest
References
- Cruise. Cruise Self Driving Cars. 2023. Available online: https://getcruise.com/ (accessed on 17 September 2023).
- Waymo. Waymo Driver. 2023. Available online: https://waymo.com/waymo-driver/ (accessed on 2 October 2023).
- Tesla. Artificial Intelligence & Autopilot. 2023. Available online: https://www.tesla.com/AI (accessed on 2 October 2023).
- Uber. Uber AV. 2023. Available online: https://www.uber.com/us/en/autonomous/ (accessed on 28 August 2023).
- 3GPP. Release 16. 2023. Available online: https://www.3gpp.org/release-16 (accessed on 11 September 2023).
- 3GPP. Release 17. 2023. Available online: https://www.3gpp.org/release-17 (accessed on 11 September 2023).
- IEEE. IEEE Draft Standard for Information technology—Telecommunications and Information Exchange between Systems Local and Metropolitan Area Networks–Specific Requirements—Part 11: Wireless LAN Medium Access Control (MAC) and Physical Layer (PHY) Specifications Amendment: Enhancements for Next Generation V2X; Technical Report 802.11bd; IEEE: Piscataway, NJ, USA, 2023. [Google Scholar]
- 3GPP. Service Requirements for V2X Services. TS 22.185, 3GPP. 2023. Available online: https://portal.3gpp.org/desktopmodules/Specifications/SpecificationDetails.aspx?specificationId=2989 (accessed on 11 September 2023).
- 3GPP. Service Requirements for Enhanced V2X Scenarios. TS 22.186, 3GPP. 2023. Available online: https://portal.3gpp.org/desktopmodules/Specifications/SpecificationDetails.aspx?specificationId=3180 (accessed on 11 September 2023).
- 3GPP. 3GPP. 2023. Available online: https://www.3gpp.org/ (accessed on 11 September 2023).
- Santa, J.; Skarmeta, A.; Sánchez-Artigas, M. Architecture and evaluation of a unified V2V and V2I communication system based on cellular networks. Comput. Commun. 2008, 31, 2850–2861. [Google Scholar] [CrossRef]
- 3GPP. Release 14. 2023. Available online: https://www.3gpp.org/release-14 (accessed on 11 September 2023).
- 3GPP. Release 15. 2023. Available online: https://www.3gpp.org/release-15 (accessed on 11 September 2023).
- Gaber, A.; Nassar, W.; Mohamed, A.M.; Mansour, M.K. Feasibility Study of Teleoperated Vehicles Using Multi-Operator LTE Connection. In Proceedings of the 2020 International Conference on Innovative Trends in Communication and Computer Engineering (ITCE), Aswan, Egypt, 8–9 February 2020; pp. 191–195. [Google Scholar] [CrossRef]
- Lauridsen, M.; Gimenez, L.C.; Rodriguez, I.; Sorensen, T.B.; Mogensen, P. From LTE to 5G for Connected Mobility. IEEE Commun. Mag. 2017, 55, 156–162. [Google Scholar] [CrossRef]
- Inam, R.; Schrammar, N.; Wang, K.; Karapantelakis, A.; Mokrushin, L.; Feljan, A.V.; Fersman, E. Feasibility assessment to realise vehicle teleoperation using cellular networks. In Proceedings of the 2016 IEEE 19th International Conference on Intelligent Transportation Systems (ITSC), Rio de Janeiro, Brazil, 1–4 November 2016; IEEE: Rio de Janeiro, Brazil, 2016; pp. 2254–2260. [Google Scholar] [CrossRef]
- Clancy, J.; Mullins, D.; Deegan, B.; Horgan, J.; Ward, E.; Denny, P.; Eising, C.; Jones, E.; Glavin, M. Feasibility Study of V2X Communications in Initial 5G NR Deployments. IEEE Access 2023, 11, 75269–75284. [Google Scholar] [CrossRef]
- 3GPP. Study on LTE Support for Vehicle-to-Everything (V2X) Services, 2023. TS 22.885, 3GPP. 2023. Available online: https://portal.3gpp.org/desktopmodules/Specifications/SpecificationDetails.aspx?specificationId=2898 (accessed on 11 September 2023).
- Neumeier, S.; Walelgne, E.A.; Bajpai, V.; Ott, J.; Facchi, C. Measuring the Feasibility of Teleoperated Driving in Mobile Networks. In Proceedings of the 2019 Network Traffic Measurement and Analysis Conference (TMA), Paris, France, 19–21 June 2019; pp. 113–120. [Google Scholar] [CrossRef]
- Mämmelä, O.; Ojanperä, T.; Mäkelä, J.; Martikainen, O.; Väisänen, J. Evaluation of LiDAR Data Processing at the Mobile Network Edge for Connected Vehicles. In Proceedings of the 2019 European Conference on Networks and Communications (EuCNC), Valencia, Spain, 18–21 June 2019; pp. 83–88. [Google Scholar] [CrossRef]
- Pyykönen, P.; Lumiaho, A.; Kutila, M.; Scholliers, J.; Kakes, G. V2X-supported automated driving in modern 4G networks. In Proceedings of the 2020 IEEE 16th International Conference on Intelligent Computer Communication and Processing (ICCP), Cluj-Napoca, Romania, 3–5 September 2020; pp. 271–275. [Google Scholar] [CrossRef]
- Daengsi, T.; Ungkap, P.; Wuttidittachotti, P. A Study of 5G Network Performance: A Pilot Field Trial at the Main Skytrain Stations in Bangkok. In Proceedings of the 2021 International Conference on Artificial Intelligence and Computer Science Technology (ICAICST), Yogyakarta, Indonesia, 29–30 June 2021; pp. 191–195. [Google Scholar] [CrossRef]
- Ogawa, A.; Kuroda, S.; Ushida, K.; Kudo, R.; Tateishi, K.; Yamashita, H.; Kantou, T. Field Experiments on Sensor Data Transmission for 5G-Based Vehicle-Infrastructure Cooperation. In Proceedings of the 2018 IEEE 88th Vehicular Technology Conference (VTC-Fall), Chicago, IL, USA, 27–30 August 2018; pp. 1–5. [Google Scholar] [CrossRef]
- Szalay, Z.; Ficzere, D.; Tihanyi, V.; Magyar, F.; Soós, G.; Varga, P. 5G-Enabled Autonomous Driving Demonstration with a V2X Scenario-in-the-Loop Approach. Sensors 2020, 20, 7344. [Google Scholar] [CrossRef] [PubMed]
- Kutila, M.; Kauvo, K.; Pyykönen, P.; Zhang, X.; Martinez, V.G.; Zheng, Y.; Xu, S. A C-V2X/5G Field Study for Supporting Automated Driving. In Proceedings of the 2021 IEEE Intelligent Vehicles Symposium (IV), Nagoya, Japan, 11–17 July 2021; pp. 315–320. [Google Scholar] [CrossRef]
- Moukhwas, D. Road junction convex mirrors. Appl. Ergon. 1987, 18, 133–136. [Google Scholar] [CrossRef] [PubMed]
- Dhalwar, S.; Ruby, S.; Salgar, S.; Padiri, B. Image Processing based Traffic Convex Mirror Detection. In Proceedings of the 2019 Fifth International Conference on Image Information Processing (ICIIP), Shimla, India, 15–17 November 2019; pp. 41–45. [Google Scholar] [CrossRef]
- Zhang, C.; Steinhauser, F.; Hinz, G.; Knoll, A. Traffic Mirror-Aware POMDP Behavior Planning for Autonomous Urban Driving. In Proceedings of the 2022 IEEE Intelligent Vehicles Symposium (IV), Aachen, Germany, 5–9 June 2022; pp. 323–330. [Google Scholar] [CrossRef]
- Bai, Z.; Wu, G.; Qi, X.; Liu, Y.; Oguchi, K.; Barth, M.J. Infrastructure-Based Object Detection and Tracking for Cooperative Driving Automation: A Survey. In Proceedings of the 2022 IEEE Intelligent Vehicles Symposium (IV), Aachen, Germany, 5–9 June 2022; pp. 1366–1373. [Google Scholar] [CrossRef]
- Li, L.; Wang, F.Y. Cooperative driving at adjacent blind intersections. In Proceedings of the 2005 IEEE International Conference on Systems, Man and Cybernetics, Waikoloa, HI, USA, 12 October 2005; Volume 1, pp. 847–852. [Google Scholar] [CrossRef]
- Narksri, P.; Takeuchi, E.; Ninomiya, Y.; Takeda, K. Crossing Blind Intersections from a Full Stop Using Estimated Visibility of Approaching Vehicles. In Proceedings of the 2019 IEEE Intelligent Transportation Systems Conference (ITSC), Auckland, New Zealand, 27–30 October 2019. [Google Scholar] [CrossRef]
- Sama, K.; Morales, Y.; Akai, N.; Takeuchi, E.; Takeda, K. Learning How to Drive in Blind Intersections from Human Data. In Proceedings of the 2018 IEEE International Conference on Systems, Man, and Cybernetics (SMC), Miyazaki, Japan, 7–10 October 2018; pp. 317–324. [Google Scholar] [CrossRef]
- Solomitckii, D.; Barneto, C.B.; Turunen, M.; Allén, M.; Koucheryavy, Y.; Valkama, M. Millimeter-Wave Automotive Radar Scheme with Passive Reflector for Blind Corner Conditions. In Proceedings of the 2020 14th European Conference on Antennas and Propagation (EuCAP), Copenhagen, Denmark, 15–20 March 2020; pp. 1–5. [Google Scholar] [CrossRef]
- Müller, J.; Strohbeck, J.; Herrmann, M.; Buchholz, M. Motion Planning for Connected Automated Vehicles at Occluded Intersections With Infrastructure Sensors. IEEE Trans. Intell. Transp. Syst. 2022, 23, 17479–17490. [Google Scholar] [CrossRef]
- Drabek, C.; Kosmalska, A.; Weiss, G.; Ishigooka, T.; Otsuka, S.; Mizuochi, M. Safe Interaction of Automated Forklifts and Humans at Blind Corners in a Warehouse with Infrastructure Sensors. In Computer Safety, Reliability, and Security; Habli, I., Sujan, M., Bitsch, F., Eds.; Lecture Notes in Computer Science; Springer International Publishing: Cham, Switzerland, 2021; pp. 163–177. [Google Scholar] [CrossRef]
- Jaktheerangkoon, S.; Nakorn, K.N.; Rojviboonchai, K. Performance study of IEEE 802.11p in blind corner scenario. In Proceedings of the 2016 International Symposium on Intelligent Signal Processing and Communication Systems (ISPACS), Phuket, Thailand, 24–27 October 2016; pp. 1–6. [Google Scholar] [CrossRef]
- Buchholz, M.; Müller, J.; Herrmann, M.; Strohbeck, J.; Völz, B.; Maier, M.; Paczia, J.; Stein, O.; Rehborn, H.; Henn, R.W. Handling Occlusions in Automated Driving Using a Multiaccess Edge Computing Server-Based Environment Model From Infrastructure Sensors. IEEE Intell. Transp. Syst. Mag. 2022, 14, 106–120. [Google Scholar] [CrossRef]
- Annu; Rajalakshmi, P.; Tammana, P. Optimizing Latency for Real-time Traffic and Road Safety Applications through MEC-based V2X System. In Proceedings of the 2023 International Conference on Smart Applications, Communications and Networking (SmartNets), Istanbul, Türkiye, 25–27 July 2023; pp. 1–8. [Google Scholar] [CrossRef]
- Mao, Y.; You, C.; Zhang, J.; Huang, K.; Letaief, K.B. A Survey on Mobile Edge Computing: The Communication Perspective. IEEE Commun. Surv. Tutor. 2017, 19, 2322–2358. [Google Scholar] [CrossRef]
- Yeong, D.J.; Velasco-Hernandez, G.; Barry, J.; Walsh, J. Sensor and Sensor Fusion Technology in Autonomous Vehicles: A Review. Sensors 2021, 21, 2140. [Google Scholar] [CrossRef]
- ETSI. Intelligent Transport Systems (ITS); Vehicular Communications; Basic Set of Applications; Local Dynamic Map (LDM); Rationale for and Guidance on Standardization. TR 102 863, ETSI. 2011. Available online: https://www.etsi.org/deliver/etsi_tr/102800_102899/102863/01.01.01_60/tr_102863v010101p.pdf8 (accessed on 11 September 2023).
- Srivastava, P.; Khan, R. A Review Paper on Cloud Computing. Int. J. Adv. Res. Comput. Sci. Softw. Eng. 2018, 8, 17. [Google Scholar] [CrossRef]
- Kreutz, D.; Ramos, F.M.V.; Veríssimo, P.E.; Rothenberg, C.E.; Azodolmolky, S.; Uhlig, S. Software-Defined Networking: A Comprehensive Survey. Proc. IEEE 2015, 103, 14–76. [Google Scholar] [CrossRef]
- Mijumbi, R.; Serrat, J.; Gorricho, J.L.; Bouten, N.; De Turck, F.; Boutaba, R. Network Function Virtualization: State-of-the-Art and Research Challenges. IEEE Commun. Surv. Tutor. 2016, 18, 236–262. [Google Scholar] [CrossRef]
- Al-Dulaimi, A.; Wang, X. 5G Networks: Fundamental Requirements, Enabling Technologies, and Operations Management; Wiley: Hoboken, NJ, USA, 2018. [Google Scholar]
- EN 302 637-2; Intelligent Transport Systems (ITS); Vehicular Communications; Basic Set of Applications; Part 2: Specification of Cooperative Awareness Basic Service. ETSI: Sophia Antipolis, France, 2019.
- EN 302 637-3; Intelligent Transport Systems (ITS); Vehicular Communications; Basic Set of Applications; Part 3: Specifications of Decentralized Environmental Notification Basic Service. ETSI: Sophia Antipolis, France, 2019.
- Wang, H.; Liu, T.; Kim, B.G.; Lin, C.W.; Shiraishi, S.; Xie, J.; Han, Z. Architectural Design Alternatives based on Cloud/Edge/Fog Computing for Connected Vehicles. IEEE Commun. Surv. Tutor. 2020, 22, 2349–2377. [Google Scholar] [CrossRef]
- Atlam, H.F.; Walters, R.J.; Wills, G.B. Fog Computing and the Internet of Things: A Review. Big Data Cogn. Comput. 2018, 2, 10. [Google Scholar] [CrossRef]
- DruidSoftware. Raemis™—Cellular Network Technology. 2023. Available online: https://druidsoftware.com/raemis-cellular-network-technology/ (accessed on 25 September 2023).
- VirtualAccess. GW1450 Series 5G Router. 2023. Available online: https://virtualaccess.com/gw1450-series-5g-router/ (accessed on 25 September 2023).
- Quectel. Quectel RM50xQ Series. 2023. Available online: https://www.quectel.com/product/5g-rm50xq-series (accessed on 25 September 2023).
- 3GPP. NR; User Equipment (UE) Radio Transmission and Reception; Part 1: Range 1 Standalone. TS 38.101-1, 3GPP. 2023. Available online: https://portal.3gpp.org/desktopmodules/Specifications/SpecificationDetails.aspx?specificationId=3283 (accessed on 11 September 2023).
- 3GPP. NR; User Equipment (UE) Radio Transmission and Reception; Part 2: Range 2 Standalone. TS 38.101-2, 3GPP. 2023. Available online: https://portal.3gpp.org/desktopmodules/Specifications/SpecificationDetails.aspx?specificationId=3284 (accessed on 11 September 2023).
- MicroAmp. MicroAmp 5G mmWave. 2023. Available online: https://microamp-solutions.com/products (accessed on 25 September 2023).
- Quectel. Quectel RM530N=GL Series. 2023. Available online: https://www.quectel.com/product/5g-rm530n-gl (accessed on 25 September 2023).
- iPerf. iPerf—The TCP, UDP and SCTP Network Bandwidth Measurement Tool. 2023. Available online: https://iperf.fr/ (accessed on 25 September 2023).
- TS 103 324; Intelligent Transport System (ITS); Vehicular Communications; Basic Set of Applications; Collective Perception Service; Release 2. ETSI: Sophia Antipolis, France, 2023.
- Sepulcre, M.; Gozalvez, J.; Thandavarayan, G.; Coll-Perales, B.; Schindler, J.; Rondinone, M. On the Potential of V2X Message Compression for Vehicular Networks. IEEE Access 2020, 8, 214254–214268. [Google Scholar] [CrossRef]
- Hikvision. 4MP Fixed Turret Network Camera. 2023. Available online: https://www.hikvision.com/uk/products/IP-Products/Network-Cameras/Pro-Series-EasyIP-/ds-2cd2347g2h-liu/ (accessed on 25 September 2023).
- Google. Google Pixel 6a. 2023. Available online: https://store.google.com/ie/product/pixel_6a?hl=en-GB (accessed on 25 September 2023).
- Hikvision. Compact 4K Camcorder. 2023. Available online: https://uk.jvc.com/pro/camcorders/4k/GY-HM170E/ (accessed on 25 September 2023).
- Imaging, L. LI-AR0823-GM2B-120H. 2023. Available online: https://leopardimaging.com/product/automotive-cameras/front-view-cameras/li-ar0823-gm2b/li-ar0823-gm2b-120h/ (accessed on 25 September 2023).
- Tukey, J.W. Exploratory Data Analysis. In The Concise Encyclopedia of Statistics; Springer: New York, NY, USA, 2008; pp. 192–194. [Google Scholar] [CrossRef]
- 3GPP. Ultra-Reliable and Low-Latency Communications. 2023. Available online: https://www.3gpp.org/technologies/urlcc-2022 (accessed on 25 September 2023).


| Configuration | Data Type | Data Rate |
|---|---|---|
| (Config. 1) Object Data | Quiet Scene | 12.5 kbps |
| Moderate Scene | 25 kbps | |
| Busy Scene | 50 kbps | |
| (Config. 2) Sensor Data | CCTV Camera | 8 Mbps |
| Action Camera | 50 Mbps | |
| Consumer Camera | 150 Mbps | |
| Automotive Camera | 800 Mbps |
| Latency (ms) | Mean | StD. | Skew | Kurt. | IQR | Min. | 25% | 50% | 75% | Max. |
|---|---|---|---|---|---|---|---|---|---|---|
| Sub-6GHz | 10.60 | 13.52 | 12.12 | 182.65 | 2.79 | 5.27 | 7.30 | 8.32 | 10.09 | 279.91 |
| mmWave | 12.04 | 24.36 | 8.15 | 82.43 | 2.64 | 4.17 | 6.95 | 7.93 | 9.59 | 465.16 |
| Jitter (ms) | Mean | StD. | Skew | Kurt. | IQR | Min. | 25% | 50% | 75% | Max. |
|---|---|---|---|---|---|---|---|---|---|---|
| Sub-6GHz | 5.55 | 17.86 | 9.20 | 102.44 | 3.11 | 5.93 × 10⁻⁴ | 0.85 | 1.85 | 3.96 | 272.63 |
| mmWave | 5.78 | 24.36 | 8.04 | 80.81 | 1.96 | 4.89 × 10⁻⁴ | 0.68 | 1.41 | 2.64 | 457.42 |
| Data Type | Mean | StD. | Skew | Kurt. | IQR | Min. | 25% | 50% | 75% | Max. | |
|---|---|---|---|---|---|---|---|---|---|---|---|
| Object Data (kbps) | Quiet Scene (12.5 kbps) | 11.583 | 0.003 | 2.099 | 4.782 | 0.002 | 11.574 | 11.582 | 11.583 | 11.584 | 11.596 |
| Moderate Scene (25 kbps) | 23.167 | 0.004 | 1.031 | 0.675 | 0.01 | 23.159 | 23.165 | 23.166 | 23.169 | 23.181 | |
| Busy Scene (50 kbps) | 50.017 | 5.391 | 0.787 | −1.38 | 11.587 | 46.271 | 46.332 | 46.336 | 57.919 | 57.995 | |
| Sensor Data (Mbps) | CCTV (8 Mbps) | 8.000 | 0.022 | 0.100 | 5.734 | 0.013 | 7.888 | 7.992 | 8.004 | 8.005 | 8.109 |
| Action (50 Mbps) | 50.001 | 0.841 | −0.425 | 167.687 | 12.070 | 37.636 | 49.98 | 49.997 | 50.018 | 62.055 | |
| Consumer (150 Mbps) | 122.311 | 17.689 | −0.864 | 0.781 | 24.021 | 48.653 | 112.309 | 123.915 | 136.330 | 146.013 | |
| Automotive (800 Mbps) | 119.392 | 20.613 | −0.921 | 0.697 | 37.721 | 27.938 | 107.132 | 122.780 | 135.070 | 145.995 | |
| Data Type | Mean | StD. | Skew | Kurt. | IQR | Min. | 25% | 50% | 75% | Max. |
|---|---|---|---|---|---|---|---|---|---|---|
| Action (50 Mbps) | 51.084 | 2.288 | −8.322 | 108.900 | 0.029 | 24.557 | 51.187 | 51.196 | 51.216 | 65.068 |
| Consumer (150 Mbps) | 153.557 | 1.181 | −0.399 | 119.895 | 0.069 | 140.282 | 153.513 | 153.540 | 153.582 | 166.513 |
| Automotive (800 Mbps) | 811.110 | 30.051 | −3.570 | 16.428 | 1.886 | 599.334 | 817.852 | 818.829 | 819.738 | 873.946 |
Disclaimer/Publisher’s Note: The statements, opinions and data contained in all publications are solely those of the individual author(s) and contributor(s) and not of MDPI and/or the editor(s). MDPI and/or the editor(s) disclaim responsibility for any injury to people or property resulting from any ideas, methods, instructions or products referred to in the content. |
© 2024 by the authors. Licensee MDPI, Basel, Switzerland. This article is an open access article distributed under the terms and conditions of the Creative Commons Attribution (CC BY) license (https://creativecommons.org/licenses/by/4.0/).
Share and Cite
Clancy, J.; Molloy, D.; Hassett, S.; Leahy, J.; Ward, E.; Denny, P.; Jones, E.; Glavin, M.; Deegan, B. Evaluating the Feasibility of Intelligent Blind Road Junction V2I Deployments. Smart Cities 2024, 7, 973-990. https://doi.org/10.3390/smartcities7030041
Clancy J, Molloy D, Hassett S, Leahy J, Ward E, Denny P, Jones E, Glavin M, Deegan B. Evaluating the Feasibility of Intelligent Blind Road Junction V2I Deployments. Smart Cities. 2024; 7(3):973-990. https://doi.org/10.3390/smartcities7030041
Chicago/Turabian StyleClancy, Joseph, Dara Molloy, Sean Hassett, James Leahy, Enda Ward, Patrick Denny, Edward Jones, Martin Glavin, and Brian Deegan. 2024. "Evaluating the Feasibility of Intelligent Blind Road Junction V2I Deployments" Smart Cities 7, no. 3: 973-990. https://doi.org/10.3390/smartcities7030041