Article

Influence of Osmotic Dehydration on Mass Transfer Kinetics and Quality Retention of Ripe Papaya (Carica papaya L) during Drying

Department of Food Engineering and Tea Technology, Shahjalal University of Science and Technology, Sylhet 3114, Bangladesh
*
Author to whom correspondence should be addressed.
AgriEngineering 2019, 1(2), 220-234; https://doi.org/10.3390/agriengineering1020016
Submission received: 26 March 2019 / Revised: 4 May 2019 / Accepted: 9 May 2019 / Published: 14 May 2019

Abstract

:
The study aimed to investigate the mass transfer kinetics and nutritional quality during osmotic dehydration (OD) and air-drying of papaya. The papaya was osmotically pretreated by different concentrations of sugar solutions (40, 50 and 60 °Brix) and osmotic solution temperatures (35, 45 and 55 °C). The ratio of fruit to the solution was kept at 1:4 (w/v) and pretreated process duration varied from 0 to 240 min. The present study demonstrated that water loss and the solute gain rate increased with the increasing of osmotic solution temperature, concentration and time. Mass transfer kinetics of osmotically pretreated papaya cubes were investigated based on the Peleg’s and Penetration models. The Peleg model showed the best fitted for water loss and solute gain whereas the Penetration model best described the water loss during osmotic dehydration of papaya. Effective diffusivity of water and solute gain was estimated using the analytical solution of Fick’s law of diffusion. Average effective diffusivity of water loss and solute gain was obtained in the range from 2.25 × 10⁻⁹ to 4.31 × 10⁻⁹ m2/s and 3.01 × 10⁻⁹ to 5.61 × 10⁻⁹ m2/s, respectively. Osmotically pretreated samples were dried with a convective method at a temperature of 70 °C. The moisture content, water activity and shrinkage of the dried papaya were decreased when the samples pretreated with a higher concentration of the osmotic solution and greater process temperature. The results also indicated that the highest osmotic solution temperature of 55 °C with the lowest concentration of 40 °Brix resulted in a significant decrease in phenolic content, antioxidant activity, and vitamin C content while higher osmotic solution concentration of 60 °Brix and the lowest temperature of the process (35 °C) retained maximum bioactive compounds.

1. Introduction

Papaya (Carica papaya L) belongs to the family of Caricaceae, low-cost climacteric-type fruits widely grown in tropical and sub-tropical regions [1,2]. Papaya is a good source of β-carotene, lycopene, provitamin-A vitamin C, iron, calcium, protein, carbohydrates, phosphorous and associated antioxidant activity [1]. This fruit is perishable due to the presence of higher water content (80%–90%) [2]. In every year the post-harvest losses of papaya in Bangladesh are approximately 40% to 50% [3]. Due to the lack of post-harvest and processing technology, lots of fresh and ripe fruits are damaged every year. Therefore, there is increased interest in processing of the fruits to prevent this situation. There are several techniques for developing diversified products which are already practice in other countries as well as Bangladesh.
Since ancient times, drying has been the most common natural and artificial technique which help to reduce the moisture and water activity of food and enhancing the shelf life. The main benefits of the dried products over the fresh product include reduced volume or mass, potential for long storage at ambient temperature, prevention of the growth of microorganism, a slowing down of the enzymatic reaction, and a significant reduction in the costs for transportation and storage. However, the quality degradation of food subjected to drying results in changes that occur such as shrinkage, case hardening and discoloration [4,5]. According to Rekha et al. [6] 30–40% of initial ascorbic acid in some fruits can be lost on dehydration. To preserve the functional components and improve the product quality of foods, some pretreatment could be applied prior to drying [7]. Among various pretreatment methods, osmotic dehydration (OD) is traditionally applied to food dewatering which leads to attractive products. Osmotic dehydration before drying can retain beneficial nutrients [1]. Several studies have already been carried out to evaluate the effect of osmotic dehydration on water loss, solid gain, and characterizations of its physical parameters of papaya and other fruits [4,5,8,9]. However, the present study showed the interest in determining the effect of various concentration of an osmotic solution with different temperature on the mass transfer kinetics, physicochemical and antioxidant properties of the new variety of papaya (Shahi papaya). This is a high-yielding dioecious variety having the fruit average weight of 800–1000 g and oval shape, deep orange-colored pulp with total soluble solids of 12% [10]. The study also aimed to apply some mathematical models to evaluate the mass transfer phenomena during osmotic dehydration and to determine the effects of osmotic dehydration on physicochemical and antioxidant properties of hot air-died papaya.

2. Materials and Methods

2.1. Sample Preparation

Fresh matured papayas (variety: Shahi papaya) were obtained from the local market in Sylhet, Bangladesh. The moisture content of the papaya was about 88% fresh weight and °Brix content was about 12%. The fruit was an oval shape, and an average weight of 800 g to 1 kg were chosen in this study. They were allowed to uniformly ripen (about 80%–90% yellow epicarp) at room temperature. Fruits of uniform ripeness were cut into 20 × 20 × 20 mm thickness by using a stainless-steel cutter.

2.2. Osmotic Dehydration

The commercial sugar (sucrose) was considered as an osmotic agent being cheap and easily available. The prepared papaya samples were immersed in various concentrations of sucrose solution of 40, 50 and 60 °Brix with different temperature of 35, 45 and 55 °C. Fruit to solution ratio was 1:4 (w/v). At a chosen time interval (0–240 min), the pieces of fruit were taken out from the solution and the fruit surface was rinsed with water to remove the solute. The weight loss and solute gain were recorded every 15 min interval until 1 h, and after 1 h the measurement was recorded every 30 min intervals for total 4 h. Then the surface water and solute were removed by adsorbent paper before drying.

2.3. Convective Drying and Storage

After pretreatment, the convective drying of osmotically pretreated papaya slices was performed by using a hot-air dryer (Model-OF-21E, Korea). The drying temperature was set about 70 ± 2.0 °C and during drying a constant humidity of 50% and constant air flow (1.5 m/s) was maintained. Each batch about 25 g of triplicate samples was taken to dry. The total drying time was about 8 h. Finally, the samples were kept in a zip locked airtight polyethylene film bags and stored at −20 °C for further study.

2.4. Determination of Mass Transfer Parameters

2.4.1. Water Loss

The water loss during osmotic dehydration was calculated by the equation given by Ozen et al. [11] and Singh et al. [12].
Water   loss   ( WL )   g / 100   g   of   fresh   fruit = ( W o W t ) + ( S t S o ) W o × 100
where Wo is the initial weight of papaya cubes (g), Wt is the weight of papaya after osmotic dehydration for any time t (min), So is the initial weight of solids (dry matter) in the papaya (g), and St is the weight of solids (dry matter) of papaya after osmotic dehydration for time t (min).

2.4.2. Solute Gain

The solute gain during osmotic dehydration was calculated by the equation given by Ozen et al. [11] and Singh et al. [12].
Solute   gain / 100   g   of   fresh   fruit = ( S t S o ) W o × 100
where Wo is the initial weight of papaya cubes (g), So is the initial weight of solids (dry matter) in the papaya (g), and St is the weight of solids (dry matter) of papaya after osmotic dehydration for time t (min).

2.4.3. Validation of Empirical Models for Osmotic Dehydration of Papaya

Empirical models were used for the validity of osmotic dehydration which was checked by a non-linear regression technique to determine the kinetics of water loss and solute gain. For validation of empirical models during osmotic dehydration of papaya we used the Peleg model [13] and the Penetration model [14] as follows:
Peleg Model: WL or SG = K1 + K2t
where WL = water loss %, SG = % solute gain, K1 = Peleg rate constant, (1/min) and K2 = Peleg capacity constant (1/min), t = (time in min)
Penetration model: WL or SG = Kt1/2
where WL = Water loss %, SG = % Solute gain, K = penetration rate constant (1/min) t = (time)

2.4.4. Adequacy of Empirical Models

The fittings of the Peleg and Penetration models was done by using the Origin pro 8.5 software. To evaluate the goodness of fit of the models were done by determining the parameters such as determination coefficient R2, the reduced χ 2 value, root mean square value and mean relative deviation of E%.
R 2 = i = 1 N ( M R i , p MR p ) 2 i = 1 N ( M R i , e MR p ) 2
χ 2 = i = 1 N ( MR i , p M R i , e ) 2 N n
R M S E = i = 1 N ( MR i , p M R i , e ) 2 N
% E = 100 N i = 1 N | V e V p V e |
where MRi,p is the predicted value of MC, WL and SG; MRi,e is the experimental value of MC, WL and SG; Ve = experimental value, Vp = predicted value, N is the number of observation and n is the number of constants in the model equation.
The higher R2 value, lower χ2 and Root Mean Square Error (RMSE) values of the models indicated as best fitted with the experimental data. The values of %E less than 5.0 indicated an excellent fit and values greater than 10 indicated a poor fit [12].

2.4.5. Effective Diffusivity of Water

The unsteady state Fickian diffusion model can be applied to describe the mechanism of mass transfer during osmosis:
C t = D e 2 C Z 2
The different analytical solutions of Equation (6) have been given by Crank [15] for several geometries and boundary conditions. With uniform initial water and solute concentration and boundary condition for negligible external resistance and varying bulk solution concentrations with time, the analytical solution of Fick’s equation for infinite cylindrical geometry being placed in stirred solution of the limited volume is given below Sharma and Prasad [16].
MR = M t M e M o M e = n 0 a 4 Ψ n 2 exp [ Ψ n 2 D t r 2 ]
where MR = moisture ratio, Mo, Mt, and Me are the initial moisture, moisture content at any time and equilibrium moisture content respectively. ψn = nth root of the Bessel function of zero order, n = 1, 2,3
The effective moisture diffusivity (De) values of papaya during osmotic dehydration were calculated by considering only the first term of the equation assuming that the effect of the terms other than the first is negligible. The effective moisture diffusivity involves the conversion of Fourier series having infinite terms in which the maximum effect is of the first term and the series converges after 3 to 6 terms so that we assumed the effect of the first term is significant and other terms can be negligible [17]. By considering only, the first term, the equation reduces as,
MR = M t M e M o M e = 4 Ψ n 2 exp [ Ψ n 2 D t r 2 ]
where ψ1 is the first root of the Bessel function of zero (order = 2.405).

2.5. Physicochemical Analysis

2.5.1. Moisture Content

The moisture content of the osmotic dehydrated and air dried papaya was determined by drying a sample at some elevated temperature and reporting the loss in weight in terms of moisture [18]. For the different time intervals, approximately 5 g of sample was oven dried at 105 °C for 24 h and longer until the consecutive constant weight was attained.

2.5.2. Water Activity

The water activity of the dried papaya sample was determined with the standard water activity of the saturated salt solution such as lithium chloride, magnesium chloride, magnesium nitrate hexahydrate, strontium chloride hexahydrate and sodium chloride of 0.11, 0.33, 0.53, 0.71 and 0.75 water activities respectively at 25 °C [19] by Conway unit (Model: 060310-02A, Shibata Co. Ltd., Tokyo, Japan).

2.5.3. Rehydration

Rehydration was determined according to the method described by Doymaz [20] with slight modifications. For measurement, 2 g samples were immersed in 200 mL distilled water at the temperature of 25 °C for 300 min. At the end of the rehydration period, samples were takeout and remove the excess surface water. Then the weight of the samples was recorded. The rehydration ratio (RR) was calculated using the following equation:
RR = W 2 W 1 W 1
where W1 is the weight of the dry matter and W2 weight of the samples after rehydrating.

2.5.4. Shrinkage

The shrinkage of the dried papaya slices was determined according to the method calculated by Garcia et al. [21]. The shrinkage of the papaya slices was determined based on the volume variation using the following equation:
V 1 V 0 V 0 = [ ( m 1 ρ 1 m 0 ρ 0 ) × ( m 0 ρ 0 ) 1 ] × 100
where V is the volume of the sample; m is the mass of the sample and ρ is the density of the samples. 0 and 1 indicate sample before drying and after drying.

2.5.5. Total Soluble Solid

The total soluble solid (TSS) of osmotically dehydrated papaya was determined by using a hand-held refractometer (General REF103, Inter world highway LLC, New Jersey, USA). The values were expressed as °Brix ± standard deviation (SD).

2.6. Determination of Antioxidant Properties of Air-Dried Papaya

2.6.1. Preparation of Extract

The samples were extracted using 80% acetone with a ratio of 1:10 (sample: solvent) according to Saikia et al. [22] with slight modifications. After that, the samples were incubated at 20 °C for 90 min in a shaking incubator (SI-200, Gyrozen, Korea). After the incubation period, the crude extract was centrifuged at 3000 rpm (Model-416G, Gyrozen, Korea) for 15 min. Then extracts were then stored at −20 °C until further analysis.

2.6.2. Ascorbic Acid (Vitamin C)

Ascorbic acid was determined using the method described by Ranganna [23] which is based on the reduction of 2,6-dichlorophenol-indophenol by ascorbic acid and those based on the reduction of dehydroascorbic acid with 2,4-dinitrophenylhydrazine.

2.6.3. Determination of Total Phenolic Content

The total phenolic content was determined with the Folin–Ciocalteu assay reported by Slinkard et al. [24]. Briefly, 20 μL of extract, gallic acid standard or blank were taken in separate test tubes and to each 1.58 mL of distilled water was added, followed by 100 μL of Folin–Ciocalteau reagent, mixed well and within 8 min, 300 μL of sodium carbonate was added. The samples were vortexed immediately and the tubes were incubated in the dark for 30 min at 40 °C. Blank was prepared with water instead of the sample. The absorbance was then measured at 765 nm in an ultraviolet–visible (UV–Vis) spectrophotometer (Model-T60U, PG instruments limited, UK). The results were expressed in mg Gallic acid equivalent (GAE)/100 g. A set of the standard solution was read against blank. The result of phenolics was expressed in terms of Gallic acid in mg/100 g of dry weight.

2.6.4. Determination of 2, 2-diphenyl-1-picrylhydrazyl (DPPH) Activity

The analysis was performed based on radical scavenging activity of the DPPH (2, 2-diphenyl-1-picrylhydrazyl) [22]. At first, 100 μL of extracts were added to 1.4 mL DPPH radical methanolic solution (0.1 mM in methanol). Then the mixture was left to stand a dark place for 30 min. A blank solution was made by 100 μL methanol in 1.4 mL of DPPH radical solution. The absorbance was measured at 517 nm using an UV–Vis spectrophotometer (Model-T60U, PG instruments limited, UK). Triplicate measurements were carried out for each sample. The results were expressed in terms of radical scavenging activity using the following equation:
Radical   scavenging   activity   ( % ) = A o As A o × 100
where Ao is absorbance of control blank, and as is absorbance of sample extract.

2.7. Statistical Analysis

The influences of pretreatment (during of the process, concentration, temperature) on depend variables: mass transfer parameters (MC, WL and SG), physicochemical parameters i.e., water activity, shrinkage, rehydration, and antioxidant properties were evaluated by means of multifactorial analysis of variance at a significant level of p ≤ 0.05. In the case of significant impact factor, post-hoc Turkey’s test was performed.

3. Results and Discussion

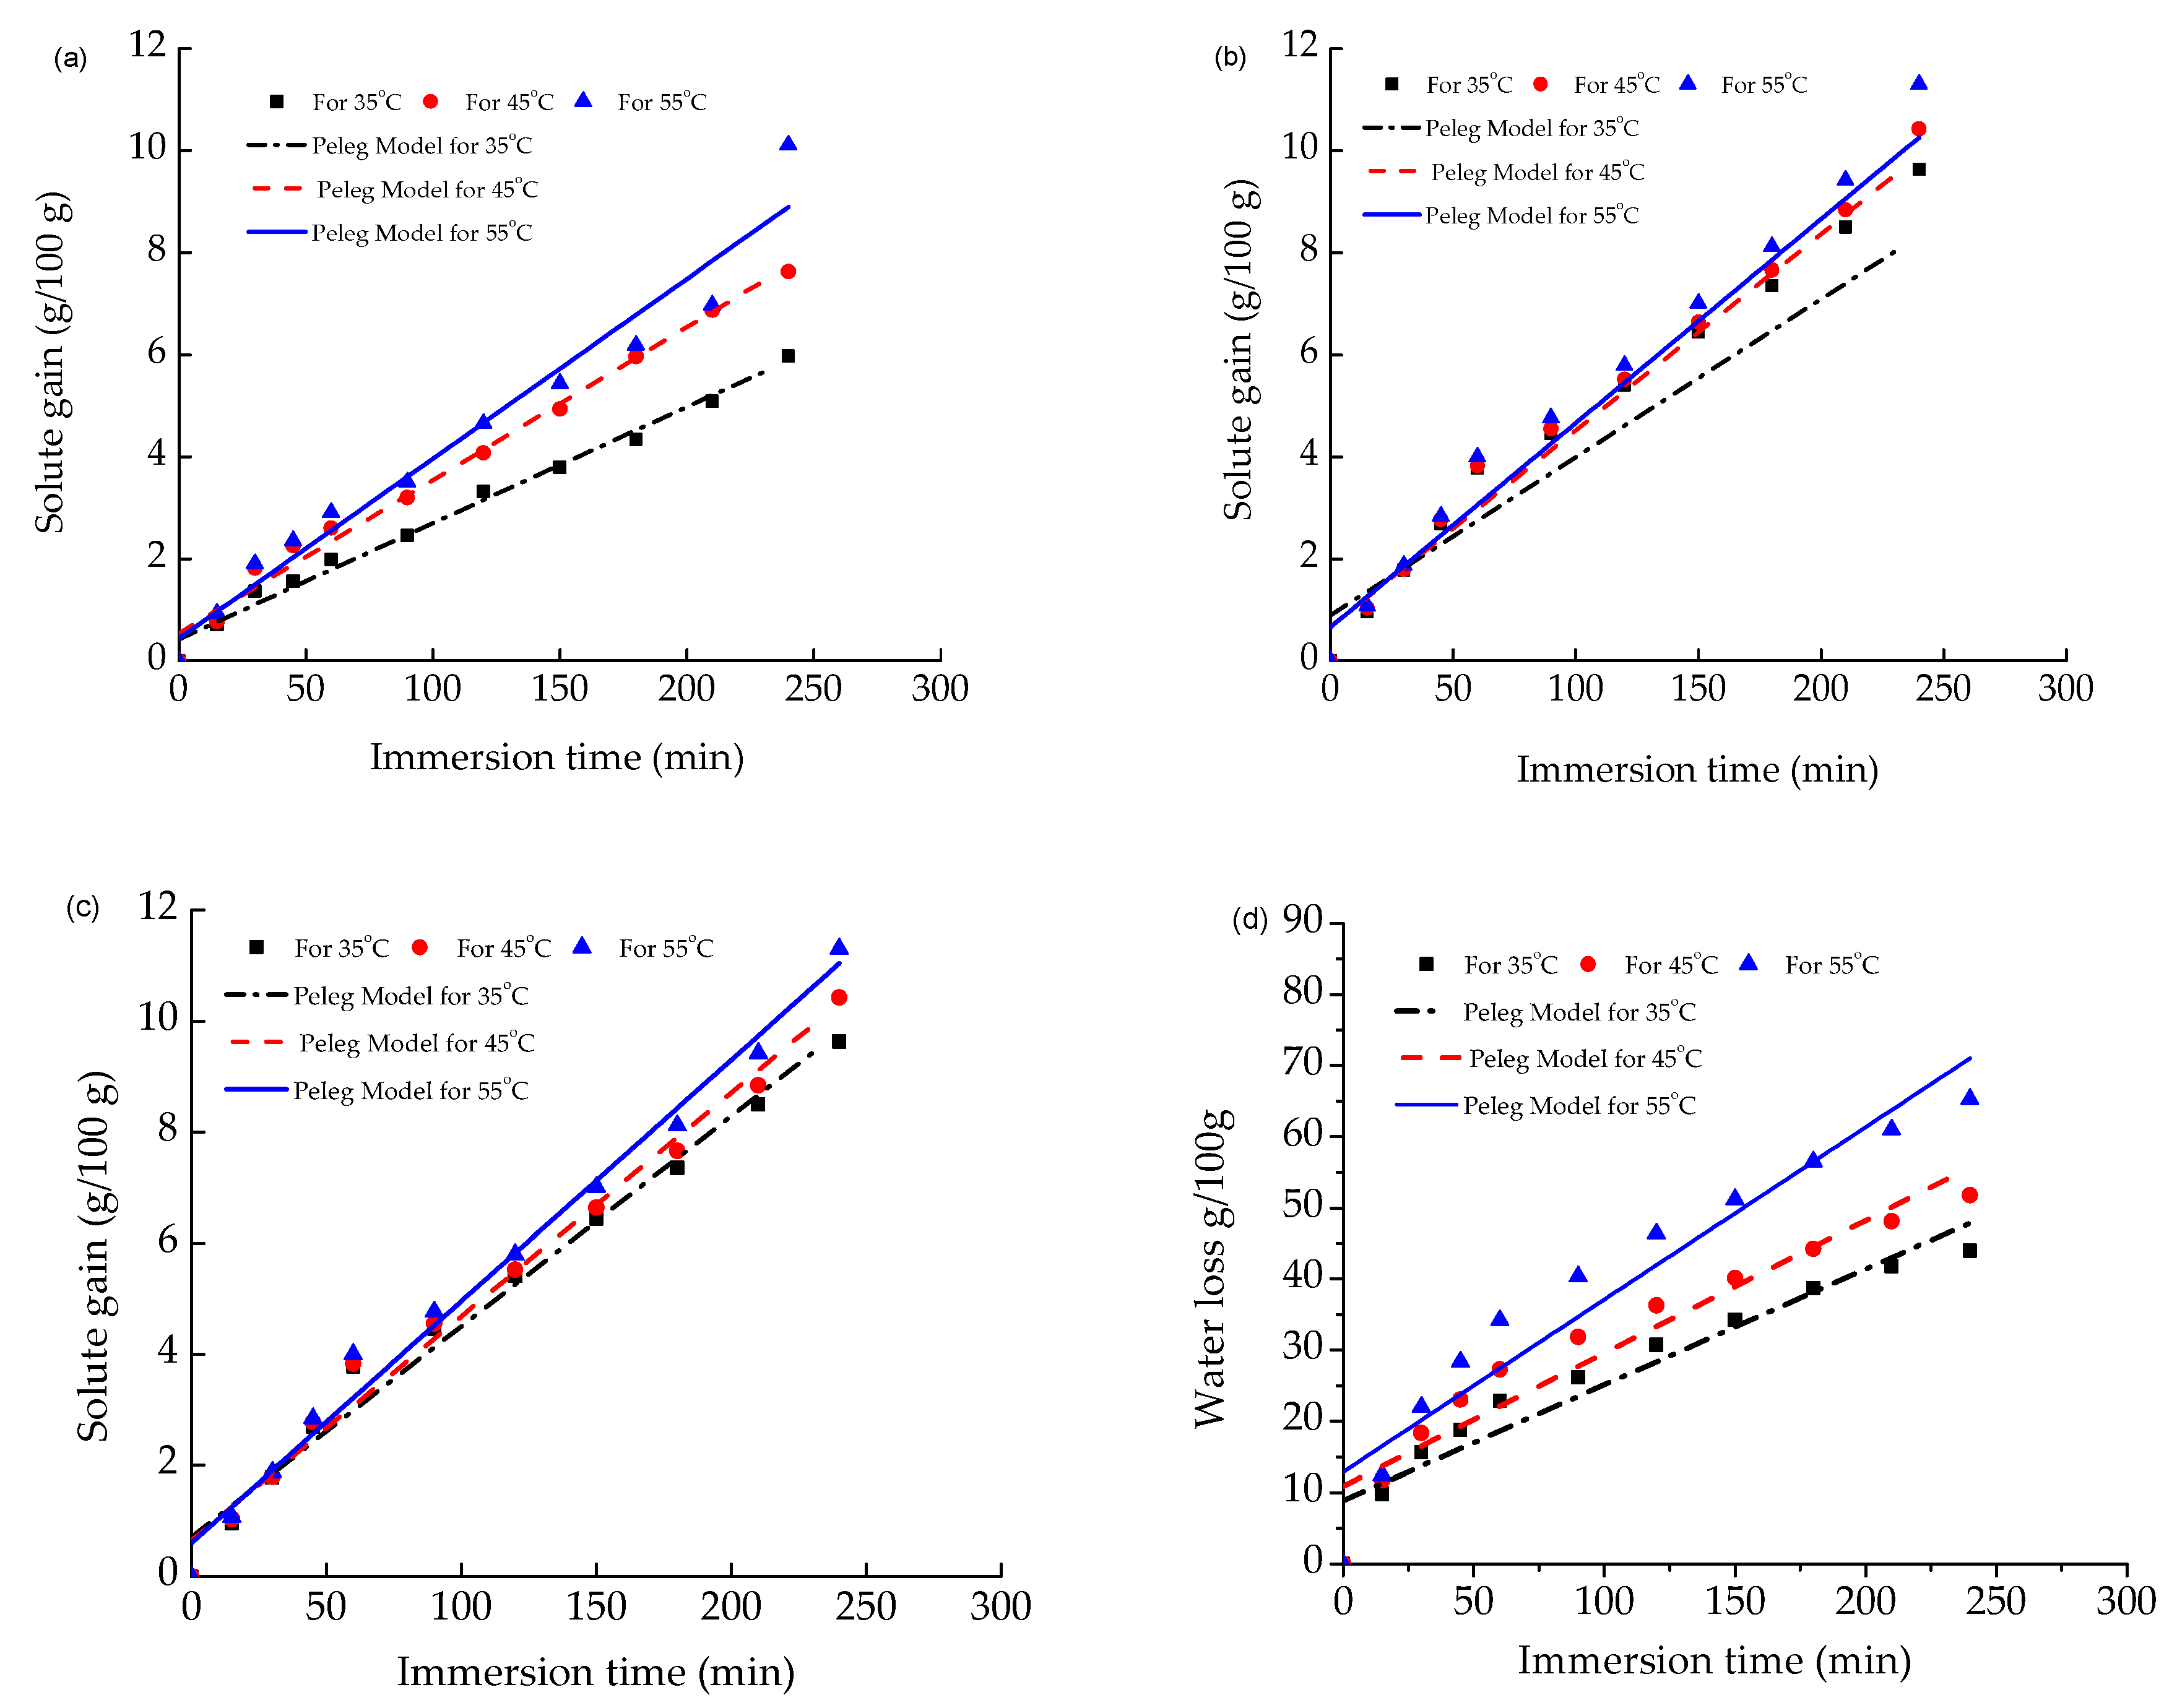
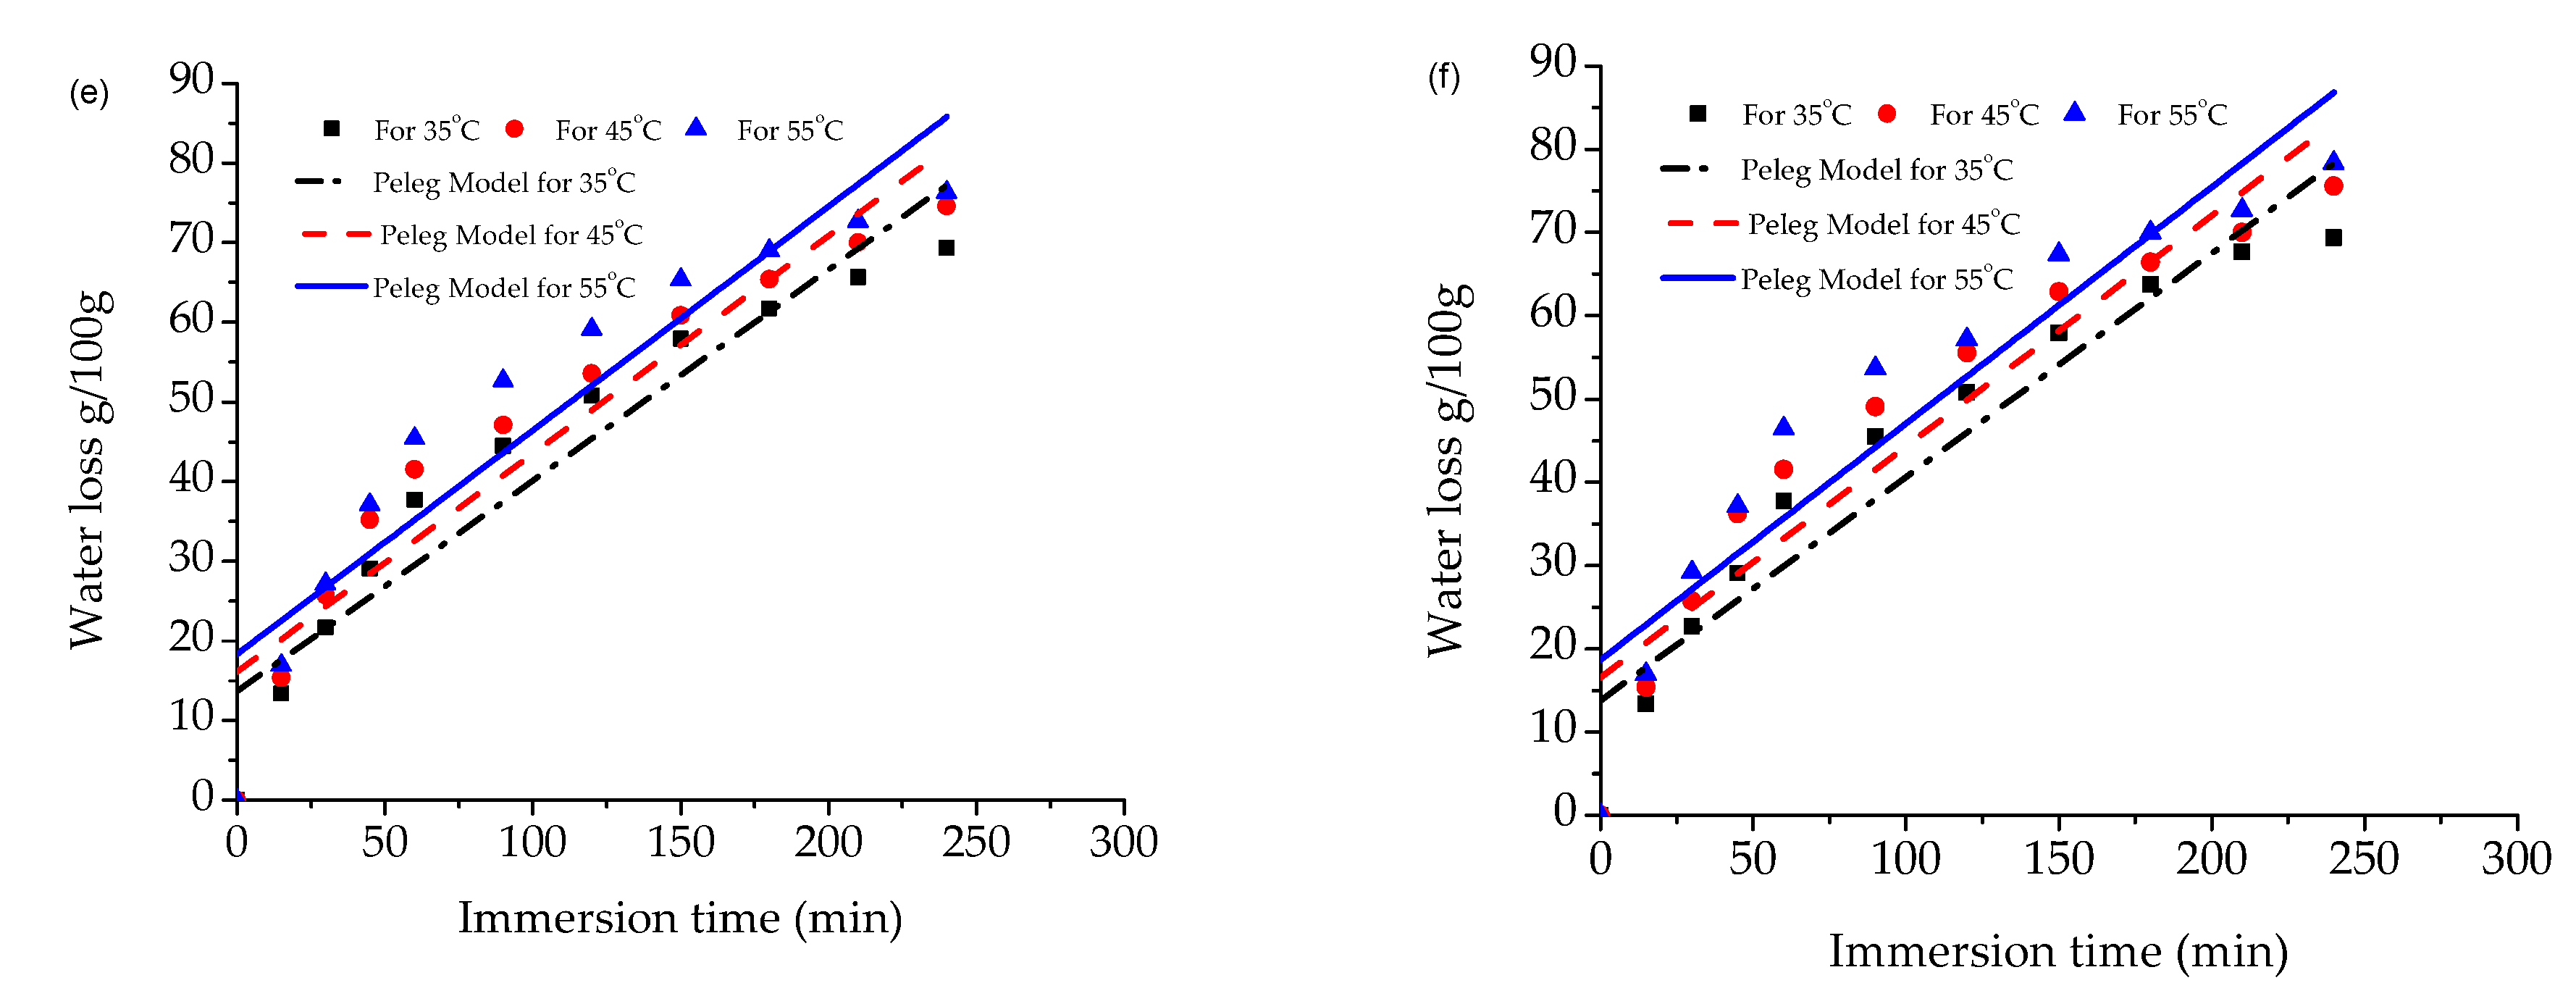
3.1. Water Loss and Solute Gain of Papaya

The amount of water loss and the solute gain of papaya during osmotic dehydration with various concentrations of the osmotic solution are presented in Table 1. The results demonstrated that water loss and solute gain rates were higher at initial stages of osmosis and in later stages they were increased slowly, as presented in Figure 1. This pattern of water loss and solute gain may be due to the immersion time progressed; the water migrated from the sample to solution and solute from solution to sample which decreased the concentration gradient between the solution and the solid content of papaya. Our results were in accordance with the findings reported by Mundada et al. [25] for osmotic dehydration of pomegranate arils and osmotic dehydration of apple slices [26]. Assis et al. [27] reported that WL and SG of apple cubes increased rapidly at the beginning of the osmotic dehydration process. The increase in water loss and the solute gain was also observed with the increased concentration of the osmotic solution.
The papaya sample showed higher water loss and a greater solute gain at 60 °Bx concentration compared to those which were immersed to 50 °Bx and 40 °Bx osmotic solutions respectively as shown in Table 1. This might be due to osmotic driving force potential increasing between the osmotic solution and the papaya. Falade et al. [28] and Mundada et al. [25] also reported that an increase in the concentration of osmotic solution that increased the concentration gradient and which turned into the driving force for osmosis. It was also worth noticing that the values of moisture content and water loss were on the similar level during dehydration in 40 °Bx concentrated solution at the highest temperature and in 50 °Bx at the lowest temperature.
Water loss and solute gain increased with an increase in osmotic solution temperature. The highest water loss and solute gain were observed at 55 °C and lowest water loss and solute gain were observed at 35 °C. Increase in temperature might be the reason which decreased the viscosity of the osmotic solution, decreases the external resistance to mass transfer rate at the sample surface. Thus, facilitating the outflow of water. Mundada et al. [25] and Ciurzyńska et al. [29] also reported that with an increase in temperature of an osmotic solution increased the water loss and solute gain of different fruit samples. Consequently, the moisture content of the sample decreased, and °Brix content of the sample increased at a higher concentration of the osmotic solutions and temperature as well. This phenomenon can be explained as the effect of osmotic pressure on mass transfer, resulting in the removal of water from the tissue of papaya and replaced by soluble solids [30]. The average moisture lower content at 40 °Bx, 50°Bx and 60 °Bx were found as 72.35%, 67.35% and 57.59% respectively when the samples were treated at the highest temperature (55 °C). This was due to the high concentration of osmotic solution resulting in the removal of more water from the tissue of papaya. Our findings were in accordance with findings reported by Silva et al. and Kaushal and Sharma [31,32]. The average total soluble solid contents varied from 21.60–33.17 °Bx.

3.2. Validation of Empirical Models for Water Loss and Solute Gain

The experimental data were fitted to the two different osmotic dehydration models and the results of the models were compared with the predicted values. The Peleg and Penetration models were widely used to determine the mass transfer phenomena of osmotically pretreated samples [12,25,33]. The major advantage of the Peleg model is to save time by predicting mass transfer kinetics of foods including equilibrium moisture content using short-time experimental data [34]. The assumption for the current study was that the Peleg model would predict the solute gain and water kinetics of papaya cubes. These two models were used for mass transfer kinetics because that model contained simplified parameters with less constant and showed a better outcome [25].
To evaluate the goodness fit of the Peleg and Penetration models, the experimental data were analyzed by non-linear regression and data are presented in Table 2 and Table 3. The statistical analysis i.e., R2, X2, RMSE, and %E of both the models were carried out. The Peleg and Penetration models, which one having the higher R2 values and lower X2, RMSE, and %E values were used as the basis for selecting the best model for describing the OD characteristics of the papaya cubes. According to the data in Table 2, the Penetration models showed a good fit for the water loss during the OD process (Figure 1a–c) whereas the WL and SG characteristics were satisfactorily fitted by Peleg model (Figure 2). Assis et al. [27], Cichowska et al. [26] and Mundada et al. [25] reported that Peleg model showed the good fit for the WL and SG during osmotic dehydration of apples and pomegranate arils. The Penetration model showed lack of fit for the solute gain behavior during OD process due to lower R2 values and higher X2, RMSE, and %E values. This may be due to the lack of constant parameters. The values of Peleg rate constant K1 was varied from 6.784 to 17.233 min−1 and 0.422 to 0.892 min−1 for water loss and solute gain respectively. The Peleg model constant K1 (1/min) value describe the initial dehydration rate [26] and K2 values represents the equilibrium water content the higher water removal indicates the lower K2 values. The parameter K1 of the Peleg’s model decreased as increased of the temperature of the osmotic solution and consequently greater water loss occurred during the OD process at 60 °Bx and 55 °C. The behavior of K1 in relation to the temperature was in agreement with the results reported by Assis et al. [27]. Our results indicated that the increasing temperature and concentration of the osmotic solution, the WL and SG increased and K1 and K2 values were decreased (Table 3). The similar characteristics of the Peleg model parameters were reported by Cichowska et al. [26] for the osmotic dehydration of Apple. In penetration model values of penetration rate constant (K) was found in the ranges from 2.839 to 5.1982 min−1 for water loss and 0.322 to 0.596 min−1 for solute gain. The results are in accordance with the findings reported for the osmotic dehydration of cherry tomato by Azoubel and Murr [33].

3.3. Effective Diffusivity of Water

The effective diffusivity of water loss and solute gain was calculated by the Fickian diffusion model. The average effective diffusivity of water loss varied from 2.25 × 10⁻⁹ to 4.31 × 10⁻⁹ m2/s and solute gain was varied from 3.01 × 10⁻⁹ m2/s to 5.31 × 10⁻⁹ m2/s during the OD process at the different temperature ranges of 35, 45 and 55 °C and different concentration of 40, 50 and 60 °Bx (Table 4). With the increasing temperature, the effective diffusivity for WL and SG were increased. This indicated that higher temperature promoted a greater diffusion of water and solute in the OD process and also increased the rate of mass transfer [27].
The higher De of WL and SG was found in the sucrose solution at 60 °Bx and 55 °C. It can be noted that the diffusion enhanced by higher solute concentration and temperature. It is difficult to compare the diffusivities reported in the literature because of the different physical structure food matrix and the applications of various models. The De values for osmotically dehydrated pears in ranged from 0.35 × 10⁻⁹ m2/s to 1.92 × 10⁻⁹ m2/s for water loss and 0.20 × 10⁻⁹ m2/s to 3.60 × 10⁻⁹ m2/s for solute gain at different temperature (40–60 °C) [35]. Our results showed the higher values of diffusivity of water loss than results reported by El-Aouar et al. [36] who found the diffusion coefficient for water loss of papaya in the ranged from 1.03 × 10⁻⁹ to 1.78 × 10⁻⁹ m2/s.

3.4. Physicochemical Properties of Osmotically Pretreated Air-Dried Papaya

The physicochemical properties of osmotically dehydrated air-dried papaya are presented in Table 5. The average moisture content and water activity of the control samples were 7.45% and 0.37 respectively. The osmotically pretreated samples showed lower moisture content and water activity than the control samples. The concentration and temperature of the OD process showed a great impact on the moisture content and water activity during convective drying. The samples treated with 60 °Bx and 55 °C OD showed the lowest moisture (3.67%) and water activity (0.29) than the other samples. All the hot air-dried osmotically pretreated papaya samples showed water activity below 0.37. Spoilage microorganisms can’t grow at the lower water activity level [37]. Thus, we can preserve dried papaya for a long time by keeping the water activity at a minimum level. The water activities among the samples and among the treatments were not significantly varied in osmotically treated samples at a higher concentration (p ≤ 0.05).
After convective drying of all the papaya samples were investigated the shrinkage by determining the density and volume of the samples. Results indicated that the control sample showed a higher percentage of shrinkage than the treated samples, as shown in Table 5. This may be due the larger reduction of moisture during drying process and osmotic solution act as coating to reduce the shrinkage of the treated sample [22,38]. The samples treated with higher concentrated osmotic solution showed lesser shrinkage after convective drying. But the temperature of all the osmotic solutions had less influence on the shrinkage of the papaya samples. The similar findings were reported by Biosci et al. [39] during osmotic dehydration and hot air drying of “Quince”.
The rehydration ratio indicates the measurement of the induced damage of the samples during drying. The reconstitution of the dried product depends on the internal structure and the extent to which the water-holding component has been damaged during drying [20]. The present study showed that samples that were treated in higher osmotic solution and the higher temperature had a greater rehydration ratio than the control as shown in Table 5. According to Laura C Okpala [40], the higher values of the rehydration ratio indicated the good quality of the dried fruit due to the pores allow water to reenter the cells.

3.5. Effect of Osmotic Dehydration Pretreatments on the Bioactive Compounds of Air-Dried Papaya

3.5.1. Ascorbic Acid

The osmotically pretreated hot air-dried papaya samples were analyzed for their antioxidant properties. The results are presented in Table 6. The ascorbic acid (Vitamin C) in a fresh sample was found to be 42.14 ± 1.96 (mg/100 g d.w.). The ascorbic acid content of the fresh samples was significantly different to the dried samples (at p ≤ 0.05). The osmotic pretreatment had a great impact on the retentions of the heat sensitive compounds like ascorbic acid. The papaya samples treated with a higher concentration of the osmotic solution and lower temperature showed a greater amount of ascorbic acid after drying. The findings of the present study corresponded with the study conducted by Garcia et al. [21] and El-Ishaq et al. [41] during the drying of fruits with pretreatments. Ascorbic acid of all the treated samples varied from 17.44 to 36.56 mg/100 g d.w. The lowest ascorbic acid was found at 40 °Bx and 55 °C and the amount was about 17.44 mg/100 g d.w. The higher losses of ascorbic acid were found in the samples which were treated with lowest concentration of the osmotic solution. This may be because the lower concentration of the osmotic solution could not efficiently coat the surface of the sample and, consequently, greater degradation of ascorbic acid occurred during drying.

3.5.2. Total Phenolic Content (TPC)

After osmotic pretreatment, total phenolic content (TPC) of papaya decreased. In the fresh ripe papaya, TPC was about 73.33 ± 1.64 mg GAE/100 g d.w whereas the osmotically pretreated hot air-dried papaya contained TPC were in the ranges of 26.01 ± 1.06 to 67.47 ± 3.53 mgGAE/100 g d.w. The reduction of total phenolic compounds after the OD process and drying was due to the migration of phenolic compounds from papaya cubes to osmotic solution induced by osmotic driving force [38]. After the OD process and drying, the total phenolic content of the samples was significantly reduced than the fresh samples (at p ≤ 0.05) (Table 6). The higher amount of TPC (67.47 ± 3.53 mg GAE/100 g d.w.) was obtained in the samples when treated with 60 °Bx and 35 °C OD process. This may be due to the higher concentration of the osmotic solution efficiently coated the samples during OD process, as a result, less destruction of TPC was found after drying. Moreover, the lowest amount of TPC (26.01 ± 1.06 mg GAE/100 g d.w.) was found in the dried papaya samples when treated with lower concentration of osmotic solution and higher temperature of the OD process.

3.5.3. Antioxidant Activity (DPPH Assay %)

The free radical scavenging activity of a fruit sample is usually determined by DPPH assay. The impacts of antioxidants on DPPH radical scavenging is assumed because of their hydrogen donating capability. The higher antioxidant scavenging activity was obtained by reducing the larger amount of DPPH assay [42]. The antioxidant activity as DPPH of the fresh sample was found to be 91.39 ± 0.64% whereas the osmotically pretreated dried samples showed the values in the range from 34.16 to 50.99% (Table 6). The antioxidant activity of the dried samples was significantly reduced during OD and the drying process (p ≤ 0.05). This might be due to the higher temperature; some endogenous antioxidants could be destroyed [1]. Higher DPPH assay (%) were found in the sample pretreated with the 60 °Bx and 35 °C OD process, whereas lower DPPH assay (%) values were found at 40 °Bx and 55 °C.

4. Conclusions

Osmotic dehydration was conducted to evaluate the mass transfer kinetics and physicochemical properties of papaya. The rate of water loss and solute gain increased with the increase of osmotic solution concentration, time and temperature. It was found that the Peleg’s model was best fitted for the water loss and solute gain whereas the Penetration model showed good fits for water loss during the OD process. The results of the effective diffusivity of water and solute gain showed that the higher osmotic solution concentration and temperature promoted the greater diffusion of water from the fruit and larger solute gain during the OD process. The samples pretreated with higher sucrose solution and lower OD temperature exhibited less shrinkage and higher rehydration ability. The dried papaya sample showed the lowest moisture content and water activity, when the sample was pre-treated with a 60 °Brix and 35 °C OD process. These pretreated samples also retained the maximum antioxidant properties i.e., ascorbic acid, total phenolic content, and DPPH scavenging activity. The osmotic dehydration process at 60 °Brix and 35 °C can successfully be applied before drying for the retention of higher bioactive compounds; keeping the minimum moisture content and water activity and less shrinkage and better recognitional property of papaya fruit.

Author Contributions

M.Z.I. contributed to the investigation, supervision and writing-reviewing and editing. S.D. made a great contribution to formal analysis, data curation of the research work. K.M. and A.S.M.S. contributed to the review and editing of the manuscript.

Funding

University Research Center, Shahjalal University of Science and Technology, Bangladesh (Project Code: AS/2017/23).

Acknowledgments

The authors express their gratitude for providing financial support for this research to the University Research Center, Shahjalal University of Science and Technology, Bangladesh and Laboratory of the Department of Food Engineering and Tea Technology to carry out the research successfully.

Conflicts of Interest

The authors declare no conflict of interest.

References

  1. Udomkun, P.; Nagle, M.; Mahayothee, B.; Nohr, D.; Koza, A.; Müller, J. Influence of air drying properties on non-enzymatic browning, major bio-active compounds and antioxidant capacity of osmotically pretreated papaya. LWT Food Sci. Technol. 2015, 60, 914–922. [Google Scholar] [CrossRef]
  2. Dhall, R.K. Advances in edible coatings for fresh fruits and vegetables: A review. Crit. Rev. Food Sci. Nutr. 2013, 53, 435–450. [Google Scholar] [CrossRef] [PubMed]
  3. Hasan, K. A Guide to Postharvest Handling of Fruits and Vegetables. Bangladesh. Available online: http://fpmu.gov.bd/agridrupal/sites/default/files/Postharvest Handling Guide.pdf (accessed on 10 January 2019).
  4. Oliveira, S.M.; Brandão, T.R.S.; Silva, C.L.M. Influence of Drying Processes and Pretreatments on Nutritional and Bioactive Characteristics of Dried Vegetables: A Review. Food Eng. Rev. 2016, 8, 134–163. [Google Scholar] [CrossRef]
  5. Pereira, L.M.; Ferrari, C.C.; Mastrantonio, S.D.S.; Rodrigues, A.C.C.; Hubinger, M.D. Kinetic aspects, texture, and color evaluation of some tropical fruits during osmotic dehydration. Dry. Technol. 2006, 24, 475–484. [Google Scholar] [CrossRef]
  6. Rekha, C.; Poornima, G.; Manasa, M.; Abhipsa, V.; Devi, J.P.; Kumar, H.T.V.; Kekuda, T.R.P. Ascorbic Acid, Total Phenol Content and Antioxidant Activity of Fresh Juices of Four Ripe and Unripe Citrus Fruits. Chem. Sci. Trans. 2012, 1, 303–310. [Google Scholar] [CrossRef]
  7. Gallo, J.A.Q.; Amaro, M.R.D. Application of Edible Coatings to Improve Shelf-life of Mexican Guava. Acta Hortic. 2003, 599, 589–594. [Google Scholar] [CrossRef]
  8. Fernandes, F.A.N.; Gallão, M.I.; Rodrigues, S. Effect of osmotic dehydration and ultrasound pre-treatment on cell structure: Melon dehydration. LWT Food Sci. Technol. 2008, 41, 604–610. [Google Scholar] [CrossRef]
  9. Yousefi, A.R.; Aghdam, K.; Chenar, M.P.; Niakousari, M. The Kinetics of Forced Convective Air-drying of papaya (Carica papaya L.) Slices Pretreated in Osmotic Solution. Iran. Food Sci. Technol. 2013, 9, 270–278. [Google Scholar]
  10. Mia, M.A.B. Shahi papaya—Digital Herbarium of Crop Plants. Available online: http://dhcrop.bsmrau.net/shahi-papaya/ (accessed on 21 March 2019).
  11. Ozen, B.F.; Dock, L.L.; Ozdemir, M.; Floros, J.D. Processing factors affecting the osmotic dehydration of diced green peppers. Int. J. Food Sci. Technol. 2002, 37, 497–502. [Google Scholar] [CrossRef]
  12. Singh, B.; Kumar, A.; Gupta, A.K. Study of mass transfer kinetics and effective diffusivity during osmotic dehydration of carrot cubes. J. Food Eng. 2007, 79, 471–480. [Google Scholar] [CrossRef]
  13. Peleg, M. An Empirical Model for the Description Moisture Sorption Curves. J. Food Sci. 1988, 53, 1216–1217. [Google Scholar] [CrossRef]
  14. Lazarides, H.N.; Mavroudis, N.E. Kinetics of osmotic dehydration of a highly shrinking vegetable tissue in a salt-free medium. J. Food Eng. 1996, 30, 61–74. [Google Scholar] [CrossRef]
  15. Crank, J. Mathematics of Diffusion, 2nd ed.; Oxford University Press: London, UK, 1975; pp. 104–254. [Google Scholar]
  16. Sharma, G.; Prasad, S. Effective moisture diffusivity of garlic cloves undergoing microwave-convective drying. J. Food Eng. 2004, 65, 609–617. [Google Scholar] [CrossRef]
  17. McMinn, W.A.M.; McLoughlin, C.M.; Magee, T.R.A. Thin-Layer Modeling of Microwave, Microwave-Convective, and Microwave-Vacuum Drying of Pharmaceutical Powders. Dry. Technol. 2005, 23, 513–532. [Google Scholar] [CrossRef]
  18. AOAC. Official Methods of Analysis, 15th ed.; Association of Official Analytical Chemists: Washington, DC, USA, 2004. [Google Scholar]
  19. Arabhosseini, A.; Huisman, W.; van Boxtel, A.; Müller, J. Modeling of the equilibrium moisture content (EMC) of tarragon (Artemisia dracunculus L.). Int. J. Food Eng. 2005, 1. [Google Scholar] [CrossRef]
  20. Doymaz, İ. Drying kinetics, rehydration and colour characteristics of convective hot-air drying of carrot slices. Heat Mass Transf. 2017, 53, 25–35. [Google Scholar] [CrossRef]
  21. Garcia, C.C.; Caetano, L.C.; de Souza Silva, K.; Mauro, M.A. Influence of edible coating on the drying and quality of papaya (Carica papaya). Food Bioprocess Technol. 2014, 7, 2828–2839. [Google Scholar] [CrossRef]
  22. Saikia, S.; Mahnot, N.K.; Mahanta, C.L. Effect of Spray Drying of Four Fruit Juices on Physicochemical, Phytochemical and Antioxidant Properties. J. Food Process. Preserv. 2015, 39, 1656–1664. [Google Scholar] [CrossRef]
  23. Ranganna, S. 2,6 Dichlorophenol Indophenol Visual Titration Method. In Handbook of Analysis and Quality Control for Fruit and Vegetable Products; Tata McGraw-Hill: New Delhi, India, 1986; pp. 105–106. [Google Scholar]
  24. Slinkard, K.; Singleton, V. Total phenol analysis: Automation and comparison with manual methods. Am. J. Enol. Vitic. 1977, 28, 49–55. [Google Scholar]
  25. Mundada, M.; Hathan, B.S.; Maske, S. Mass Transfer Kinetics during Osmotic Dehydration of Pomegranate Arils. J. Food Sci. 2011, 76, E31–E39. [Google Scholar] [CrossRef]
  26. Cichowska, J.; Figiel, A.; Stasiak-RóZáNska, L.; Witrowa-Rajchert, D. Modeling of Osmotic Dehydration of Apples in Sugar Alcohols and Dihydroxyacetone (DHA) Solutions. Foods 2019, 8, 20. [Google Scholar] [CrossRef] [PubMed]
  27. Assis, F.R.; Morais, R.M.; Morais, A.M. Mathematical Modelling of Osmotic Dehydration Kinetics of Apple Cubes. J. Food Process. Preserv. 2017, 41, e12895. [Google Scholar] [CrossRef]
  28. Falade, K.O.; Igbeka, J.C.; Ayanwuyi, F.A. Kinetics of mass transfer, and colour changes during osmotic dehydration of watermelon. J. Food Eng. 2007, 80, 979–985. [Google Scholar] [CrossRef]
  29. Ciurzyńska, A.; Cichowska, J.; Kowalska, H.; Czajkowska, K.; Lenart, A. Osmotic dehydration of Braeburn variety apples in the production of sustainable food products. Int. Agrophys. 2018, 32, 141–146. [Google Scholar] [CrossRef]
  30. Chiralt, A.; Talens, P. Physical and chemical changes induced by osmotic dehydration in plant tissues. J. Food Eng. 2005, 67, 167–177. [Google Scholar] [CrossRef]
  31. Silva, K.S.; Garcia, C.C.; Amado, L.R.; Mauro, M.A. Effects of Edible Coatings on Convective Drying and Characteristics of the Dried Pineapple. Food Bioprocess Technol. 2015, 8, 1465–1475. [Google Scholar] [CrossRef]
  32. Kaushal, P.; Sharma, H.K. Osmo-convective dehydration kinetics of jackfruit (Artocarpus heterophyllus). J. Saudi Soc. Agric. Sci. 2016, 15, 118–126. [Google Scholar] [CrossRef]
  33. Azoubel, P.M.; Murr, F.E.X. Mass transfer kinetics of osmotic dehydration of cherry tomato. J. Food Eng. 2004, 61, 291–295. [Google Scholar] [CrossRef]
  34. Tang, X.; Nail, S.L.; Pikal, M.J. Freeze-drying process design by manometric temperature measurement: Design of a smart freeze-dryer. Pharm. Res. 2005, 22, 685–700. [Google Scholar] [CrossRef] [PubMed]
  35. Park, K.J.; Bin, A.; Pedro, F.; Brod, R.; Hae, T.; Brandini, K. Osmotic dehydration kinetics of pear D’ anjou (Pyrus communis L.). J. Food Eng. 2002, 52, 293–298. [Google Scholar] [CrossRef]
  36. El-Aouar, Â.A.; Azoubel, P.M.; Murr, F.E.X. Drying kinetics of fresh and osmotically pre-treated papaya (Carica papaya L.). J. Food Eng. 2003, 59, 85–91. [Google Scholar] [CrossRef]
  37. Sperber, W.H. Influence of Water Activity on Foodborne Bacteria-A Review. J. Food Prot. 1983, 46, 142–150. [Google Scholar] [CrossRef]
  38. Bchir, B.; Besbes, S.; Karoui, R.; Attia, H.; Paquot, M.; Blecker, C. Effect of Air-Drying Conditions on Physico-chemical Properties of Osmotically Pre-treated Pomegranate Seeds. Food Bioprocess Technol. 2012, 5, 1840–1852. [Google Scholar] [CrossRef]
  39. Biosci, I.J.; Akbarian, M.; Moayedi, F.; Ghasemkhani, N.; Ghaseminezhad, A. Impact of antioxidant edible coatings and osmotic dehydration on shrinkage and colour of “Quince” dried by hot air. Int. J. Biosci. 2014, 4, 27–33. [Google Scholar]
  40. Okpala, L.C.; Ekechi, C.A. Rehydration characteristics of dehydrated West African pepper (Piper guineense) leaves. Food Sci. Nutr. 2014, 2, 664–668. [Google Scholar] [CrossRef]
  41. El-Ishaq, A.; Obirinakem, S. Effect of Temperature and Storage on Vitamin C Content in Fruits Juice. Int. J. Chem. Biomol. Sci. 2015, 1, 17–21. [Google Scholar]
  42. Blois, M.S. Antioxidant Determinations by the Use of a Stable Free Radical. Nature 1958, 181, 1199–1200. [Google Scholar] [CrossRef]
Figure 1. Validation of Penetration model for water loss: (a) 40 °Bx, (b) 50 °Bx and (c) 60 °Bx at different temperatures.
Agriengineering 01 00016 g001
Figure 2. Validation of Peleg model for solute gain: (a) 40 °Bx, (b) 50 °Bx and (c) 60 °Bx and for water loss: (d) 40 °Bx, (e) 50 °Bx and (f) 60 °Bx at different temperatures.
Agriengineering 01 00016 g002aAgriengineering 01 00016 g002b
Table 1. Moisture content, total soluble solid, water loss and solute gain of osmotically pretreated Papaya.
Osmotic Solution Concentration (°Brix)Parameters
Solution Temperature (°C)Moisture Content (%)Total Soluble Solid (°Brix)Water Loss (g/100 g of Fresh Fruit)Solute Gain (g/100 g of Fresh Fruit)
403579.39 ± 0.02 a21.60 ± 0.20 d43.98 ± 0.02 h5.97 ± 0.04 e
4575.49 ± 0.32 b27.03 ± 0.06 c51.75 ± 0.03 g7.63 ± 0.05 d
5572.35 ± 0.09 c33.10 ± 0.10 a65.30 ± 0.01 f10.11 ± 0.01 b
503572.11 ± 0.09 c26.47 ± 0.12 c65.30 ± 0.04 f7.90 ± 0.03 d
4571.12 ± 0.11 c34.10 ± 0.10 a66.82 ± 0.02 e9.80 ± 0.02 c
5567.35 ± 0.07 d31.03 ± 0.06 b70.17 ± 0.05 c10.30 ± 0.03 b
603564.80 ± 0.02 e32.00 ± 0.10 b69.33 ± 0.02 d9.63 ± 0.02 c
4560.16 ± 0.05 f31.93 ± 0.12 b74.57 ± 0.03 b10.43 ± 0.04 b
5557.59 ± 0.05 g33.17 ± 0.06 a76.34 ± 0.04 a11.31 ± 0.02 a
The values are mean ± standard deviation (S.D.) of three independent determinations. The means with different superscript in a column within each concentration differs significantly (p ≤ 0.05).
Table 2. Various regression coefficient and statistical parameters of Penetration model.
Osmotic Solution Conc. (°Brix)Temp. (°C)Water LossSolute Gain
KR2χ2RMSEE%KR2χ2RMSEE%
40355.1980.990.080.0210.230.3220.931.211.02216.58
454.8990.990.040.0877.650.4220.923.211.01114.29
554.5620.990.070.0420.200.4770.874.782.01326.90
50354.7650.990.120.0438.960.4690.961.110.5408.10
454.4010.990.110.0562.160.5400.933.560.87314.59
554.2200.980.410.0762.820.5580.924.112.16016.02
60354.2970.990.020.0201.930.5370.932.121.02113.60
453.3290.990.050.0121.780.5910.923.672.01116.68
552.8390.990.060.0195.490.5960.914.322.21218.23
Table 3. Various regression coefficient and statistical parameters of Peleg model.
Osmotic Solution Conc. (°Brix)Temp. (°C)Water LossSolute Gain
K1K2R2χ2RMSEE%K1K2R2χ2RMSEE%
403517.2330.2230.960.050.0324.230.4220.0230.990.030.081.50
4514.7890.2120.950.040.0133.230.5390.0300.990.020.051.44
5512.3320.2450.950.070.0212.870.4390.0350.960.010.255.06
503515.4560.2240.940.050.0234.230.8920.0310.950.070.455.44
4512.3450.2210.960.030.0433.110.6710.0380.980.060.761.02
5511.4350.2030.980.070.0243.780.6610.0400.980.010.030.38
603510.3460.2260.960.040.0433.760.7090.0380.980.030.631.86
459.67430.1780.970.070.0112.670.6460.0400.990.020.041.05
556.7840.1450.980.080.0082.890.6020.0430.990.040.032.30
Table 4. Effective diffusivity of water during osmotic dehydration in different concentrations and temperatures.
Osmotic Solution Concentration (°Brix)Temperature (°C)DWL × 10−9 ± Margin of Error (m2/s)DSG × 10−9 ± Margin of Error (m2/s)
40352.25 ± 0.0323.01 ± 0.082
452.61 ± 0.0123.31 ± 0.022
552.89 ± 0.0403.71 ± 0.032
50352.89 ± 0.0113.94 ± 0.036
453.07 ± 0.0224.77 ± 0.043
553.28 ± 0.0135.37 ± 0.065
60353.20 ± 0.0144.20 ± 0.092
453.89 ± 0.0154.89 ± 0.062
554.31 ± 0.0085.61 ± 0.027
Table 5. Physical properties of osmotically pretreated and control air-dried papaya.
Osmotic Solution Concentration (°Brix)Parameters
Solution Temperature (°C)Moisture Content (%)Water ActivityShrinkage (%)Rehydration Ratio
Control (without OD)7.45 ± 0.12 a0.37 ± 0.02 a90.023.53 ± 0.13 d
40356.62 ± 0.04 b0.36 ± 0.02 a76.123.98 ± 0.04 d
456.21 ± 0.11 b0.33 ± 0.02 a74.323.43 ± 0.07 d
555.11 ± 0.06 c0.33 ± 0.01 a74.563.12 ± 0.11 e
50355.98 ± 0.15 b0.34 ± 0.02 a67.234.13 ± 0.08 c
455.10 ± 0.01 c0.32 ± 0.01 b65.343.87 ± 0.12 d
554.14 ± 0.10 d0.31 ± 0.01 b64.763.64 ± 0.05 d
60354.12 ± 0.04 d0.30 ± 0.02 b59.566.68 ± 0.51 a
454.23 ± 0.01 d0.29 ± 0.01 b58.325.87 ± 0.12 b
553.67 ± 0.03 e0.29 ± 0.01 b57.036.12 ± 0.21 a
The values are mean ± S.D of three independent determinations. The means with different lowercase superscripts in a column within each concentration differs significantly (p ≤ 0.05).
Table 6. Antioxidant properties of osmotically pretreated hot-ir dried papaya.
Osmotic Solution Concentration (°Brix)Osmotic Solution Temperature (°C)Total Phenolic Content (mgGAE/100 g d.w.)Ascorbic Acid (mg/100 g d.w.)DPPH Inhibition (%)
Fresh73.33 ± 1.64 a42.14 ± 1.96 a91.39 ± 0.64 a
403543.85 ± 2.14 b27.69 ±1.51 b42.59 ± 0.33 b
4541.85 ± 3.22 b22.30 ± 3.41 b36.05 ± 0.32 c
5526.01 ± 1.06 c17.44 ± 3.49 c34.16 ± 0.28 d
503545.81 ± 4.04 b29.30 ± 2.03 b48.09 ± 0.80 b
4549.57 ± 7.73 b26.95 ± 2.03 b39.99 ± 0.23 c
5529.20 ± 4.18 c20.22 ± 1.84 c37.89 ± 0.05 d
603567.47 ± 3.53 b36.56 ± 3.66 b50.99 ± 1.64 b
4565.09 ± 2.07 b30.62 ± 1.83 c46.04 ± 1.18 c
5546.39 ± 3.91 c23.84 ± 2.06 d39.46 ± 1.67 d
The values are mean ± SD of three independent determinations. The means with different lowercase superscripts in a column within each concentration differs significantly (p ≤ 0.05).

