Article

Characterizing and Predicting the Quality of Milled Rice Grains Using Machine Learning Models

by
Letícia de Oliveira Carneiro
1,
Paulo Carteri Coradi
1,2,3,*,
Dágila Melo Rodrigues
1,2,
Roney Eloy Lima
1,2,
Larissa Pereira Ribeiro Teodoro
3,
Rosana Santos de Moraes
1,2,
Paulo Eduardo Teodoro
3,
Marcela Trojahn Nunes
1,2,
Marisa Menezes Leal
1,2,
Lhais Rodrigues Lopes
1,
Tiago Arabites Vendrusculo
1,
Jean Carlos Robattini
1,
Anderson Henrique Soares
1 and
Nairiane dos Santos Bilhalva
1,2
1
Laboratory of Postharvest (LAPOS), Campus Cachoeira do Sul, Federal University of Santa Maria, Highway Taufik Germano 3013, Passo D’Areia, Cachoeira do Sul 96506-322, Brazil
2
Department Agricultural Engineering, Rural Sciences Center, Federal University of Santa Maria, Avenue Roraima 1000, Camobi, Santa Maria 97105-900, Brazil
3
Campus de Chapadão do Sul, Federal University of Mato Grosso do Sul, Chapadão do Sul 79560-000, Brazil
*
Author to whom correspondence should be addressed.
AgriEngineering 2023, 5(3), 1196-1215; https://doi.org/10.3390/agriengineering5030076
Submission received: 26 May 2023 / Revised: 21 June 2023 / Accepted: 29 June 2023 / Published: 4 July 2023
(This article belongs to the Special Issue Food Drying and Storage Technologies)

Abstract

:
Physical classification is the procedure adopted by the rice unloading, delivery, storage, and processing units for the commercial characterization of the quality of the grains. This step occurs mostly by the conventional method, which demands more time and specialized labor, and the results are subjective since the evaluation is visual. In order to make the operation faster, more accurate, and less dependent, non-destructive technologies and computational intelligence can be applied to characterize grain quality. Therefore, this study aimed to characterize and predict the quality of whole, processed rice grains, as well as classify any defects present. This was achieved by sampling from the upper and lower points of four silo dryers with capacities of up to 40,000 sacks. The grain samples had moisture contents of 16%, 17%, 18%, and 19% and were subjected to drying-aeration until reaching 12% moisture content (w.b.). Near-infrared spectroscopy technology and Machine Learning algorithm models (Artificial Neural Networks, decision tree algorithms Quinlan’s algorithm, Random Tree, REPTree, and Random Forest) were employed for this purpose. By analyzing Pearson’s correlation statistics, a strong negative correlation (R2 = 0.98) was found between moisture content and the yield of whole grains. Conversely, a strong positive correlation (R2 = 0.97) was observed between moisture content and classified physical defects across the various characterized physicochemical constituents. These findings indicate the effectiveness of near-infrared spectroscopy technology. The Random Tree model (RandT) successfully predicted the grain quality outcomes and is therefore recommended as the model of choice, obtained Pearson’s correlation coefficient (r = 0.96), mean absolute error (MAE = 0.017), and coefficient of determination (R2 = 0.92). The results obtained here reveal that the combination of near-infrared spectroscopy technology and Machine Learning algorithm models is an excellent non-destructive alternative to manual physical classification for characterizing the physicochemical quality of whole and defective rice grains.

1. Introduction

The classification step is responsible for characterizing the physical quality of the grains by manually separating the physical defects. Physical defects can come from the crop, for example, due to weather conditions (fermented, burnt, and moldy grains), cultivar type (chalky grain), or due to harvesting processes (broken rice), as well as physical defects can appear or worsen in the post-harvest stages. Regardless of the stage, for quality standardization, there are specific regulations, which attribute maximum levels of defects, as well as specifications for product marketing [1]. During the classification process, the grains with defects are visually identified, classified according to the specific standard, and then removed from the sample [2,3]. The conventional classification process demands more processing time and specialized labor, which can directly interfere with the logistics and flow of the grain mass at the pre-processing and storage unit. Moreover, physical evaluations are often subjective and can lead to errors, impacting the quality of the commercialized product.
To meet this demand, the need for new studies to evaluate technologies for indirect measurement of grain quality has emerged, so that the process becomes faster and more assertive. Non-destructive technologies and computational intelligence algorithms have been applied for characterizing the qualitative parameters of agricultural products [4,5]. Among the currently available technologies, near-infrared spectroscopy (NIR) is one of the most addressed and applied for agricultural product evaluation. Near-infrared spectroscopy is a highly flexible form of analysis that can be used in a wide range of research and industrial process applications. NIR spectroscopy is a method that uses the near-infrared region of the electromagnetic spectrum (from about 700 to 2500 nanometers). By measuring scattered light from and through a sample, NIR reflectance spectra can be used to quickly determine the properties of a material without altering the sample [4]. Scientists applied this technology in the evaluation of rice grains and they are achieving 93% accuracy [4]. Furthermore, the NIR technology obtained satisfactory results in the evaluation of rice quality for different cultivars and fertilizer levels [1].
The use of Machine Learning (ML) algorithms has also presented expressive outcomes when applied to predict the quality of agricultural products. Machine learning focuses on the principle that all complex data points can be mathematically linked by computer systems, provided they have enough data and computing power to process those data. In this context, the use of ML algorithms has offered greater capacity for processing, analyzing, and interpreting data [6]. When properly modeled, ML techniques can offer responses in less time when compared to statistical regression models. Overall, the main algorithms that have been applied in agricultural studies are: Artificial Neural Networks, Decision Trees, Random Forest, and Support Vector Machines [7,8]. Random Forest (RF) is an ML technique successfully used in yield forecasting and quality assessment [9]. This model proved to be an effective and easier-to-use method for predicting corn and wheat quality when compared to multiple linear regression models. Artificial Neural Networks (ANN) is another model that can be trained from data related to corresponding inputs and outputs [10]. ANNs are useful tools for the analysis and interpretation of complex food security data, and predictions of physical and chemical seed quality. During the last few years, research has investigated the results of using ML methods for classification within the context of agricultural problems, such as the prediction of nitrogen content [11], soil correction, seed classification [12], phosphorus reduction in wastewater [13], protein prediction in stored grains [14].
Some authors utilizing computational intelligence obtained positive results for soybean seed quality prediction, highlighting the speed of analysis compared to conventional methods [7]. Similarly, Lutz and Coradi [8] verified that the use of ML techniques predicts the deterioration of stored grains, assisting in decision-making. Moreover, Kiratiratanapruk et al. [15] used and developed computational intelligence techniques to classify rice grain varieties, obtaining accuracies above 90% for different models. Therefore, the NIR and ML technologies have a wide and successful application in the characterization and qualitative prediction of different agricultural products, and are of paramount relevance particularly for rice grains, due to the rigorous standardization requirements, justified by the way of commercializing the product and the level of market demand.
In order to reduce errors and the time for decision-making on the quality of rice batches received or shipped from processing and storage units, due to the subjectivity of visual and manual physical classification, the application of the technique of measurement by NIR and prediction by ML models. Therefore, understanding the physical-chemical parameters of rice grains through non-destructive and prediction technologies enables the replacement of the conventional method of physical classification. As a hypothesis, characterizing the quality of whole and defective rice grains by being analyzed through non-destructive technology and with the aid of ML algorithms makes the operation more assertive, fast, and independent of visual evaluations. Thus, the objective of this study was to evaluate the application of near-infrared spectroscopy and Machine Learning models for characterizing and predicting the quality of whole and defective rice grains to replace the conventional method of physical classification. Specifically, we aimed to: (i) physically characterize the quality of rice through manual physical classification; (ii) evaluate the physicochemical quality of whole and defective rice grains for different water contents using near-infrared spectroscopy; (iii) predict the physicochemical quality of whole and defective rice grains for different water contents by applying ML algorithms; and (iv) evaluate the performance of near-infrared spectroscopy combined with ML as an alternative to conventional rice grain classification methods.

2. Materials and Methods

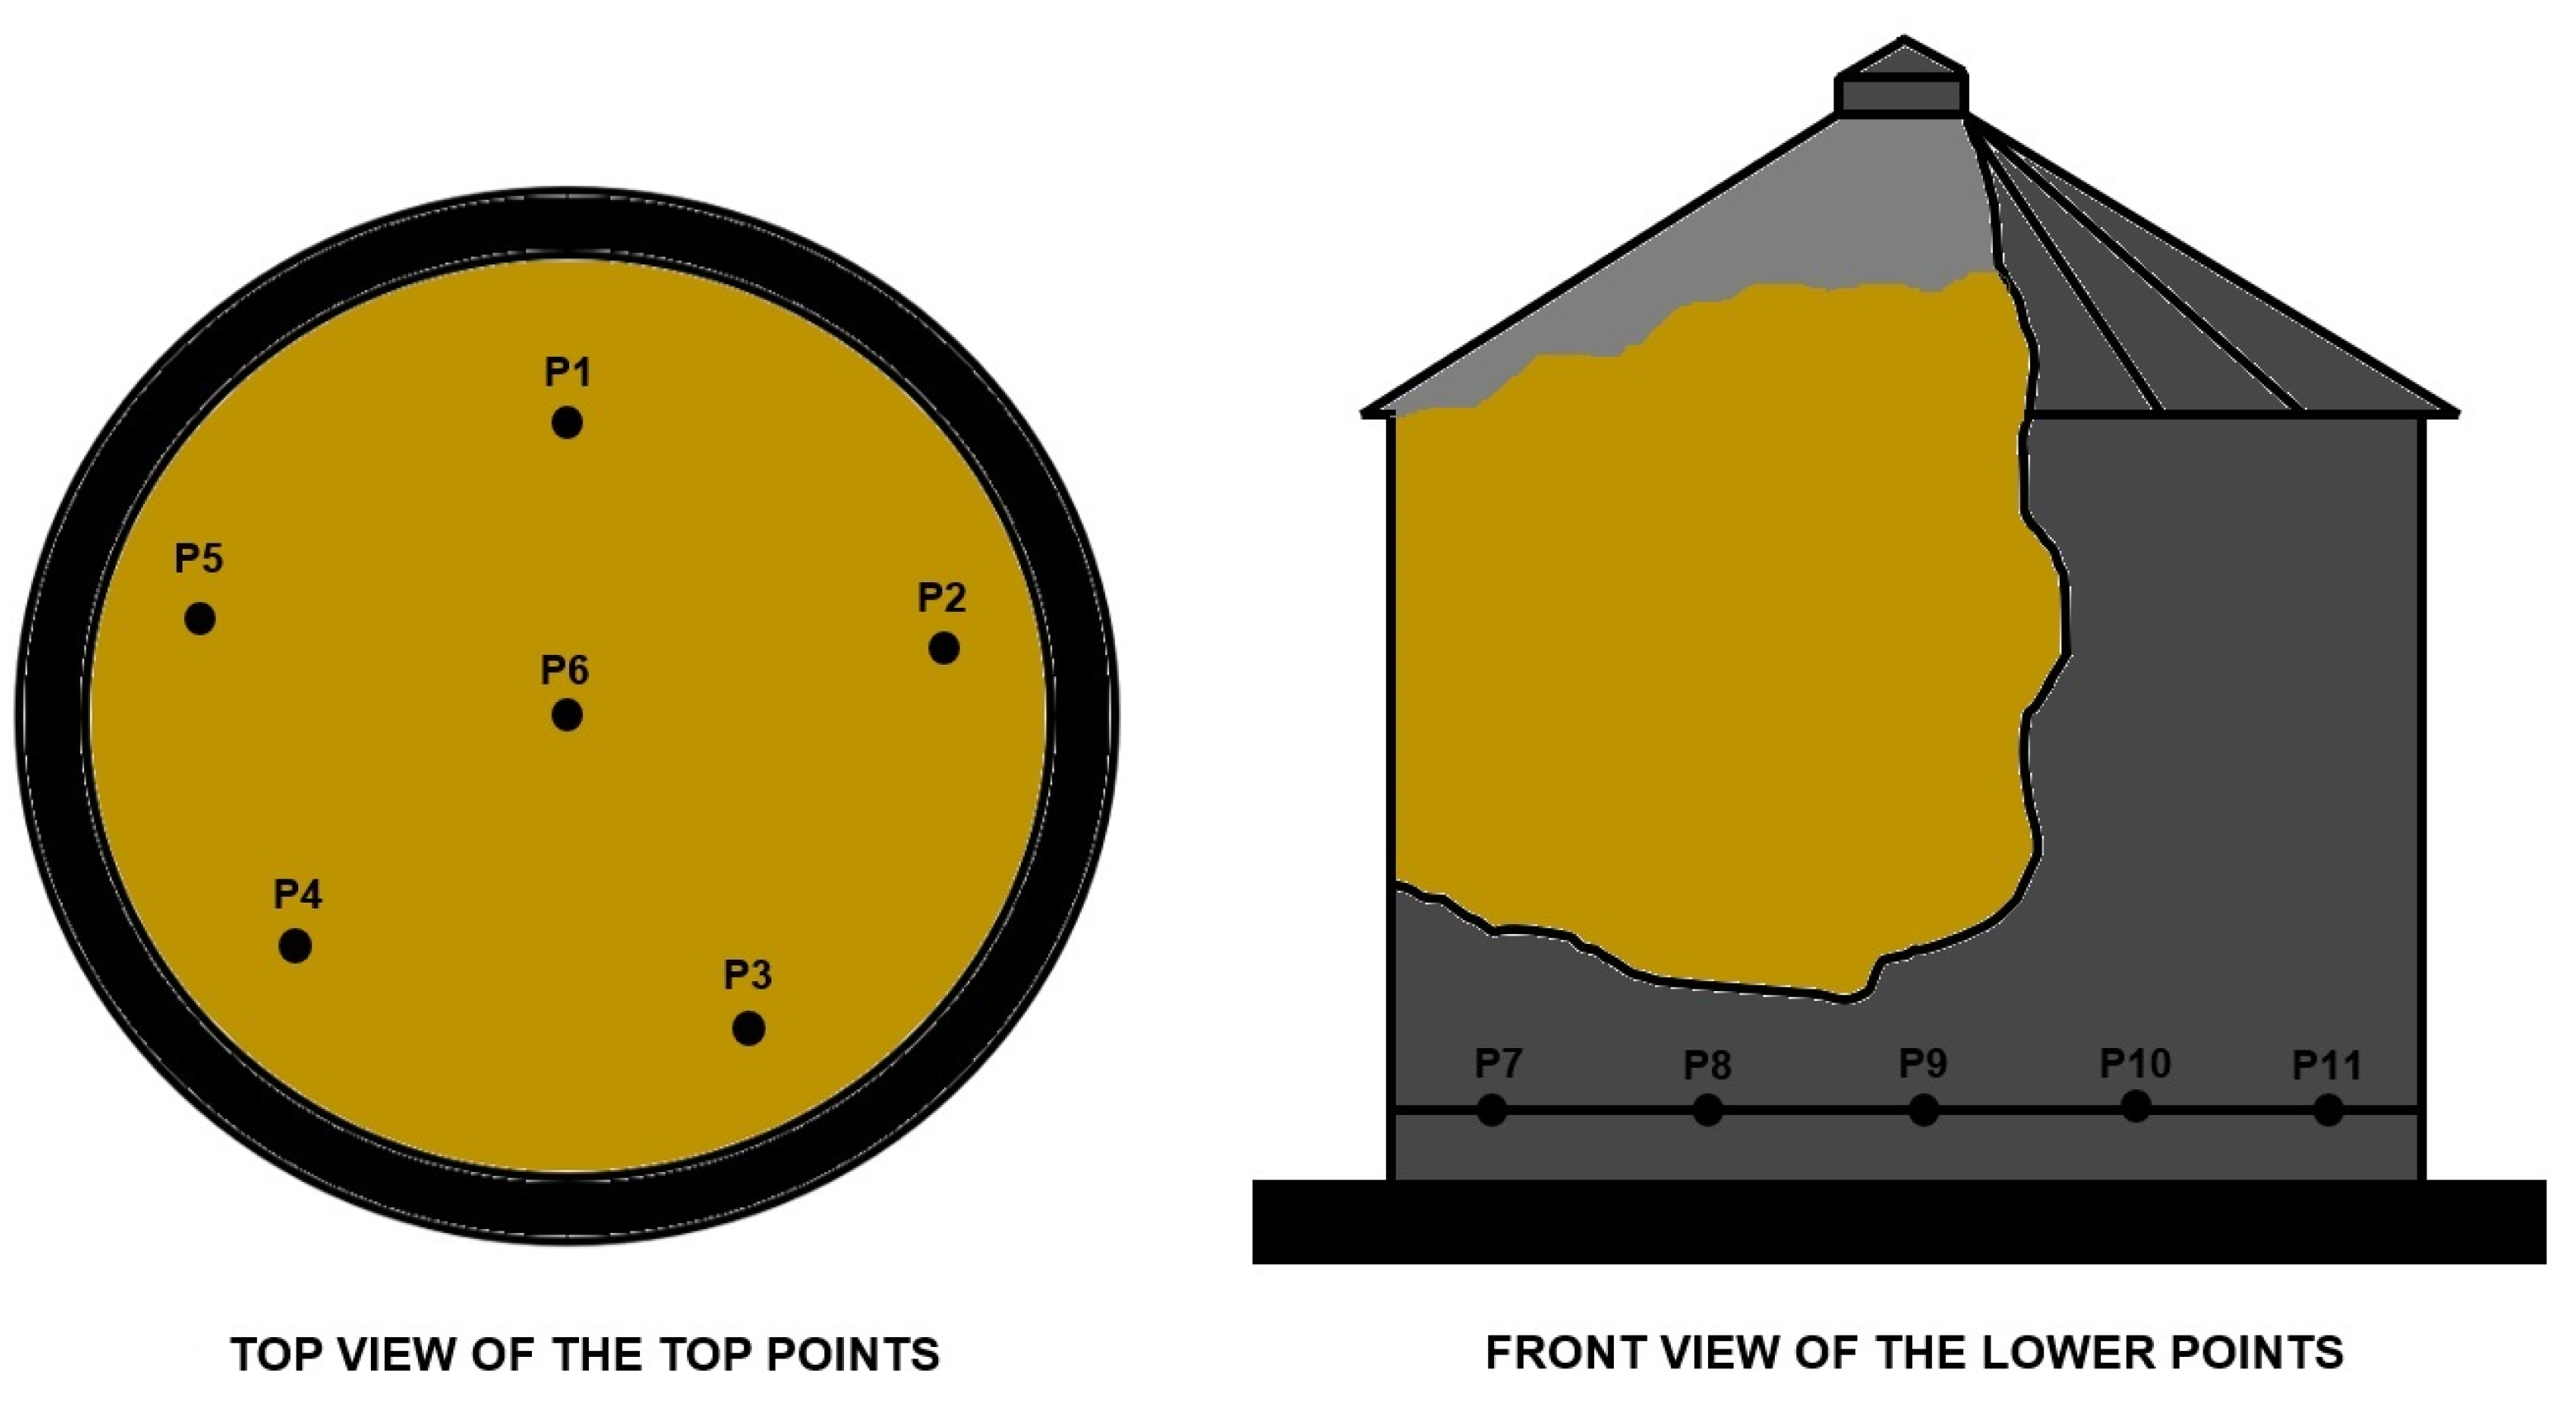
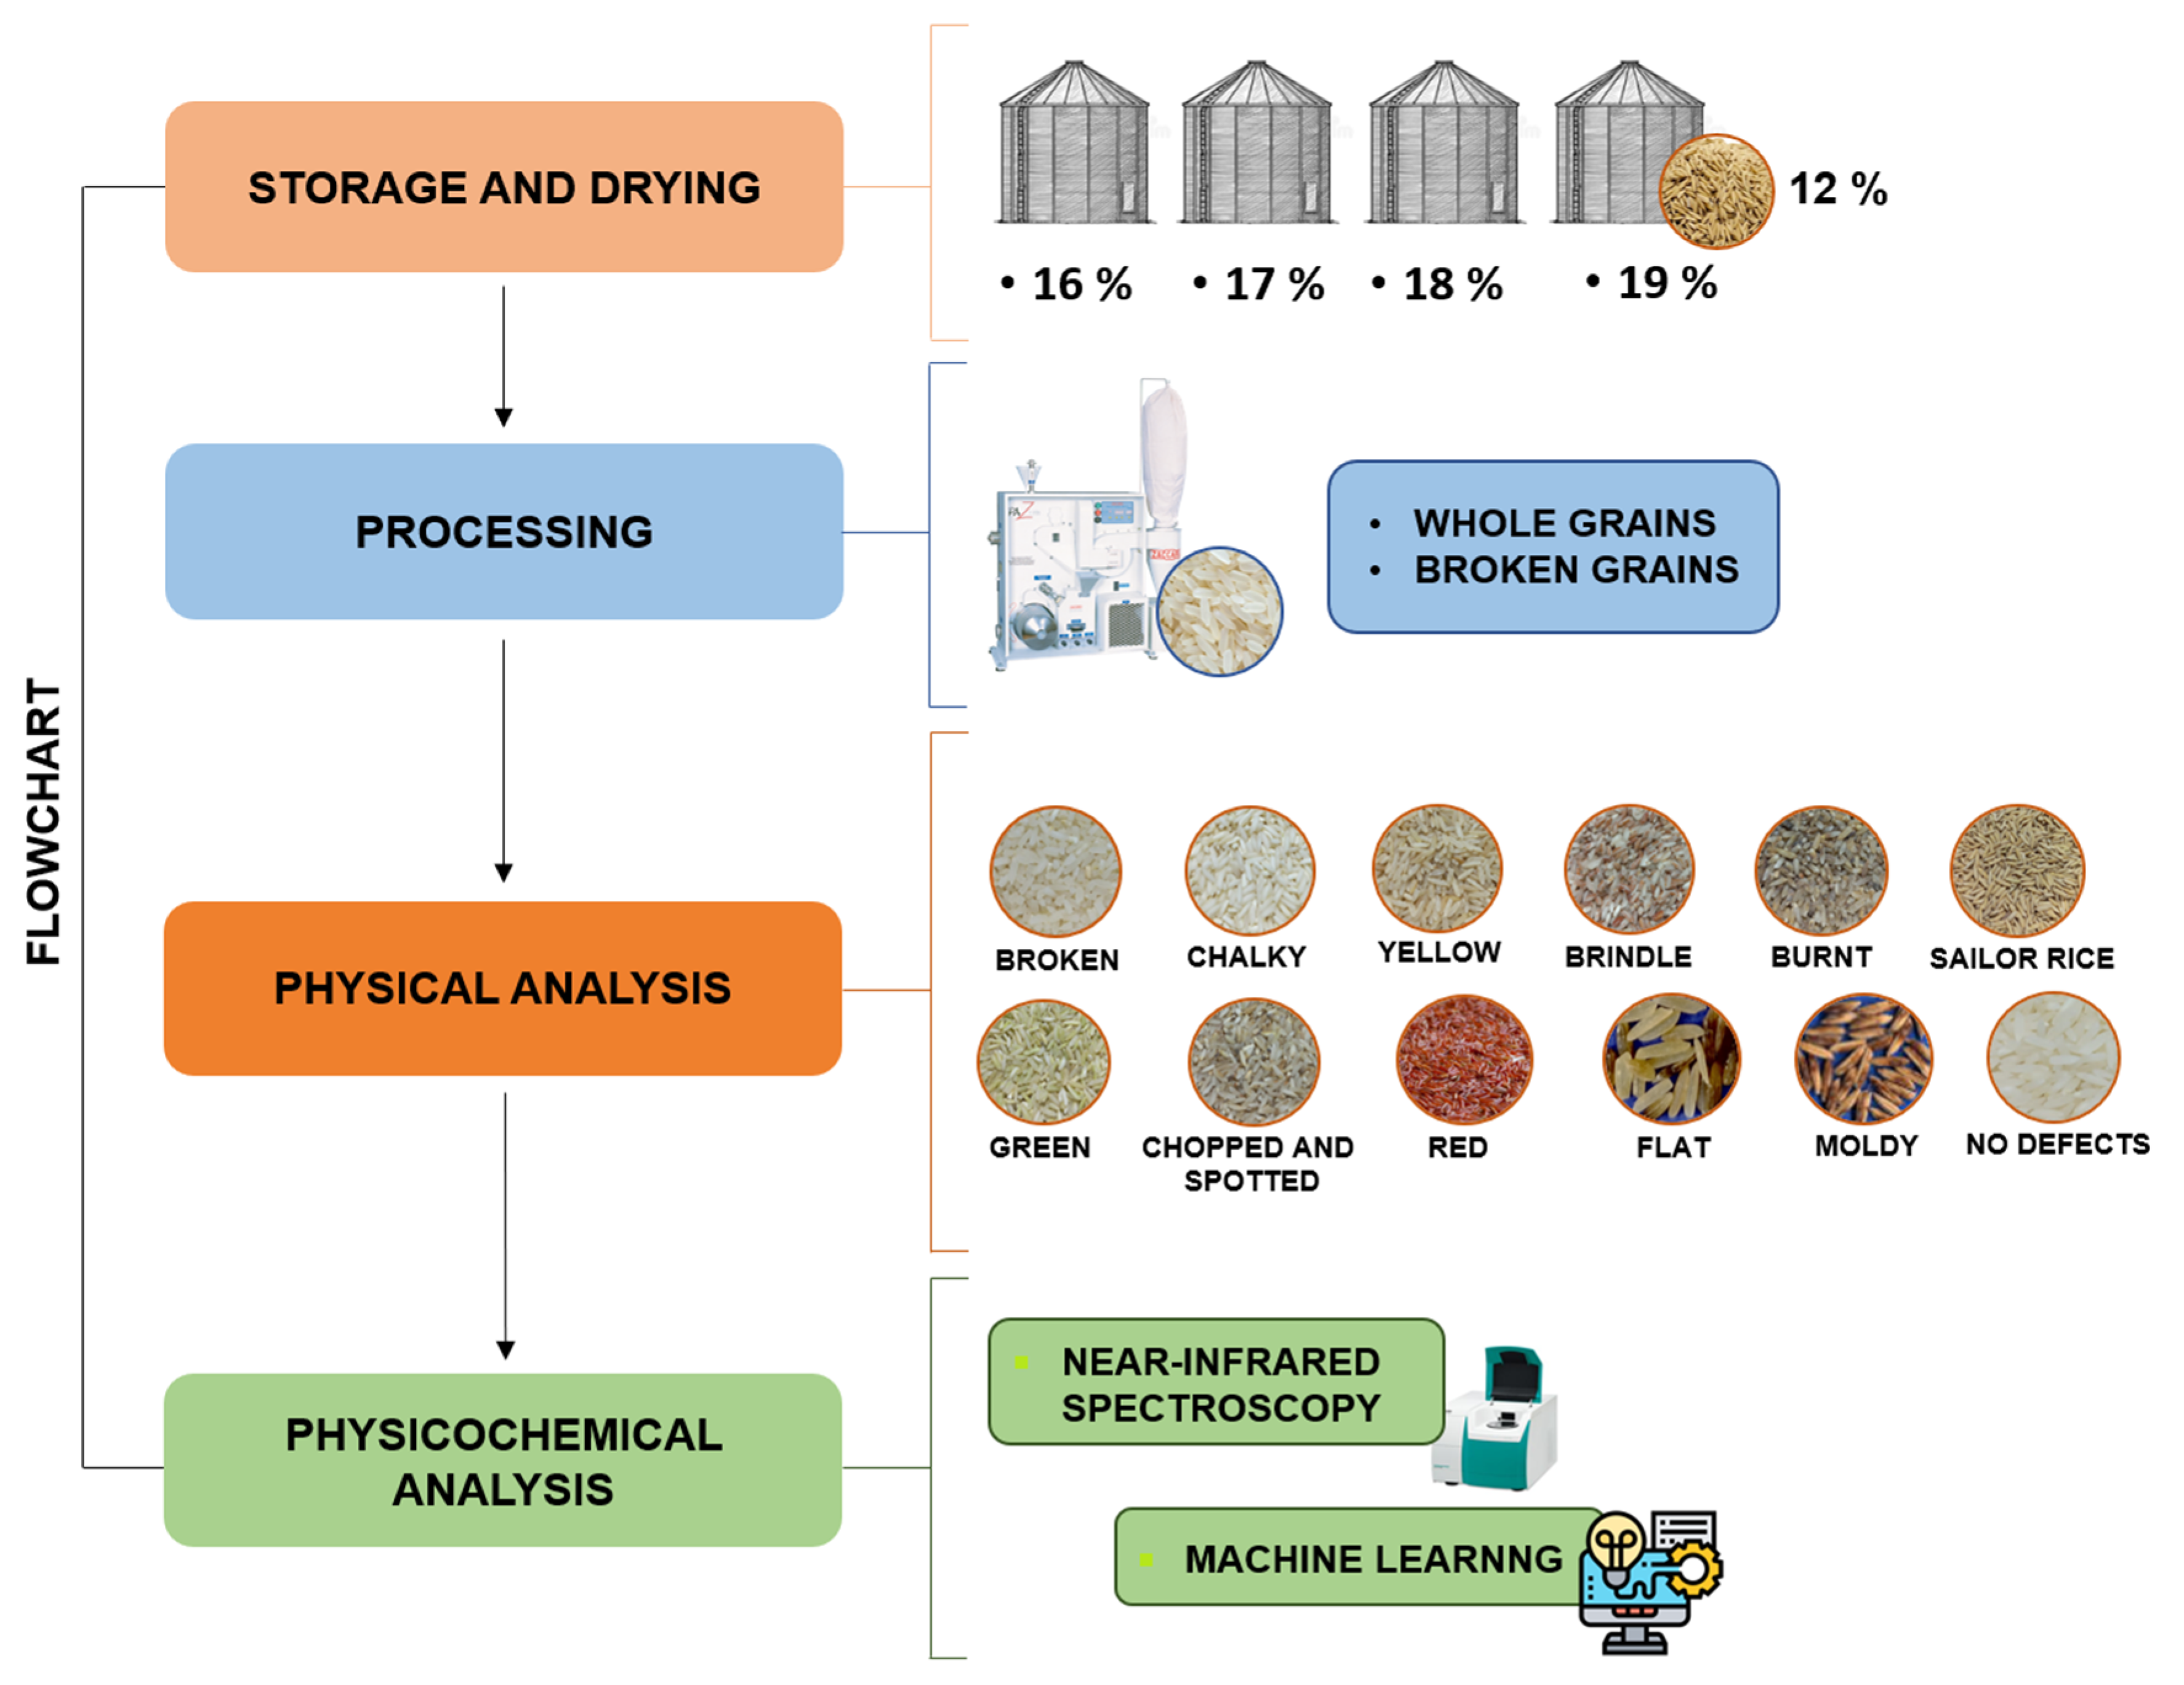
2.1. Description and Experimental Design

The paddy of the IRGA 424 variety was produced in the Cachoeira do Sul municipally, Rio Grande do Sul, Brazil, in the year 2022 in Planossolo Háplico soil. The rice was harvested with different initial moisture contents (Table 1), then the grains were subjected to drying in silo dryers up to 12% (w.b.) in four full-scale silo dryer units, model SFP-18314 (Pagé industry, Araranguá, Santa Catarina, Brazil). Sampling was performed at 11 different points for each of the four silo dryers. The first six points were located at the top of the silo dryer, following the alignment of the thermometry cables allocated.
The remaining five points were collected at the bottom of the silo dryers, near the discharge points, and evenly distributed at the base (Figure 1). Subsequently, the rice grain samples were processed and subjected to separation into whole and broken grains, followed by classification according to defects.
Figure 2 illustrates the operations, including: sample collection during storage, processing, manual physical classification, physical-chemical analysis using near-infrared spectroscopy, and quality prediction using Machine Learning models.

2.2. Rice Processing and Physical Classification

For the processing of rice grains, a rice polisher, Paz-1/DTA model (Zaccaria company, Limeira, São Paulo, Brazil), was used. It was calibrated and operated according to the manufacturer’s technical recommendations. The paddy rice grains were gradually added to the input hopper of the polisher to obtain the dehusked and polished rice.
The polishing process involved the passage of grains between two abrasive stones present in the equipment’s huller, which removed the outer layer of the grains. To separate the whole grains from the broken ones, a cylinder separator with 5.5 mm cells, attached to the rice polisher, was used. As the cylinder rotated, the broken grains entered the cells and were discharged by gravity into a horizontal hopper, while the whole grains remained retained in the cylinder for subsequent separation.
After processing, the samples underwent manual physical classification of the rice, following the Normative Instruction No. 02, dated 7 February 2012, which establishes the physical classification standards for grains and commercial information, considering the following defects: red, yellow, scorched, immature, chalky, moldy, cut or stained, broken, streaked, immature, and discolored, as well as impurities and foreign materials adhered to the mass of grains [16]. After the physical classification, the grains with defects, along with the broken grains, were combined into a single sample according to the evaluated moisture content, resulting in samples of whole grains and samples of defective grains for the four moisture contents analyzed.

2.3. Near-Infrared Spectroscopy (NIRS)

For the physicochemical evaluation of the rice grains, near-infrared spectroscopy (NIRS) was used. A Metrohm DS2500 spectrometer (Metrohm company, Herisau, Switzerland) was employed. The samples were homogenized and placed in a sample capsule. They were then illuminated with radiation of a specific wavelength in the near-infrared region. The instrument measured the difference between the amounts of energy emitted by the spectrometer and reflected by the sample to the detector at various bands, creating a spectrum for each sample. The spectral data were recorded in reflectance mode in the spectral range from 400 to 2500 nm, determining the content of starch (ST), crude protein (CP), fat (Fat), ash (AS), and crude fiber (CF) in the whole and defective rice grains for different moisture contents. Additionally, for the whole grains, the apparent specific mass (ASM) was also determined, following the methodology described by Mohsenin [17]. Five replicates were performed for each sample.

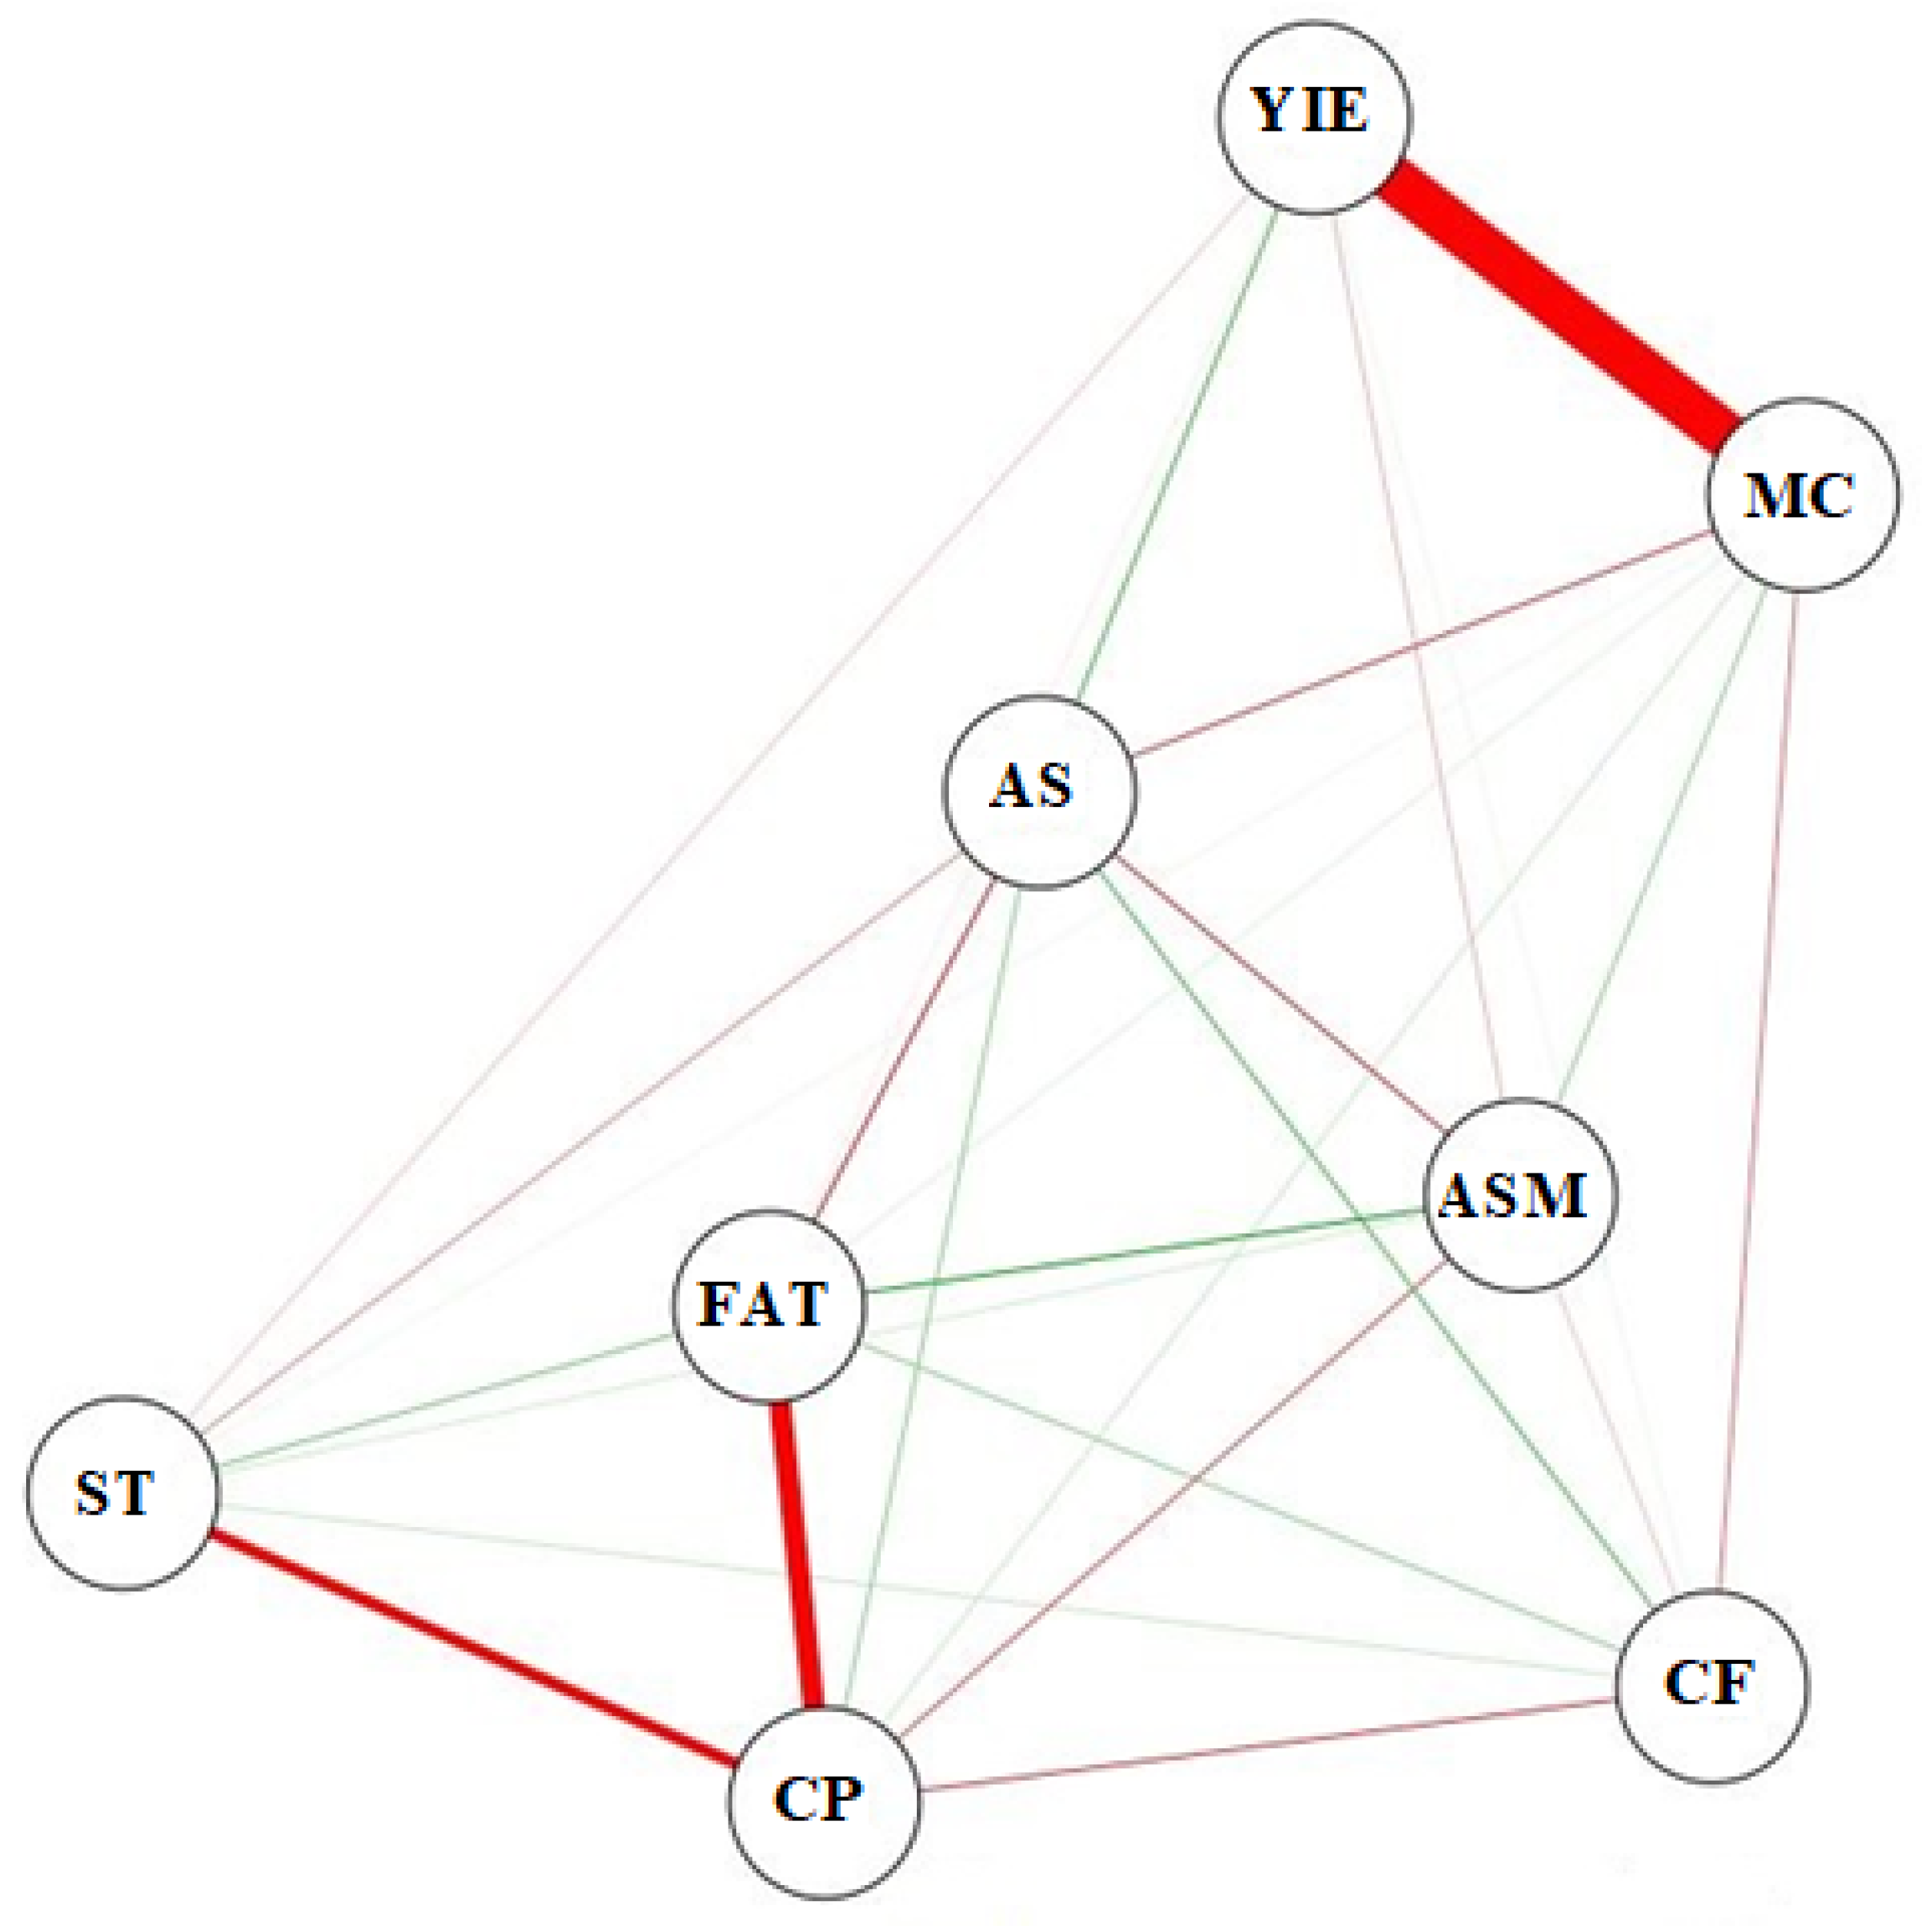
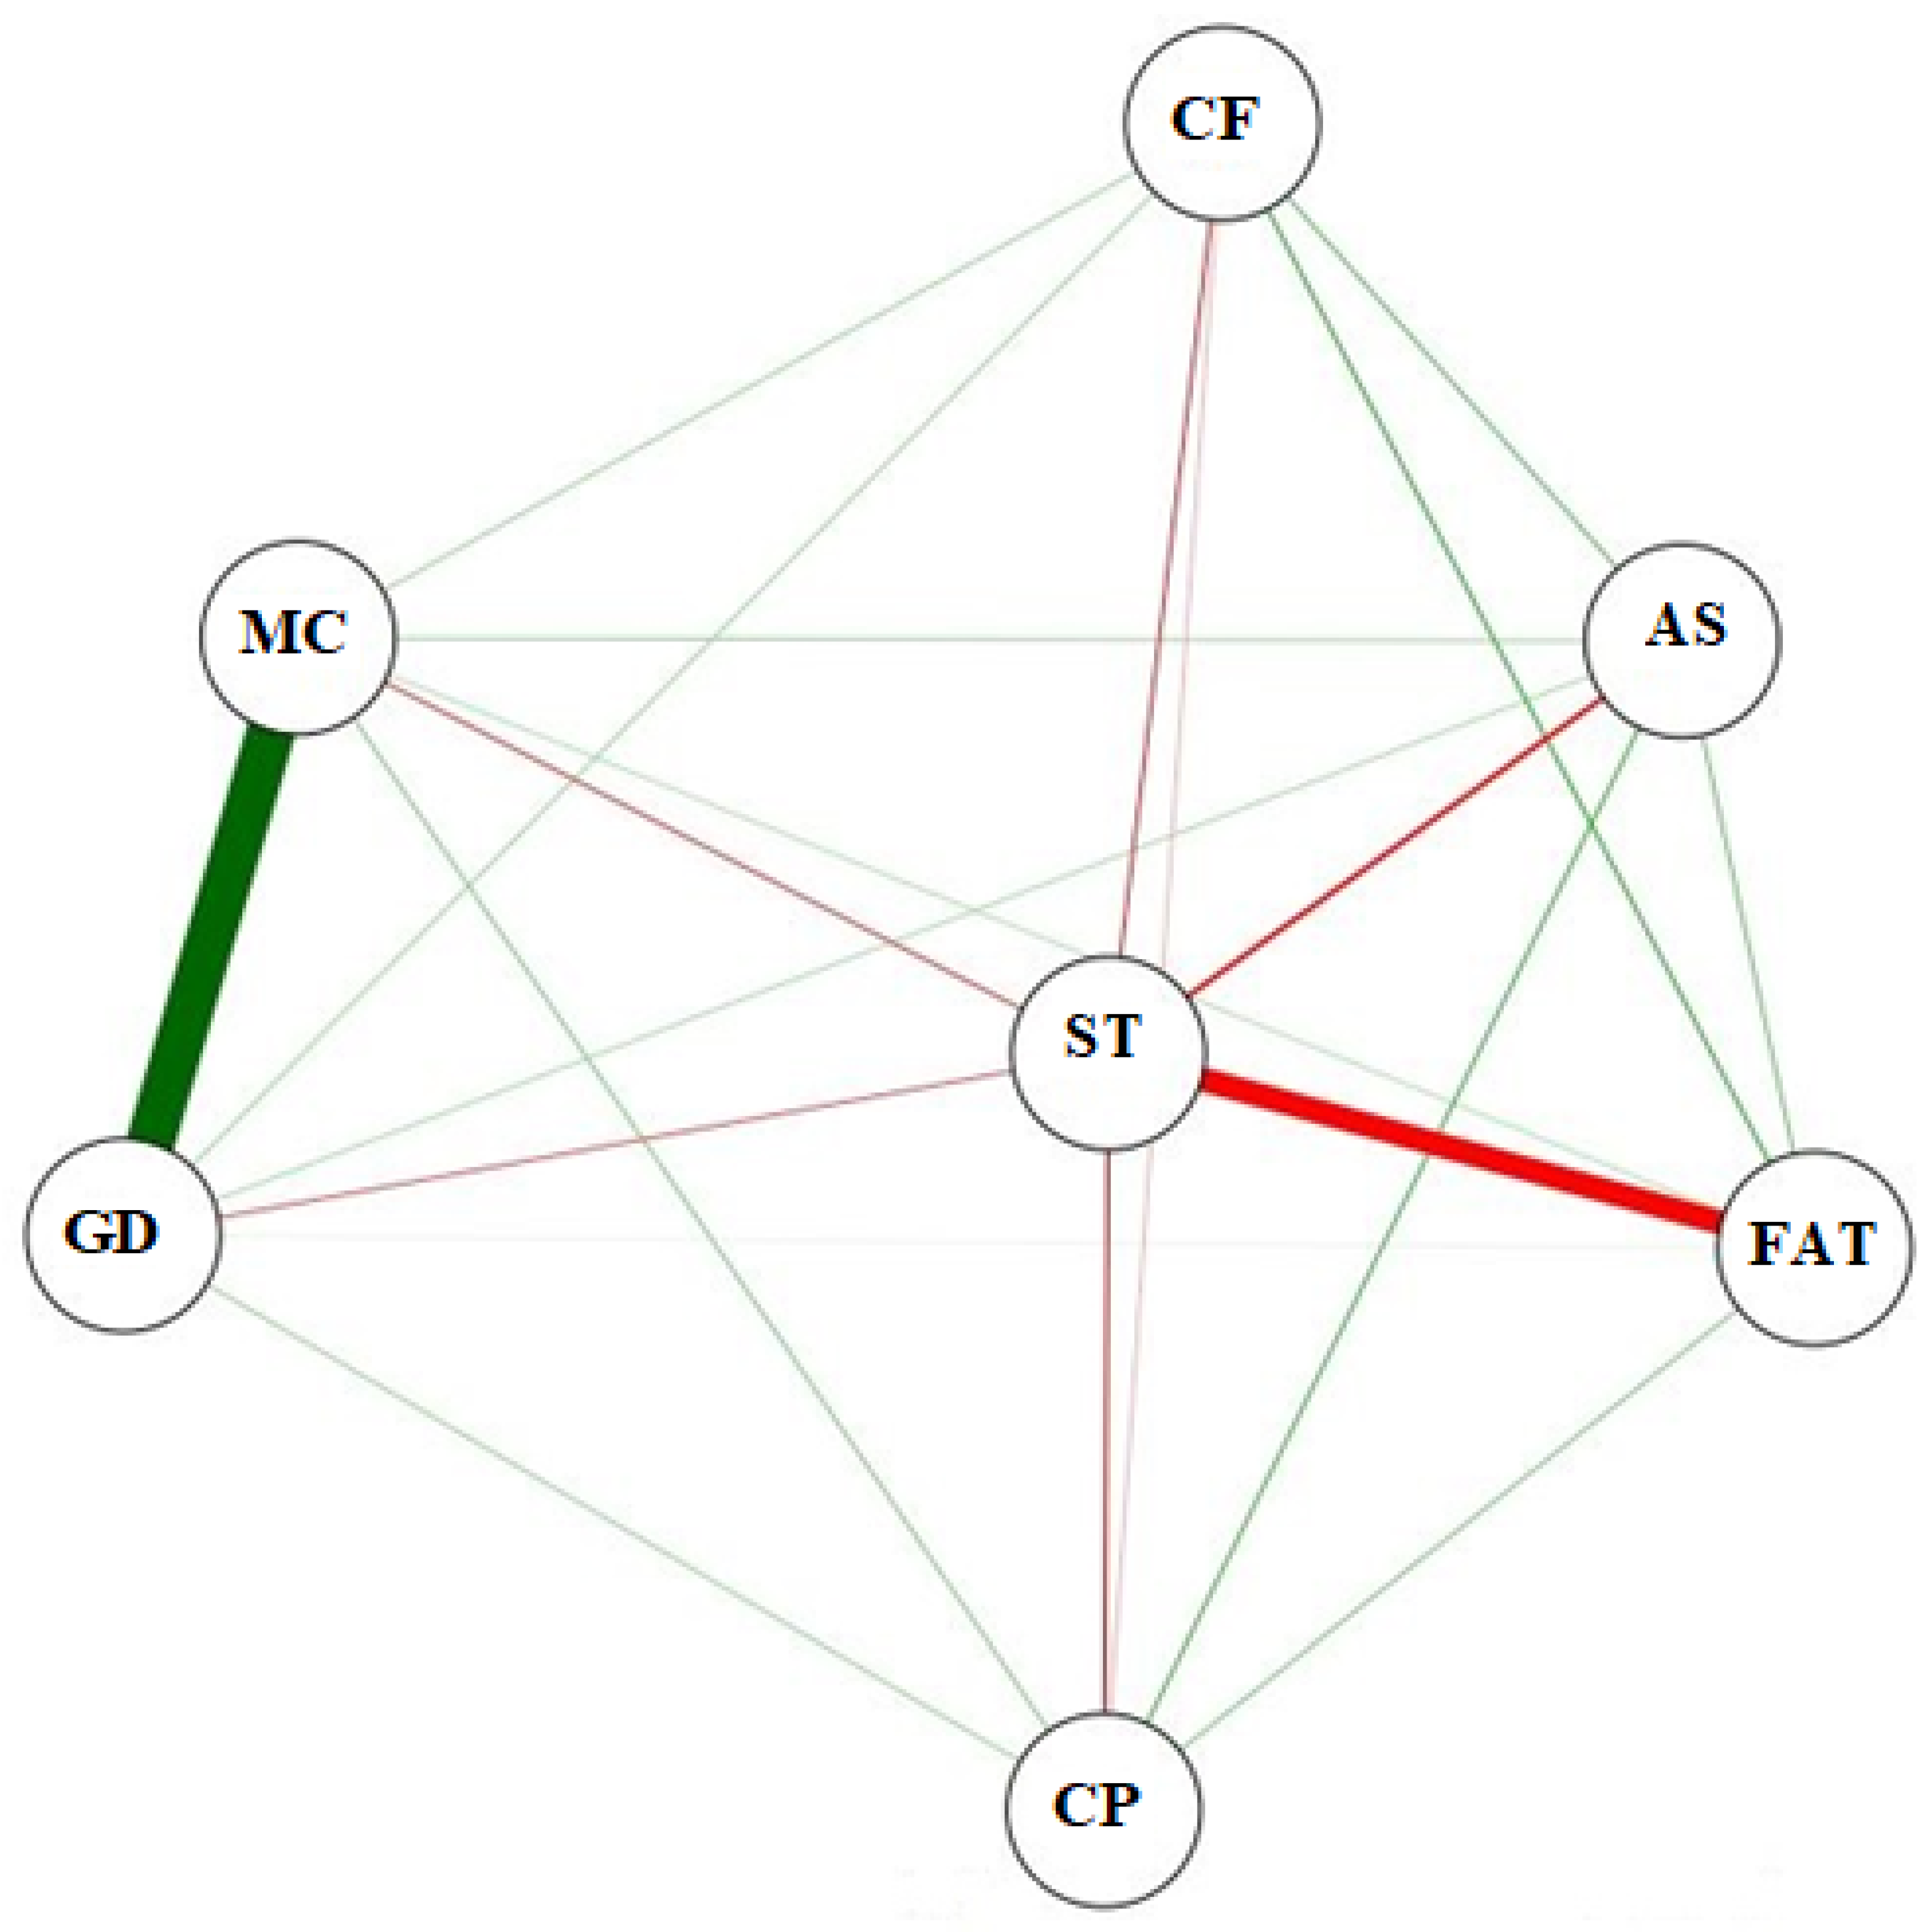
2.4. Pearson Correlation Network

Pearson correlation network analysis was performed using the free R software “ggfortify”, following the methodology by Naldi et al. [18]. In the correlation network, the proximity between the nodes was determined by proportionality to the absolute value of the correlation between the nodes. Additionally, the thickness of the edges was controlled by applying a cutoff value of 0.60, indicating that |r_xy| ≥ 0.60 had their edges highlighted. Positive correlations were highlighted in green, while negative correlations were represented in red.

2.5. Machine Learning Algorithms

Data analysis using Machine Learning algorithms involved the application of the following models: Artificial Neural Networks (ANNs), decision tree algorithms Quinlan’s algorithm (M5P), Random Tree (RandT) and REPTree (ReepT), and Random Forest (RF). Multiple Linear Regression (MLR) was used as a control technique. Based on these models, the following variables were predicted: crude protein (CP), ash (AS), fat (Fat), crude fiber (CF), and starch (ST) for whole rice grains, and for defective grains with different moisture contents. Additionally, the variable apparent specific mass (ASM) was included only for the analysis of whole grains. The following variables were considered as input for each prediction model of the physicochemical properties of rice grains: whole grain yield (YIE), defects (GD), and moisture content (MC).
The ML analyses were performed using stratified cross-validation with k-fold = 10 and ten repetitions (100 runs for each model) and adopting the default configuration for all model parameters [19]. All prediction analyses were performed on the Weka software version 3.9.5 on an Intel® CoreTM i5-3317U CPU with 4 GB of RAM. Weka aims to aggregate algorithms from different approaches in artificial intelligence dedicated to the study of machine learning. This sub-area intends to develop algorithms that allow a computer to “learn” either inductively or deductively. Weka performs computational and statistical analysis of the data provided, resorting to data mining techniques, inductively trying to generate hypotheses for solutions from the patterns found and, at the extremes, even theories about the data in question. The ANN algorithm used consists of a single hidden layer formed by a number of neurons equal to the number of attributes plus the number of classes divided by 2 [20] REPTree model is an adaptation of the C4.5 classifier and can be used in regression problems with an additional pruning step based on an error reduction strategy [21]. RandomTree model is a class for constructing a tree that considers K randomly chosen attributes at each node. It does not perform pruning and also has the option to allow the estimation of class probabilities based on a waiting set. The M5P model is a reconstruction of Quinlan’s M5 algorithm based on the conventional decision tree with the addition of a linear regression function at the leaf nodes [22]. The RF (Random Forest) model can generate multiple prediction trees for the same dataset and use a voting scheme among all the learned trees to predict new values [23]. The MLR (Multiple Linear Regression) model was used as a control model as it is suitable for predicting relationships between variables.
The statistics used to verify the quality of fit of the prediction models were the mean absolute error (MAE) and Pearson correlation coefficient (r) between observed and predicted values by each model. For comparison of the models, MAE and r means for each model were grouped by the Scott–Knott test at 5% probability and shown through boxplot graphs. These analyses were performed on the R software using the ExpDes.pt and ggplot2 packages.

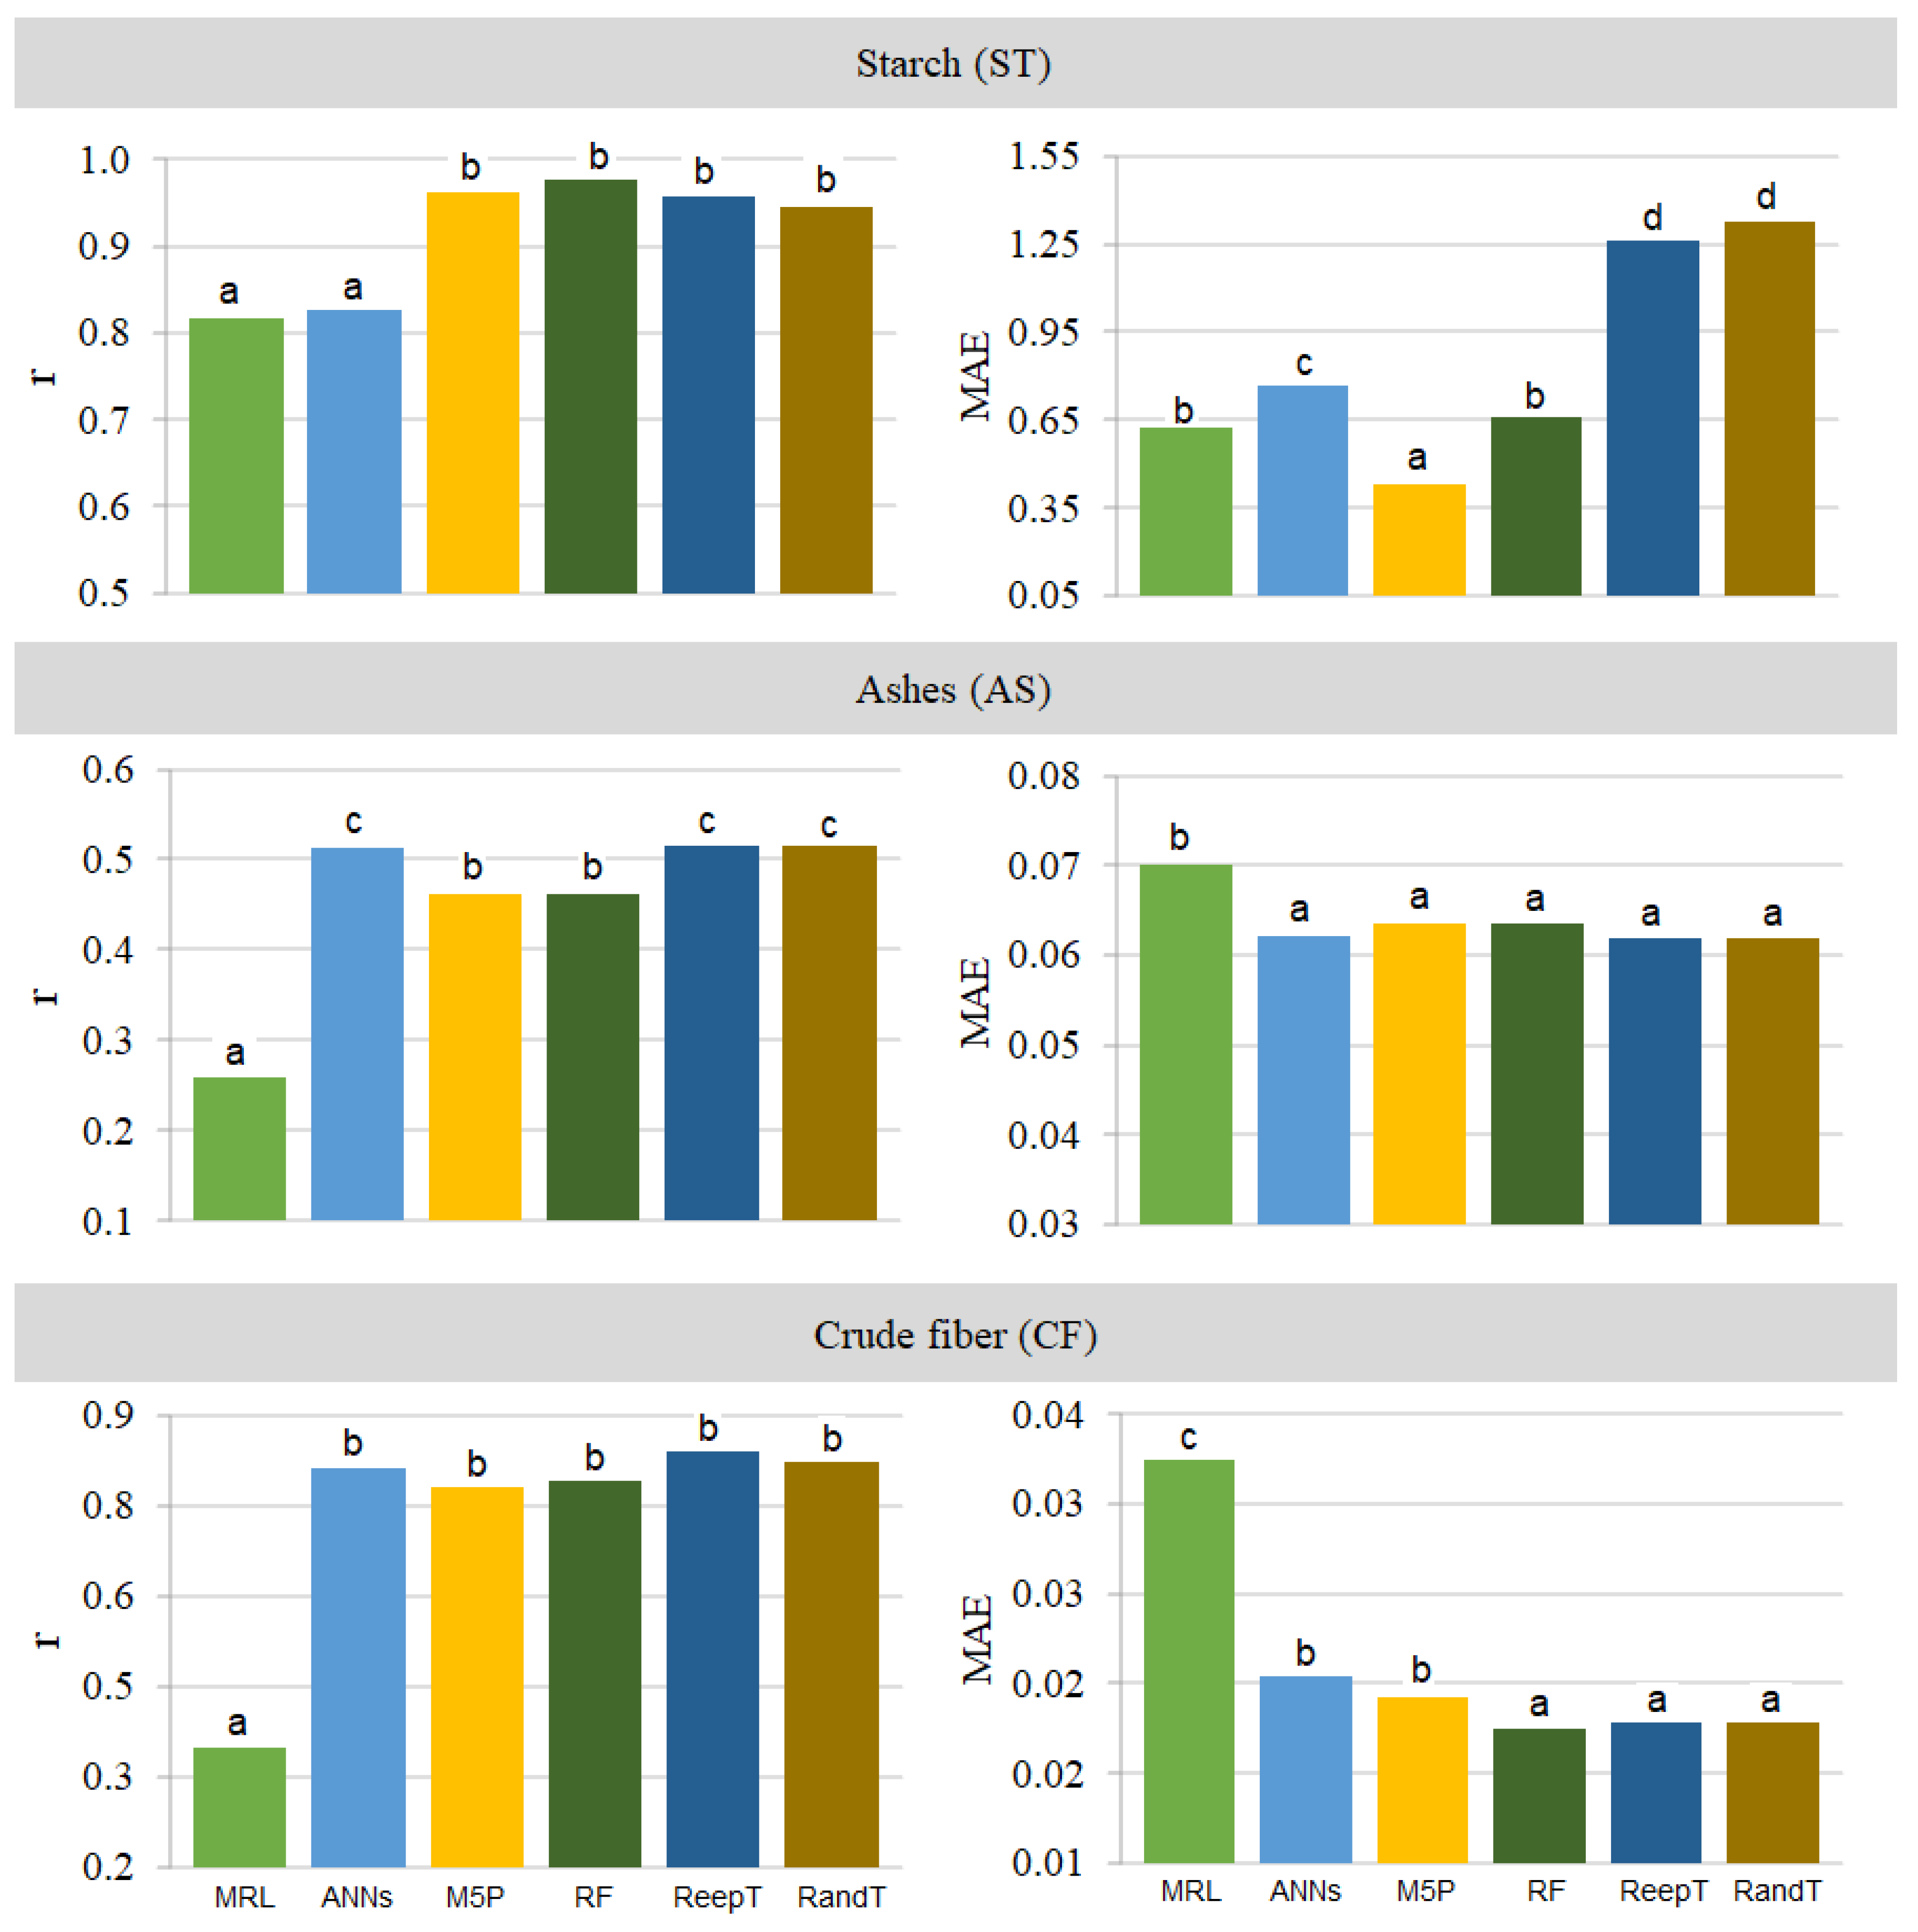
3. Results and Discussion

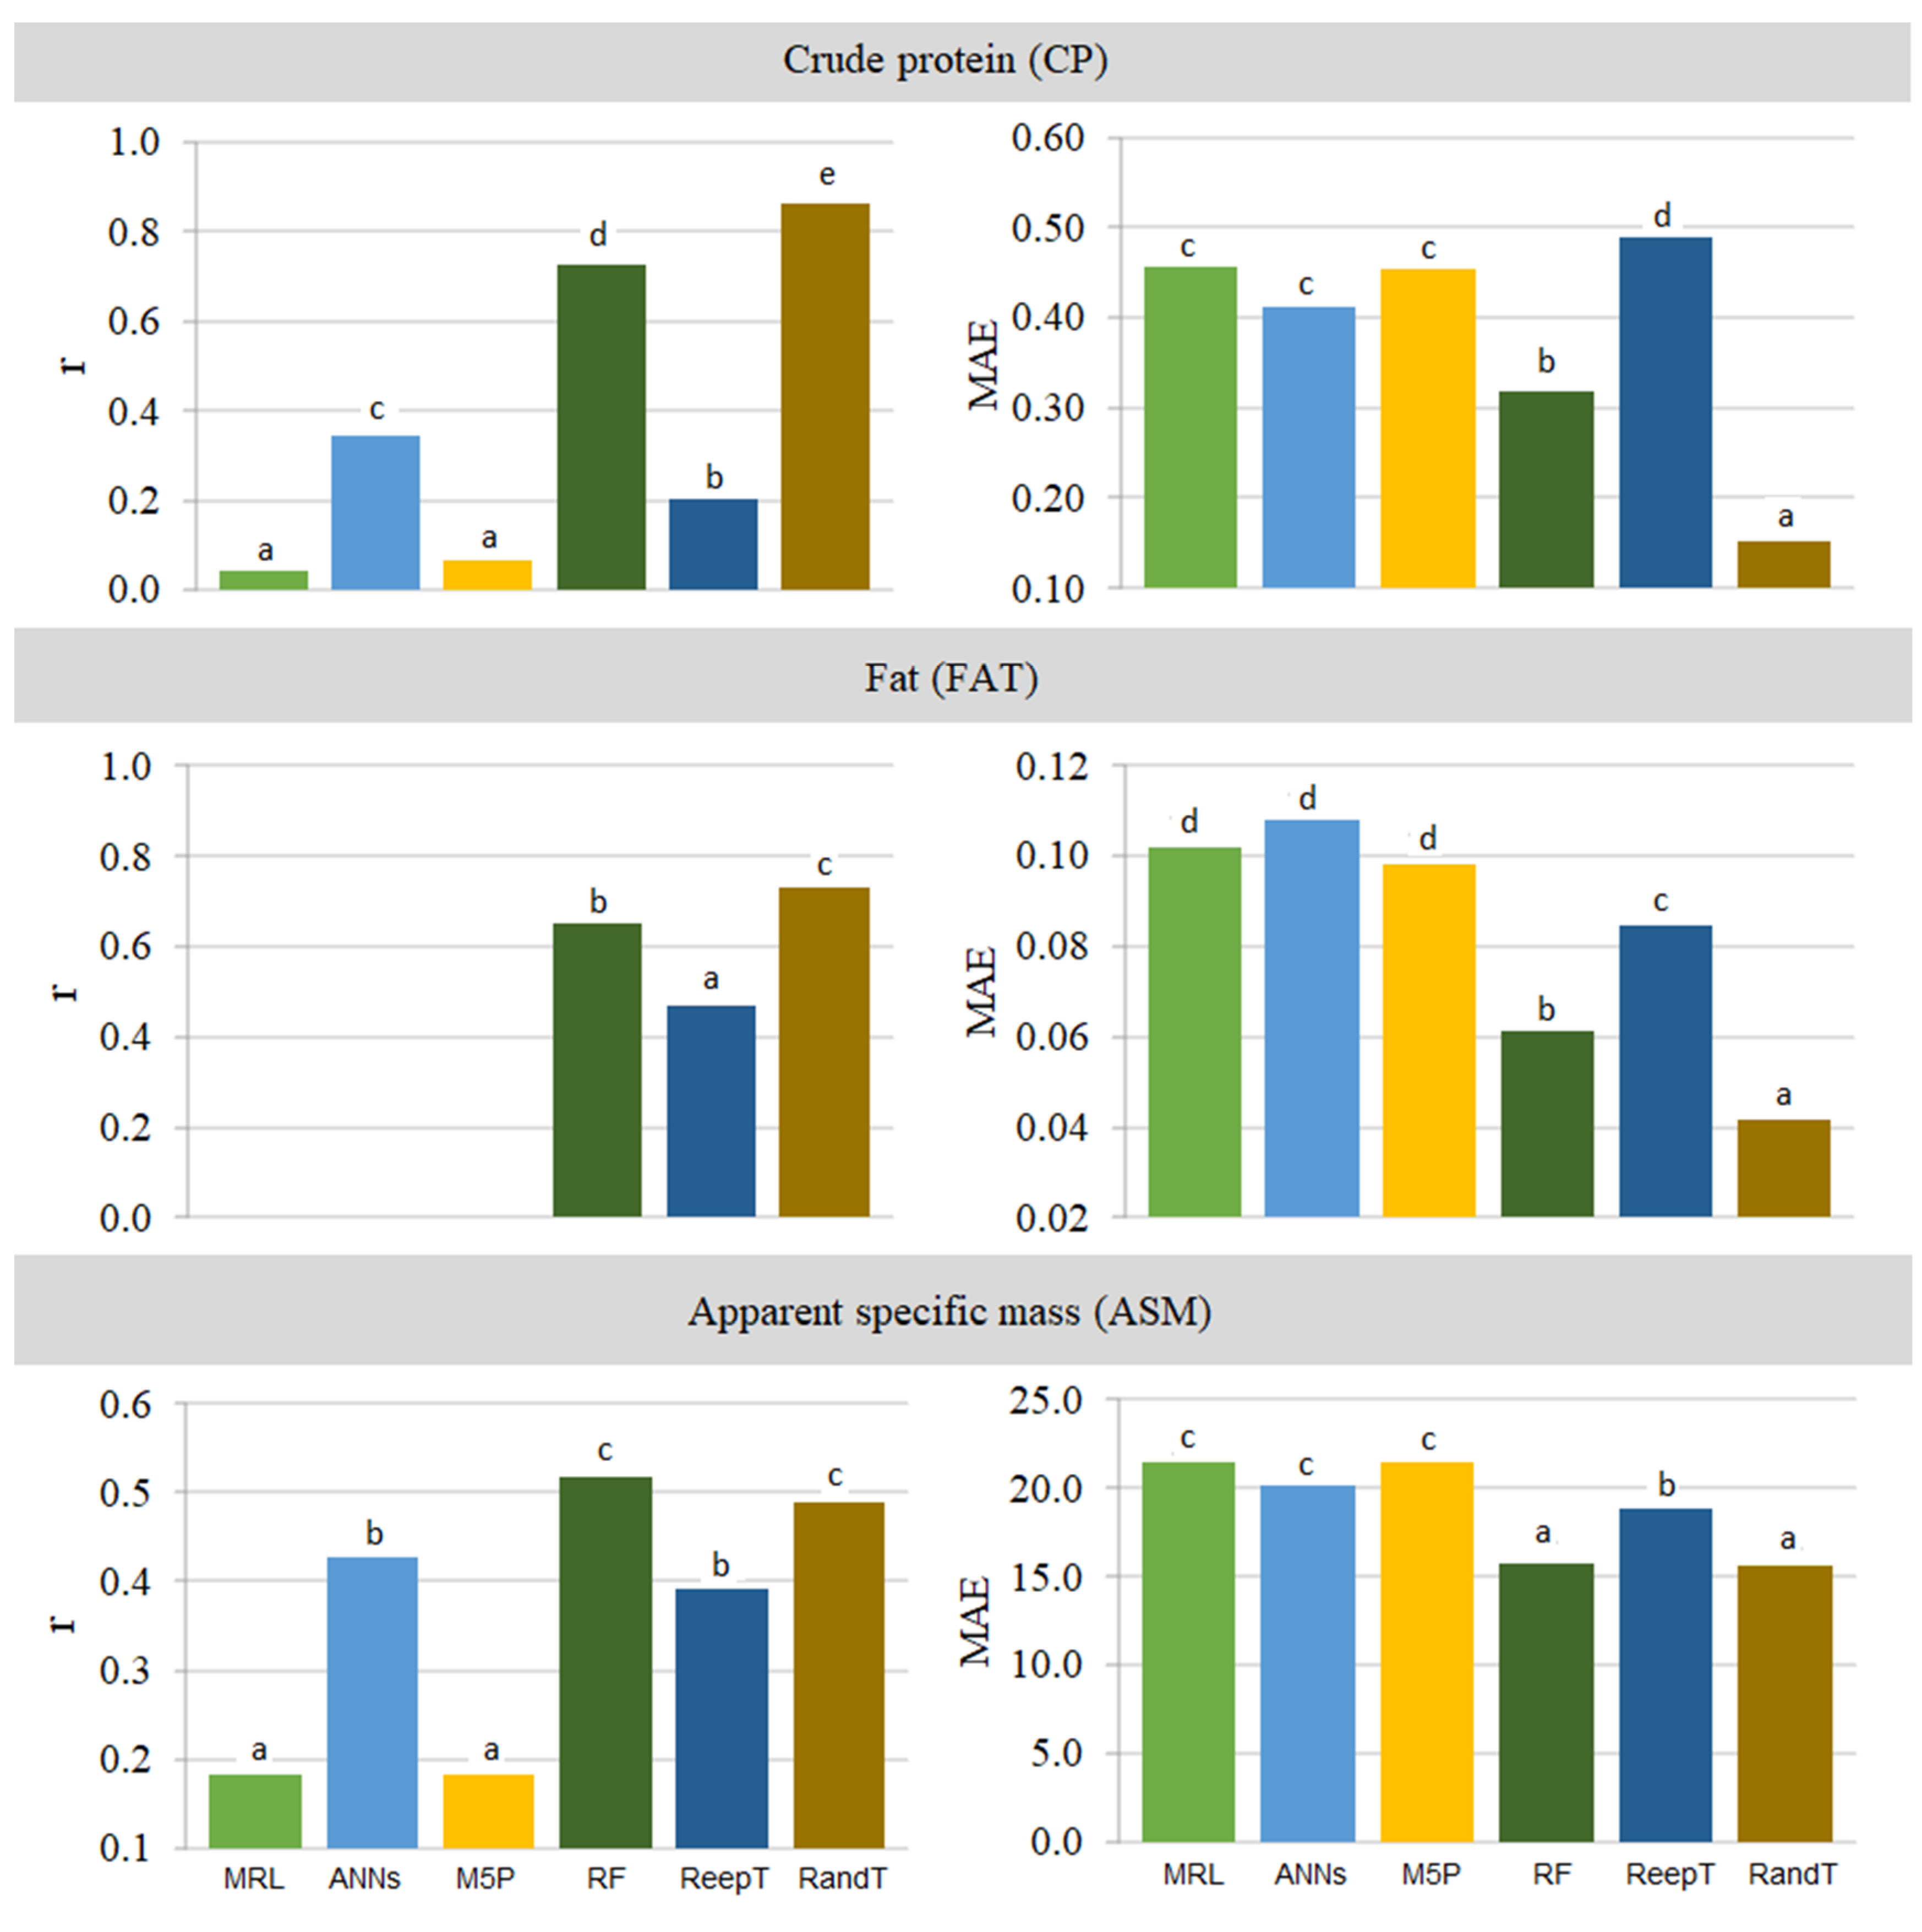
3.1. Whole Rice Grains

Table 2 shows the results of the physicochemical characterization of rice grains based on the initial moisture content (MC) before drying and the percentage of whole grains (YIE) obtained after drying. We observed that lower initial moisture content in the grains led to higher percentages of beneficiated whole grains, resulting in higher percentages of starch (ST) and fat (Fat). In grains with moisture content (MC) between 18 and 19%, higher values of apparent specific mass (ASM) and crude protein (CP) were observed, along with lower values of ash content (AS).
By Pearson’s correlation (Figure 3 and Table 3), it is possible to verify a negative strong correlation for MC × YIE, indicating an inverse relationship between them. The mass of grains with higher initial moisture content (MC) accumulated a higher amount of heat at the end of drying, increasing thermal damage and decreasing the yield of whole benefited grains [24]. Weak negative correlations were found for MC × CF × AS, occasioned by the physical changes in the morpho-cellular tissues that affected the physicochemical compositions of the grains. Moreover, there is a weak inverse relationship between MC × Fat, since the lipid content was affected by the degradation of the aleurone layer due to the metabolic activity of the grains resulting from the water contents [1,24]. Apparent specific mass (ASM) had a positive and weak correlation with moisture content (MC). Some authors obtained higher ASM values in paddy rice grains stored with increased moisture content [25]. According to the authors, the ASM was altered as the moisture content (MC) of the grains decreased during drying [25].
Regarding YIE, weak negative correlations were observed with MEA and ST. Starch (ST) is composed of amylose chains that form molecular structures, which directly influence the hardness of the grain. Thus, rice grains with higher amylose contents are more resistant to abrasion in processing, achieving a higher yield (YIE) of whole grains [1,26]. Medium and weak negative correlations were observed between CP × Fat and CP × ST, respectively. The highest concentrations of crude protein (CP) were located in the endosperm of the grain, along with the starch content (ST), where the increase in one implied the reduction of the other [1,26]. Furthermore, according to Nunes et al. [24] the drying operation interferes with the decrease in the crude protein (CP) extraction, especially in the protein-starch ratio. The inverse relationship between fat (Fat) and crude protein (CP) content in whole rice grains was verified by Müller et al. [1]. According to Denardin and Silva [26], lipid bodies called triacylglycerols are stored in the endosperm of grains, where they are stabilized by hydrophobic proteins, which mobilize fatty acid catalysis.
A negative correlation was observed between crude fiber content (CF) and moisture content (MC). Although weak, the correlation indicated an inverse relationship between the variables. Thus, as the grain mass dried, lower water contents resulted in higher crude fiber levels. According to Nunes et al. [24], the higher CF content may be related to the increase in compounds in the cell wall, into structures such as cellulose and hemicellulose, providing greater stiffness to the grain. Thus, rice grains with higher CF in their composition were less physically affected by mechanical processing operations. Ash contents (AS) showed positive correlations with CF × CP × YIE. Ash contents (AS) were considerably reduced in the polishing process of rice grains with higher whole grain yield (YIE). According to Cecchi [27], the AS corresponds to the inorganic residue that remains after the burning of organic matter, consisting mainly of large amounts of K, Ca, Na, and Mg.
Table 4 shows the results of the observed and estimated grain quality values for the different Machine Learning models, while Figure 4 illustrates the potential results of the models for predicting moisture (MC) and starch (ST), ash (AS), and crude fiber (CF) contents in whole grain rice (YIE). In the prediction of starch (ST) as a function of MC and YIE, similar correlation coefficients were observed for all models.
RF model showed the highest correlation (r > 0.97), followed by the M5P and REPTree models. However, the lowest MAE was archived by the M5P model (MAE < 0.5), followed by the RF model. Given this, RF and M5P were the most suitable for predicting the starch content (ST) in whole rice grains. The RF model has wide applicability in the agricultural industry. The efficiency and versatility of RF were evidenced by Zeymer et al. [28], who satisfactorily predicted dry matter loss in soybeans as a function of water content and storage time. Furthermore, Ramos et al. [9] verified the great ability of the RF model to predict soybean plant height through spectral bands.
The RandT, REPTree, and ANNs models showed the highest correlations and lowest errors for observed and predicted starch contents (ST) (0.51 and 0.06), respectively. Furthermore, the M5P and RF models also showed similar fits to the other models. Despite the low mean absolute error, the correlation was considered low (less than 0.7), and for this reason, the models studied are not the most suitable for predicting the influence of MC and YIE on ash contents (AS). Similar fit patterns were found for all ML models used to predict CF, except for the conventional MLR model. Random Tree, REPTree and RF models showed correlation coefficients around 0.8 and MAE around 0.016. Thus, the three models were suitable for predicting crude fiber (CF) in whole rice grains, with the REPTree model standing out.
Figure 5 shows the performance of the MLR model to predict CP, Fat, and ASM. The Random Tree model demonstrated a better fit for predicting the interference of moisture content (MC) on crude protein (CP) levels. However, the RF model showed greater potential to predict the same variable, with a correlation coefficient higher than 0.72 and MAE around 0.32.
Among the models studied, the Random Tree archived the highest correlation coefficient and the lowest mean absolute error and hence is suitable for predicting the effect of MC and YIE on fat levels (Fat) in whole rice grains. These findings are supported by Walter et al. [29], who reported a decreased lipid concentration in the grain milling process as they were present in different layers of the grain, even associated with the starch granules. Likewise, Müller et al. [1] noted a progressive decrease in the lipid content on the surface of whole-milled rice grains.
When analyzing apparent specific mass, all ML models achieved low Pearson’s correlation coefficients (r < 0.52), in which the RF model outperformed the others. Similarly, all models presented high MAE between observed and predicted ASM values, showing poor fits. Therefore, none of the applied models was suitable to predict the direct relationship between water content (WC) and apparent specific mass (ASM) in whole rice grains. Finally, we verified that the Random Tree model presented the highest consistency among the models for predicting the variables studied, even with correlations lower than 0.7. In the evaluation of ash (AS) and ASM), the Random Tree model remained among the best models. Therefore, this Random Tree, which is based on random choices in the attribute tree, has high potential to predict the physicochemical variables of whole grain rice grains under different initial water content (MC) and whole grain yield (YIE).

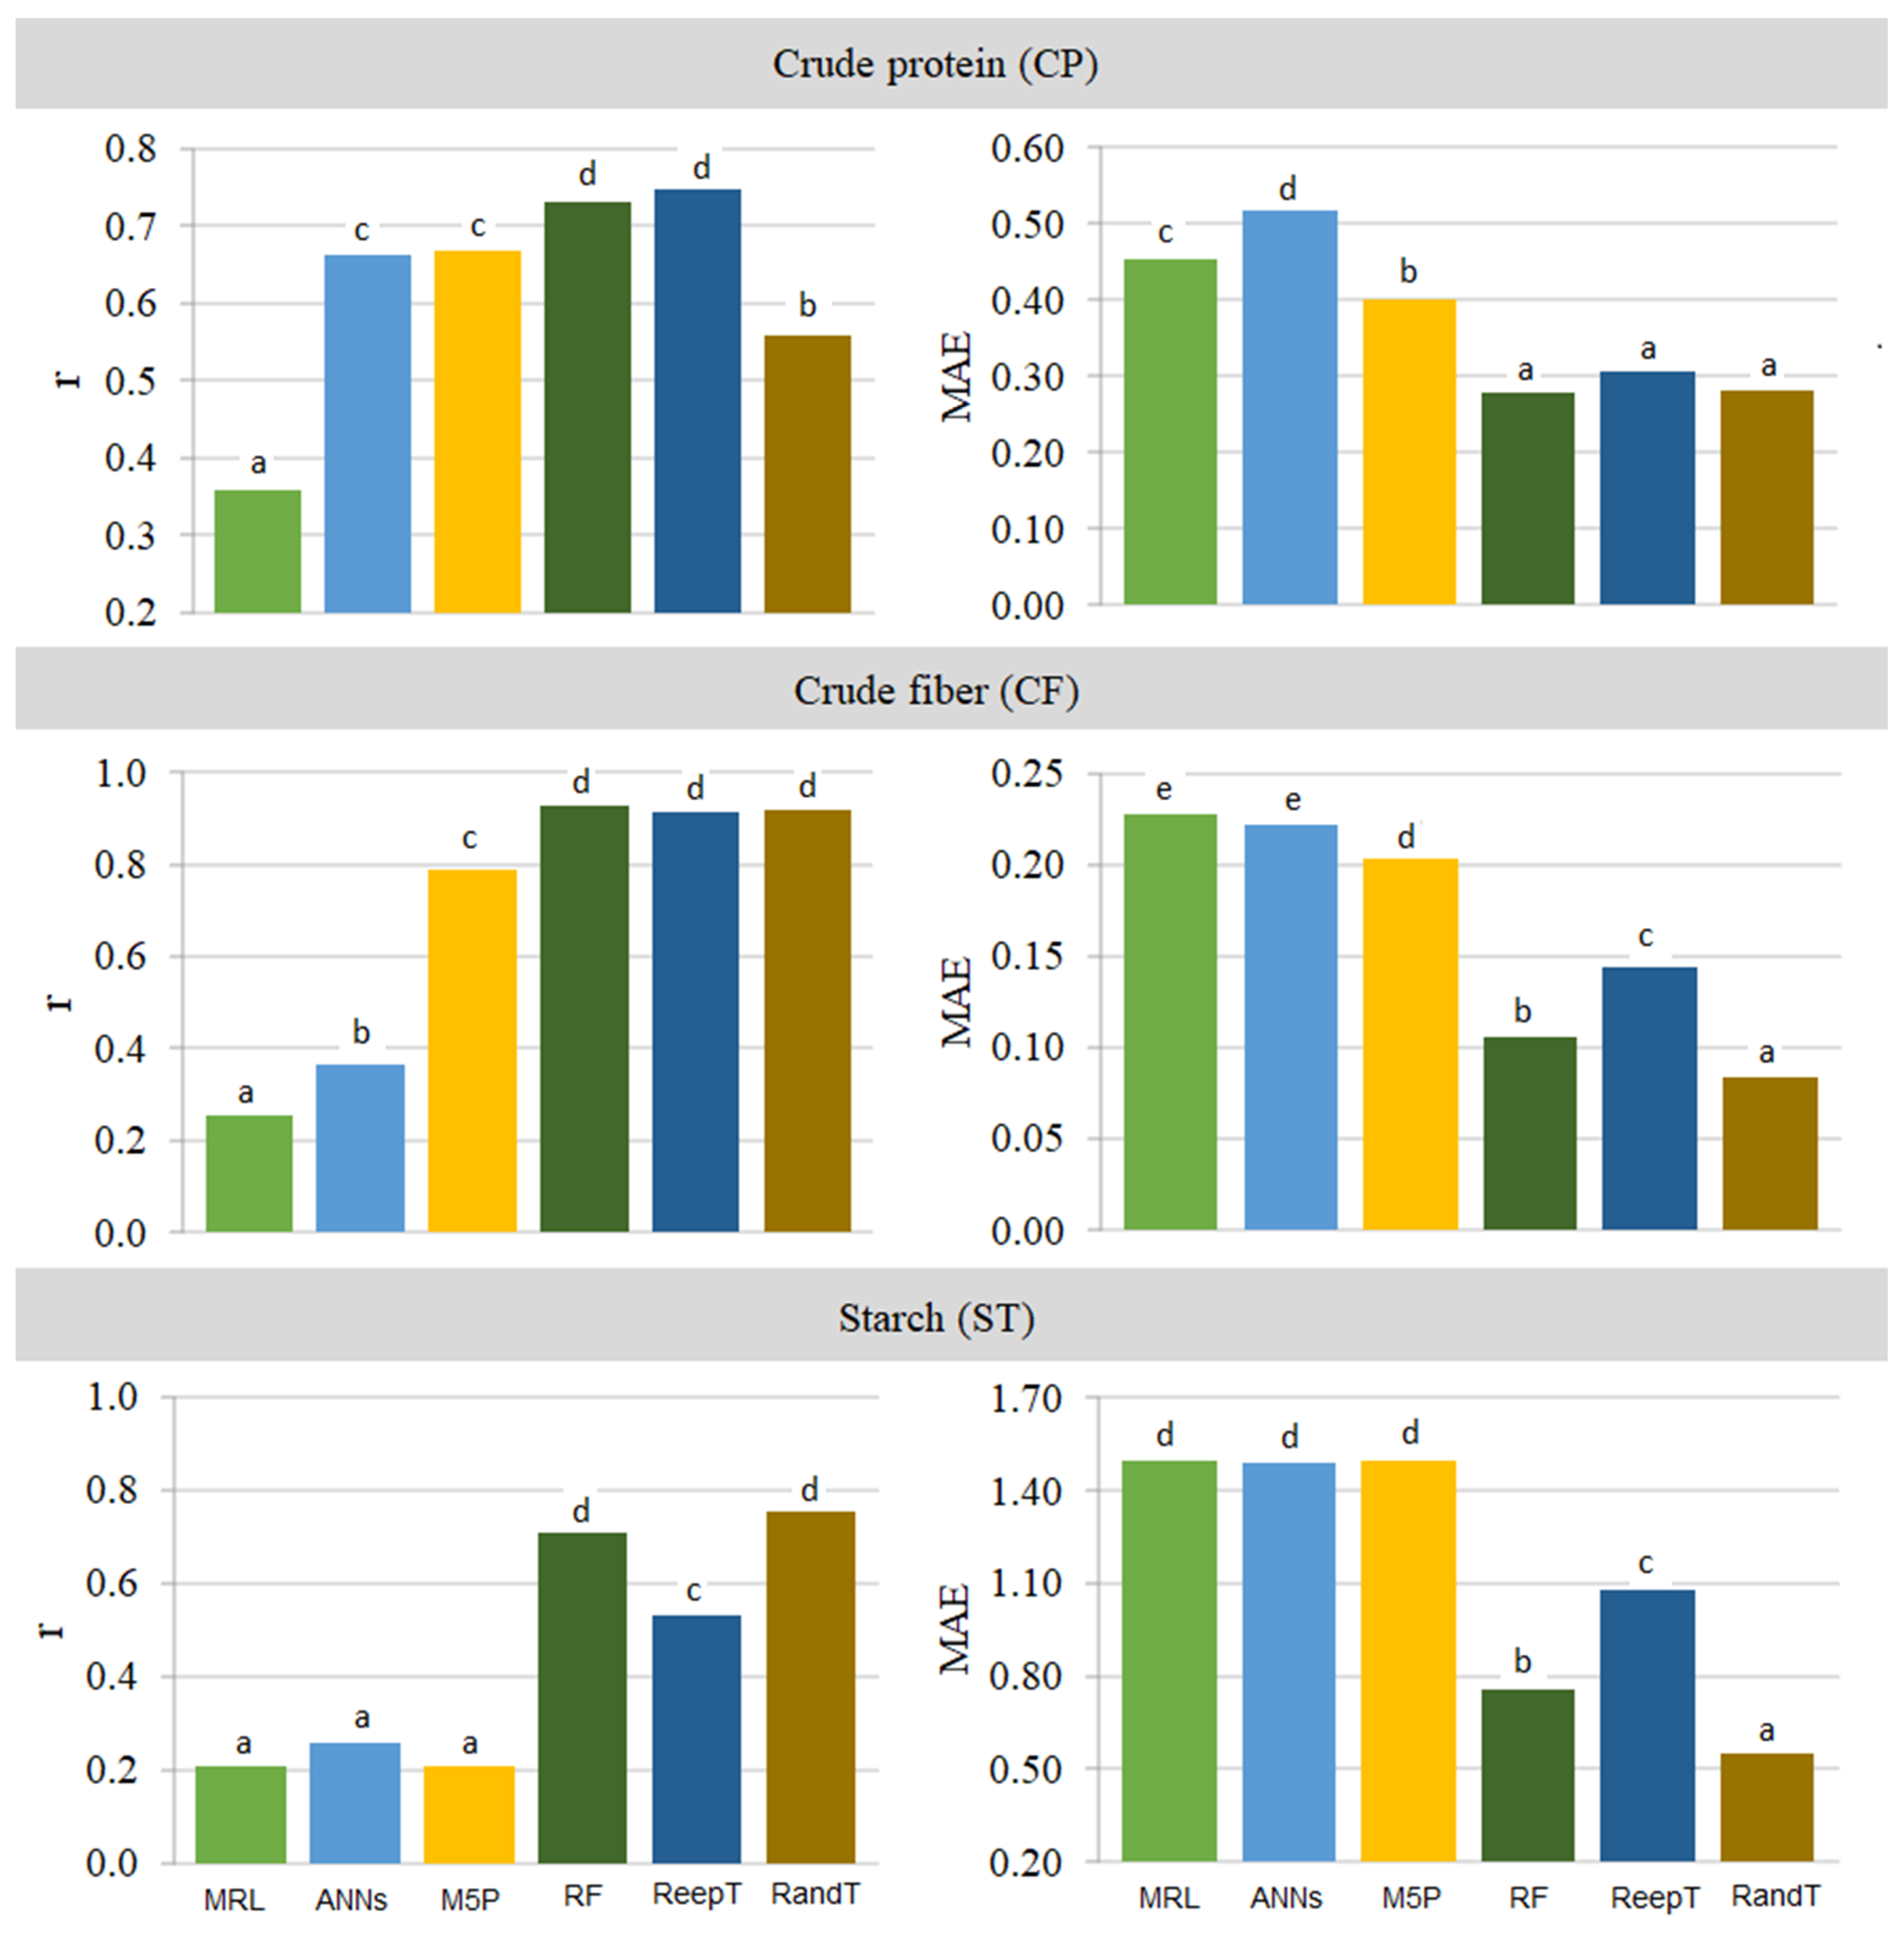
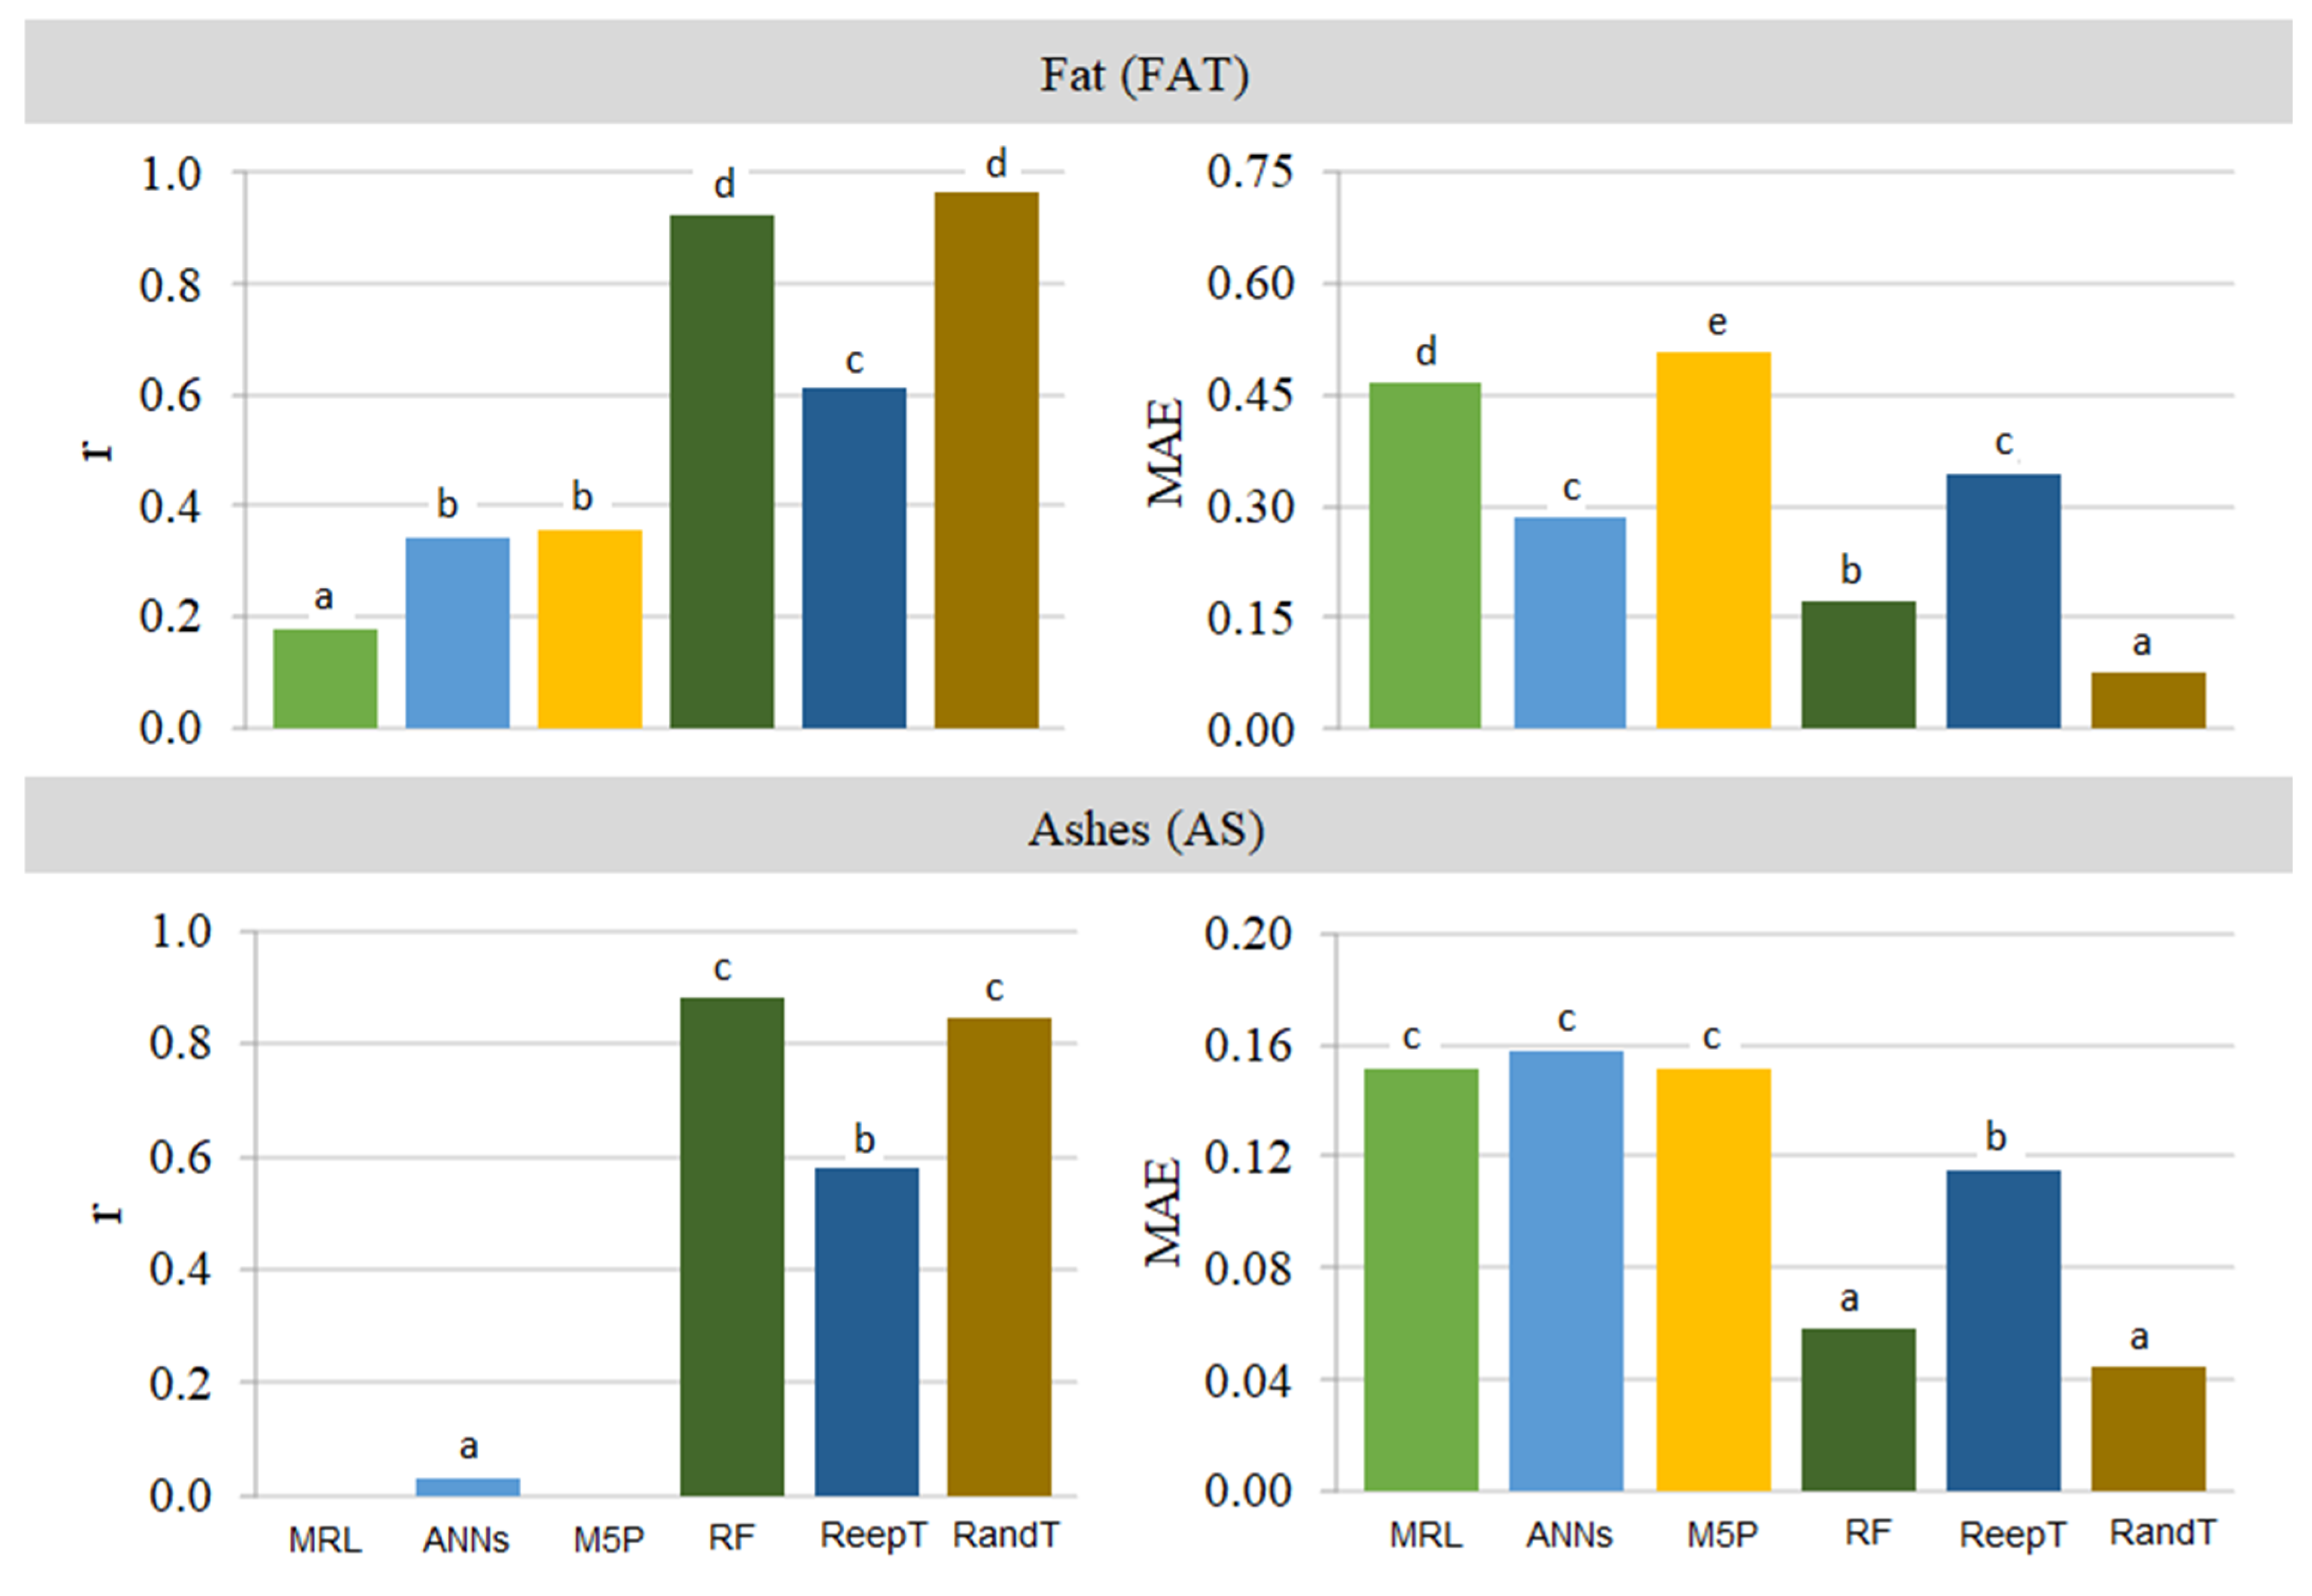
3.2. Defective Rice Grains

The higher the initial water contents (WC) of the grains, the higher the percentages of defects obtained in the processing after drying (Table 5).
In the Figure 6 and Table 6, it is possible to see a positive and strong correlation between the input variables physical defects (GD) and moisture content (MC). Nunes et al. [24] reported that high moisture contents negatively affect the quality of stored rice grains due to increased metabolic activity and increased percentages of physical defects at the end of storage time. Exposing the grain mass to longer drying time left the grains more susceptible to breakage during mechanical processing operations.
Starch content (ST) showed a negative correlation with MC which, although weak, indicated an inverse relationship. Walter et al. [29] reported that drying and storage interfere with the ST of rice. Moreover, ST also showed a very weak negative correlation with physical defects (GD), indicating an inverse relationship between the variables. According to Scariot et al. [30], high MC can influence the formation of chalky grains, which are considered defects by the industry due to the opaque appearance and interference in the cooking of the product, caused by the non-compaction of the starch and protein granules arrangement in the grains that form air spaces between them, resulting in diffraction of the incident light. Chalky conditions reduce the hardness of the grain, making it more fragile to the polishing operation and leading to grain breakage, reducing the physical and chemical quality of the product, which justifies the negative correlation between ST and the percentage of grains with defects (GD) observed in the correlation network.
Starch contents (ST) and the other variables had a medium negative correlation with Fat. There is also a weak negative correlation between ST and ash (AS) contents, corresponding to an inverse relationship between them for rice grains with physical defects (GD). Under the presence of moisture, starch granules expand due to diffusion and absorption, and this procedure is reversible through the drying process of the grain. However, besides altering the starch granules, there may be changes in macronutrients such as lipids and proteins, generating impacts on the physicochemical properties of the grain [26]. Overall, increasing starch content (ST) also interfered inversely with grain mass yield due to susceptibility to the occurrence of physical defects (GD) [1,27]. Furthermore, a positive correlation was observed between Fat × CP and Fat × CF contents, indicating a direct relationship between the variables. This influence is justified by the direct relationship between lipid concentration and grain hardness, which is indirectly associated with the protein and fiber contents present in the physicochemical constitution of the grains. The crude protein content (CP) directly contributed to maintaining the lipid layers in the grains, and its decrease implies the reduction of the fat content [31,32].
Moisture contents (MC) and percentages of physical defects (GD) also showed a weak positive correlation with CP, indicating a direct relationship between them. Nunes et al. [24] observed that rice grains less exposed to high drying temperatures had lower percentages of broken grains and consequently higher crude protein contents. According to Lima et al. [33], high moisture content increases the respiration rate of the grain mass causing oxidation and, as a result, the loss of total carbohydrates, starch, proteins, and other physicochemical components of the grains.
Table 7 shows the correlation coefficient (r), mean absolute error (MAE), and coefficient of determination (R2) between the observed and estimated values of rice grain quality with defects for the different ML models.
Fits obtained by the ML models are shown in Figure 7. The decision tree (REPTree) and Random Forest (RF) models presented the highest correlation coefficients between the observed and predicted variables for CP, and the lowest MAE was observed for the RF model. Thus, both models are suitable for predicting crude protein levels in rice grains with physical defects. The Artificial Neural Networks (ANNs) model obtained the highest MAE for predicting the CP content in rice grains with defects, not being recommended for the prediction of this variable.
For the crude fiber (CF) variable, the RF model showed the highest correlation coefficient (r > 0.92), followed by the Random Tree (RandT) and REPTree models, with r above 0.90. Conversely, among the highlighted models, the lowest MAE was observed for the Random Tree model (RandT), which was lower than 0.085. Given the observed variations, the three models can be indicated to predict the influence of MC on CF. ANN model presented the lowest r and the highest MAE.
Regarding ST prediction (ST), the highest r and the lowest MAE were observed for the Random Tree (RandTree) model (around 0.75 and 0.55, respectively). Additionally, the RF model showed a similar fit to the Random Tree, with r around 0.7 and MAE of 0.75. REPTree, Artificial Neural Networks (ANNs), and M5P models did not provide good prediction fits, with correlation coefficients lower than 0.53.
The fit parameters obtained by ML models for the variables fat (Fat) and ash (AS) are shown in Figure 8. The Random Tree model showed the best fit (r > 0.96 and MAE < 0.076), being indicated to predict the fat contents in rice grains with defects. Likewise, the Random Forest also achieved a high correlation (r > 0.92) [34], and a low MAE between the observed and predicted fat content values, being indicated for predicting the fat content in rice grains with physical defects.
For ash content (AS), the RF model showed the highest correlation coefficient, followed by the Random Tree (RandTree), with correlation coefficients of 0.87 and 0.84, respectively. However, the lowest MAE was found for the Random Tree model (MAE < 0.045), followed by the Random Forest. The increased ash content (AS) is a result of the organic fraction degradation of the grains due to the metabolic activity arising from the presence of water [35,36,37].
Random Tree (RandT) decision tree model presented the best fit to predict the physicochemical variables of rice grains with physical defects as a function of different initial moisture content (MC). Thus, Random Tree is the most suitable among the models studied [38]. The random choice among the attributes present in the tree, which is the property of this model, allowed its constancy in relation to the others studied [39,40].

4. Conclusions

The combination of the non-destructive technology Near-Infrared Spectroscopy and the Machine Learning models characterized successfully the physicochemical composition of whole and defective rice grains, being an alternative to the conventional method of physical classification. The Random Tree model (RandT) was the indicated model to predict the physicochemical quality in whole and defective rice grains for different moisture contents, obtained Pearson’s correlation coefficient (r = 0.96), mean absolute error (MAE = 0.017), and coefficient of determination (R2 = 0.92). The use of near-infrared (NIR) spectroscopy evaluation methods and machine learning models can ensure greater precision, robustness, and agility in evaluating the quality of rice samples in the processing and storage units to reduce subjective errors in manual and visual physical classification.

Author Contributions

Conceptualization, P.C.C., P.E.T. and L.P.R.T.; methodology, P.C.C., P.E.T. and L.P.R.T.; validation, P.C.C. and L.P.R.T.; formal analysis, L.d.O.C., D.M.R. and L.P.R.T.; investigation, P.C.C., D.M.R., R.E.L., R.S.d.M., M.T.N., M.M.L., L.R.L., T.A.V., J.C.R., A.H.S. and N.d.S.B.; resources, P.C.C. and P.E.T.; data curation, L.P.R.T. and D.M.R.; writing—original draft preparation, L.d.O.C., P.C.C., L.P.R.T. and P.E.T.; writing—review and editing, L.d.O.C., P.C.C., L.P.R.T. and P.E.T.; visualization, D.M.R., M.T.N. and N.d.S.B.; supervision, P.C.C.; project administration, P.C.C.; funding acquisition, P.C.C. All authors have read and agreed to the published version of the manuscript.

Funding

This research was funded by CAPES (Coordination for the Improvement of Higher Education Personnel)-Financial Code 001, CNPq (National Council for Scientific Technological Development), and FAPERGS-RS (Research Support Foundation of the State of Rio Grande do Sul) for funding in the research projects, laboratories for carrying out the experiments.

Data Availability Statement

Not applicable.

Acknowledgments

The authors would like to thank UFSM (Federal University of Santa Maria)-Laboratory of Postharvest (LAPOS)-Research Group at Postharvest Innovation: Technology, Quality and Sustainability, and UFMS (Federal University of Mato Grosso do Sul) for their contributions in the research project.

Conflicts of Interest

The authors declare no conflict of interest.

References

  1. Müller, A.; Coradi, P.C.; Nunes, M.T.; Grohs, M.; Bressiani, J.; Teodoro, P.E.; Anschau, K.F.; Flores, E.M.M. Effects of cultivars and fertilization levels on the quality of rice milling: A diagnosis using near-infrared spectroscopy, x-ray diffraction, and scanning electron microscopy. Food Res. Intern. 2021, 147, 110524. [Google Scholar] [CrossRef] [PubMed]
  2. Kuo, T.Y.; Chung, C.L.; Chen, S.Y.; Lin, H.A.; Kuo, Y.F. Identifying rice grains using image analysis and sparse-representation-based classification. Comput. Electron. Agric. 2016, 127, 716–725. [Google Scholar] [CrossRef]
  3. Zareiforoush, H.; Minaei, S.; Alizadeh, M.R.; Banakar, A. Qualitative classification of milled rice grains using computer vision and metaheuristic techniques. J. Food Sci. Technol. 2015, 53, 118–131. [Google Scholar] [CrossRef] [PubMed] [Green Version]
  4. Mittal, S.; Dutta, M.K.; Issac, A. Non-destructive image processing based system for assessment of rice quality and defects for classification according to inferred commercial value. Measurement 2019, 148, 106969. [Google Scholar] [CrossRef]
  5. Burestan, N.F.; Sayyah, A.H.A.; Taghinezhad, E. Prediction of some quality properties of rice and its flour by near-infrared spectroscopy (NIRS) analysis. Food Sci. Nutr. 2020, 9, 1099–1105. [Google Scholar] [CrossRef]
  6. Moreti, M.P.; Oliveira, T.; Sartori, R.; Caetano, W. Artificial intelligence in agribusiness and the challenges for the protection of intellectual property. Prospect. Noteb. 2021, 14. Available online: https://periodicos.ufba.br/index.php/nit/article/view/33098/23546 (accessed on 15 January 2023).
  7. André, G.S.; Coradi, P.C.; Teodoro, L.P.R.; Teodoro, P.E. Predicting the quality of soybean seeds stored in different environments and packaging using machine learning. Sci. Rep. 2022, 12, 8793. [Google Scholar] [CrossRef]
  8. Lutz, É.; Coradi, P.C. Applications of new technologies for monitoring and predicting grains quality stored: Sensors, internet of things, and artificial intelligence. Measurement 2022, 188, 110609. [Google Scholar] [CrossRef]
  9. Ramos, A.P.M.; Osco, L.P.; Furuya, D.E.G.; Gonçalves, W.N.; Cordeiro, D.C.; Pereira, L.R.T.; Junior, C.A.S.; Silva, G.F.C.; Li, J.; Baio, F.H.R.; et al. A Random Forest ranking approach to predict yield in maize with UAV-based vegetation spectral indices. Comput. Electron. Agric. 2020, 178, 105791. [Google Scholar] [CrossRef]
  10. Pazoki, A.; Pazoki, Z. Classification system for rain fed wheat grain cultivars using artificial neural network. Afr. J. Biotechnol. 2011, 10, 8031–8038. [Google Scholar] [CrossRef] [Green Version]
  11. Osco, L.P.; Paula, A.; Ramos, M.; Pereira, D.R.; Akemi, E.; Moriya, S.; Matsubara, E.T. Predicting canopy nitrogen content in citrus-trees using Random Forest algorithm associated to spectral vegetation indices from UAV-imagery. Remote Sens. 2019, 11, 2925–2942. [Google Scholar] [CrossRef] [Green Version]
  12. Hussain, L.; Ajaz, R. Seed Classification using Machine Learning Techniques. J. Multidiscip. Eng. Sci. Technol. 2015, 2, 1098–1102. [Google Scholar]
  13. Kumar, S.; Deswal, S. Estimation of phosphorus reduction from wastewater by artificial neural network, Random Forest and M5P model tree approaches. India. Pollution 2020, 6, 427–438. [Google Scholar] [CrossRef]
  14. Radhika, V.; Rao, V. Computational approaches for the classification of seed storage proteins. J. Food Sci. Technol. 2014, 52, 4246–4255. [Google Scholar] [CrossRef] [Green Version]
  15. Kiratiratanapruk, K.; Temniranrat, P.; Sinthupinyo, W.; Prempree, P.; Chaitavon, K.; Porntheeraphat, S.; Prasertsak, A. Development of Paddy Rice Seed Classification Process using Machine Learning Techniques for Automatic Grading Machine. J. Sens. 2020, 2020, 7041310. [Google Scholar] [CrossRef]
  16. MAPA. Normative Instruction 2/2012. Available online: https://sistemasweb.agricultura.gov.br/sislegis/action/detalhaAto.do?method=visualizarAtoPortalMapa&chave=918108049 (accessed on 15 January 2023).
  17. Mohsenin, N.N. Physical Properties of Plant and Animal Materials; Gordon and Breach Publishers: New York, NY, USA, 1986; 841p. [Google Scholar]
  18. Naldi, M.C.; Campello, R.J.; Hruschka, E.R.; Carvalho, A.C.P.L.F. Efficiency issues of evolutionary k-means. Appl. Soft Comput. 2011, 11, 1938–1952. [Google Scholar] [CrossRef]
  19. Bouckaert, R.; Frank, E.; Hall, M.; Kirkby, R.; Reutemrna, P.; Seewald, A. WEKA Manual for Version 3-7-1; University of Waikato: Hamilton, New Zealand, 2016. [Google Scholar]
  20. Egmont-Petersen, M.; Ridder, D.; Handels, H. Image processing with neural networks a review. Pattern Recognit. 2002, 35, 2279–2301. [Google Scholar] [CrossRef]
  21. Snousy, M.B.A.; El-Deeb, H.M.; Badran, K.; Khlil, I.A.A. Suite of decision tree-based classification algorithms on cancer gene expression data. Egypt. Inform. J. 2011, 12, 73–82. [Google Scholar] [CrossRef] [Green Version]
  22. Blaifi, S.; Moulahoum, S.; Benkercha, R.; Taghezouit, B.; Saim, A. M5P model tree based fast fuzzy maximum power point tracker. Sol. Energy 2018, 163, 405–424. [Google Scholar] [CrossRef]
  23. Belgiu, M.; Dr’aguń, L. Random Forest in remote sensing: A review of applications and future directions. J. Photogram. Remote Sens. 2016, 114, 24–31. [Google Scholar] [CrossRef]
  24. Nunes, M.T.; Coradi, P.C.; Muller, A.; Carneiro, L.O.; Steinhaus, J.I.; Anschau, K.F.; Souza, G.C.; Müller, E.I.; Teodoro, P.E.; Dutra, A.P. Stationary rice drying: Influence of initial moisture contents and impurities in the mass grains on the physicochemical and morphological rice quality. J. Food Proc. Preserv. 2022, 46, e16558. [Google Scholar] [CrossRef]
  25. Coradi, P.C.; Nunes, M.T.; Dutra, A.P.; de Souza, G.A.C.; Carneiro, L.d.O.; Steinhaus, J.I. Evaluation of the operating system of a drying silo storage unit and the quality of rice grains. Res. Soc. Dev. 2020, 9, e235997073. [Google Scholar] [CrossRef]
  26. Denardin, C.C.; Silva, L.P. Estrutura dos grânulos de amido e sua relação com propriedades físico-químicas. Ciência Rural 2009, 39, 945–954. [Google Scholar] [CrossRef] [Green Version]
  27. Cecchi, H.M. Fundamentos Teóricos e Práticos em Análise de Alimentos, 2nd ed.; Unicamp: Campinas, Brazil, 2003; 207p. [Google Scholar]
  28. Zeymer, J.S.; Guzzo, F.; Araujo, M.E.V.; Gates, R.S.; Corrêa, P.C.; Vidigal, M.C.T.R.; Neisse, A.C. Machine learning algorithms to predict the dry matter loss of stored soybean grains (Glycine max L.). J. Food Proc. Eng. 2021, 44, e13820. [Google Scholar] [CrossRef]
  29. Walter, M.; Marchezan, E.; Avila, L.A.D. Rice: Composition and nutritional characteristics. Ciência Rural 2008, 38, 1184–1192. [Google Scholar] [CrossRef] [Green Version]
  30. Scariot, M.A.; Karlinski, L.; Dionello, R.G.; Radünz, A.L.; Radünz, L.L. Effect of drying air temperature and storage on industrial and chemical quality of rice grains. J. Stored Prod. Res. 2020, 89, 101717. [Google Scholar] [CrossRef]
  31. Coradi, P.C.; de Oliveira, M.B.; Carneiro, L.O.; de Souza, G.A.C.; Elias, M.C.; Brackmann, A.; Teodoro, P.E. Technological and sustainable strategies for reducing losses and maintaining the quality of soybean grains in real production scale storage units. J. Stored Prod. Res. 2020, 87, 101624. [Google Scholar] [CrossRef]
  32. Huang, S.J.; Zhao, C.F.; Zhu, Z.; Zhou, L.H.; Zheng, Q.H.; Wang, C.L. Characterization of eating quality and starch properties of two Wx alleles japonica rice cultivars under different nitrogen treatments. J. Int. Agric. 2020, 19, 988–998. [Google Scholar] [CrossRef]
  33. Lima, R.E.; Coradi, P.C.; Nunes, M.T.; Bellochio, S.D.C.; Timm, N.d.S.; Nunes, C.F.; Carneiro, L.d.O.; Teodoro, P.E.; Campabadal, C. Mathematical modeling and multivariate analysis applied earliest soybean harvest associated drying and storage conditions and influences on physicochemical grain quality. Sci. Rep. 2021, 11, 23287. [Google Scholar] [CrossRef]
  34. Jeong, J.H.; Resop, J.P.; Mueller, N.D.; Fleisher, D.H.; Yun, K.; Butler, E.E.; Timlin, D.J.; Shim, K.M.; Gerber, J.S.; Reddy, V.R. Random Forests for Global and Regional Crop Yield Predictions. PLoS ONE 2016, 11, e0156571. [Google Scholar] [CrossRef] [Green Version]
  35. Astaoui, G.; Dadaiss, J.E.; Sebari, I.; Benmansour, S.; Mohamed, E. Mapping wheat dry matter and nitrogen content dynamics and estimation of wheat yield using UAV multispectral imagery machine learning and a variety-based approach: Case study of Morocco. AgriEngineering 2021, 3, 29–49. [Google Scholar] [CrossRef]
  36. Bomoi, M.I.; Nawi, N.M.; Abd Aziz, S.; Mohd Kassim, M.S. Sensing Technologies for Measuring Grain Loss during Harvest in Paddy Field: A Review. AgriEngineering 2022, 4, 292–310. [Google Scholar] [CrossRef]
  37. Zhang, L.; Hashimoto, N.; Saito, Y.; Obara, K.; Ishibashi, T.; Ito, R.; Homma, K. Validation of Relation between SPAD and Rice Grain Protein Content in Farmer Fields in the Coastal Area of Sendai, Japan. AgriEngineering 2023, 5, 369–379. [Google Scholar] [CrossRef]
  38. Goyal, S. Artificial Neural Networks in Fruits: A Comprehensive Review. Intern. J. Image Graph. Sign. Proc. 2014, 6, 53–63. [Google Scholar] [CrossRef] [Green Version]
  39. Martello, M.; Molin, J.P.; Wei, M.C.F.; Canal Filho, R.; Nicoletti, J.V.M. Coffee-Yield Estimation Using High-Resolution Time-Series Satellite Images and Machine Learning. AgriEngineering 2022, 4, 888–902. [Google Scholar] [CrossRef]
  40. Paidipati, K.K.; Chesneau, C.; Nayana, B.M.; Kumar, K.R.; Polisetty, K.; Kurangi, C. Prediction of rice cultivation in India—Support vector regression approach with various kernels for non-linear patterns. AgriEngineering 2021, 3, 182–198. [Google Scholar] [CrossRef]
Figure 1. Representation of the distribution of grain sampling points in storage silos.
Agriengineering 05 00076 g001
Figure 2. Flowchart of steps to determine the quality of rice grains.
Agriengineering 05 00076 g002
Figure 3. Pearson’s correlation network between the analyzed variables: moisture content (MC), yield (YIE), apparent specific mass (ASM), starch (ST), ash (AS), crude fiber (CF), crude protein (CP), and fat (FAT).
Agriengineering 05 00076 g003
Figure 4. Adjustments obtained by Pearson’s correlation coefficient (r) between the observed and predicted values by each Machine Learning model and the mean absolute error (MAE) of the predicted values in relation to the observed values for different rice moisture contents on the prediction of starch (ST), ash (AS) and crude fiber (CF) contents in whole grains. Artificial Neural Network (ANNs), decision tree algorithms REPTree (ReepT), Random Tree (RandT) and Quinlan’s M5 algorithm (M5P), Random Forest (RF), and Multiple Linear Regression (MLR). Means followed by the same letters do not differ by the Scott–Knott test at 5% probability.
Agriengineering 05 00076 g004
Figure 5. Adjustments obtained by Pearson’s correlation coefficient (r) between the observed and predicted values by each Machine Learning model and the mean absolute error (MAE) of the predicted values in relation to the observed values for different rice water contents on the prediction of crude protein (CP), fat (Fat) contents and apparent specific mass (ASM) in whole grains. Artificial Neural Network (ANNs), decision tree algorithms REPTree (ReepT), Random Tree (RandT) and Quinlan’s M5 algorithm (M5P), Random Forest (RF), and Multiple Linear Regression (MLR). Means followed by the same letters do not differ by the Scott–Knott test at 5% probability.
Agriengineering 05 00076 g005
Figure 6. Pearson’s correlation network between the analyzed and predicted variables for rice grains: moisture content (MC), grain defects (GD), starch (ST), ash (AS), crude fiber (CF), crude protein (CP), and fat (Fat).
Agriengineering 05 00076 g006
Figure 7. Adjustments obtained by Pearson’s correlation coefficient (r) between the observed and predicted values by each Machine Learning model and the mean absolute error (MAE) of the predicted values in relation to the observed values for different rice moisture contents on the prediction of crude protein (CP), crude fiber (CF), and starch (ST) contents in grains with physical defects. Artificial Neural Network (ANNs), decision tree algorithms REPTree (ReepT), Random Tree (RandT) and Quinlan’s M5 algorithm (M5P), Random Forest (RF) and Multiple Linear Regression (MLR). Means followed by the same letters do not differ by the Scott–Knott test at 5% probability.
Agriengineering 05 00076 g007
Figure 8. Adjustments obtained by Pearson’s correlation coefficient (r) between the observed and predicted values by each Machine Learning model and the mean absolute error (MAE) of the predicted values in relation to the observed values for different rice water contents on the prediction of fat (Fat), ashes (AS) contents in grains with physical defects. Artificial Neural Network (ANNs), decision tree algorithms REPTree (ReepT), Random Tree (RandT) and Quinlan’s M5 algorithm (M5P), Random Forest (RF), and Multiple Linear Regression (MLR). Means followed by the same letters do not differ by the Scott–Knott test at 5% probability.
Agriengineering 05 00076 g008
Table 1. Characterization of rice sample collection storage silos.
SilosTotal Stored (Sc of 50 kg)Moisture Content (% d.b.)
Silo 142,218.6019
Silo 236,871.4018
Silo 328,660.2017
Silo 446,212.2016
Table 2. Physical and physicochemical quality of whole rice grains in function of moisture content.
Moisture Content
(% d.b.)
Whole Grain
Yield (%)
Crude Protein
(%)
Fat
(%)
Crude Fiber
(%)
Ashes
(%)
Starch
(%)
Specific Apparent Mass (kg m−3)
1949.8848.131.852.080.9270.85585.51
1950.5299.061.822.070.8971.82538.25
1951.0158.231.862.060.8070.75562.79
1952.5368.901.682.040.9771.42517.52
1952.9447.582.022.090.7870.32585.98
1953.8369.071.642.010.9273.21493.52
1953.8367.671.942.060.8572.91588.97
1954.3958.011.772.010.8871.59555.68
1954.5318.271.862.070.8872.53541.94
1954.9768.741.652.020.9571.94524.56
1954.9767.781.922.070.8772.91584.46
1955.0577.781.922.070.8772.91584.46
Average53.836 d8.18 a1.855 a2.065 a0.88 b71.88 b559.235 a
Standard deviation1.7600.5230.1160.0260.0530.93230.826
1858.2378.441.622.091.0971.34548.90
1858.66810.241.512.071.1270.62469.23
1858.9037.191.912.131.0272.47571.40
1859.0308.611.612.061.0772.30493.12
1859.2988.021.862.111.0171.19524.85
1859.53710.191.712.050.9568.98499.48
1859.5647.781.872.101.0271.47561.26
1860.07510.141.752.000.9771.56523.58
1860.1157.4101.942.111.0172.65560.69
1860.70210.811.742.061.0967.39521.58
1861.1437.4901.892.141.0372.38516.77
1861.2237.4901.892.141.0372.38516.77
Average59.5505 b8.23 a1.805 a2.095 a1.025 a71.515 b522.58 b
Standard deviation0.9231.2700.1340.0400.0481.51929.205
1755.0897.451.772.150.9472.46550.98
1755.7528.11.742.111.0272.90498.30
1755.8487.741.962.130.9772.60519.91
1756.0028.251.882.141.0770.06500.51
1756.3987.731.862.101.0672.76509.76
1756.4318.831.722.151.0470.89523.38
1756.5868.021.782.111.0872.18535.72
1756.5868.301.762.151.0072.68514.19
1757.0588.111.782.121.0171.93521.70
1757.1227.711.772.120.9473.12470.51
1757.3528.241.762.141.1071.32520.98
1757.6578.241.762.141.1071.32520.98
Average56.5085 c8.105 a1.77 b2.135 a1.03 a72.32 a520.445 b
Standard deviation0.7080.3490.0660.0170.0550.89619.207
1661.5347.471.852.050.9972.26550.14
1661.7599.001.672.101.1170.51544.36
1662.5478.331.672.101.0070.38491.48
1662.5479.131.782.071.0272.01527.28
1662.7977.561.802.080.9871.35507.31
1662.8187.721.852.101.0772.68552.41
1663.2358.101.952.070.8771.99552.61
1663.9418.781.632.071.0671.22551.15
1664.0838.081.852.040.8272.05551.16
1664.7249.321.662.051.1069.93548.89
1665.7847.401.942.090.9772.09534.21
1666.4567.401.942.090.9772.09534.21
Average63.0265 a8.09 a1.825 a2.075 a0.995 a72.00 a546.625 a
Standard deviation1.4640.6820.1130.0200.0830.82918.960
Means followed by the same letters do not differ by the Scott–Knott test at 5% probability.
Table 3. Coefficients of the associations between the variables (Pearson’s correlation)—whole rice grains.
VariablesMCYIECPFATCFASSTASM
MC1−0.768640.112730.06508−0.30666−0.436540.035680.24787
YIE−0.7686410.00219−0.037300.037040.40562−0.12241−0.16039
CP0.112730.002191−0.66926−0.451800.26111−0.63285−0.36902
FAT0.06508−0.03730−0.6692610.25374−0.497000.300560.54024
CF−0.306660.03704−0.451800.2537410.386400.12262−0.12615
AS−0.436540.405620.26111−0.497000.386401−0.23959−0.45760
ST0.03568−0.12241−0.632850.300560.12262−0.2395910.10019
ASM0.24787−0.16039−0.369020.54024−0.12615−0.457600.100191
Table 4. Machine Learning models applied to physicochemical quality of whole rice grains with different initial moisture contents.
ModelsrMAER2rMAER2
Starch (ST)Ashes (AS)
MLR0.81690.62350.66740.25960.07000.0673
ANNs0.82510.76570.68080.51250.06210.2626
M5P0.96130.42990.92410.46090.06360.2124
RF0.97580.65940.95220.46090.06360.2124
REPTree0.957012.5910.91600.51600.06200.2663
RandTree0.945613.2270.89420.51600.06200.2663
Crude Fiber (FB)Crude Protein (CP)
MRL0.34880.03240.12170.04040.45570.0016
RNAs0.81180.02040.65900.34610.41080.1198
M5P0.78050.01920.60910.06510.45470.0042
RF0.79130.01750.62610.72460.31850.5250
REPTree0.83910.01780.70410.20290.48890.0411
RandTree0.82280.01780.67700.86140.15200.7421
Fat (Fat)Apparent Specific Mass (ASM)
MRL0.20650.10170.04260.183021.49900.0335
RNAs0.22660.10810.05130.427820.18540.1830
M5P0.05000.09810.03450.183021.49900.0335
RF0.64900.06140.42120.518315.78800.2687
REPTree0.46830.08460.21930.392018.79460.1540
RandTree0.73250.04150.53660.488615.55750.2387
Pearson’s correlation coefficient (r), mean absolute error (MAE) and coefficient of determination (R2) for Machine Learning models: Artificial Neural Network (ANN), Decision Tree (REPTree), Random Tree (RandTree), Quinlan’s M5 algorithm (M5P), Random Forest (RF), and Multiple Linear Regression (MLR).
Table 5. Physical and physicochemical quality of rice grains with defects in function of moisture content.
Moisture Content
(% d.b.)
Grain Defects (%)Crude Protein (%)Fat (%)Crude Fiber (%)Aches (%)Starch (%)
160.76810.772.092.481.6565.46
160.79811.493.342.351.7562.64
160.81611.523.242.572.0161.51
160.81611.523.242.572.0161.51
160.85811.593.813.072.2260.9
160.86110.482.222.701.7563.9
160.87111.173.382.591.7664.01
160.88011.073.682.731.6363.40
160.96011.723.463.002.0862.17
160.96911.372.932.741.8262.95
161.00911.191.972.631.7863.03
161.02411.602.672.972.0764.39
Average0.866 d11.43 a3.24 a2.665 c1.80 b62.99 a
Standard deviation0.08150.35620.59980.20900.18321.2795
171.02611.653.342.601.8762.62
171.26911.003.782.961.7461.5
171.29511.733.462.671.9761.73
171.30711.892.722.511.7562.13
171.33212.413.252.872.4160.08
171.38510.842.252.731.9465.38
171.44211.061.872.511.8964.64
171.52810.762.382.602.0063.89
171.52810.762.382.602.0063.89
171.54911.353.512.882.0862.28
171.55511.022.062.571.8165.79
171.66311.263.092.631.9162.29
Average1.4135 c11.16 a2.905 b2.615 c1.925 a62.455 a
Standard deviation0.16610.49250.61460.14390.17061.6338
181.71311.183.462.531.6962.71
181.71311.183.462.531.6962.71
181.95310.812.272.591.8164.01
181.96612.073.733.052.2459.86
181.96612.073.733.052.2459.86
182.09412.203.322.872.0160.03
182.19510.983.302.681.8763.43
182.38011.793.022.861.9961.85
182.40811.372.972.911.9462.39
182.42011.663.762.882.0459.41
182.43310.702.942.601.8664.36
182.44412.153.162.872.0360.99
Average2.1445 b11.515 a3.31 a2.865 a1.965 a62.12 a
Standard deviation0.26640.52270.40940.18220.17261.6616
192.79912.053.843.102.3359.11
192.89511.232.972.772.0561.79
193.06311.993.452.462.0659.49
193.16711.413.353.111.9961.02
193.21112.252.842.671.9062.26
193.29312.662.982.631.7660.88
193.61711.252.772.761.7963.38
193.64512.433.252.571.9561.99
194.07910.882.732.961.9463.00
194.21310.324.314.852.0458.36
195.69212.132.702.382.1360.09
195.70411.662.512.611.8962.62
Average3.455 a11.825 a2.975 b2.715 b1.97 a61.405 c
Standard deviation0.95200.66040.50420.62640.14751.5496
Means followed by the same letters do not differ by the Scott–Knott test at 5% probability.
Table 6. Coefficients of the associations between the variables (Pearson’s correlation)—whole rice grains—defective rice grains.
VariablesMCGDCPFATCFASST
MC10.875680.286640.166840.224350.21161−0.43199
GD0.8756810.231860.039140.218960.18746−0.36516
CP0.286640.2318610.29798−0.156800.45045−0.57519
FAT0.166840.039140.2979810.499720.35167−0.72743
CF0.224350.21896−0.156800.4997210.36886−0.47669
AS0.211610.187460.450450.351670.368861−0.61148
ST−0.43199−0.36516−0.57519−0.72743−0.47669−0.611481
Table 7. Machine Learning models applied to physicochemical quality of rice grains with defects for different initial moisture contents.
ModelsrMAER2RMAER2
Ashes (AS)Crude Fiber (CF)
MLR0.05550.15110.00300.25460.22760.0648
ANNs0.03090.15750.00090.36390.22180.1324
M5P0.05550.15110.00300.79040.20330.6247
RF0.87900.05860.77260.92670.10530.8588
REPTree0.57870.11530.33480.91280.14370.8333
RandTree0.84490.04430.71380.91840.08420.8434
Fat (Fat)Crude Protein (CP)
MLR0.17850.46640.03180.35740.45310.1278
ANNs0.34300.28470.11770.66150.51650.4376
M5P0.35480.50560.12580.66780.40070.4459
RF0.92210.17310.85040.73170.27930.5355
REPTree0.61330.34340.37620.74620.30600.5568
RandTree0.96400.07570.92920.55770.28140.3110
Starch (ST)
MLR0.20631.49600.0425
ANNs0.25891.48800.0670
M5P0.20631.49600.0425
RF0.70960.75860.5036
REPTree0.53001.07700.2809
RandTree0.75400.55150.5686
Pearson’s correlation coefficient (r), mean absolute error (MAE), and coefficient of determination (R2) for Machine Learning models: Artificial Neural Network (ANN), Decision Tree (REPTree), Random Tree (RandTree), Quinlan’s M5 algorithm (M5P), Random Forest (RF), and Multiple Linear Regression (MLR).
Disclaimer/Publisher’s Note: The statements, opinions and data contained in all publications are solely those of the individual author(s) and contributor(s) and not of MDPI and/or the editor(s). MDPI and/or the editor(s) disclaim responsibility for any injury to people or property resulting from any ideas, methods, instructions or products referred to in the content.

