Article

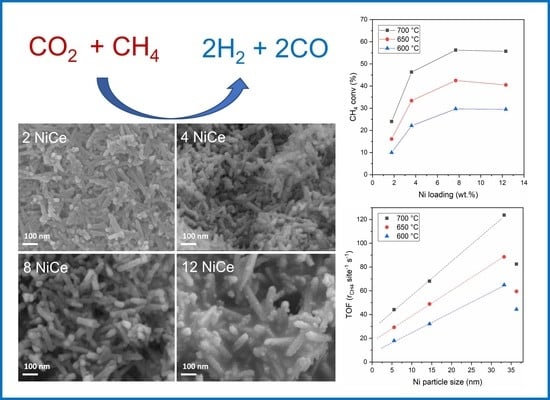
Dry Reforming of Methane on Ni/Nanorod-CeO2 Catalysts Prepared by One-Pot Hydrothermal Synthesis: The Effect of Ni Content on Structure, Activity, and Stability

by
Simonetta Tuti
1,*,
Igor Luisetto
2,
Umberto Pasqual Laverdura
1 and
Eleonora Marconi
1
1
Department of Science, Roma Tre University, Via della Vasca Navale 79, 00146 Rome, Italy
2
Italian National Agency for New Technologies, Energy and Sustainable Economic Development (ENEA), Via Anguillarese 301, 00123 Rome, Italy
*
Author to whom correspondence should be addressed.
Reactions 2022, 3(3), 333-351; https://doi.org/10.3390/reactions3030025
Submission received: 30 April 2022 / Revised: 24 May 2022 / Accepted: 17 June 2022 / Published: 30 June 2022
(This article belongs to the Special Issue Feature Papers in Reactions in 2022)

Abstract

:
The nanorod morphology of the CeO2 support has been recognized as more beneficial than other morphologies for catalytic activity in the dry reforming of methane. Ni/nanorod-CeO2 catalysts with different Ni contents were prepared by one-pot hydrothermal synthesis. Samples were characterized by X-ray diffraction (XRD), H2-temperature-programmed reduction (H2-TPR), H2-temperature-programmed desorption (H2-TPD), field emission scanning electron microscopy/energy dispersive spectroscopy (FE-SEM/EDS), Brunauer–Emmet–Teller (BET) and Barrett–Joyner–Halenda (BHJ) analysis. The effect of Ni content on the size and the intrinsic strain of ceria was analyzed by the Size–Strain plot and Williamson–Hall plot of XRD data. The average Ni particle size and Ni dispersion were determined by H2-TPD. XRD and H2-TPR analysis revealed a strong Ni–support interaction that limited nickel sintering. The activity for the dry reforming of methane was tested with the stoichiometric mixture CO2:CH4:N2:He = 20:20:20:140, gas hourly space velocity (GHSV) = 300 L g−1 h−1, and temperatures in the range of 545–800 °C. The turnover frequency (TOF) value increased linearly with the average Ni particle size in the range of 5.5–33 nm, suggesting the structure sensitivity of the reaction. Samples with Ni loading of 4–12 wt.% showed high H2/CO selectivity and stability over time on stream, whereas the sample with a Ni loading of 2 wt.% was less selective and underwent rapid deactivation. Only a small amount of nanotubular carbon was observed by FE-SEM after the time-on-stream experiment. Deactivation of the low-Ni-content sample is ascribed to the easier oxidation of the small Ni particles.

Graphical Abstract

1. Introduction

Limiting the ever-increasing concentration of greenhouse gases in the atmosphere is urgent and highly required to avoid global warming effects. The major greenhouse gases released into the atmosphere are water vapor, CO2, CH4, N2O, and ozone (EPA 2016). The dry reforming of methane (DRM) with CO2 to form syngas (CO2 + CH4 → 2H2 + 2CO; ΔH° = 247 kJ mol−1) has emerged as a very attractive process for the mitigation of two of the major contributors to global warming, producing a mixture of CO and H2 with a H2/CO ratio equal to one, highly required for the industrial synthesis of hydrocarbons and oxygenated hydrocarbons using the Fischer–Tropsch process. Critical issues for industrial applications of DRM are the occurrence of several simultaneous reactions: the reverse water–gas shift (RWGS) which consumes H2 and produces CO, resulting in a H2/CO molar ratio less than unity; and CH4 decomposition and CO disproportionation (Boudouard reaction), both of which produce coke, which may lead to catalyst deactivation or reactor plugging [1,2,3,4,5].
The industry has a strong interest in developing DRM catalysts that are stable at high temperatures and have high resistance to carbon deposition. Catalysts based on the noble metals Ru, Rh, Pt, and Ir show high activity, selectivity, and stability, limiting the deposition of coke, but they are commercially uncompetitive due to their scarce availability and high cost [4]. Among the more inexpensive transition metals, nickel is the most active and the most investigated but also highly prone to carbon deposition, thanks to its ability to activate the C-H bond [6,7,8]. The size of the nickel particles may affect the activity, selectivity, and the amount and morphology of the deposited coke: small particles are less able to catalyze the cracking of the C-H bond, limiting the carbon deposition, while larger particles seem to favor the growth of tubular graphitic carbon [9]. The catalytic performance of Ni-based catalysts also depends on the support properties, which affect the dispersion of the catalytic phase and metal–support interactions and can participate in the total process in a significant way.
Different reaction mechanisms have been proposed for different active metals and according to the acidity or basicity of the support [8]: in general, it is assumed that the rate-determining step is CH4 activation on metal, whereas the dissociative adsorption of CO2 takes place on the metal or on the metal–support interface.
CeO2 is one of the most studied catalyst carriers due to its thermal stability, oxygen vacancies, ability to store and release oxygen, which can reduce carbon deposition, and the ability to effectively disperse metal particles and prevent them from sintering at high temperatures [10]. These properties are responsible for its excellent performance in the oxidation of CO or alcohols [11], CH4 combustion, CO2 methanation [12], and DRM [13,14].
Recently, there has been attention given to the possibility of preparing CeO2 in different nanoshapes, such as nanorods, nanocubes, or nano-octahedra. The morphology affects the catalytic performance of CeO2-based catalysts for various reactions due to differences in the specific exposed crystallographic facets that affect the metal–support interactions, the number of oxygen vacancies, or acid–basic sites [15]. The nanorod morphology appears to be the most active for the dry reforming of methane or methanol over Ni [16,17,18], CO2 methanation over Ni [19] or Ru [20], CH4 combustion over Pd [21], water–gas shift reaction over Cu [22], and hydrogenation of ethyl levulinate over Ru [23].
The “one-pot” hydrothermal synthesis method of Me/r-CeO2 catalysts consists of the addition of the metal during the synthesis of nanorod cerium oxide through the co-precipitation of the precursors of the metal and of the support. The advantage of the method consists in the possibility of using a quick and simple procedure for the synthesis of the Me/r-CeO2 catalyst as an alternative to the addition of metal to the previously synthesized r-CeO2. As a criticism of the method, the presence of the metal could perturb the crystallization of the nanorod morphology. Our previous experience of Ni/nanorod-CeO2 and Pd/nanorod-CeO2 synthesis [11,12,17] evidenced that the one-pot method ensures good reproducibility of the sample, high dispersion of the metal, and strong Me–support interaction. In this research, we investigated the effect of the Ni content on catalyst morphology, catalytic activity, and stability for the DRM reaction over nickel/nanorod-CeO2 prepared by one-pot hydrothermal synthesis. An important issue of the research is the study of the ceria structure and modification by comparing two methods of XRD data elaboration.

2. Materials and Methods

Materials: NaOH, ethanol, cerium (III) nitrate hexahydrate, and nickel (II) nitrate hexahydrate were purchased by Sigma Aldrich, Darmstadt, Germany.
Synthesis of ceria with nanorod morphology (r-CeO2): cerium (III) nitrate hexahydrate was dissolved in distilled water under stirring. A 12 M NaOH solution was added drop by drop, keeping the suspension under stirring for 30 min, to complete the salt precipitation. The obtained cerium hydroxide suspension was heated to 110 °C under hydrothermal conditions in a steel reactor with an internal Teflon chamber, placed in an oven (FED115, Binder, Tuttlingen, Germany) (heating ramp 10 °C min−1), and maintained at the final temperature for 24 h. The reactor was then cooled; the precipitate was filtered, washed with water until a neutral pH was obtained, and washed with ethanol as the last step. The precipitate was dried in air at 110 °C and then calcined in air at 500 °C (heating ramp 2 °C min−1) for 5 h in a muffle furnace (CWF, Carbolite, Hope Sheffield, England).
The one-pot hydrothermal synthesis of Ni/r-CeO2 catalysts consists of the addition of nickel during the synthesis of nanorod-CeO2 through the co-precipitation of the nickel and cerium precursors. The synthesis in detail: stoichiometric quantities of cerium (III) nitrate hexahydrate and nickel (II) nitrate hexahydrate, corresponding to 2 wt.%, 4 wt.%, 8 wt.%, and 12 wt.% (Ni mass × 100/catalyst mass), were dissolved in water under stirring. The complete precipitation of the salts was obtained by adding a 12 M NaOH solution drop by drop and stirring the suspension for 30 min. The suspension was then heated up to 110 °C (heating ramp 10 °C min−1) in hydrothermal conditions for 24 h, then cooled, filtered, washed, dried, and finally calcined at 500 °C with the same procedure and conditions used for pure r-ceria synthesis, obtaining NiO/r-CeO2. For the sake of brevity, the catalysts are indicated with the abbreviation xNiCe, where x is the nominal nickel content in wt.%.
H2-temperature programmed reduction (H2-TPR) and H2-temperature programmed desorption (H2-TPD) characterizations were performed using a TPDRO1100 (Thermo Fisher Scientific, Waltham, MA, USA) instrument. The sample (0.100 g) was pre-treated in a 5% O2/He flow mixture (20 cm3 min−1) at 400 °C for 30 min. The reduction was achieved by flowing a 5% H2/Ar (30 cm3 min−1) mixture and raising the temperature from 50 °C up to 800 °C (heating rate of 10 °C min−1), maintaining the final temperature for 1 h. After H2-TPR at 800 °C, the sample was cooled to 50 °C in a hydrogen flow (30 cm3 min−1) to promote the chemisorption of hydrogen. The sample was then heated in Ar flow (30 cm3 min−1, heating rate 20 °C min−1) from 50 °C up to 800 °C, obtaining the desorption of the hydrogen chemisorbed on the surface (H2-TPD). The H2 consumption or evolution was measured by a thermal conductivity detector (TCD), which was calibrated by the reduction of a known mass of CuO (purity 99.99%). From the H2 adsorbed on nickel, we can estimate the particle size, dNiTPD (nm), and dispersion, DNi (%), of active nickel by Equations (1) and (2), assuming Ni:H = 1:1 as chemisorption stoichiometry.
d Ni TPD ( nm ) = f · W Ni ρ Ni · η · N A · S f · A Ni × 10 5
D Ni ( % ) = η · S f · M Ni W Ni × 10 4
where f = 6, the geometrical factor for a spherical particle; WNi = wt.% of Ni; ρNi = 8.9 g/cm3, density of Ni; η = H2 adsorbed on Ni (mol/g); NA = 6.023 × 10²³; Sf = 2, stoichiometric factor for the chemisorption of H2 (Ni mol/H2 mol); ANi = 6.51 × 10⁻¹⁶ cm2, surface area occupied by a nickel atom; and MNi = 58.69 g/mol, atomic mass of Ni.
X-ray diffractograms (XRD) of the powders were recorded using a Scintag X1diffractometer (Scintag Inc., San Francisco, CA, USA) equipped with a Cu Kα source (λ = 1.5406 Å) in the Bragg–Brentano configuration θ–θ, with 2θ = 20–80 intervals, 0.05° increments, and 3 s acquisition time. The NiO and Ni0 crystallite sizes were estimated from the NiO (200) and Ni (111) reflections by the Scherrer Equation (3), where 0.9 is the dimensionless crystallite-shape factor, λ is the wavelength of the X-ray, β is the full-width half-maximum (FWHM) after subtracting the instrumental broadening, and θ is the Bragg angle.
d ( nm ) = 0.9   λ β cos θ
The size and intrinsic strain of CeO2 crystallites were calculated by the Williamson–Hall plot (W-H) and the Uniform Deformation Model (UDM), as reported in [24], where the full width at half maximum, β T , of the diffraction peaks depends on the strain-induced broadening ε, according to the following Equation (4):
β T cos   θ   = K λ d + 4 ε   sin   θ
The slope of the linear fitting of the W-H plot provides the intrinsic strain, whereas the intercept (Kλ/d) gives the average size of the nanocrystals.
The size and strain of CeO2 crystallites were also calculated by the Size–Strain plot (SSP) using Equation (5), where βhkl is the full width at half maximum of the XRD peak fitted as a Lorentzian curve, and dhkl is defined in Equation (6) [24]:
( d hkl   β hkl   cos   θ ) 2 = K λ d   (   d hkl 2   β hkl   cos   θ ) + ε 4  
  d hkl 2 = a 2 h 2 + k 2 + l 2
The slope of the linear fitting of the SSP provides the average size, whereas the intercept gives the intrinsic strain of the crystallites.
The lattice parameter, a(Å), was calculated by Equation (7):
a ( ) = λ 2 s i n   θ   h 2 + k 2 + l 2
The morphology of calcined samples was examined using a field emission scanning electron microscope (FE-SEM) Zeiss Sigma 300 VP (Carl Zeiss Microscopy, Jena, Germany). The morphology of catalysts after the time on stream (TOS) experiment was investigated using an ultra-high-resolution FE-SEM LEO 1530 (Carl Zeiss Microscopy, Jena, Germany). To carry out the analysis, the sample was dispersed in isopropyl alcohol using an ultrasonic bath and deposited on a graphite film.
The adsorption–desorption isotherms of N2 were obtained at a temperature of 77 K using a Gemini V (Micromeritics Instrument Corporation, Norcross, GA, USA) apparatus. The surface area (S.A.) was calculated with the Brunauer–Emmett–Teller (BET) method in the equilibrium pressure range of 0.05 < p/p° < 0.5. The pore size distribution (PSD) was obtained from the desorption branch of the isotherm using the Barrett–Joyner–Halenda (BJH) method, and the total pore volume was calculated from the maximum adsorption point at p/p° = 0.99. Before N2 adsorption, the sample (40–45 mg) was degassed in He flow at 350 °C for 1 h.
The activity for the dry reforming of methane with CO2 was tested in a fixed-bed quartz reactor (diameter = 6 mm) inserted in a tubular furnace and connected to a flow apparatus at atmospheric pressure with independent mass flow regulators (170A MKS Instruments Inc., Munich, Germany). The temperature of the catalytic bed was measured by a thermocouple in contact with the catalyst. The gas mixture was analyzed by an Agilent 7820 gas chromatograph (Agilent Technologies, Santa Clara, CA, USA) equipped with Molecular Sieve X13 and Hayesep Q (Sigma-Aldrich, Darmstadt, Germany) columns and a TCD detector. The sample (40 mg) was pressed at 4 tons, ground in an agate mortar, and then mixed with 100 mg of silicon carbide. The sample was pre-reduced in situ with H2/Ar flow 50 vol.% (100 cm3 min−1), increasing the furnace temperature from 50 °C up to 800 °C at a ramp of 10 °C min−1 and maintaining it at 800 °C for 1 h. The reagent mixture CO2:CH4:N2:He = 20:20:20:140 vol.% (stoichiometric ratio, total flow rate = 200 cm3 min−1, gas hourly space velocity (GHSV) = 300 L g−1 h−1) was introduced into the reactor at 800 °C. The catalytic test was performed in the temperature range of 800–545 °C, decreasing the temperature by steps of 50 °C. The percentage conversions of CH4 and CO2 (Xi%) were calculated by Equation (8), and the percentage yields (Y%) were determined by Equations (9) and (10), using N2 as the internal standard, where %i0 and %N20 are the inlet concentrations, and %i and %N2 are the outlet concentrations of the reactants (i = CH4 or CO2) and of N2, respectively.
X i ( % ) = ( 1 % i   · % N 2 0 % i 0 · % N 2 ) × 100
Y CO ( % ) = ( % CO % CO 2 + % CO + % CH 4 ) × 100
Y H 2 ( % ) = ( % H 2 2   % CH 4 0 ) × 100
The H2/CO ratio was calculated as the molar ratio.
The carbon balance was calculated by Equation (11), where F0 and F are the total flow inlet and outlet of the reactor, respectively:
  C bal ( % ) = F ( % CO 2 + % CO + % CH 4 ) F 0 ( % CO 2 0 + % CH 4 0 ) × 100
The reaction rate for CH4 consumption (-rCH4) was calculated with Equation (12), where F°CH4 is the inlet flow of CH4, and m (g) is the catalyst mass. The apparent activation energy, Ea, was estimated by the Arrhenius plot, based on Equation (13), where R is 8.31 JK−1mol−1, T (K) is the reaction temperature, and C is the natural logarithm of the pre-exponential factor.
r CH 4 ( mol · g 1 · s 1 ) = F ° CH 4 · X CH 4 m
ln ( r ) = E a RT + C
The turnover frequency, TOF (s−1), as the number of CH4 molecules reacted per second per surface nickel site, was calculated using the dispersion value of nickel on the surface obtained from the H2-TPD analysis, DNi, with Equation (14):
TOF   ( s 1 ) = F ° CH 4   X CH 4   M Ni   m   D Ni   W Ni × 10 4
where MNi = 58.69 g/mol, the atomic mass of Ni; m is the catalyst mass (g); and WNi = wt.% of Ni.

3. Results

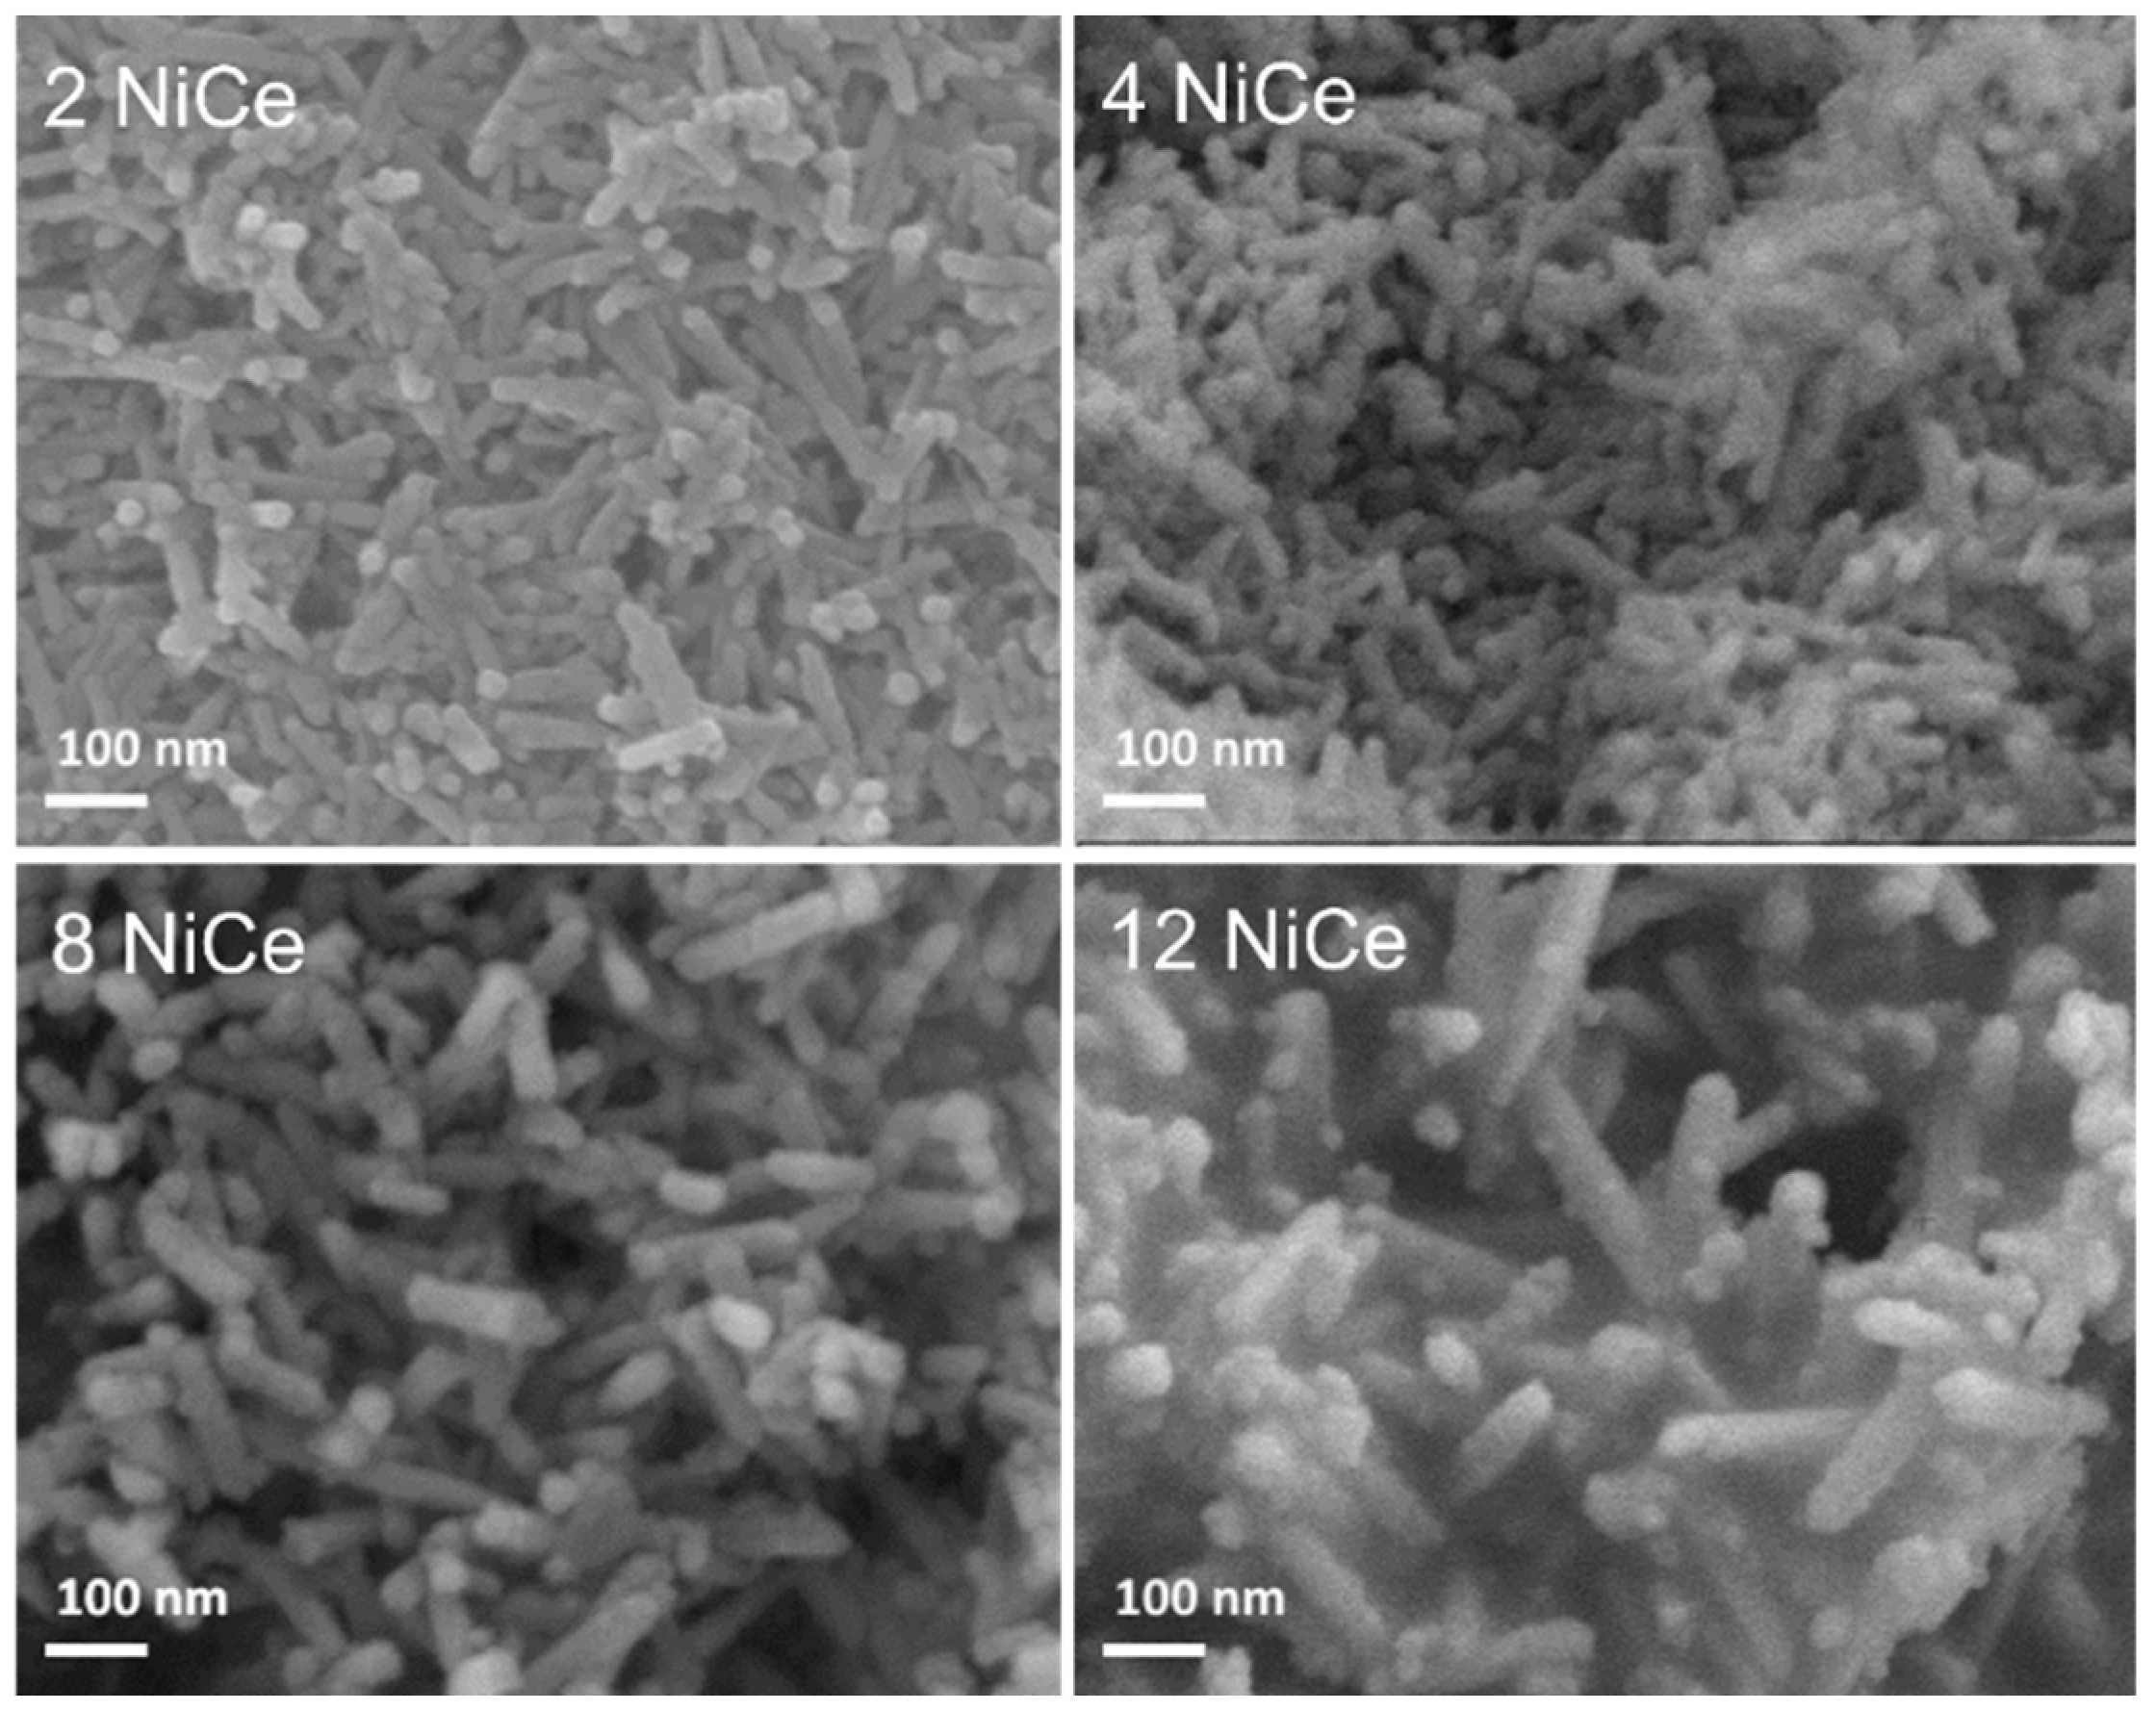
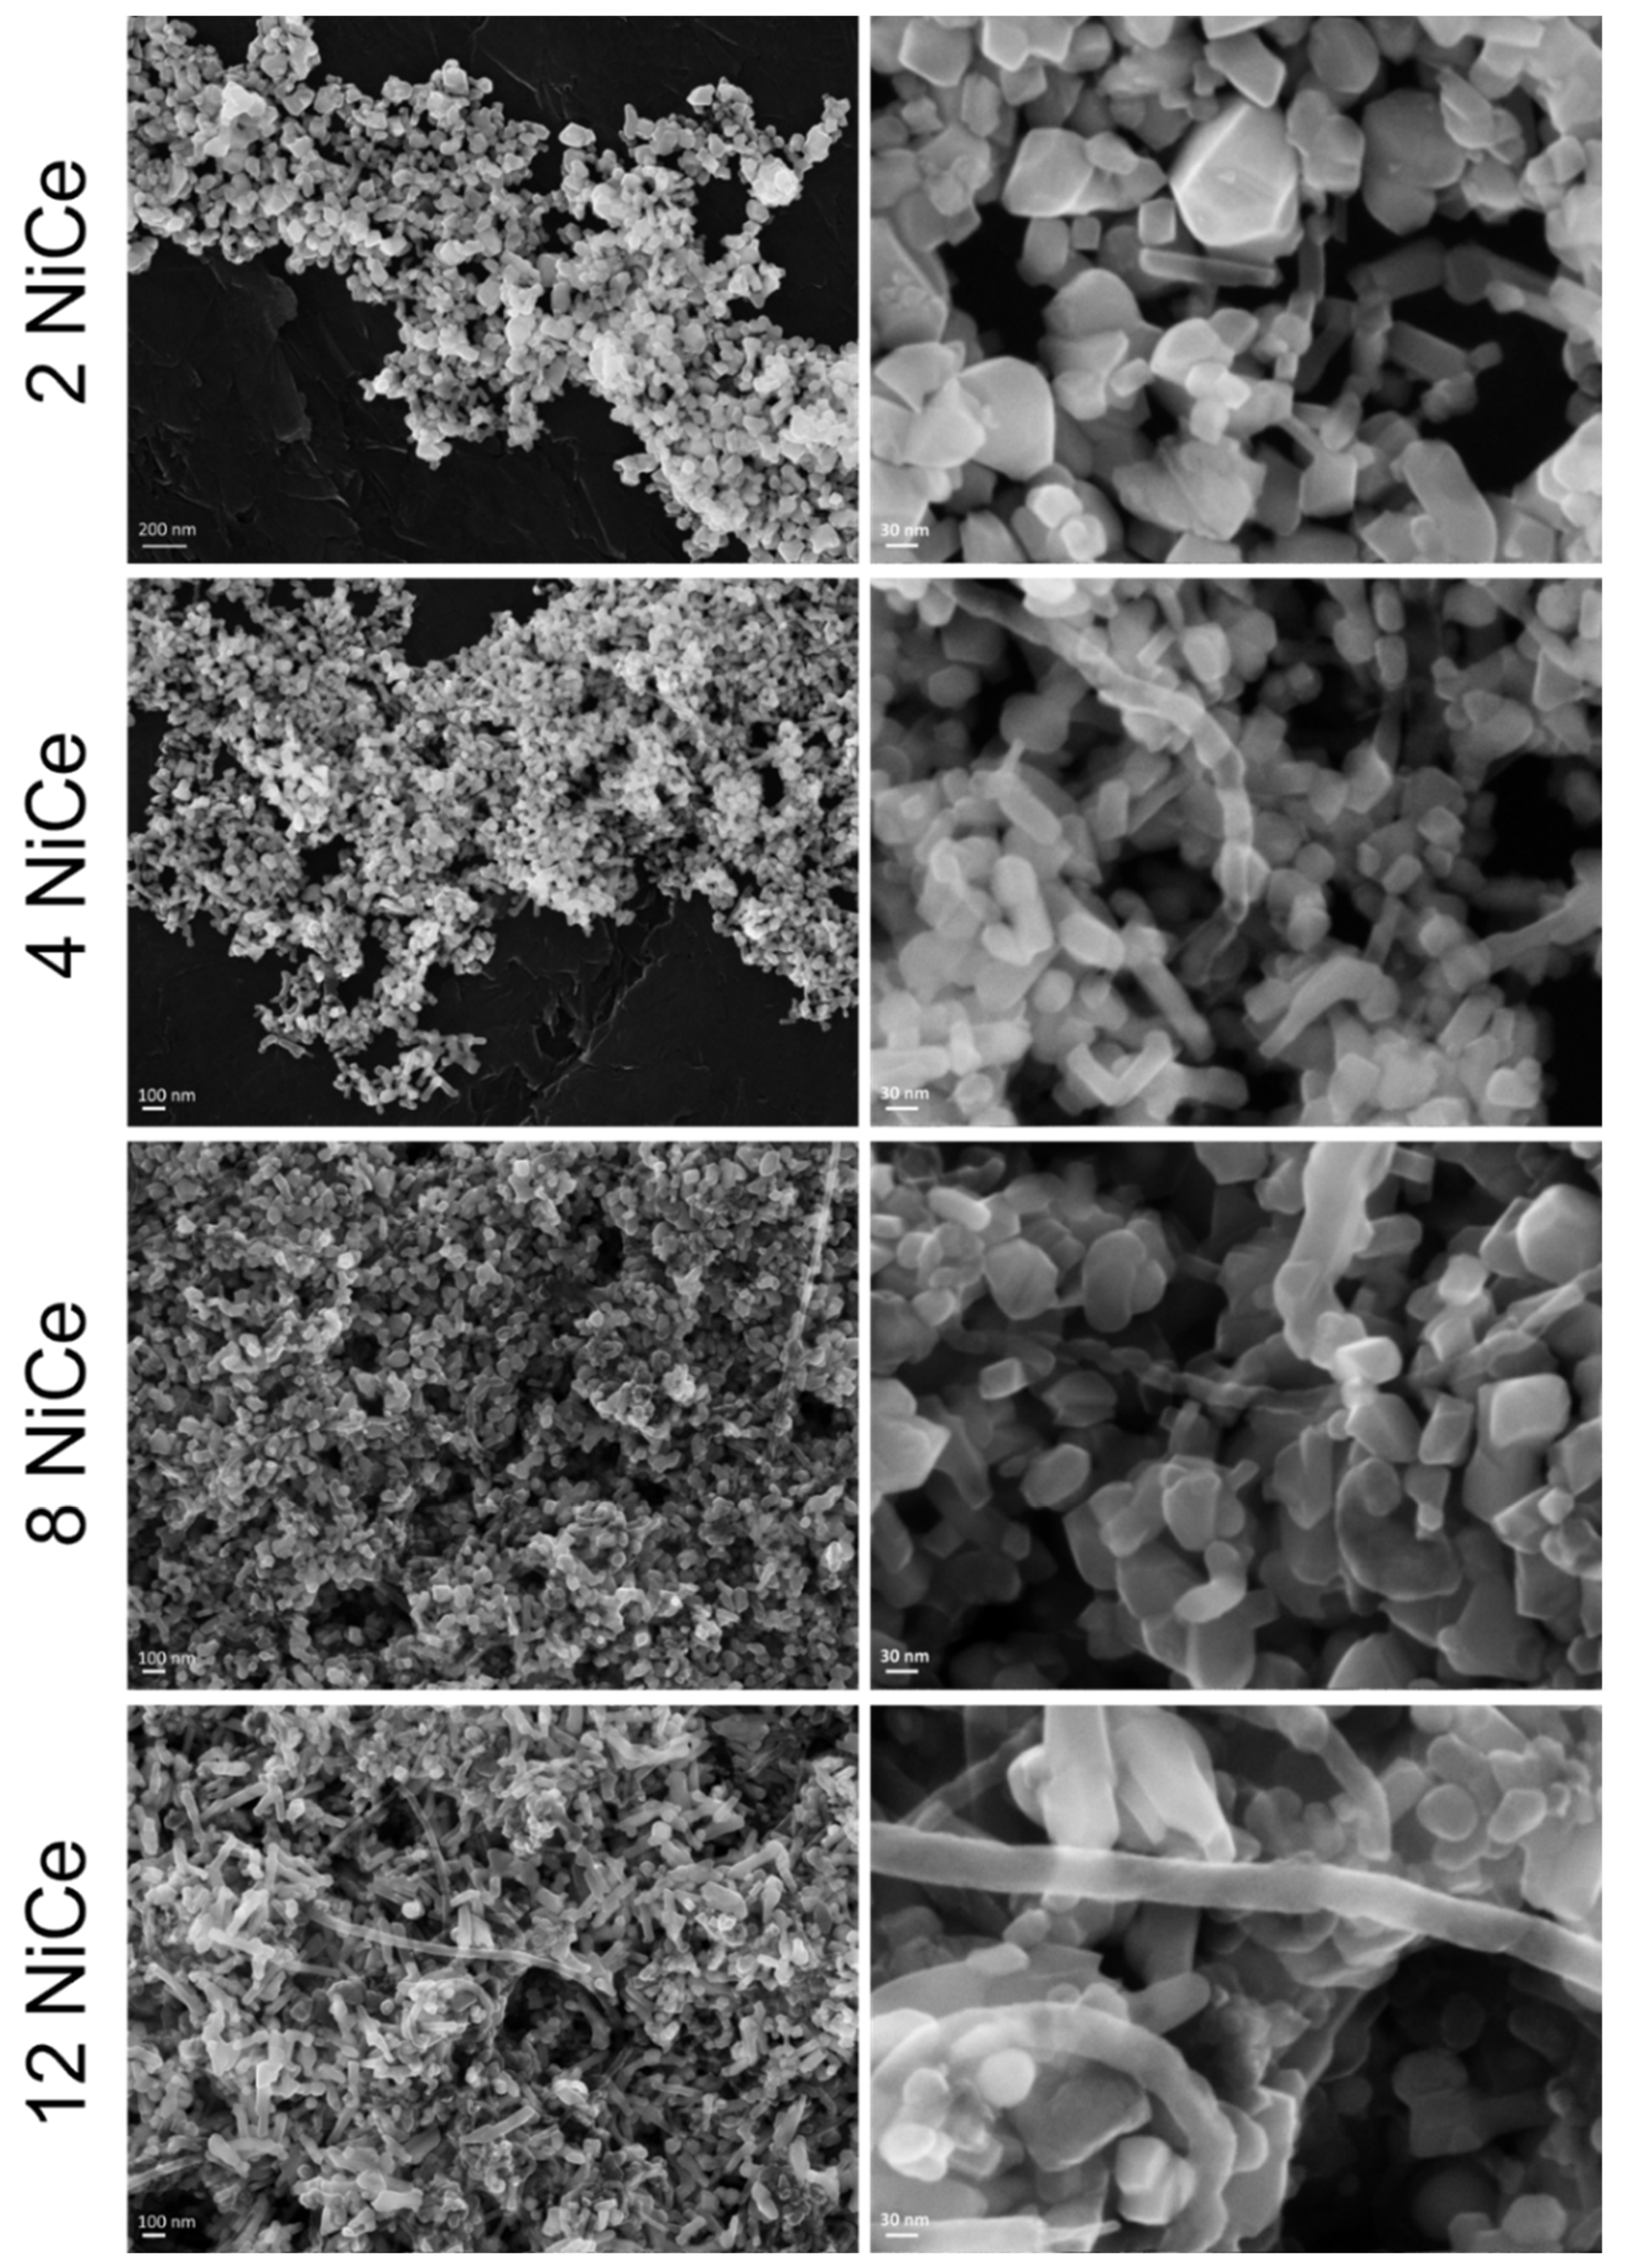
3.1. Morphology and Chemical Composition of Reduced NiCe Sample

The FE-SEM images of the NiCe catalysts show the formation of a well-developed nanorod morphology (Figure 1). The range of values of length and width are reported in Table 1. The nanorod dimensions appear to increase with the increase in Ni content; nanorods appear partially attached and fused in the most concentrated sample, 12NiCe.
The chemical composition of the samples was analyzed by energy dispersive X-ray spectrometry (EDS) (Supplementary Materials: Figure S1). The analysis, carried out on a series of points with a diameter of 10 × 10 μm2 of the powder sample, gives the atomic percentage composition as an average value, which confirms the nominal composition with good approximation (Table 1). The elemental mapping of samples (Supplementary Materials: Figure S2) shows the nickel element uniformly dispersed on ceria for all samples.

3.2. Material Reducibility

Since the active species for the dry reforming reaction is the metallic nickel phase of the reduced samples, we investigated the nickel oxide reduction process of calcined NiO/r-CeO2 samples by temperature-programmed reduction (H2-TPR) experiments.
The reduction profiles of xNiCe catalysts at temperatures up to 800 °C, carried out in the same conditions as the in situ catalytic pre-treatment, are reported in Figure 2, together with the profile of the pure r-CeO2 support reduced at temperatures up to 1010 °C. Pure r-CeO2 shows peaks at 200 °C and 400 °C due to the surface reduction Ce(IV) → Ce(III) and a peak above 550 °C due to bulk ceria reduction. The total consumption of hydrogen for r-CeO2 up to 800 °C corresponds to a reduction of about 23% of Ce(IV) based on the stoichiometry in Equation (15) (Table 2).
The H2-TPR profiles of xNiCe samples at temperatures up to 800 °C show several nickel reduction peaks in two temperature ranges: 200–300 °C and 300–450 °C. Peaks at low temperatures are the main fraction of H2 consumption in more diluted samples, and their intensity decreases with the Ni content (Table 2). These peaks are not observed on the pure r-CeO2 support, suggesting that they are related to the presence of nickel, which may even facilitate the surface reduction of CeO2. For these reasons, they are attributed to the reduction of highly dispersed Ni–O–Ce species and to the surface reduction Ce(IV) → Ce(III). The intense peak in the range of 300–450 °C, the intensity of which increases with Ni content, is assigned to the reduction of NiO dispersed on ceria and its strong interactions with the support. The weak hydrogen consumption in the range of 500–800 °C is due to the reduction of bulk ceria. The profiles and attributions are in agreement with literature data [25].
The theoretical consumption of hydrogen for the total reduction of Ni corresponds to the molar ratio H2/Ni = 1 in Equation (16). The total hydrogen consumption increases with the nickel content (Table 2), reaching a H2/Ni molar ratio slightly greater than 1, except for the most concentrated sample, which showed H2/Ni = 1.
2Ce4+ + H2 → 2Ce3+
Ni2+ + H2 → Ni0
The shape and the temperature of the peaks suggest that NiO on calcined samples was completely reduced below 450 °C; therefore, the excess in H2 consumption is attributed to the reduction of Ce(IV) and permits calculating the percentage of Ce(IV) reduced to Ce(III). Ce(III) corresponds to 21% of cerium for the most diluted 2NiCe sample, very close to the value of pure r-CeO2, and decreases as the nickel content increases, up to a minimum of 3.4% of ceria reduction for the most concentrated 12NiCe sample. These findings are in agreement with the significant surface area decrease with the increase in nickel content (see the following paragraphs) and with a homogeneous nickel dispersion on the surface in all samples.

3.3. Nickel Dispersion by H2-TPD

The amount of H2 adsorbed on reduced nickel and the temperature of its desorption provide information about particle size and metal dispersion on the support after the reduction treatment, parameters that strongly influence the catalytic activity.
Figure 3a shows the H2-TPD profiles of the r-CeO2 support and of NiCe samples reduced at 800 °C. H2-TPD of Ni-CeO2 systems is not common in the literature due to the difficulty of analyzing the profile in the presence of the H2 spill-over phenomenon on ceria-based catalysts. In Figure 3a, H2 desorption from the r-CeO2 bare support starts at 300 °C and produces a uniform peak centered at about 550 °C, which could be attributed to the hydrogen adsorbed on CeO2 as hydroxyl. H2 desorption from Ni/r-CeO2 catalysts appears more complex and moves at the lower temperature range of 75–500 °C. As the nickel content increases, the total hydrogen uptake decreases from 198 to 135 mmol g−1 (Table 3) and especially decreases the intensity of the peak centered at 400 °C, which, for this reason, may be attributed to H2 desorption from the support. H2 desorption at low temperatures (75–250 °C) could be tentatively attributed to hydrogen adsorbed on nickel atoms. To support this hypothesis, we report the H2-TPD profile of the 2NiCe sample reduced at temperatures up to 500 °C as a reference, which underwent less pronounced nickel sintering and supports smaller Ni particles (14 nm instead of 21 nm, evaluated by XRD analysis) (Figure 3a, profile 6). The peak position of profile 6, combined with its greater intensity, strongly suggests the attribution of peaks at 75–250 °C to hydrogen adsorbed on Ni sites. With the deconvolution of the H2-TPD profiles (Figure 3b), it is possible to measure the area of the α and β components, attributed to H2 desorbed from nickel species, from which the average particle size of active nickel, dNiTPD(nm), and the nickel dispersion, DNi(%), can be estimated based on Equations (1) and (2), assuming Ni:H = 1:1 as chemisorption stoichiometry. Table 3 reports the data and calculated values.
As expected, the nickel particle size increases with the nickel content from 5.5 to 36 nm. In agreement, the corresponding nickel dispersion decreases from 18% to 2.8%.

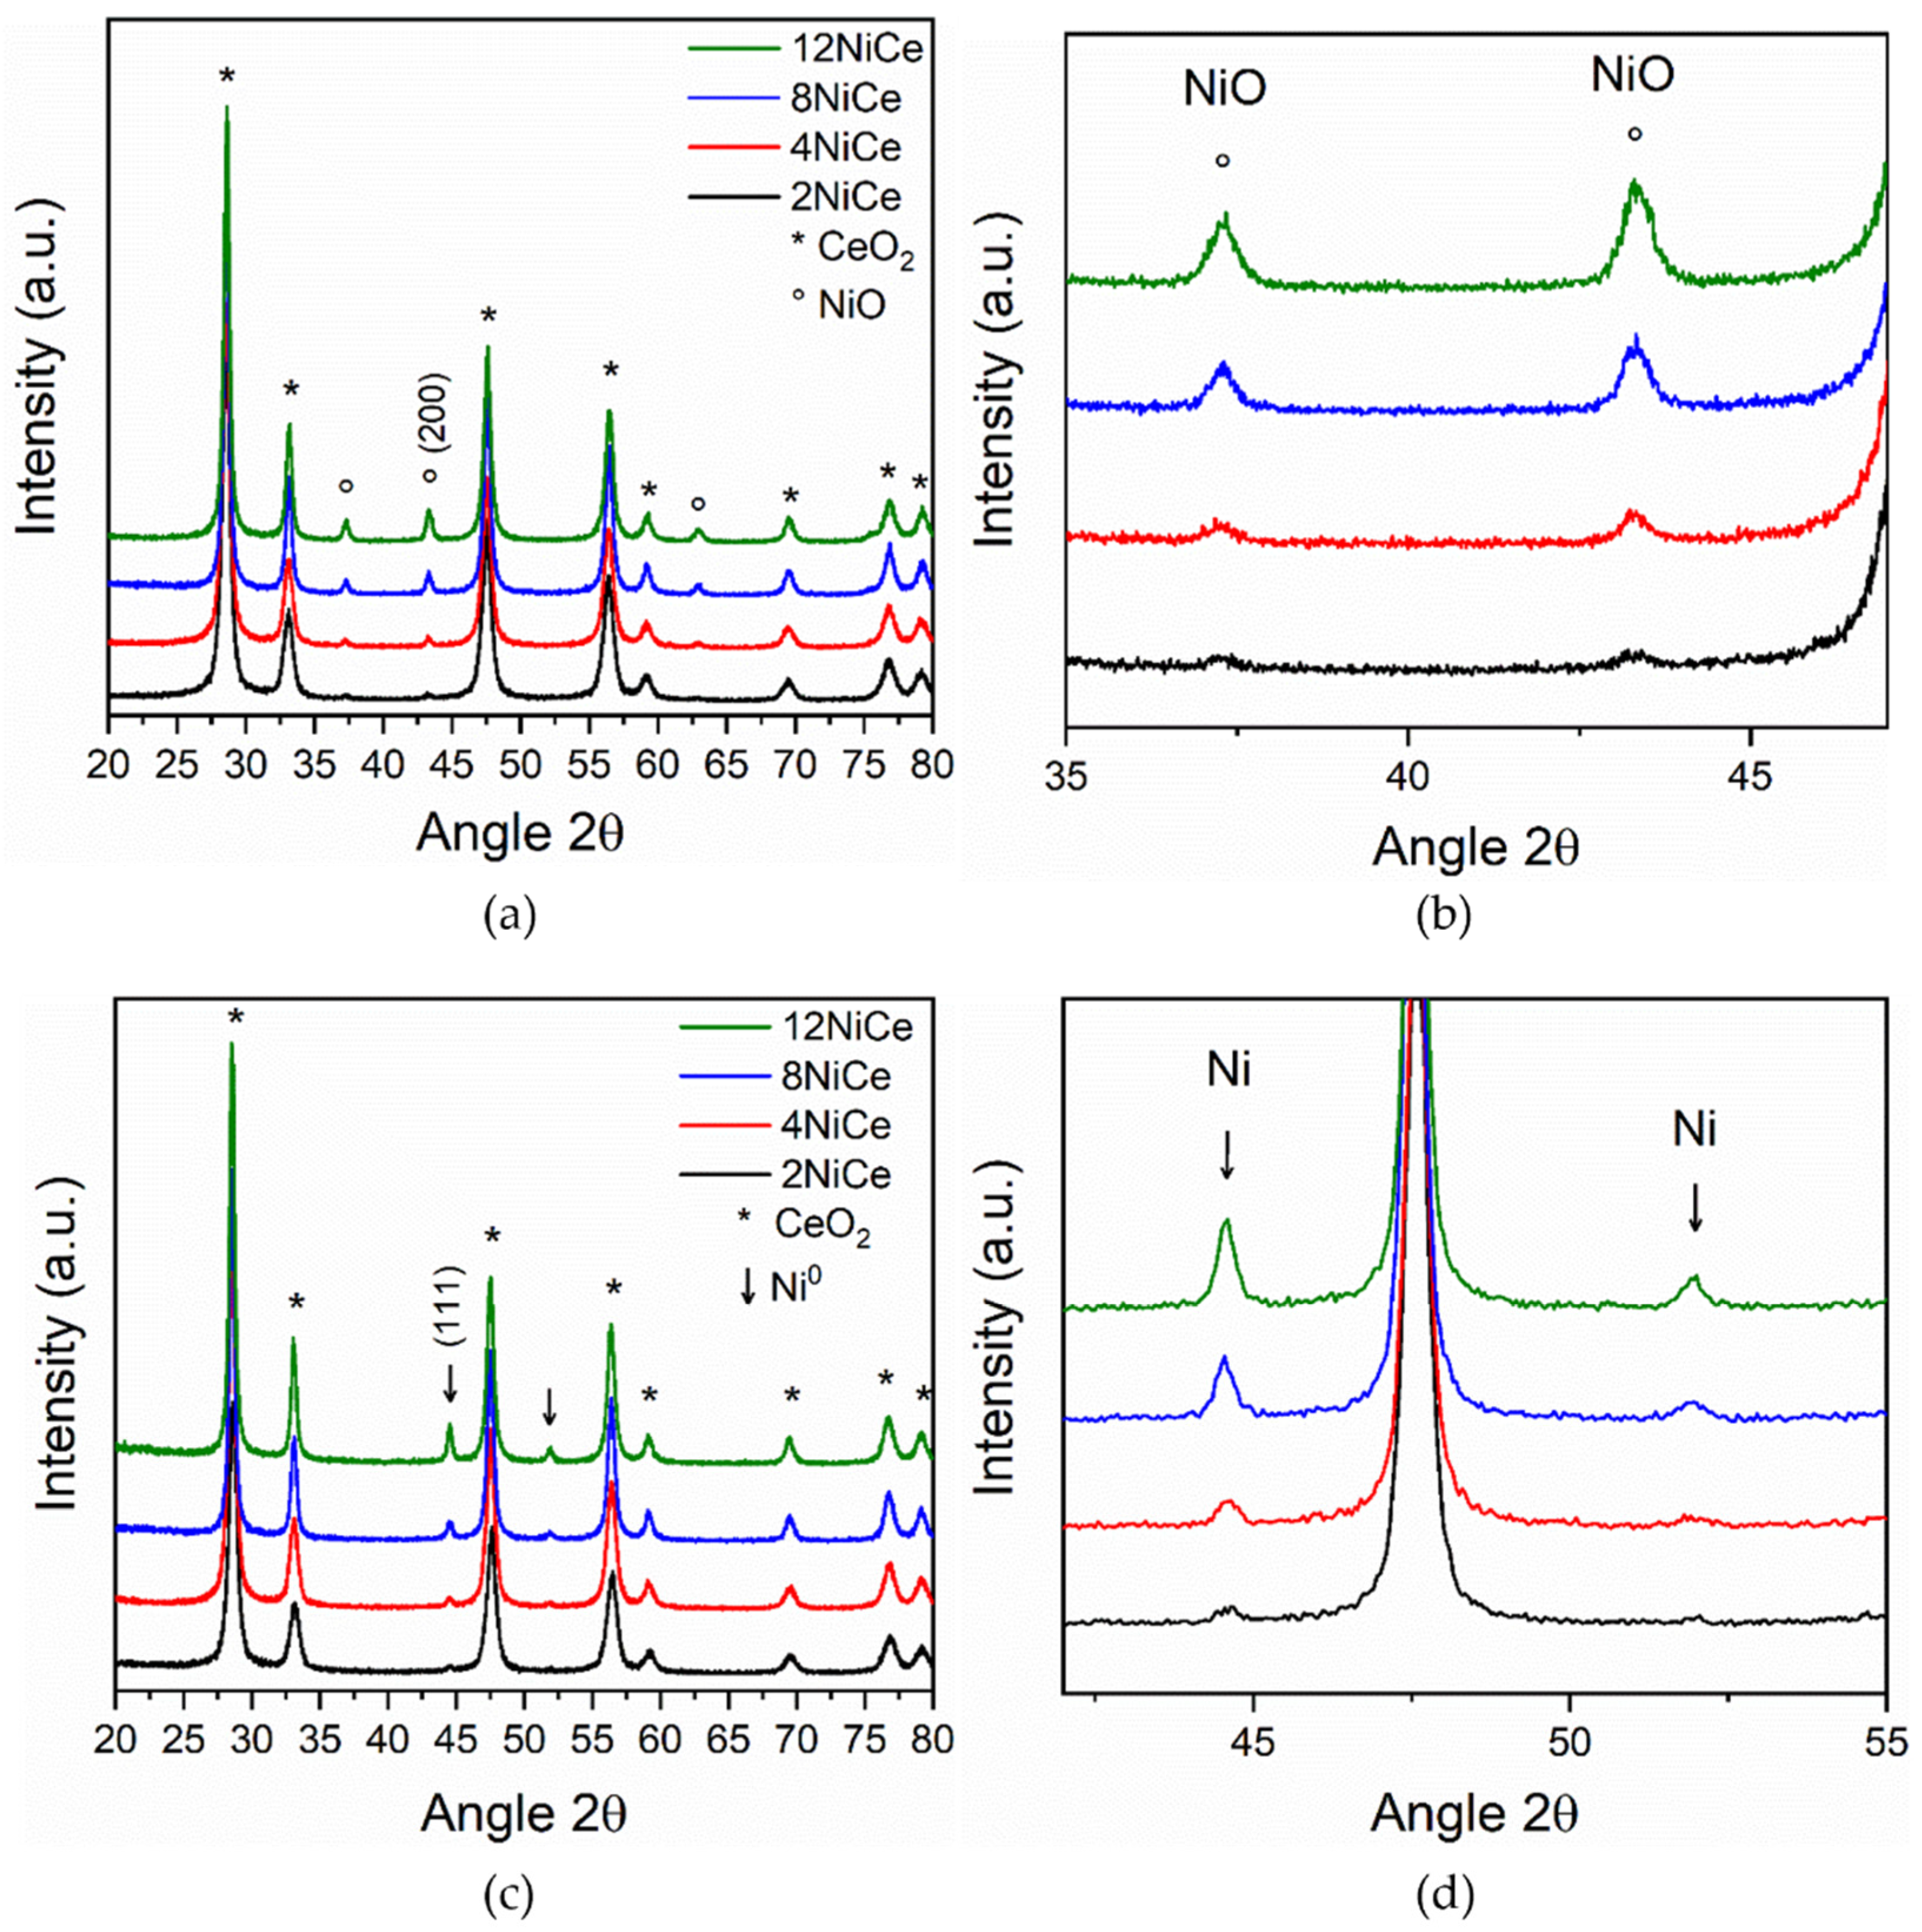
3.4. Structure and Morphology of Samples

All calcined catalysts show XRD diffraction peaks at 2θ = 28.6° (111), 33.1° (200), 47.6° (220), 56.4° (311), 59.2° (222), 69.6° (400), 76.7° (331), and 79.3 (420), typical of the cubic face-centered phase of the fluorite CeO2 structure (JCPDS 81-0792 sheet), and weak diffractions at 2θ = 37.3° (111), 43.5° (200), and 62.0° (220), characteristic of the NiO cubic phase (JCPDS 78 sheet -0643) (Figure 4a,b).
The diffractograms of Ni/r-CeO2 samples reduced at 800 °C (Figure 4c,d) show: (i) peaks of the cubic fluorite structure of CeO2 at nearly the same position but with a lower full-width half-maximum (FWHM) than on the calcined samples, indicating the sintering of the ceria; (ii) two weak diffraction peaks at 2θ = 44.5° (111) and 51.8° (200) assigned to the face-centered cubic phase of Ni0 (JCPDS 04-850), whose intensity increases with the Ni content; and (iii) the absence of the NiO phase. These results agree with the H2-TPR analysis, suggesting that NiO is completely reduced to metallic Ni0 during the reduction at 800 °C for 1 h.
No shifts greater than Δ(2θ) = 2 are observed in CeO2 reflections, and the “a” parameter is 5.40–5.41 for all samples (Table 4), therefore excluding the incorporation of Ni(II) ions in the CeO2 lattice with the formation of solid solution.
The average NiO crystallite size, dNiOXRD, in calcined samples, calculated by the Scherrer equation from the most intense diffraction peak (200), increases from 13 nm up to 20 nm with the nickel content (Table 4). The average Ni crystallite size, dNiXRD, in reduced samples, calculated from the peak (111), increases with the nickel content from 21 nm of the 2NiCe sample up to 30–34 nm of samples with Ni 4–12 wt.%, showing sintering after the reduction treatment at 800 °C.
The average crystallite size of CeO2, dCeO2, and the lattice strain, ε, were calculated from the linear fitting of both the Size–Strain plot (SS plot) (Supplementary Materials: Figure S3) and the Williamson–Hall plot (W-H plot) (Supplementary Materials: Figure S4) and are reported in Table 4, with the R2 of the straight line used as an evaluation of the quality of the spectrum analysis. The average size calculated from the SSP plot is considered closer to the true value, as it gives more importance to low-angle reflections, where measures of position and broadening are more accurate and precise than those at high diffraction angles. On the contrary, the strain calculated from the W-H plot is considered more accurate than that calculated from the SSP plot, which appears to be more intense [24]. The average crystallite size of CeO2 on calcined NiO/CeO2 samples obtained from both methods shows the same trend with the nickel content: dCeO2 increases with the Ni content from 14 nm up to about 25–23 nm (SS plot) and from 16 nm up to 32–40 nm (W-H plot). The lattice strain gives information on the level of stress of materials. The results from the SS and W-H plots agree, both showing that the lattice strain ε increases with the nickel content. In agreement, the lattice parameter slightly decreases from 5.41 to 5.40 with the nickel content. All of the results suggest an intimate connection and a strong interaction between nickel oxide and cerium oxide in calcined samples.
The CeO2 crystallites of reduced Ni/CeO2 samples show marked sintering, about doubling their size up to about 28–45 nm (SS plot) or up to 32–87 nm (W-H plot), dependent on the Ni content. The intrinsic lattice strain ε is lower than the corresponding value of the calcined sample, and the lattice parameter “a” of the more concentrated samples (8–12%) returns to a value of 5.41, characteristic of pure ceria, in accordance with the occurrence of the nickel sintering phenomenon, which, by increasing the separation of the NiO and CeO2 phases, decreases the Ni–support interaction.
The reduced samples show N2 adsorption–desorption isotherms classified as type II with a type H1 hysteresis loop, with almost parallel vertical branches, characteristic of uniform agglomerates and narrow distributions of pore sizes, typical of non-porous or macroporous material (Figure 5a). The morphological properties of the reduced samples are shown in Table 5. The specific surface area of nanorod-ceria is 94 m2 g−1. The specific area of xNiCe catalysts decreases considerably as a function of the nickel content, from 73 m2 g−1 of the 2NiCe sample to 28 m2 g−1 of the 12NiCe sample. To explain the trends of surface area, pore volume, and average diameter, it must be taken into account that these experimental values are a result of the combination of changes in cerium oxide morphology and metallic nickel content. As the nickel content increases, the surface area decreases, because the ceria is increasingly covered by nickel, causing a partial pore occlusion. However, the pore volume decreases with a bell-shaped trend as a function of Ni content, with a maximum of 0.68 cm3 g−1 for the 4NiCe sample. We know that the nickel particles grow as the nickel content increases, modifying the morphology of ceria nanorods, which increase in dimensions. Small and well-dispersed Ni particles, modifying the particle network, contribute to increasing the overall pore volume; the increase in pore volume is also evident from the higher pore content in Figure 5b. Above a certain nickel content, the coverage of the surface area by nickel, with the occlusion of pores, prevails. The average pore diameter is given by the combination of pore volume and surface area (pore diameter = 4 pore volume/S.A.); consequently, it shows a similar bell-shaped trend
In agreement, the pore size distributions (PSDs) show a very small fraction of small pores with a diameter of 2–4 nm, assigned to the r-CeO2 structure, and a large fraction of pores in the range 20–90 nm, assigned to the agglomeration of the material (Figure 5b). In agreement with the attribution, the number of small pores is approximately the same in all samples, while the number of pores in the 20–90 nm range varies greatly, depending on the shape of nanorods.

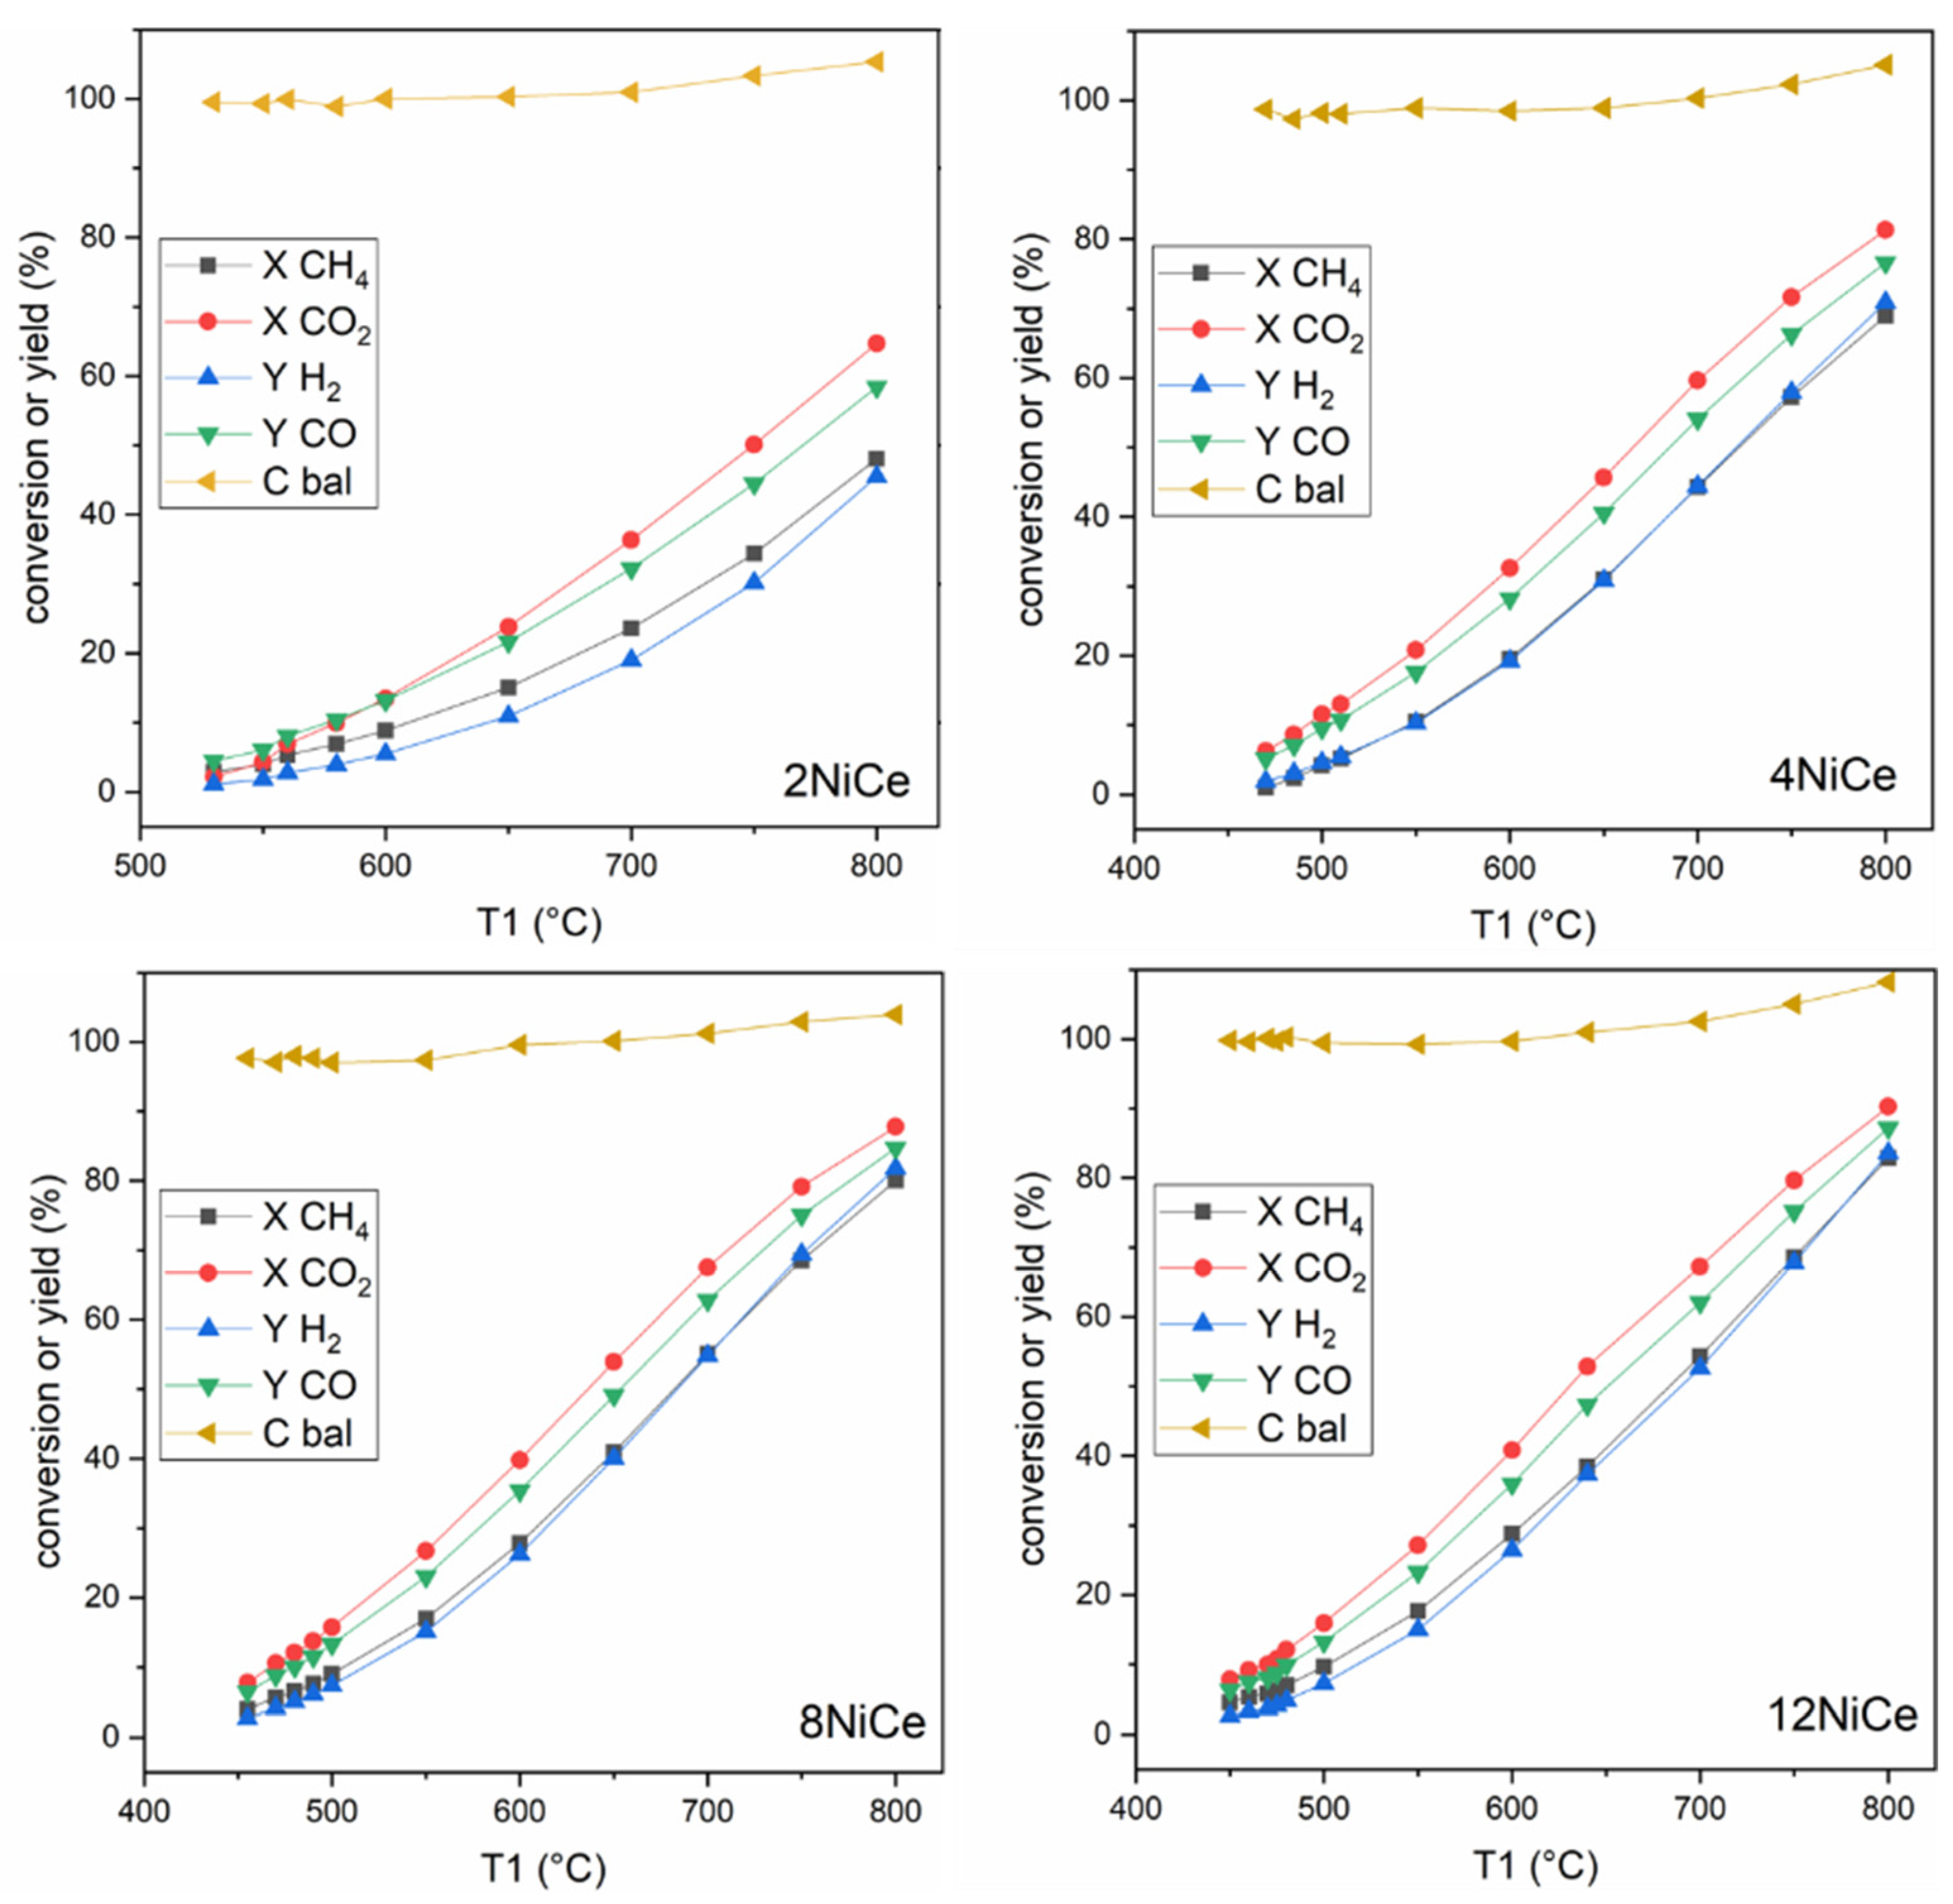
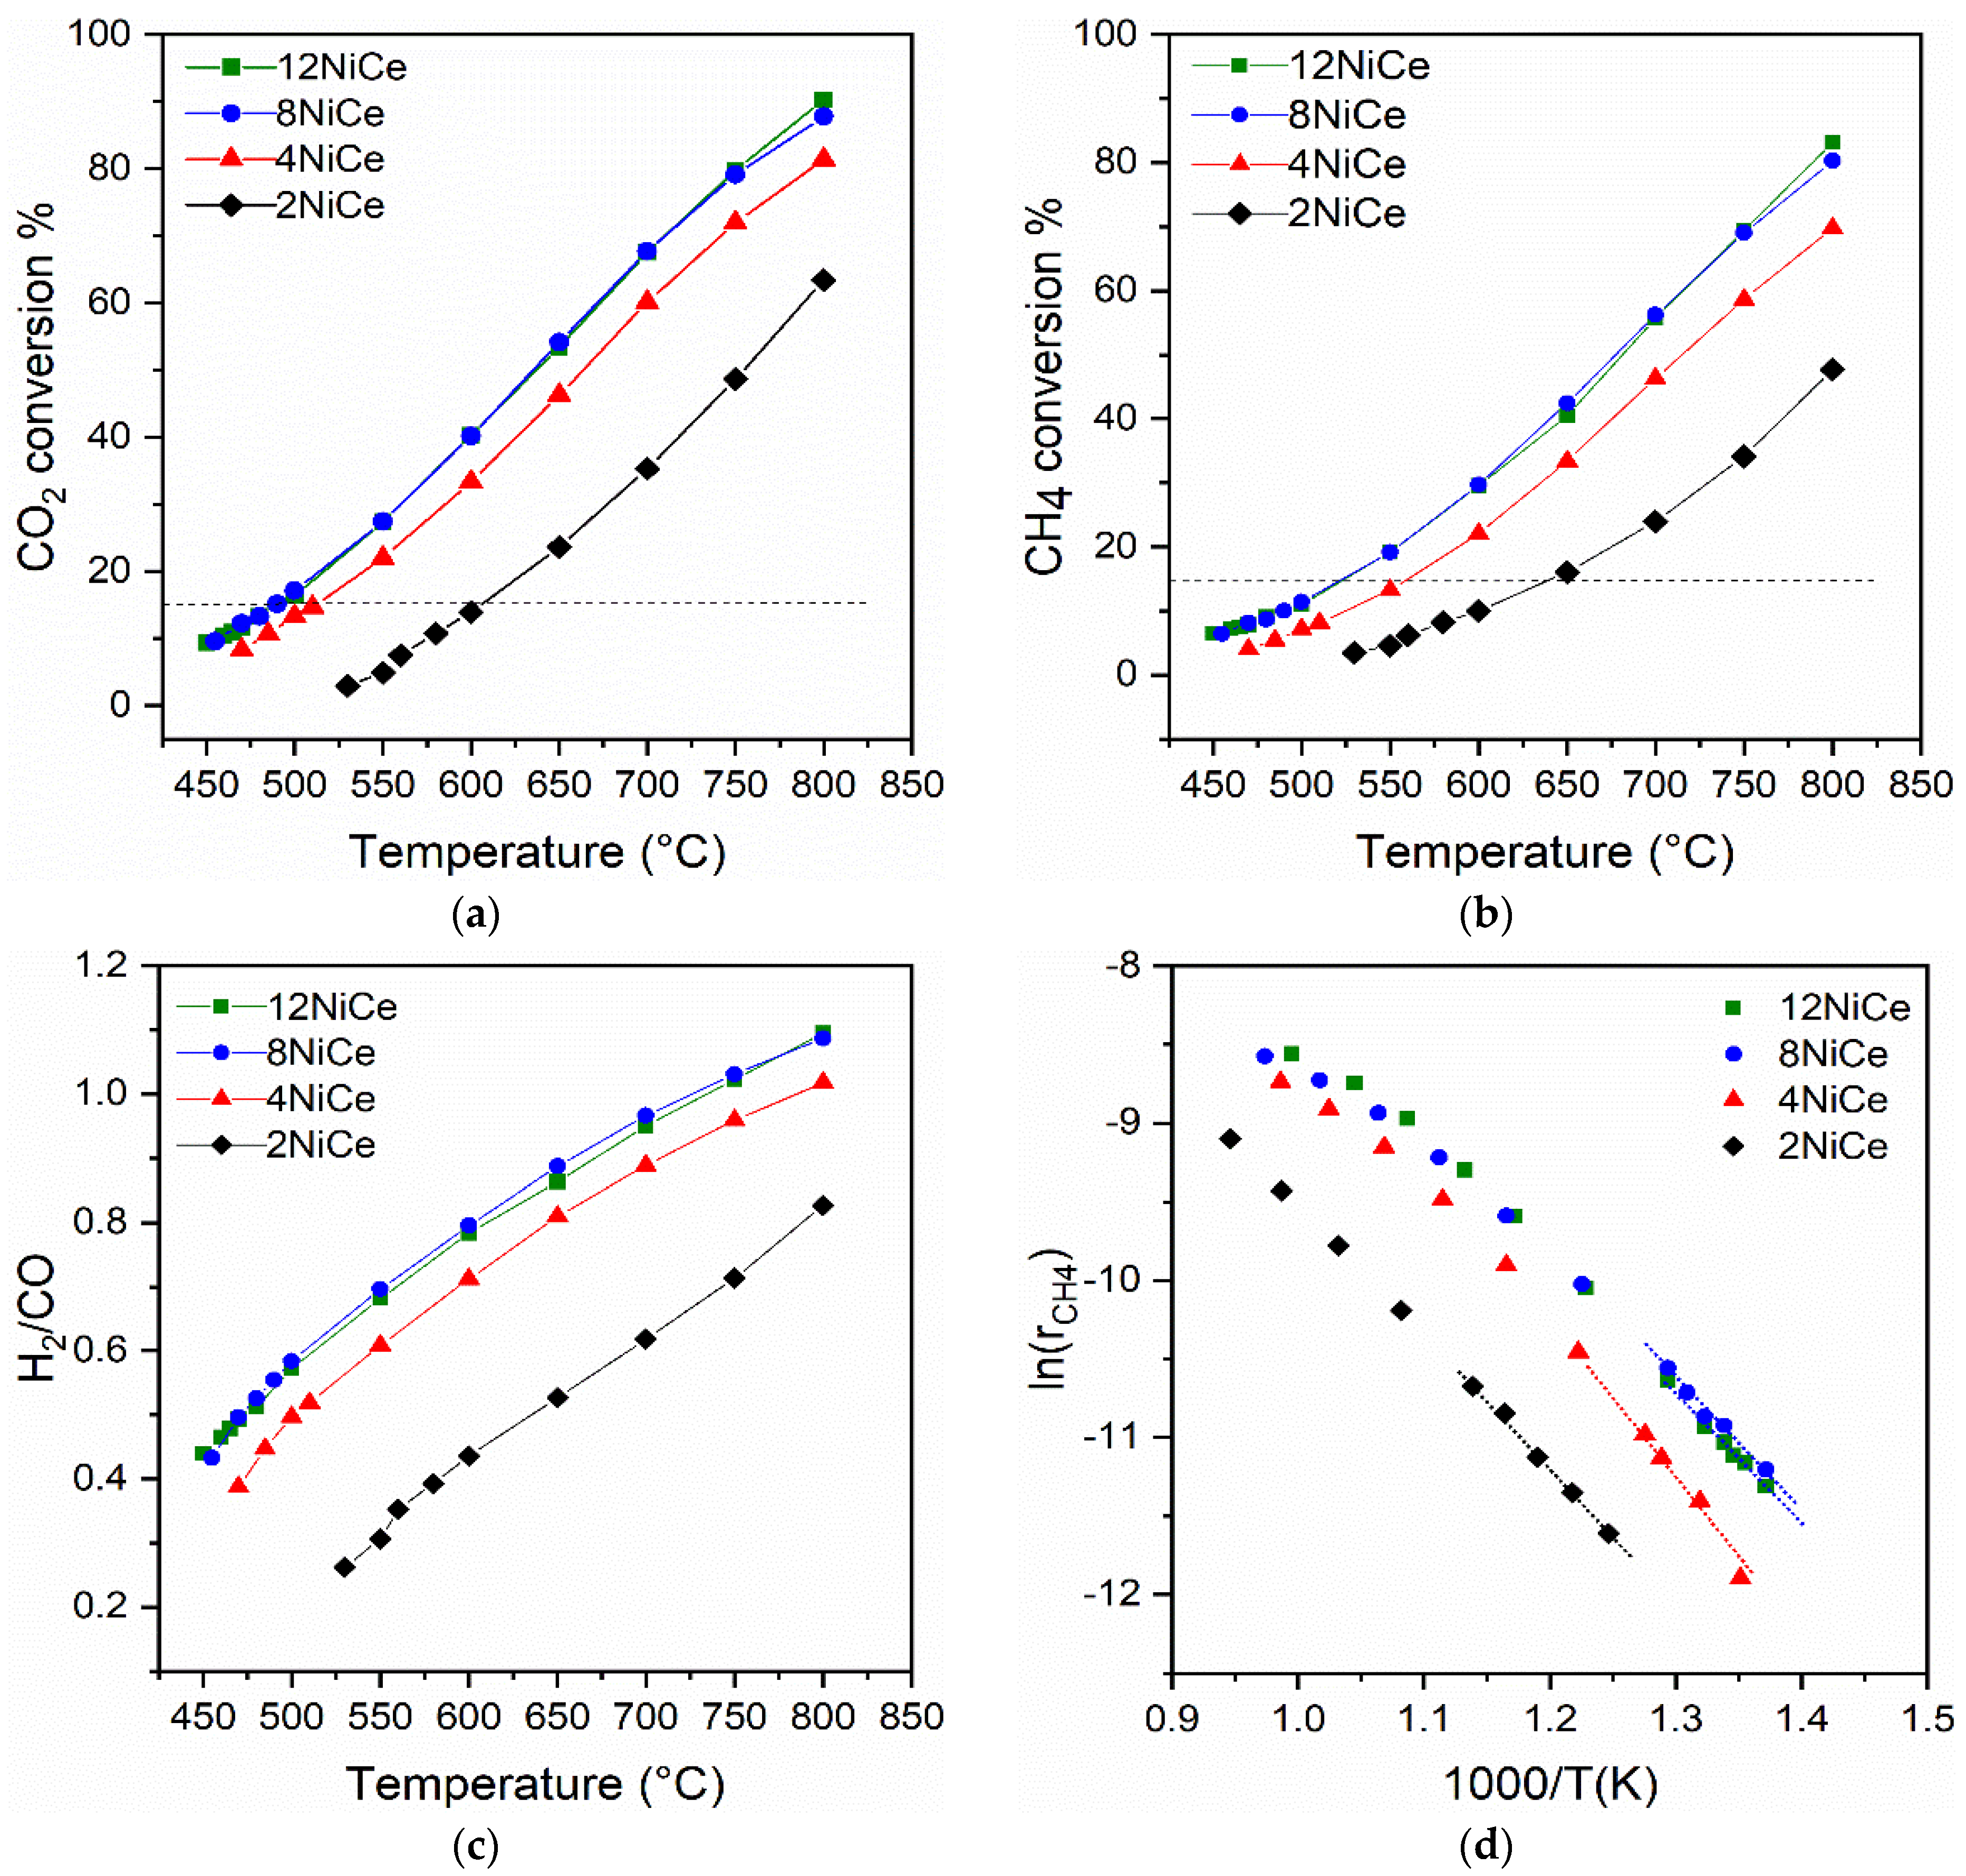
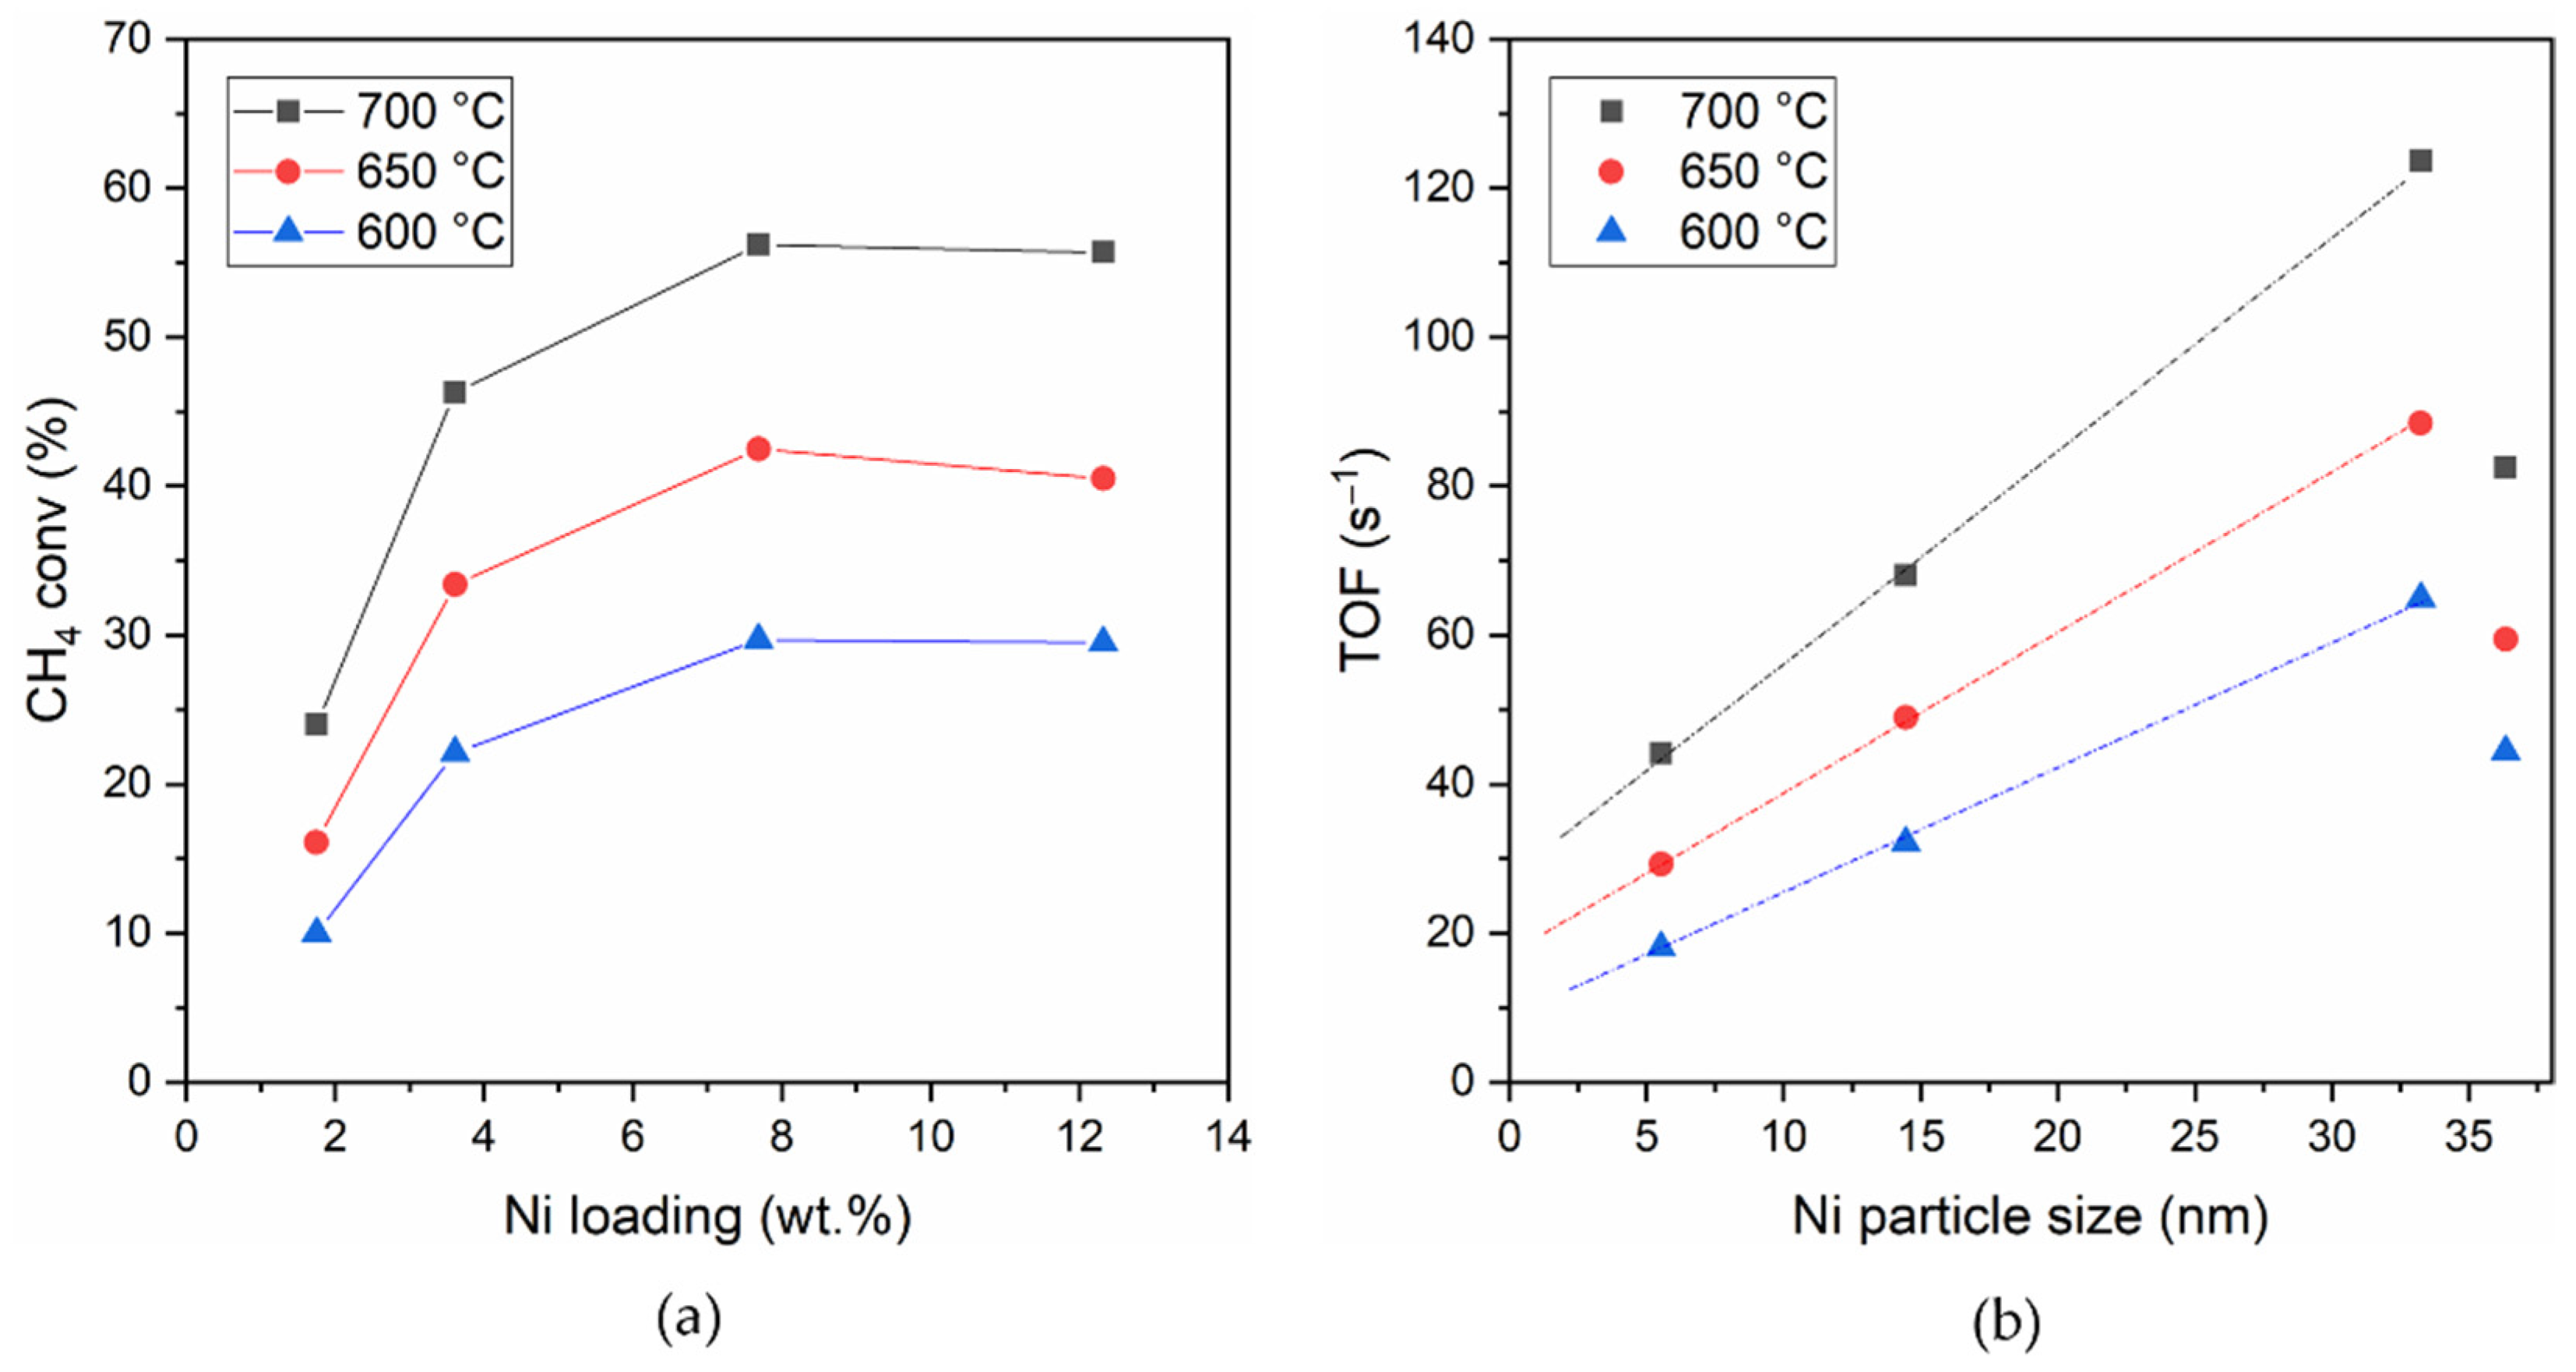
3.5. Catalytic Activity for Dry Reforming of Methane

The conversions of CH4 and CO2 (Xi) and the production of H2 and CO (Yi), together with the carbon balance, as a function of temperature in the range from 450–525 °C to 800 °C, of the four xNiCe catalysts are shown in Figure 6. The DRM reaction (CO2 + CH4 → 2CO + 2H2) is endothermic and therefore favored at high temperatures; consequently, the conversions increase with temperature. The reaction products are only CO and H2. As expected, due to the occurrence of the reverse water gas shift (RWGS) reaction, which produces CO and consumes CO2 and H2, the CO2 conversion is always slightly greater than the CH4 conversion at all temperatures. The carbon balance is 100 ± 4% at all temperatures, suggesting limited carbon deposition on the surface.
In Figure 7, the catalytic properties of samples with different nickel contents are reported for comparison. The CO2 and CH4 conversions increase with nickel content up to Ni 8 wt.%: at 800 °C, XCH4 reaches 60% over the 2NiCe catalyst and 80–82% over the 8NiCe and 12NiCe catalysts (Figure 7a,b).
The simultaneous occurrence of the RWGS reaction results in a selectivity, defined as the H2/CO ratio, less than unity. As expected from the theoretical calculation of the equilibrium conversions of simultaneous DRM and RWGS reactions [1], the selectivity increases with temperature: at 800 °C, over NiCe samples, the selectivity reaches 0.8 and 1.1 as a function of the nickel content. The slight exceeding (10%) of the theoretical value of 1.0 observed at 800 °C over 8NiCe and 12NiCe, where H2/CO is 1.09–1.10, is attributed to some uncertainty in the gas chromatographic analysis. The selectivity is greater but approximately equal in the concentrated samples (Ni 8 and 12 wt.%) containing larger and similar Ni crystallite sizes (Figure 7c).
Figure 7d shows the natural logarithm of the reaction rate of CH4 conversion as a function of 1/T. The apparent activation energy, Ea, is calculated from the slope of the straight lines in conditions far from equilibrium, that is, values lower than 15% of conversion (Table 6). Ea appears to be independent of the metal content and, in turn, of the particle size and in agreement with values reported for Ni supported on ceria or other supports [7,26,27].
The turnover frequency (TOF) values were calculated from the conversion of CH4, since methane is not involved in other side reactions, such as in the case of CO2. TOF, namely, the number of CH4 molecules consumed per second per surface Ni site, was calculated from Equation (14) using the dispersion of nickel on the surface obtained from the H2-TPD experiments, DNi (Table 6).
To evaluate whether the particle size affects the specific activity of the nickel atoms, i.e., whether the reaction is structure sensitive towards particle dimension, the TOF was related to the average particle size of Ni calculated by H2-TPD experiments. In Figure 8a,b, CH4 conversion as a function of nickel content and the corresponding TOF as a function of Ni particle size at 600, 650, and 700 °C are compared. The TOF value increases linearly with the average Ni particle size in the range of 5.5–33 nm, namely, up to nickel content of 8 wt.%, appearing dependent on the nickel particle size (Figure 8b). Over the 12NiCe catalyst, with an average particle size of 36 nm, the TOF values appear to be lower, suggesting that a larger amount of nickel does not increase the number of active sites exposed on the surface.

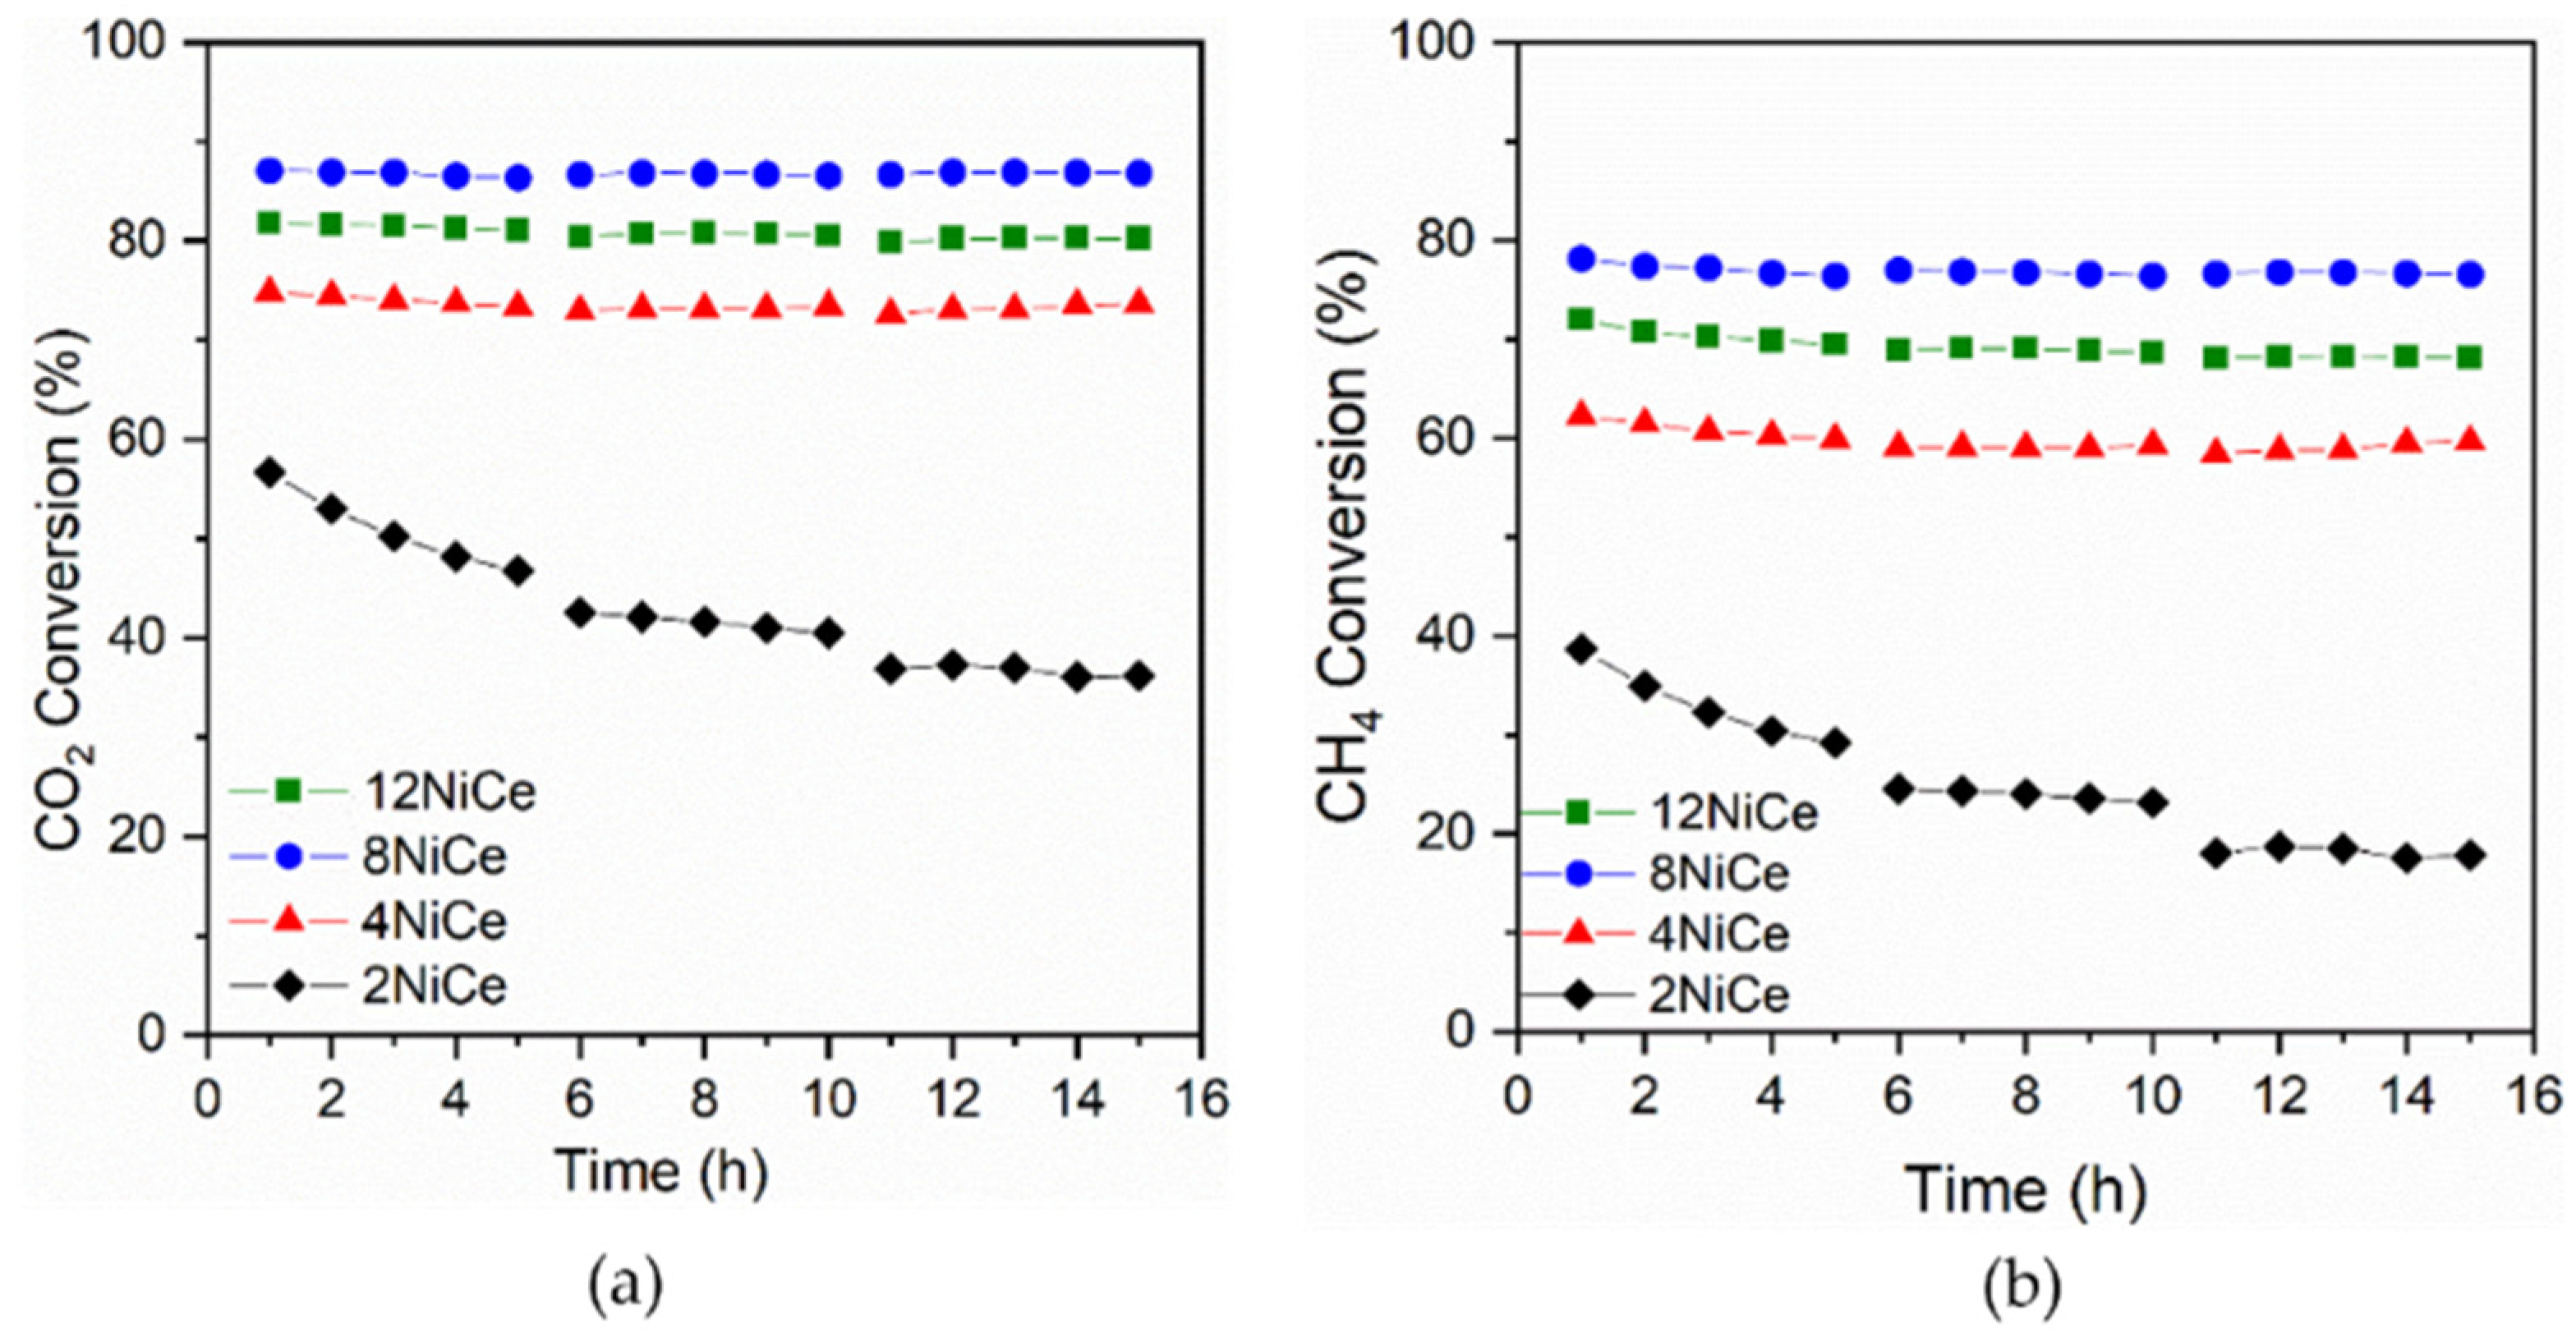
3.6. Catalyst Stability

The catalytic stability of all samples was tested at 800 °C by time on stream (TOS) experiments conducted for 15 h. The CH4 and CO2 conversions as a function of time on stream are reported in Figure 9a,b, respectively. Over samples with nickel content greater than or equal to 4 wt.%, the activity remains constant for 15 h, while over the catalyst with a Ni content of 2 wt.%, the activity gradually decays over time.
The mechanism of the DRM over Ni involves the dehydrogenation of CH4 on Ni0 sites to generate CHx* and C* reactive carbon species on the surface. Coke can be formed by converting C* atoms into less reactive carbon species, which can encapsulate Ni0 or form carbon filaments growing underneath the Ni0 particle and causing the nickel to detach from the support. To check for any carbon formation on the surface, the samples tested in the TOS experiment were analyzed by FE-SEM.

3.7. FE-SEM Characterization after TOS Experiment

Samples used in the TOS experiments were analyzed by FE-SEM microscopy to check the effect of the operating time (15 h) at an operating temperature of 800 °C on the catalyst morphology and on the formation of carbon residues (Figure 10).
All samples underwent significant sintering with the destruction of the nanorod morphology and the formation of cuboidal fragments, even with flat surfaces. Only the sample with the highest nickel content (12 wt.%) seems to have partly preserved the nanorod structure of ceria. A limited amount of carbon with a nanotubular structure is present on 2NiCe, 4NiCe, and 8NiCe samples. The 12NiCe sample appears to have a greater amount of carbon nanotubes, in agreement with the higher content of nickel, which has a high affinity for coke formation and contains larger nickel nanoparticles.

4. Discussion

All NiO/CeO2 catalysts prepared by one-pot hydrothermal synthesis at 110 °C followed by calcination at 500 °C present a nanorod morphology of CeO2. In calcined samples, the NiO particle size increases with the nickel content. The presence of NiO causes slight stress in the ceria structure, which increases with nickel content and suggests an intimate junction between nickel oxide and cerium oxide, excluding, however, the formation of a solid solution by the value of the lattice parameter. The FE-SEM, EDS, H2-TPR, and XRD characterizations of calcined samples agree in confirming a strong nickel oxide–cerium oxide interaction and a homogeneous nickel dispersion.
The reduction treatment at 800 °C causes the sintering of ceria crystallites, which increase by doubling their sizes, with a decrease in lattice stress. This finding is also explained by the occurrence of nickel sintering, which decreases the nickel–support interaction, separating the nickel phase from ceria. The average Ni0 particle dimension was estimated by XRD analysis and H2-TPD experiments. The particle sizes calculated by the two techniques completely agree for the high-Ni-content samples, giving values of 30–33 nm for 8NiCe and 34–36 nm for the 12NiCe sample, whereas they disagree for the low-content samples: 5.5 or 21 nm for Ni 2% and 14 or 30 nm for Ni 4%. Taking into account that the XRD peak of Ni in the most diluted sample is very weak and difficult to analyze, that the quantity of a gas selectively adsorbed on the metal indicates the exposed metal surface area, and that the resulting average dimension of particles is a theoretical calculation based on the assumption that metal particles are spherical with a very narrow size distribution, the differences in the average particle dimension calculated by XRD and TPD could be explained by a larger size distribution, with a fraction of bigger crystallites revealed by XRD; on the contrary, an excellent agreement between the results from the two techniques indicate that the metal particles are less polycrystalline. The average Ni size and the Ni dispersion calculated from the H2-TPD experiment appear to be dependent on the nickel content and are strictly proportional to the moles of CH4 reacted by time and per Ni site (TOF).
The nickel loading causes a decrease in catalyst surface area, affecting the pore volume and diameter and partially occluding pores in the most concentrated samples.
The dry reforming of methane with CO2 over Ni/r-CeO2 showed the following relevant catalytic behaviors depending on the nickel content:
(1)
The activity increases with Ni content up to about Ni 8 wt.%;
(2)
The turnover frequency (TOF) for CH4 conversion increases linearly with the average Ni particle size in the range of 5.5–33 nm;
(3)
The H2/CO selectivity increases with nickel content due to the lower amount of produced CO;
(4)
Only the low-Ni-content sample (Ni 2 wt.%) is deactivated over time on stream.
The commonly accepted mechanism of the DRM reaction over Ni-based catalysts involves the following steps: (i) the dehydrogenation of CH4 on Ni0 sites generates hydrogen and CHx* and C* reactive carbon species on the surface; (ii) the adsorbed H species are then recombined in H2 molecules that desorb; (ii) the activation of CO2 on Ni0 or on CeO2 support, or on interfacial perimeters, produces surface reactive oxygen; and (iii) the reaction of carbon C* with oxygen produces CO.
The linear increase in the TOF value with the average nickel particle size in the range of 5.5–33 nm suggests that the DRM reaction on Ni/r-CeO2 is structure sensitive to the Ni particle dimension. The best specific activity for the surface is shown by the sample with 8 wt.% of Ni loading with an average particle dimension of 33 nm. The volcano-type behavior of the specific activity regarding Ni particle size has been reported for the CO2 methanation reaction over Ni/nanorod-CeO2 [12,28] and for the DRM reaction on Ni/CeO2 [29] and is attributed to competitive structural features and, in particular, to the different distributions of more active under-coordinated Ni sites on the surface [28,29]. The lower specific activity of the most concentrated sample, 12NiCe, with an average particle size of about 36 nm, may depend on several structural aspects: (i) the formation of larger Ni particles may not correspond to a longer Ni-CeO2 perimeter and thus may not correspond to a greater interfacial area; (ii) the increase in particle dimension may correspond to a decrease in the more active sites as step-edge and corner sites, with an increase in the less active terrace sites [29]; and (iii) the high nickel loading causes a sharp decrease in 12NiCe surface area, which may hinder the CO2 activation occurring on the ceria support.
The lower H2/CO selectivity of the samples with low Ni content is explained by the high activity of smaller Ni particles for the RWGS reaction [30], CO2 + H2 → CO + H2O, producing CO, consuming H2, and consequently, lowering H2/CO selectivity.
After 15 h of the TOS experiment, only a limited amount of carbon with a nanotubular structure is present on all samples, in agreement with the carbon balance between reagents and products being very close to 100%. The most concentrated sample (Ni 12 wt.%) appears to have a greater amount of carbon nanotubes, in agreement with the high affinity of Ni for coke formation. The reduction treatment and 15 h of the TOS test cause the partial destruction of the nanorod morphology with the formation of cuboidal fragments, even with flat surfaces. Due to the absence of large amounts of carbon nanotubes or other carbon deposits, the deactivation of the 2NiCe sample can be explained by the progressive oxidation of small Ni0 particles that strongly interact with the support.

5. Conclusions

One-pot hydrothermal synthesis allows the preparation of Ni/CeO2 catalysts with nanorod morphology, strong nickel–support interaction, and homogeneous nickel dispersion.
The catalytic activity for the dry reforming of methane increases with the nickel content up to Ni 8 wt%. The TOF increases linearly with the average nickel particle size in the range of 5.5–33 nm, suggesting that the DRM reaction is structure sensitive over Ni/rCeO2 catalysts. The sample with Ni loading of 8 wt.% and an average Ni particle size of 33 nm shows the best specific activity for the surface Ni site.
Samples with Ni content of 4–12 wt.% show high H2/CO selectivity and high stability over time on stream at 800 °C due to poor carbon deposition.

Supplementary Materials

The following supporting information can be downloaded at: https://www.mdpi.com/article/10.3390/reactions3030025/s1. Figure S1: EDS spectra of samples; Figure S2: EDS elementary mapping of cerium and nickel of xNiCe samples; Figure S3: Size–Stain plot of calcined and reduced xNiCe samples; Figure S4: H-W plot of calcined and reduced xNiCe samples.

Author Contributions

Conceptualization, S.T. and I.L.; formal analysis, S.T. and U.P.L.; investigation, S.T., U.P.L., and E.M.; methodology, S.T. and I.L.; resources, S.T.; writing—original draft, S.T.; writing—review and editing, S.T., I.L., and U.P.L. All authors have read and agreed to the published version of the manuscript.

Funding

This research was funded by: Italian Ministry of Education, University and Research (MIUR)—Departments of Excellence, 2017—legge 232/2016—art.1, commi 314–337 awarded to Dept. of Science, University Roma Tre, Rome, Italy, for 2018–2022; and by Italian Ministry of the Economic Sustainable Development Project within the research area: linea 1.6 “Efficienza energetica dei prodotti e dei processi industriali” of the research program “Piano Triennale di Realizzazione 2019–2021 della Ricerca di Sistema Elettrico Nazionale”: funding number CUP I34I19005780001.

Conflicts of Interest

The authors declare no conflict of interest.

References

  1. Bradford, M.C.J.; Vannice, M.A. CO2 Reforming of CH4. Catal. Rev. 1999, 41, 1–42. [Google Scholar] [CrossRef]
  2. Gao, Y.; Jiang, J.; Meng, Y.; Yan, F.; Aihemaiti, A. A Review of Recent Developments in Hydrogen Production via Biogas Dry Reforming. Energy Convers. Manag. 2018, 171, 133–155. [Google Scholar] [CrossRef]
  3. Yentekakis, I.V.; Panagiotopoulou, P.; Artemakis, G. A Review of Recent Efforts to Promote Dry Reforming of Methane (DRM) to Syngas Production via Bimetallic Catalyst Formulations. Appl. Catal. B: Environ. 2021, 296, 120210. [Google Scholar] [CrossRef]
  4. Aramouni, N.A.K.; Touma, J.G.; Tarboush, B.A.; Zeaiter, J.; Ahmad, M.N. Catalyst Design for Dry Reforming of Methane: Analysis Review. Renew. Sustain. Energy Rev. 2018, 82, 2570–2585. [Google Scholar] [CrossRef]
  5. Ranjekar, A.M.; Yadav, G.D. Dry Reforming of Methane for Syngas Production: A Review and Assessment of Catalyst Development and Efficacy. J. Indian Chem. Soc. 2021, 98, 100002. [Google Scholar] [CrossRef]
  6. Wang, Y.; Yao, L.; Wang, S.; Mao, D.; Hu, C. Low-Temperature Catalytic CO2 Dry Reforming of Methane on Ni-Based Catalysts: A Review. Fuel Processing Technol. 2018, 169, 199–206. [Google Scholar] [CrossRef]
  7. Yusuf, M.; Farooqi, A.S.; Keong, L.K.; Hellgardt, K.; Abdullah, B. Contemporary Trends in Composite Ni-Based Catalysts for CO2 Reforming of Methane. Chem. Eng. Sci. 2021, 229, 116072. [Google Scholar] [CrossRef]
  8. Seo, H. Recent Scientific Progress on Developing Supported Ni Catalysts for Dry (CO2) Reforming of Methane. Catalysts 2018, 8, 110. [Google Scholar] [CrossRef] [Green Version]
  9. Kesavan, J.K.; Luisetto, I.; Tuti, S.; Meneghini, C.; Iucci, G.; Battocchio, C.; Mobilio, S.; Casciardi, S.; Sisto, R. Nickel Supported on YSZ: The Effect of Ni Particle Size on the Catalytic Activity for CO2 Methanation. J. CO2 Util. 2018, 23, 200–211. [Google Scholar] [CrossRef]
  10. Teh, L.P.; Setiabudi, H.D.; Timmiati, S.N.; Aziz, M.A.A.; Annuar, N.H.R.; Ruslan, N.N. Recent Progress in Ceria-Based Catalysts for the Dry Reforming of Methane: A Review. Chem. Eng. Sci. 2021, 242, 116606. [Google Scholar] [CrossRef]
  11. Moeini, S.; Battocchio, C.; Casciardi, S.; Luisetto, I.; Lupattelli, P.; Tofani, D.; Tuti, S. Oxidized Palladium Supported on Ceria Nanorods for Catalytic Aerobic Oxidation of Benzyl Alcohol to Benzaldehyde in Protic Solvents. Catalysts 2019, 9, 847. [Google Scholar] [CrossRef] [Green Version]
  12. Marconi, E.; Tuti, S.; Luisetto, I. Structure-Sensitivity of CO2 Methanation over Nanostructured Ni Supported on CeO2 Nanorods. Catalysts 2019, 9, 375. [Google Scholar] [CrossRef] [Green Version]
  13. Luisetto, I.; Tuti, S.; Di Bartolomeo, E. Co and Ni Supported on CeO2 as Selective Bimetallic Catalyst for Dry Reforming of Methane. Int. J. Hydrogen Energy 2012, 37, 15992–15999. [Google Scholar] [CrossRef]
  14. Luisetto, I.; Tuti, S.; Romano, C.; Boaro, M.; Di Bartolomeo, E.; Kesavan, J.K.; Kumar, S.S.; Selvakumar, K. Dry Reforming of Methane over Ni Supported on Doped CeO2: New Insight on the Role of Dopants for CO2 Activation. J. CO2 Util. 2019, 30, 63–78. [Google Scholar] [CrossRef]
  15. Trovarelli, A.; Llorca, J. Ceria Catalysts at Nanoscale: How Do Crystal Shapes Shape Catalysis? ACS Catal. 2017, 7, 4716–4735. [Google Scholar] [CrossRef]
  16. Wang, S.; Zhao, L.; Wang, W.; Zhao, Y.; Zhang, G.; Ma, X.; Gong, J. Morphology Control of Ceria Nanocrystals for Catalytic Conversion of CO2 with Methanol. Nanoscale 2013, 5, 5582. [Google Scholar] [CrossRef]
  17. Luisetto, I.; Stendardo, S.; Senthil Kumar, S.M.; Selvakumar, K.; Kesavan, J.K.; Iucci, G.; Pasqual Laverdura, U.; Tuti, S. One-Pot Synthesis of Ni0.05Ce0.95O2−δ Catalysts with Nanocubes and Nanorods Morphology for CO2 Methanation Reaction and in Operando DRIFT Analysis of Intermediate Species. Processes 2021, 9, 1899. [Google Scholar] [CrossRef]
  18. Du, X.; Zhang, D.; Shi, L.; Gao, R.; Zhang, J. Morphology Dependence of Catalytic Properties of Ni/CeO2 Nanostructures for Carbon Dioxide Reforming of Methane. J. Phys. Chem. C 2012, 116, 10009–10016. [Google Scholar] [CrossRef]
  19. Jomjaree, T.; Sintuya, P.; Srifa, A.; Koo-amornpattana, W.; Kiatphuengporn, S.; Assabumrungrat, S.; Sudoh, M.; Watanabe, R.; Fukuhara, C.; Ratchahat, S. Catalytic Performance of Ni Catalysts Supported on CeO2 with Different Morphologies for Low-Temperature CO2 Methanation. Catal. Today 2021, 375, 234–244. [Google Scholar] [CrossRef]
  20. Sakpal, T.; Lefferts, L. Structure-Dependent Activity of CeO2 Supported Ru Catalysts for CO2 Methanation. J. Catal. 2018, 367, 171–180. [Google Scholar] [CrossRef]
  21. Lei, Y.; Li, W.; Liu, Q.; Lin, Q.; Zheng, X.; Huang, Q.; Guan, S.; Wang, X.; Wang, C.; Li, F. Typical Crystal Face Effects of Different Morphology Ceria on the Activity of Pd/CeO2 Catalysts for Lean Methane Combustion. Fuel 2018, 233, 10–20. [Google Scholar] [CrossRef]
  22. Ren, Z.; Peng, F.; Li, J.; Liang, X.; Chen, B. Morphology-Dependent Properties of Cu/CeO2 Catalysts for the Water-Gas Shift Reaction. Catalysts 2017, 7, 48. [Google Scholar] [CrossRef] [Green Version]
  23. Gao, X.; Zhu, S.; Dong, M.; Wang, J.; Fan, W. Ru/CeO2 Catalyst with Optimized CeO2 Morphology and Surface Facet for Efficient Hydrogenation of Ethyl Levulinate to γ-Valerolactone. J. Catal. 2020, 389, 60–70. [Google Scholar] [CrossRef]
  24. Nath, D.; Singh, F.; Das, R. X-Ray Diffraction Analysis by Williamson-Hall, Halder-Wagner and Size-Strain Plot Methods of CdSe Nanoparticles- a Comparative Study. Mater. Chem. Phys. 2020, 239, 122021. [Google Scholar] [CrossRef]
  25. Atzori, L.; Cutrufello, M.G.; Meloni, D.; Cannas, C.; Gazzoli, D.; Monaci, R.; Sini, M.F.; Rombi, E. Highly Active NiO-CeO2 Catalysts for Synthetic Natural Gas Production by CO2 Methanation. Catal. Today 2018, 299, 183–192. [Google Scholar] [CrossRef]
  26. Fedorova, V.; Simonov, M.; Valeev, K.; Bespalko, Y.; Smal, E.; Eremeev, N.; Sadovskaya, E.; Krieger, T.; Ishchenko, A.; Sadykov, V. Kinetic Regularities of Methane Dry Reforming Reaction on Nickel-Containing Modified Ceria–Zirconia. Energies 2021, 14, 2973. [Google Scholar] [CrossRef]
  27. Santoro, M.; Luisetto, I.; Tuti, S.; Licoccia, S.; Romano, C.; Notargiacomo, A.; Di Bartolomeo, E. Nickel-Based Structured Catalysts for Indirect Internal Reforming of Methane. Appl. Sci. 2020, 10, 3083. [Google Scholar] [CrossRef]
  28. Varvoutis, G.; Lykaki, M.; Stefa, S.; Binas, V.; Marnellos, G.E.; Konsolakis, M. Deciphering the Role of Ni Particle Size and Nickel-Ceria Interfacial Perimeter in the Low-Temperature CO2 Methanation Reaction over Remarkably Active Ni/CeO2 Nanorods. Appl. Catal. B: Environ. 2021, 297, 120401. [Google Scholar] [CrossRef]
  29. Lustemberg, P.G.; Mao, Z.; Salcedo, A.; Irigoyen, B.; Ganduglia-Pirovano, M.V.; Campbell, C.T. Nature of the Active Sites on Ni/CeO2 Catalysts for Methane Conversions. ACS Catal. 2021, 10, 10604–10613. [Google Scholar] [CrossRef]
  30. Wu, H.C.; Chang, Y.C.; Wu, J.H.; Lin, J.H.; Lin, I.K.; Chen, C.S. Methanation of CO2 and Reverse Water Gas Shift Reactions on Ni/SiO2 Catalysts: The Influence of Particle Size on Selectivity and Reaction Pathway. Catal. Sci. Technol. 2015, 5, 4154–4163. [Google Scholar] [CrossRef]
Figure 1. Field emission scanning electron microscopy (FE-SEM) images of the calcined NiCe samples.
Reactions 03 00025 g001
Figure 2. H2-temperature programmed reduction (H2-TPR) profiles of samples: (1) r-CeO2; (2) 2NiCe; (3) 4NiCe; (4) 8NiCe; (5) 12NiCe.
Reactions 03 00025 g002
Figure 3. (a) H2-temperature programmed desorption (H2-TPD) profiles of samples reduced at 800 °C: (1) r-CeO2; (2) 2NiCe; (3) 4NiCe; (4) 8NiCe; (5) 12NiCe; (6) as reference: 2NiCe reduced at 500 °C; (b) deconvolution of H2-TPD profiles of NiCe samples.
Reactions 03 00025 g003
Figure 4. XRD diffraction peaks of samples: (a,b) calcined and (c,d) reduced: (a,c) full range; (b,d) enlarged.
Reactions 03 00025 g004
Figure 5. (a) N2 adsorption–desorption isotherms and (b) pore size distribution (PSD) of reduced NiCe-R samples.
Reactions 03 00025 g005
Figure 6. CH4 and CO2 conversions (X%), H2 and CO production (Y%), and carbon balance (Cbal%) as a function of temperature over xNiCe samples. The total carbon in the outlet stream exceeds 100% at high temperatures due to a slight increase in the outlet pressure. Experimental conditions: CO2:CH4:N2:He = 20:20:20:140 vol.%; total flow = 200 cm3 min−1; gas hourly space velocity (GHSV) = 300 L g−1 h−1.
Reactions 03 00025 g006
Figure 7. Comparison of the catalytic properties of Ni/CeO2 catalysts with different nickel contents: (a) CO2 conversion, (b) CH4 conversion, and (c) H2/CO ratio: points below the dotted line (<15% conversion) are used to calculate the slope in the Arrhenius plot; (d) Arrhenius plot: ln(rCH4) as a function of the inverse of the absolute temperature.
Reactions 03 00025 g007
Figure 8. (a) CH4 conversion as a function of nickel content; (b) turnover frequency as a function of the average particle size evaluated by H2-TPD of the xNiCe catalysts.
Reactions 03 00025 g008
Figure 9. Time on stream (TOS) experiments: (a) CO2 conversion and (b) CH4 conversion as a function of time on stream. Experimental conditions: CO2:CH4:N2:He = 20:20:20:140 vol.%; flow = 200 cm3 min−1; GHSV = 300 L g−1 h−1; T = 800 °C.
Reactions 03 00025 g009
Figure 10. FE-SEM images of NiCe samples after TOS test for 15 h: enlargement 100 Kx (left) and 500 Kx (right).
Reactions 03 00025 g010
Table 1. Chemical composition and shape of nanorods of samples by field emission scanning electron microscopy/energy dispersive spectroscopy (FE-SEM/EDS) analysis.
SampleNominal Content
(wt.%)
EDS Analysis
(wt.%)
Shape of Nanorods
(nm)
NiCeNiCeLengthWidth
2NiCe1.7579.961.784.375–22520–30
4NiCe3.6177.664.483.175–25020–35
8NiCe7.6973.447.368.1100–25030–40
12NiCe12.3268.6413.473.9150–30030–50
Table 2. NiO and CeO2 reducibility up to 800 °C.
SampleNi
(mmol g−1)
Ce
(mmol g−1)
H2 Consumption
(mmol g−1)
H2/Ni
(mol/mol)
H2 Consumption for Ce Reduction
(mmol g−1)
Ni0
(%)
Ce3+
(%)
r-CeO205.81--0.67-23
2NiCe0.305.710.892.980.5910021
4NiCe0.615.601.151.860.5310019
8NiCe1.315.361.761.340.4510017
12NiCe2.105.092.191.040.091003.4
Table 3. Dispersion and average nickel particle size from the H2-temperature programmed desorption (H2-TPD) experiment after reduction at 800 °C.
SamplePeak Area
(Counts)
Desorbed H2
(µmol g−1)
dNiTPD
(nm)
DNiTPD
(%)
αβTotalTotalNi-H
2NiCe-R5904858210,5817199275.518
4NiCe-R4829602278,53815521147.0
8NiCe-R4278590667,57313220333.0
12NiCe-R5523907567,76613529362.8
Table 4. Geometrical parameters and particle dimensions of CeO2, NiO, and Ni nanoparticles on samples calcined (NiCe) or reduced at 800 °C (NiCe-R), calculated from X-ray diffraction (XRD) peaks using different models.
SampleScherrer
Low
Size–Strain PlotWilliamson–Hall PlotScherrer Equation
a
(Å)
dCeO2
(nm)
εS-S
(×10−3)
R2dCeO2
(nm)
εW-H
(×10−3)
R2dNiO
(nm)
dNi
(nm)
r-CeO25.4111170.990141.70.799
2NiCe5.4114160.996161.90.89613-
4NiCe5.4115170.997192.10.92216-
8NiCe5.4025190.972403.10.9919-
12NiCe5.4023170.980322.50.81020-
2NiCe-R5.40288.90.988320.90.927-21
4NiCe-R5.41308.90.993401.30.929-33
8NiCe-R5.4145110.977731.90.978-30
12NiCe-R5.4143110.953872.20.953-34
Table 5. Surface area and pore morphology of reduced samples.
SampleS.A.1
(m2 g−1)
Pore Volume
(cm3 g−1)
Average Pore Diameter 2 (nm)
r-CeO2940.4019
2NiCe-R730.4932
4NiCe-R650.6839
8NiCe-R340.2832
12NiCe-R280.2130
1 S.A. = surface area; 2 average pore diameter = 4 pore volume/S.A.
Table 6. Apparent activation energy, conversions, and the corresponding turnover frequency (TOF) values over xNiCe catalysts.
SampleEa app
(kJ mol)
CH4 Conversion
(%)
TOF (CH4)
(s−1)
450–650 °C600 °C650 °C700 °C600 °C650 °C700 °C
2NiCe71.810.016.124.018.129.344.2
4NiCe86.622.133.446.332.148.968.1
8NiCe67.629.742.556.265.088.5123.7
12NiCe73.529.540.555.744.459.582.5
Publisher’s Note: MDPI stays neutral with regard to jurisdictional claims in published maps and institutional affiliations.

