Article

A Remote Sensing-Based Method to Assess Water Level Fluctuations in Wetlands in Southern Brazil

by
João P. D. Simioni
1,
Laurindo A. Guasselli
1,
Gabriel de Oliveira
2,*,
Guilherme A. V. Mataveli
3 and
Thiago V. dos Santos
4
1
Center for Remote Sensing and Meteorology, Federal University of Rio Grande do Sul, Porto Alegre, RS 91501-970, Brazil
2
Department of Geography and Planning, University of Toronto, Toronto, ON M5S 3G3, Canada
3
Department of Geosciences, Federal University of São João del-Rei, São João del-Rei, MG 36307-352, Brazil
4
Embrapa Agricultural Informatics, Campinas, SP 13083-886, Brazil
*
Author to whom correspondence should be addressed.
GeoHazards 2020, 1(1), 20-30; https://doi.org/10.3390/geohazards1010003
Submission received: 3 April 2020 / Revised: 29 April 2020 / Accepted: 8 May 2020 / Published: 12 May 2020

Abstract

:
The characterization of water level fluctuations is crucial to explain the hydrological processes that contribute to the maintenance of the structure and function of wetlands. The aim of this study was to develop a method based on remote sensing to characterize and map the water level variation patterns, evapotranspiration, discharge, and rainfall over wetlands in the Gravataí River basin, Rio Grande do Sul (RS), Brazil. For this purpose, ground-based measurements of rainfall, water discharge, and evapotranspiration together with satellite data were used to identify the apparent water level based on the normalized difference water index (NDWI). Our results showed that the variation of the water level followed the rainfall, water discharge, and evapotranspiration seasonal patterns in the region. The NDWI showed similar values to the ground-based data collected 10 days prior to satellite image acquisition. The proposed technique allows for quantifying the pattern of flood pulses, which play an important role for establishing the connectivity between different compartments of wetlands in the study area. We conclude that our methodology based on the use of satellite data and ground measurements was a useful proposition to analyze the water level variation patterns in an area of great importance in terms of environmental degradation and use of agriculture. The information obtained may be used as inputs in hydrologic models, allowing researchers to evaluate the impact, at both local and regional scales, caused by advance of agriculture into natural environments such as wetlands.

1. Introduction

Water level fluctuations affect ecological processes and lake patterns [1,2,3,4]. In wetlands, the characterization of water level fluctuations is the basis for understanding the temporal limnological changes in these environments [5,6]. Oscillatory fluctuations are not the only type of changes in water levels that can occur in wetlands. Permanent changes in water level can also occur due to many factors, including drainage of the wetland, damming of the outlet, or global climate change [7,8,9,10,11]. Although water level fluctuations may generate more productive and diversified habitats, they may also have negative effects on lake ecosystems and their services, such as eutrophication, cyanobacteria proliferation, and even increased susceptibility to invasive species [1,4,10,12]. Deposition of nutrients from sediments contributes to high yield rates in wetland areas, and for this reason they are considered one of the most productive natural environments [13].
The characterization of water level fluctuation is crucial to explain the hydrological processes that contribute to the maintenance of the structure and function of wetlands, since they allow the understanding of flood patterns [14]. In a study on the vegetation dynamics in the Taim marsh in southern Brazil, Guasselli et al. [15] discusses the importance of water level fluctuations for the determination of characteristics of the aquatic macrophyte stands in marshes. Valk [7] states that water level oscillations have an effect on wetland vegetation dynamics. More permanent water level changes of any magnitude will result in significant changes in the size and flora and fauna of a wetland, and in extreme cases, will result in its conversion into some other type of ecosystem [7]. Moreover, Gathman et al. [16] points out that great water level fluctuations are responsible for seasonal changes in the structure of lake communities. According to Mauhs et al. [17], the presence of a water level directly influences the soil characteristics, reducing the gas exchange between soil and air. Morandeira et al. [18] consider that growth and survival of emergent aquatic macrophytes are dependent on water level fluctuations. Wetlands provide several direct and/or indirect services to the surrounding environment, such as biodiversity maintenance, recharge of aquifers and water table, sediment retention, microclimatic control, as well as ecotourism and housing for traditional populations [19,20,21].
Several studies have been conducted in the past few years, addressing the seasonal and interannual water fluctuation dynamics in different types of wetlands around the world [1,8,16]. In southern Brazil, the majority of wetlands are difficult to access and collect ground data on, which causes problems related to development of studies in these areas. In this regard, there is a need for studies combining ground measurements with remote sensing data to advance the knowledge concerning flood pulses and water level variation of wetlands in this region of Brazil [22,23,24]. The definition of strategies for planning and conservation of these areas is considered extremely important for the maintenance of biodiversity and water resources in this region [25,26,27,28]. Carvalho and Ozorio [23] argue that rapid modifications and significant reductions in marsh areas are occurring in the state of Rio Grande do Sul (RS) due to anthropogenic activities, such as agricultural activities, livestock, backfills, urbanization, and the dumping of garbage and domestic sewage in marsh areas.
Based on the above considerations, the aim of this study was to develop a method based on remote sensing to characterize and map the water level variation patterns, evapotranspiration, discharge, and rainfall over wetlands in the Gravataí River basin, Rio Grande do Sul (RS), Brazil.

2. Materials and Methods
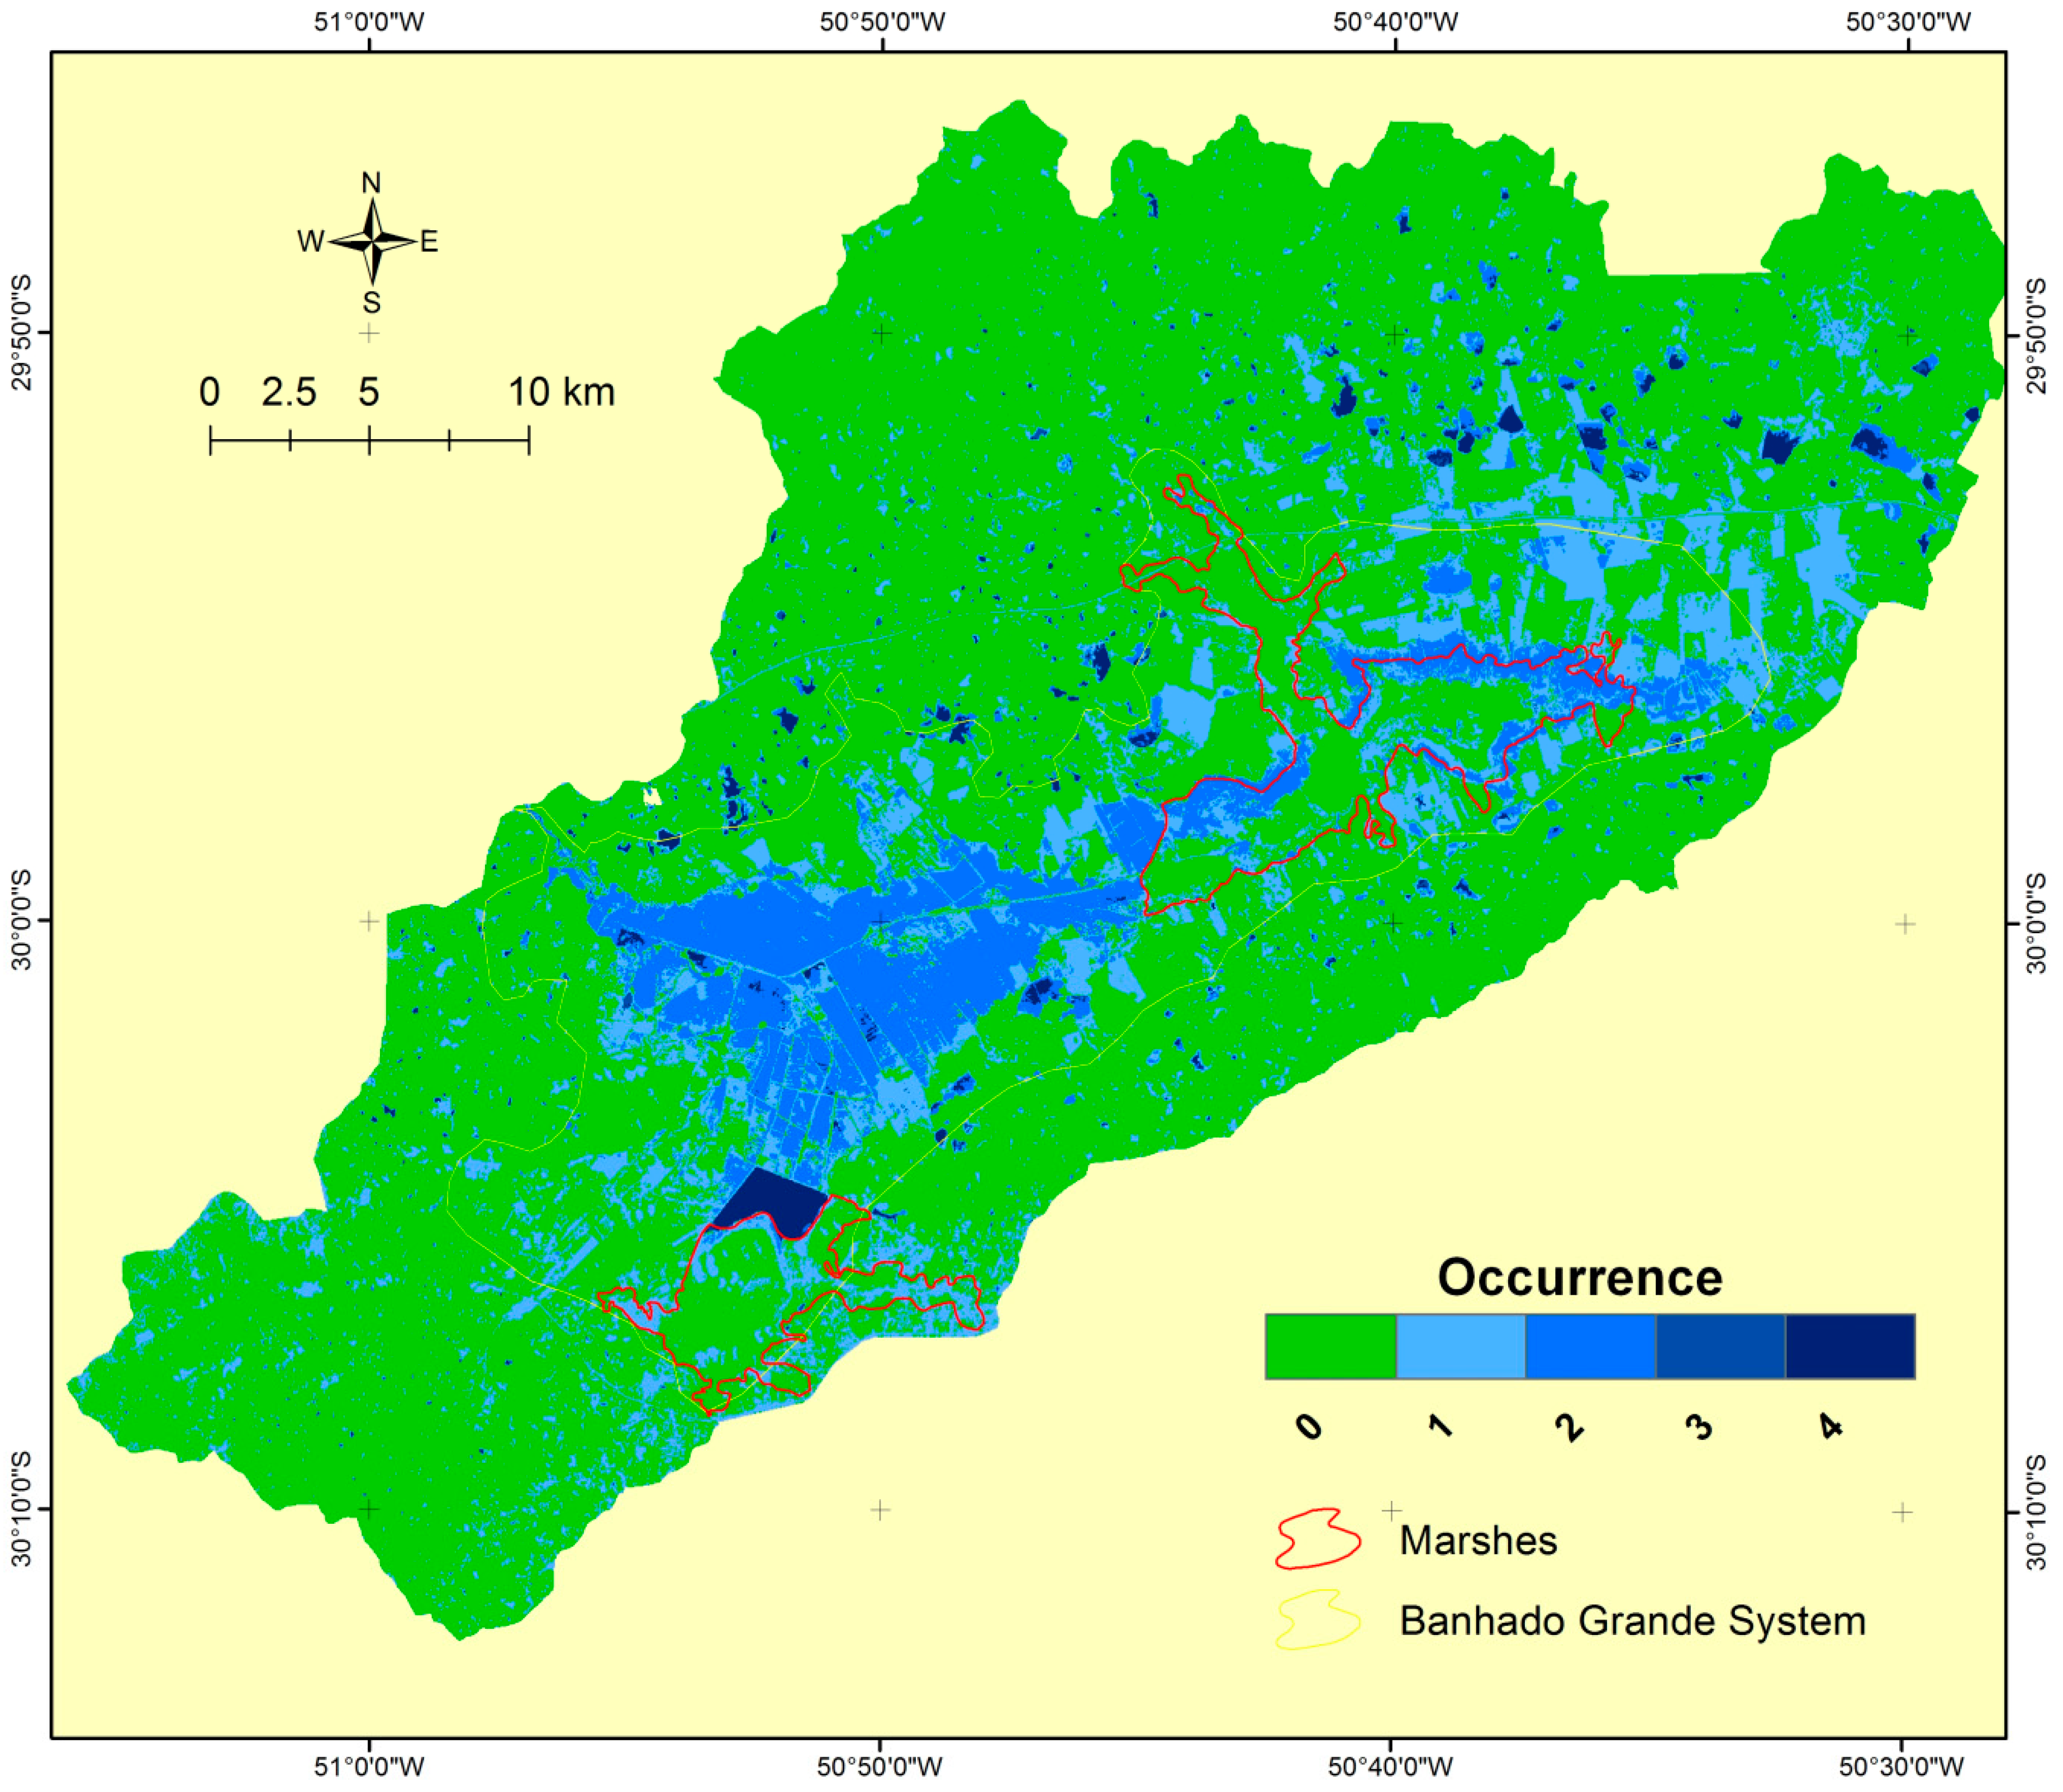
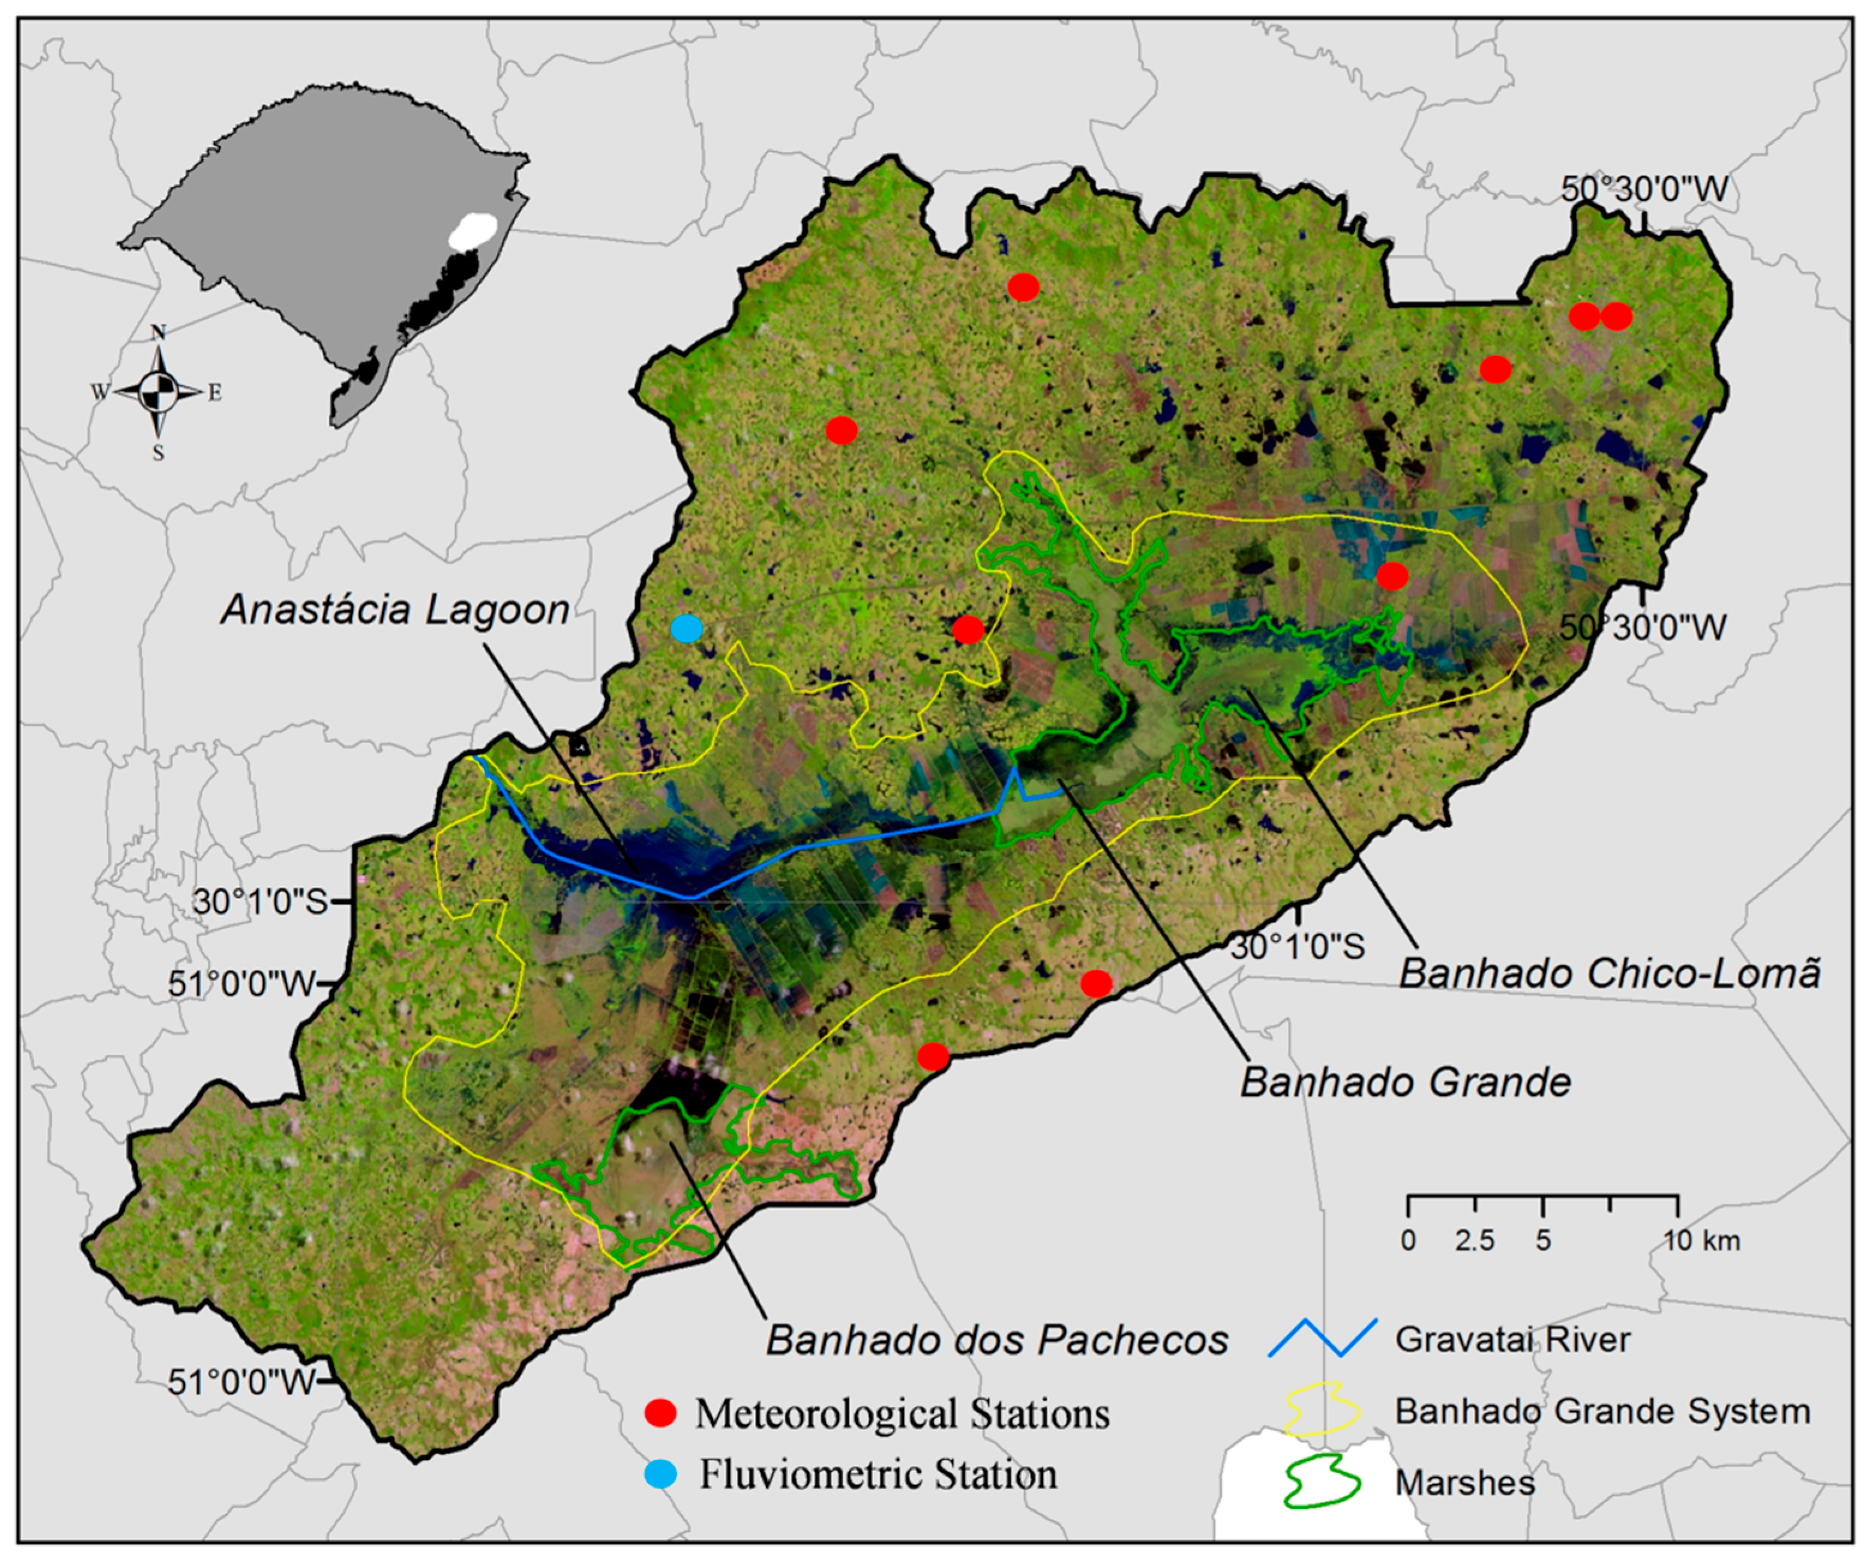
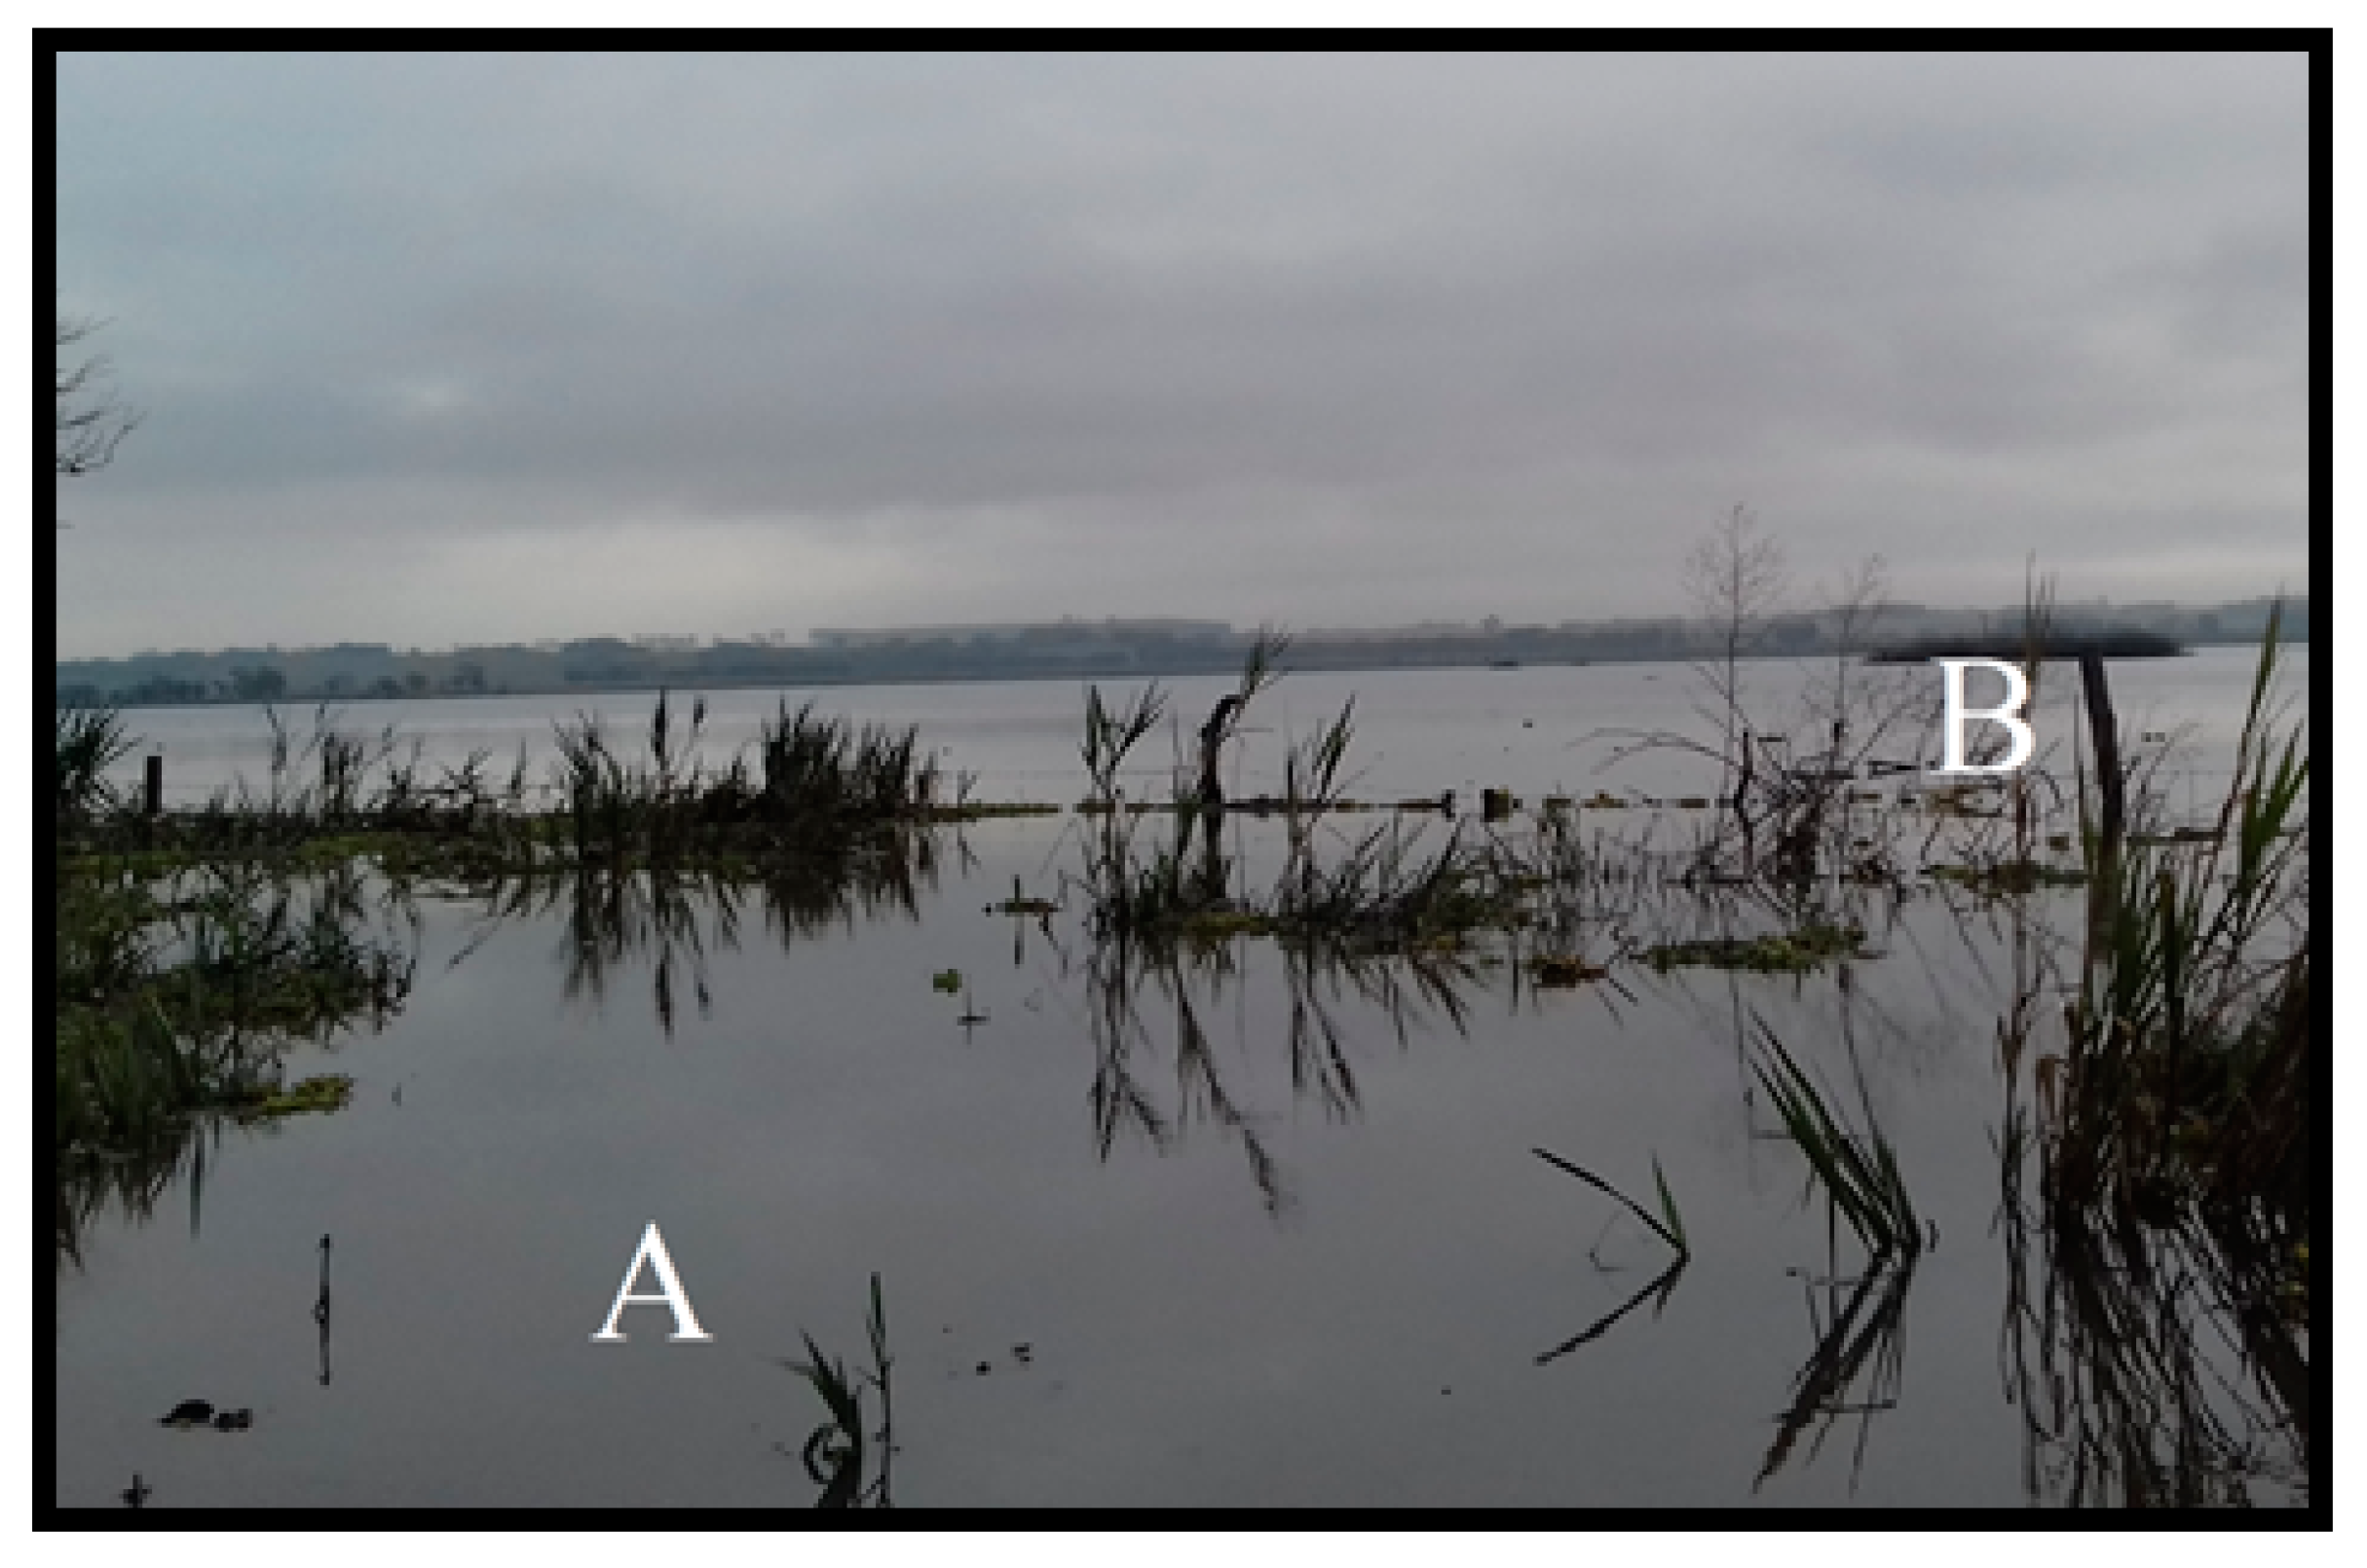
2.1. Study Area

This study was conducted at the Environmental Protection Area of Banhado Grande (EPABG), a nature conservation unit located in the metropolitan region of Porto Alegre. The EPABG was established in 1998 to protect biological diversity and ensure sustainability of the use of natural resources in the region [24,29].
The EPABG stretches over an area of 136,935 ha (Figure 1), covering the municipalities of Santo Antônio da Patrulha, Gravataí, Viamão, and Glorinha. The EPABG comprises 7 geomorphological units, where the most relevant is the corridor that connects the Banhado Grande with the Banhado dos Pachecos and Banhado Chico Lomã, with the presence of plains and lagoon terraces, as well as a fluvial–colluvial depression [15]. According to Shuttle Radar Topography Mission (STRM) data, elevation within the EPABG ranges between 0 and 385 m. The EPABG is one of the most important wetlands in RS, and its biodiversity is known for the great diversity of animals, especially migratory birds, and is considered at extreme risk of degradation [30]. The Banhado Grande area is delimited by the altimetric quota of 20 m, composed by a continuous area of swamps, flood plains, and rice paddies. The study area has an annual average temperature varying between 17 and 20 °C and an annual rainfall between 1700 and 1800 mm [31].

2.2. Rainfall

We used data from 8 meteorological stations from the Brazilian National Water Agency (https://www.ana.gov.br/eng/) located within the EPABG. Based on these measurements, we calculated the average rainfall for 30 years (1971–2000). To calculate the average monthly rainfall during the 30 years of analysis, we used Equation (1):
X = i = 1 n X 1 n
where Xi is the monthly rainfall (mm) and n is the number of observations (30 years). We also calculated the total rainfall relative to the ten days prior to image acquisition in order to better understand the wetland’s response to precipitation events.

2.3. Discharge and Evapotranspiration

The analysis of discharge data was based on the Passo das Canoas measuring ruler administered by the CPRM (Brazilian Mineral Resources Research Company), installed in the Gravataí River. Due to its small catchment basin (202,000 ha), the Gravataí basin responds very quickly to rainfall events, so we utilized the daily time scale in the analysis of rainfall, discharge, and evapotranspiration. We used daily measurements for the 10-day period prior the collection of the satellite image.
Evaporation data were obtained through the Piché evaporimeter, located at the INMET (Brazilian National Institute of Meteorology) meteorological station in the municipality of Porto Alegre, 25 km from the study area. In order to estimate evapotranspiration from the evaporation data, we used the Penman–Piché method [32,33]. The Piché method for evapotranspiration estimation is calculated through Equation (2):
E T P i = ( 0.28 p i ) ( 1 w )
where Pi is the evaporation obtained by the Piché evaporimeter, mm/d, and w is defined as a function of air temperature [34]:
w = 0.407 + 0.0145 T < T < 16   ° C
w = 0.483 + 0.01 T < T < 32   ° C

2.4. Mapping of Apparent Water Level

To map the apparent water level between 2000 and 2013, we used data from Landsat 5 TM (dates 10/21/2000, 01/01/2002, and 09/20/2009) and Landsat 8 OLI (date 08/31/2013) satellites. Data preprocessing consisted of: (1) georeferencing; (2) atmospheric correction through the dark pixel method [35]; and (3) subsetting to the study area. For atmospheric correction, we chose fifty pixels over water with the darkest values in the images, under the assumption that the small reflectance numbers at those pixels were due to the effect of atmospheric scattering. We then averaged their digital numbers and subtracted the resulting signal from all remaining pixels within the scene. For the identification of areas with apparent water level, we first performed the atmospheric correction of the Landsat images based on the dark pixel method [35] and then we calculated the normalized difference water index (NDWI) [36].
Equations (5) and (6) were used to calculate the NDWI for the Landsat 5 TM and Landsat 8 OLI images, respectively.
N D W I = ( B 2 B 4 ) ( B 2 + B 4 )
where B2 corresponds to the green wavelength and B4 to the near-infrared wavelength bands of the Landsat 5 TM.
N D W I = ( B 3 B 5 ) ( B 3 + B 5 )
where B3 corresponds to the green wavelength and B5 to the near-infrared wavelength bands of the Landsat 8 OLI.
Since pixel values of NDWI images derived from satellite images range from −1 to 1, a suitable cut-off threshold was needed to extract water bodies while using NDWI. Here, we followed the definition by McFeeters [33] that pixels with NDWI value greater than 0 represent water bodies.
The pixels with NDWI > 0 for the four dates were then spatially aggregated to identify areas susceptible to apparent water level occurrence. This resulted in an image with the number of times of apparent water level occurred on that surface. After the sum of occurrences, four classes were defined according to the periodicity of the occurrences: (1) no occurrence; (2) one occurrence; (3) two occurrences; (4) three occurrences; (5) four occurrences.

3. Results

The distribution of the average monthly rainfall in the historical series (1971–2000) for the EPABG (Figure 2) shows two periods of higher rainfall concentration, one in the period from June to October and the other concentrated in the northern sector in January and February. It also shows two periods of lower concentration, one between March and April and another between November and December.
The last quarter of the year shows intense demand for water from rice growing, precisely when the water is less available in the basin. According to Guasselli et al. [15], there was an increase of more than 1500 ha of rice cultivation area between 1994 and 2009 in the EPABG.
Grabas et al. [8] states that the presence or absence of vegetation as well as the type of vegetation mulch directly influence evapotranspiration and discharge in the basin. For marsh areas, Scuderi [37] notes that changes in apparent water levels over time induce modifications in biological communities and system processes.
Figure 2 shows the spatial distribution of the apparent water level, the discharge, the evapotranspiration, and the rainfall for the 10 days prior to satellite image collection. Variation in the flooded area is related to the occurrence of three rainfall events in the previous 30 days (09/22/2000, 09/24/2000, and 10/04/2000), when it rained 58, 51, and 47 mm, respectively. This fact, together with low evapotranspiration (between 0.9 and 3 mm/day) and the low water demand for agriculture (around 10% in October) were responsible for the maintenance of the apparent water level, showing that wetlands from EPABG have a high water retention capacity.
The high water demand by agriculture combined with the low rainfall in the 10 days prior to 01/20/2002 resulted in this date having the smallest flooded area among all images (Figure 2b). The daily flow rates varied from approximately 1 to 5 m³/s. Consequently, evapotranspiration showed the highest daily rates during the studied period, with values reaching 20 mm. In Figure 2c, the discharge showed a rapid response to rainfall between 09/09/2009 and 09/13/2009, ranging from 30 m³/s on 09/09/2009 to 175 m³/s on 09/13/2009. The maximum daily evapotranspiration was 3 mm and occurred one day before obtaining the satellite image.
In Figure 2d, the flood was restricted to the area of the triangle among marshes Banhado Grande, dos Pachecos, and the flood plain of the Gravataí River, connecting these different wetlands. The discharge showed a response in less than 24 h after rainfall. The maximum daily rainfall value (70 mm) was verified on 08/25/2013 and the maximum daily discharge was verified in the next day (190 m³/s).
Figure 3 shows the mapping of areas susceptible to occurrence of apparent water level. Areas with more occurrences of apparent water level are related to dams for irrigation of the rice fields and are fragmented in the EPABG. It is also worth mentioning the area near the Anastacia lagoon, which showed the most susceptible wetlands to the occurrence of apparent water level between the four images.
In addition, it is verified that the connectivity between the Banhado dos Pachecos and the Gravataí River forms an area that connects the marshes with the river flood plain. The edges of the Banhado Grande are also highlighted because, although most of the marsh was covered by aquatic vegetation, the water level was in evidence before the aquatic vegetation emerged in periods of great flood pulses.

4. Discussion

In the EPABG, the variation of the apparent water level is mainly regulated by the flood pulses [38], which constitute the main ecological aspect of the flood plain [39]. However, Gathman et al. [16] argue that impacts of different pulses are not fully understood. Here, we note that the water demand for rice cultivation in the EPABG may also influence the dynamics of water level fluctuations. The importance of considering rice cultivation in the characterization of water level fluctuations was discussed by Tassi [40], who modeled the hydroperiod for the Taim marsh, southern Brazil, based on meteorological and water use data for agricultural cultivation. Vegetation growth may occur in the bottom of areas with apparent water level and adjacent marshes due to germination in hydromorphic soils, as well as in new habitats for fish and other aquatic organisms, besides improvement in water quality through sedimentation and removal of pollutants in wetlands [41].
During large flood pulses, an area with an apparent water level is established at Anastácia lagoon, flooding the old meanders of the Gravataí River and connecting them to the main channel [29]. In Figure 4, it is possible to see the Gravataí River bed (A) and the connectivity established between the river and its flood plain during periods of large flood pulses (B). This connection illustrates the importance to characterize the water dynamics in this wetland, where large flood pulses allow interaction between the river and its flood plain, facilitating the exchange of nutrients, sediments, and organisms [35].
The term ‘connectivity’ was introduced to reinforce that the connectivity, besides being lateral, is also vertical, including the concept of water exchanges with the water level. Considering the importance of vertical connectivity, Rubbo [42] performed a hydrogeological study in the EPABG on the so-called Cenozoic aquifer of the Gravataí River basin. According to the author, on the left bank of the Gravataí River there is observed the Águas Claras aquifer, which is formed by sands and stands out as an important recharge area for the basin. This recharge feeds both the free surface aquifer and the confined aquifer that occupies the Banhado Grande area.
The Gravataí River basin can be considered an open physical system, where water input (rainfall) can occur, hence resulting in output (drainage and evapotranspiration), and/or can be stored, mainly in the marshes Banhado Grande and dos Pachecos, which have a storage capacity of approximately 119,612,600 and 34,340,600 m³, respectively [43]. Collischonn and Tucci [44] state that the water discharge in the study area is more dependent on rainfall than on evapotranspiration, since the latter has a smaller seasonal variability.
The maximum discharge recorded in the Passo das Canoas rule was 246.65 m³/s [43]. For a return period of 10 years, the discharge was 195.75 m³/s. In this study, two discharge peaks were observed for the studied dates, on 09/17/2009 (~160 m³/s) and on 08/26/2013 (196.2 m³/s), which are higher than the expected discharge for a 10-year return period.
By proposing the renaturalization of old meanders of the Gravataí River in the area near Anastácia lagoon through bioengineering techniques, Brenner [45] warns about the discharge increase of the Gravataí River in the postdefects liability period of the canal in the 1970s. The rectilinear section favored the accelerated flow from upstream to downstream, preventing the Banhado Grande from fulfilling its “sponge” function by absorbing the large peaks of rainfall and releasing the water slowly.
The renaturalization would also allow the maintenance of lateral connectivity between the river channel, the abandoned meanders, and the area near Banhado dos Pachecos. This connectivity allows several interactions among these water bodies, such as exchange of nutrients, sediments, and organisms [46].
Regarding evapotranspiration, Scuderi [37] emphasizes the difficulty of studying this variable in marsh areas, mainly due to the large quantities of variables involved in the process, both physical and biological. When comparing evapotranspiration between a specific type of aquatic macrophyte (Zizaniopsis Bonariensis) and a flooded area without vegetation, it is possible to identify that the average evapotranspiration rates for the area with macrophytes reach 6.2 mm/day in the summer months, whereas average values drop to slightly more than half (3.4 mm/day) in the flooded area without vegetation. For the EPABG, the annual average is 983 mm/year, with the highest evapotranspiration in December (122 mm) while July records the lowest average values (45.1 mm) [43]. The maximum daily evapotranspiration (20 mm/day) was recorded in January 2002. The average for this month is 120 mm. The lowest values of evapotranspiration were observed in the months of August 2013 and September 2009, both with 0.3 and 0.2 mm/day, respectively. Averages for August and September are 58 and 67 mm, respectively. These findings highlight the relevance of rice crops and the use of water within the EPABG limits, which can cause environmental impacts in terms of drainage, runoff, among others.
We observed that the average monthly rainfall in the EPABG shows a period of higher rainfall concentration from June to October, with two periods of lower rainfall between March and April and between November and December. The variation of the apparent water level obtained by NDWI is regulated mainly through rainfall, evapotranspiration, and water demand by rice growing. In periods of greater rainfall, mainly from July to October, there is a larger area of apparent water level, which in large flood pulses connect the Grande and Pachecos marshes with the flood plain of the Gravataí River. Between November and March there is a smaller area with the presence of apparent water level. This fact is due to rainfall, which shows the lowest average values between November and December, high water demand by rice growing, and high rates of daily evapotranspiration from rice crops, besides the higher incidence of solar radiation.

5. Conclusions

We conclude that our methodology based on the use of satellite data and ground measurements was a useful proposition to analyze the water level fluctuations in an area with great importance in terms of environmental degradation and use of agriculture. The information obtained may be used as inputs for hydrologic models, allowing researchers to evaluate the impact, at both local and regional scales, caused by advance of agriculture into natural environments, such as wetlands.
Therefore, future efforts should be addressed to expand this methodology to the entire Gravataí basin, also adding more Landsat images to the time period analyzed for better describing of water level fluctuation patterns.

Author Contributions

Conceptualization, J.P.D.S. and L.A.G.; methodology, J.P.D.S. and L.A.G.; writing—original draft preparation, J.P.D.S. and L.A.G.; writing—review and editing, G.d.O., G.A.V.M., and T.V.d.S. All authors have read and agreed to the published version of the manuscript.

Funding

This research was funded by the CAPES (Coordination for the Improvement of Higher Education Personnel) agency, through a doctoral scholarship to the author J.P.D.S (Grant No. 88882.438941/2019-01).

Conflicts of Interest

The authors declare no conflict of interest.

References

  1. Gownaris, N.J.; Rountos, K.J.; Kaufman, L.; Kolding, J.; Lwiza, K.M.M.; Pikitch, E.K. Water level fluctuations and the ecosystem functioning of lakes. J. Great Lakes Res. 2018, 44, 1154–1163. [Google Scholar] [CrossRef]
  2. Mondal, S.; Chakravarty, D.; Bandyopadhyay, J.; Maiti, K.K. Thematic analysis and mapping of surface water for sustainable mine planning. Sustain. Water Resour. Manag. 2018, 5, 743–753. [Google Scholar] [CrossRef]
  3. Varni, M.; Barranquero, R.S.; Zeme, S. Groundwater and surface water interactions in flat lands: The importance of ecological and flow regulation perspectives. Sustain. Water Resour. Manag. 2019, 5, 1791–1801. [Google Scholar] [CrossRef]
  4. Yin, D.; Wang, Y.; Xiang, Y.; Xu, Q.; Xie, Q.; Zhang, C.; Liu, J.; Wang, D. Production and migration of methylmercury in water-level-fluctuating zone of the Three Gorges Reservoir, China: Dual roles of flooding-tolerant perennial herb. J. Hazard Mater. 2020, 381, 120962. [Google Scholar] [CrossRef] [PubMed]
  5. Robinson, S.J.; Souter, N.J.; Bean, N.G.; Ross, J.V.; Thompson, R.M.; Bjornsson, K.T. Statistical description of wetland hydrological connectivity to the River Murray in South Australia under both natural and regulated conditions. J. Hydrol. 2015, 531, 929–939. [Google Scholar] [CrossRef]
  6. Liu, J.; Jiang, T.; Huang, R.; Wang, D.; Zhang, J.; Qian, S.; Yin, D.; Chen, H. A simulation study of inorganic sulfur cycling in the water level fluctuation zone of the Three Gorges Reservoir, China and the implications for mercury methylation. Chemosphere 2017, 166, 31–40. [Google Scholar] [CrossRef] [PubMed]
  7. Van Der Valk, A.G. Water-level fluctuations in North American prairie wetlands. Hydrobiologia 2005, 539, 171–188. [Google Scholar] [CrossRef]
  8. Grabas, G.P.; Rokitnicki-Wojcik, D. Characterizing daily water-level fluctuation intensity and water quality relationships with plant communities in Lake Ontario coastal wetlands. J. Great Lakes Res. 2015, 41, 136–144. [Google Scholar] [CrossRef]
  9. Bekele, A.A.; Pingale, S.M.; Hatiye, S.D.; Tilahun, A.K. Impact of climate change on surface water availability and crop water demand for the sub-watershed of Abbay Basin, Ethiopia. Sustain. Water Resour. Manag. 2019, 5, 1859–1875. [Google Scholar] [CrossRef]
  10. Grabas, G.P.; Fiorino, G.E.; Reinert, A. Vegetation species richness is associated with daily water-level fluctuations in Lake Ontario coastal wetlands. J. Great Lakes Res. 2019, 45, 805–810. [Google Scholar] [CrossRef]
  11. Shan, L.; Song, C.; Zhang, X.; Cagle, G.A.; Shi, F. Plant defence allocation patterns following an increasing water level gradient in a freshwater wetland. Ecol. Indic. 2019, 107, 105542. [Google Scholar] [CrossRef]
  12. Shah, J.A.; Pandit, A.K.; Shah, G.M. Dynamics of physico-chemical limnology of a shallow wetland in Kashmir Himalaya (India). Sustain. Water Resour. Manag. 2017, 3, 465–477. [Google Scholar] [CrossRef]
  13. Junk, W.J.; Piedade, M.T.F. Áreas Úmidas (AUs) Brasileiras: Avanços e Conquistas Recentes. Bol. ABLimno 2015, 41, 20–24. [Google Scholar]
  14. Zarista, S. Monitoramento da dinâmica de inundação no pantanal norte com uso de índices EVI e LSWI do MODIS. Master’s Thesis, Federal University of Mato Grosso, Cuiabá, Brazil, 2013. [Google Scholar]
  15. Guasselli, L.A.; Etchelar, C.B.; Belloli, T.F. Os impactos do cultivo de arroz irrigado sobre as áreas úmidas da Área de Proteção Ambiental do Banhado Grande do rio Gravataí—RS. In Proceedings of the XVI Brazilian Symposium on Remote Sensing, Foz do Iguaçu, Brazil, 13–18 April 2013. [Google Scholar]
  16. Gathman, J.P.; Albert, D.A.; Burton, T.M. Rapid Plant Community Response to a Water Level Peak in Northern Lake Huron Coastal Wetlands. J. Great Lakes Res. 2005, 31, 160–170. [Google Scholar] [CrossRef]
  17. Mauhs, J.; Marchioretto, M.S.; Budke, J.C. Riqueza e biomassa de macrófitas aquáticas em uma área úmida na planície costeira do Rio Grande do Sul, Brasil. Pesq. Bot. 2006, 57, 289–302. [Google Scholar]
  18. Morandeira, N.; Grings, F.; Facchinetti, C.; Kandus, P. Mapping Plant Functional Types in Floodplain Wetlands: An Analysis of C-Band Polarimetric SAR Data from RADARSAT-2. Remote Sens. 2016, 8, 174. [Google Scholar] [CrossRef] [Green Version]
  19. Mitsch, W.J. Wetland creation, restoration, and conservation: A Wetland Invitational at the Olentangy River Wetland Research Park. Ecol. Eng. 2005, 24, 243–251. [Google Scholar] [CrossRef]
  20. Finlayson, C.M. Freshwater Marshes and Swamps. In The Wetland Book; Finlayson, C.M., Milton, G.R., Prentice, C.R., Davidson, N.C., Eds.; Springer: Dordetch, The Netherlands, 2018; pp. 1–14. [Google Scholar]
  21. An, S.; Verhoeven, J. Wetlands: Ecosystem Services, Restoration and Wise Use, 1st ed.; Springer International Publishing: Basel, Switzerland, 2019. [Google Scholar]
  22. Maltchik, L.; Rolon, A.S.; Guadagnin, D.L.; Stenert, C. Wetlands of Rio Grande do Sul, Brazil: A classification with emphasis on plant communities. Acta Limnol. Bras. 2004, 16, 137–151. [Google Scholar]
  23. Carvalho, A.B.P.; Ozorio, C.P. Avaliação sobre os banhados do Rio Grande do Sul, Brasil. Rev. Ciec. Amb. 2007, 1, 83–95. [Google Scholar]
  24. Simioni, J.P.D.; Guasselli, L.A.; Ruiz, L.F.C.; Nascimento, V.F.; De Oliveira, G. Small inner marsh area delimitation using remote sensing spectral indexes and decision tree method in southern Brazil. Rev. Teledetección 2018, 55–66. [Google Scholar] [CrossRef] [Green Version]
  25. Junk, W.J.; Piedade, M.T.F.; Lourival, R.; Wittmann, F.; Kandus, P.; Lacerda, L.D.; Bozelli, R.L.; Esteves, F.A.; Nunes da Cunha, C.; Maltchik, L.; et al. Brazilian wetlands: Their definition, delineation, and classification for research, sustainable management, and protection. Aquat. Conserv. 2014, 24, 5–22. [Google Scholar] [CrossRef]
  26. Cunha, C.N.; Piedade, M.T.F.; Junk, W.J. Classificação e Delineamento das Áreas Úmidas Brasileiras e de seus Macrohabitats, 1st ed.; EdUFMT: Cuiabá, Brazil, 2015. [Google Scholar]
  27. Piedade, M.T.F.; Junk, W.J.; Souza Junior, P.T.; Cunha, C.N.; Schongart, J.; Wittmann, F.; Candotti, E.; Girard, P. As áreas úmidas no âmbito do Código Florestal brasileiro. In Código Florestal e a Ciência: O Que Nossos Legisladores Ainda Precisam Saber; Souza, G., Jucá, K., Wathely, M., Eds.; Comitê Brasil: Brasília, Brazil, 2015; pp. 9–17. [Google Scholar]
  28. Bittencourt, D.Z.; Guasselli, L.A. Dinâmica de Inundação do Banhado a partir do índice NDPI, Reserva Biológica de São Donato—RS. Rev. Dep. Geog. 2017, 33, 85–96. [Google Scholar] [CrossRef] [Green Version]
  29. Simioni, J.P.D.; Guasselli, L.A.; Etchelar, C.B. Connectivity among Wetlands of EPA of Banhado Grande, RS. Rev. Bras. Rec. Hidr. 2017, 22. [Google Scholar] [CrossRef] [Green Version]
  30. Accordi, I.A.; Hartz, S.M. Distribuição espacial e sazonal da avifauna em uma área úmida costeira do sul do Brasil. Rev. Bras. Ornit. 2006, 14, 117–135. [Google Scholar]
  31. Rossato, M.S. Os climas do Rio Grande do Sul: Variabilidade, tendências e tipologia. Master’s Thesis, Federal University of Rio Grande do Sul, Porto Alegre, Brazil, 2011. [Google Scholar]
  32. Villa Nova, N.A.; Ometto, J.P. Adaptação e simplificação do método de Penman às condições climáticas do Estado de São Paulo. In Proceedings of the Brazilian Symposium on Hidrology and Water Resources, São Paulo, Brazil, 15–19 November 1981. [Google Scholar]
  33. Fernandes, A.L.T.; Fraga Júnior, E.F.; Takay, B.Y. Avaliação do método Penman-Piche para a estimativa da evapotranspiração de referência em Uberaba, MG. Rev. Bras. Eng. Agr. Amb. 2011, 15, 270–276. [Google Scholar] [CrossRef] [Green Version]
  34. Makkink, G.F. Ekzameno de la formulo de Penman. Net. J. Agr. Sci. 1957, 5, 209–305. [Google Scholar]
  35. Liang, S. Narrowband to broadband conversions of land surface albedo I. Remote Sens. Environ. 2001, 76, 213–238. [Google Scholar] [CrossRef]
  36. McFeeters, S.K. The use of the Normalized Difference Water Index (NDWI) in the delineation of open water features. Int. J. Remote Sens. 1996, 17, 1425–1432. [Google Scholar] [CrossRef]
  37. Scuderi, C.M. Estimativa da taxa de evapotranspiração da macrófita aquática “Zizaniopsis Bonariensis”: Aplicação à simulação do nível de água do longo período do Banhado do Taim (RS). Master’s Thesis, Federal University of Rio Grande do Sul, Porto Alegre, Brazil, 2010. [Google Scholar]
  38. Junk, W.J.; Bailey, P.B.; Sparks, R.E. The Flood Pulse Concept in River-Floodplain Systems. In Proceedings of the International Large River Symposium, Honey Harbour, Canada, 14–21 September 1986. [Google Scholar]
  39. França, A.M.S.; Sano, E.E.; Sousa, A.O.; Fonseca, R.A. Sensoriamento Remoto na Identificação e Quantificação de Áreas Úmidas no Distrito Federal. In Proceedings of the IX Simpósio Nacional do Cerrado, Brasília, Brazil, 12–17 October 2008. [Google Scholar]
  40. Tassi, R. Gerenciamento hidroambiental de terras úmidas. Ph.D. Thesis, Federal University of Rio Grande do Sul, Porto Alegre, Brazil, 2008. [Google Scholar]
  41. District, W.M. Fluctuating Lake Levels in St. Johns River Water Management District. Available online: https://www.sjrwmd.com/education/lake-levels/ (accessed on 2 April 2020).
  42. Rubbo, M. Análise do potencial hidrogeológico do aqüífero cenozóico da bacia hidrográfica do rio Gravataí—RS. Master’s Thesis, Federal University of Rio Grande do Sul, Porto Alegre, Brazil, 2004. [Google Scholar]
  43. Gravathay, C. Plano de Recursos Hídricos da Bacia Hidrográfica do Rio Gravataí. Available online: http://www.comitegravatahy.com.br/index.php/plano-da-bacia (accessed on 2 April 2020).
  44. Collischonn, B.; Tucci, C. Relações Regionais entre Precipitação e Evapotranspiração Mensais. Rev. Bras. Rec. Hidr. 2014, 19, 205–214. [Google Scholar] [CrossRef]
  45. Brenner, V.C. Proposta metodológica para renaturalização de trecho retificado do Rio Gravataí -RS. Master’s Thesis, Federal University of Rio Grande do Sul, Porto Alegre, Brazil, 2016. [Google Scholar]
  46. Ward, J.V.; Stanford, J.A. Ecological connectivity in alluvial river ecosystems and its disruption by flow regulation. Regul. Rivers: Res. Manag. 1995, 11, 105–119. [Google Scholar] [CrossRef]
Figure 1. Location of the Environmental Protection Area of Banhado Grande (EPABG), southern Brazil.
Geohazards 01 00003 g001
Figure 2. Temporal and spatial variation of the apparent water level at the EPABG in (a) 10/21/2000, (b) 01/20/2002, (c) 09/20/2009, and (d) 08/30/2013.
Geohazards 01 00003 g002
Figure 3. Susceptibility of occurrence of apparent water level.
Geohazards 01 00003 g003
Figure 4. Connectivity established in large flood pulses between the Gravataí River (A) and its flood plain (B), on 7/29/2016, EPABG. Source: Field work.
Geohazards 01 00003 g004

