Article

A Framework for Synthetic Agetech Attack Data Generation

1
Department of Electrical and Computer Engineering, University of Victoria, Victoria, BC V8P 5C2, Canada
2
National Research Council of Canada, Government of Canada, Ottawa, ON K1A 0R6, Canada
*
Author to whom correspondence should be addressed.
J. Cybersecur. Priv. 2023, 3(4), 744-757; https://doi.org/10.3390/jcp3040033
Submission received: 18 May 2023 / Revised: 26 August 2023 / Accepted: 21 September 2023 / Published: 9 October 2023

Abstract

:
To address the lack of datasets for agetech, this paper presents an approach for generating synthetic datasets that include traces of benign and attack datasets for agetech. The generated datasets could be used to develop and evaluate intrusion detection systems for smart homes for seniors aging in place. After reviewing several resources, it was established that there are no agetech attack data for sensor readings. Therefore, in this research, several methods for generating attack data were explored using attack data patterns from an existing IoT dataset called TON_IoT weather data. The TON_IoT dataset could be used in different scenarios, but in this study, the focus is to apply it to agetech. The attack patterns were replicated in a normal agetech dataset from a temperature sensor collected from the Information Security and Object Technology (ISOT) research lab. The generated data are different from normal data, as abnormal segments are shown that could be considered as attacks. The generated agetech attack datasets were also trained using machine learning models, and, based on different metrics, achieved good classification performance in predicting whether a sample is benign or malicious.

1. Introduction

According to the World Health Organization (WHO), by 2050, the elderly population above 60 years is expected to double [1]. It is projected that, as years go by, the number of elderly people relative to the rest of the population will continually increase. This means that there will be more people who require elderly care. For such population, agetech, which encourages seniors to age in their homes with the support of smart devices, is a great option instead of going to care facilities that are expensive and disconnect the elderly from their family and community.
The use of agetech comes with some challenges with regard to security and privacy of sensor data for the aged; hence, it is crucial to develop schemes to safeguard their data [2], such as intrusion detection systems (IDS). Smart device datasets can help bring out interesting behavioral patterns about the user, for instance, by building a profile of the user’s daily activities from the records collected [3,4]. In the area of agetech, data are very scarce and particularly attack data for sensor readings are lacking [5].
In order to build an IDS using machine learning, there is a need for large volumes of data of both normal events and attack incidents [6]. As suggested by Pham et al, when such data are lacking, an alternative is to generate synthetic attack data [7]. In this regard, we have developed a new approach for generating synthetic attack data for agetech. The contribution of this study is to provide methods and frameworks for reference in generating agetech synthetic sensor records attack data, which can be used in reinforcing security and privacy in agetech. Our approach involved exploring the changes in IoT device records when there are cyber attacks. We performed an in-depth data analysis to understand the changes in data patterns when these attacks occur. For illustration, we focused our study on the temperature data in the TON_IoT weather dataset. We were able to generate synthetic attack data that replicate the attack patterns from this general IoT dataset and there is some great level of trust that the generated attack records reflect real attacks. The remaining sections are structured as follows. Section 2 discusses related work. Section 3 presents a threat model for agetech devices and discusses why the TON_IoT dataset is ideal for replicating attack data for agetech that can be used to automatically detect attacks. Section 4 presents the datasets involved in our study. Section 5 presents the proposed data generation methods and their validation by training and testing the different machine learning models using corresponding datasets. Section 6 presents the concluding remarks.

2. Related Work

Pham et al. [7] presented some methods to help generate sufficient data for training machine learning models for intrusion detection. They generated artificial attack data using machine learning methods and assessed the quality of the data using different techniques. They showed that synthetic data can help improve the performance of machine-learning-based IDS when used in combination with real-world data. They used two methods in attack data generation. The first method assumes that only benign data are available with no attack instances, where the features follow a normal distribution and a feature value out of the range ( μ 3 δ , μ + 3 δ ) is considered abnormal. A data sample is altered by changing the feature values to values that are out of the normal mean ( μ ) and standard deviation ( δ ) range [7]. The algorithm calculates the mean and standard deviation of each feature value in the benign dataset. Then, it generates a number of samples by randomly selecting a sample from the benign data, copying it, and altering the values of its features so that the generated sample is different enough from the benign data. This method can be used in attack data generation; however, since the attack values are generated based on mean and variance, attacks can easily be detected by a machine learning model. It is important to consider more sophisticated attacks that manipulate data in a non-easily detectable manner so that the trained IDS is powerful enough.
In the second method, the authors generated more attack data using a dataset containing a small number of intrusive samples. This method involves generating new synthetic samples by copying and slightly modifying a randomly selected sample from the previously collected attack dataset. The assumption behind this method is that future attack instances are often similar to past attack instances, even if they are not identical. The algorithm randomly selects a feature and a sample from the previously collected attack dataset, and then calculates the highest frequency of values for the selected feature ( V m a x ) and the frequency of the value of the selected feature in the selected sample ( V ) . The algorithm generates ( V m a x V ) new synthetic samples by copying the selected sample and altering the value of the selected feature within a small range to ensure that the new sample is similar to the previous ones in the attack dataset. They observed that generating synthetic attack data using the proposed method helped improve the classification accuracy of machine learning models [7].
Belenko et al. [8] focused on developing a secure inter-car network called VANET (vehicular ad hoc network), which allows for wireless connection between vehicles and infrastructure and between vehicles themselves. This network aims to ensure convenience and safety when using the road. Its security had to be reinforced to avoid any malfunctions or infiltration into the system. The study suggests that, in order to build a highly effective intrusion detection system (IDS) for VANET, the IDS has to be trained using a sufficient number of samples of security threats which VANET has not yet produced. They therefore used a network simulator called NS-3 to investigate different attacks directed at VANET. This simulation is able to generate synthetic datasets consisting of cyber attack samples that can be used to train a machine-learning-based VANET IDS. This dataset can also be used to study the behavior and patterns of a vehicle targeted by an attacker by analyzing the traffic and network hosts [8].
Sourav et al. [9] presented a method for generating attack data that simulates stealthy sensor attacks in industrial control systems (ICS). The study assumes that an attacker has infiltrated the ICS and has taken control of a subset of sensors, and that the attacker is able to impersonate the compromised sensors without being detected. In this method, “micro-distortions” are injected into original sensor readings, thus sending out fake readings. The distortion is kept within a small size of about 0.5% of the possible value range which are subtracted or added to the actual reading without affecting the normal functioning of the sensor. The major consideration is that the micro-distortions are often much lower than the actual sensors readings, so the approach involved a simple algorithm that leveraged the observation that sensor readings in ICS often change gradually over time [9].

3. Threat Model

In this section, we develop a threat model for IoT devices used for aging in place. Threat modeling involves identifying security vulnerabilities and investigating potential cybersecurity attacks. With threat modeling, potential security risks can be identified and addressed before they are exploited by hackers, thus protecting the assets and ensuring the safety and continuity of device operation. STRIDE is a threat modeling framework that was developed by Microsoft. STRIDE stands for Spoofing, Tampering, Repudiation, Information Disclosure, Denial of Service and Elevation of privileges [10]. The different security attacks can fall into these six categories. There are different types of attacks that can be used to exploit IoT devices for aging in place, so we focus on some of the common ones [5].
The intention is to protect the hardware and software of agetech, as well as to protect the data which consist of login credentials, medical data, personal identifiable data, private data, financial data, daily habits, and location. The potential threats that could compromise the security of agetech include external threats like routine hacking by remote actors, viruses, and malware infections through vectors such as phishing or visiting dangerous or compromised sites. There are also internal threats such as user errors or lack of knowledge or unscrupulous care givers taking advantage of the elderly.
In Table 1, we explain vulnerabilities in the IoT device systems that can be exploited by those threats. These refer to weaknesses in hardware or software, poorly configured systems, or gaps in security policies and procedures. We explain how the devices can be exploited as well as the impact of each identified threat. We also provide ways to mitigate the risks associated with each threat that involve technical controls like the use of firewalls and encryption, administrative controls, and education of users to, for example, use strong passwords and avoid clicking on links they are not sure of.
The attacks in Table 1 are what agetech devices are likely to face if they have the different vulnerabilities, and these are some of the attacks that were also executed in the general purpose IoT attack data (TON_IoT dataset), which implies that the TON_IoT dataset is relevant in being used to replicate attacks for an agetech dataset and can be used to determine attack patterns. The attacks in the TON_IoT dataset include ransomware attack, man-in-the-middle (MITM) attack, cross-site scripting (XSS) attack, password attack, and distributed denial of service (DDoS) attack. There are different mitigation techniques and there is also the need for automatic strategies to identify vulnerabilities and attacks before they are exploited. Machine learning comes in handy in detecting attacks. Therefore, in Section 5.2, we employ machine learning methods to determine whether sensor records are benign or malicious.

4. Datasets and Data Analysis

4.1. Agetech Attack Data

After an intensive search for agetech attack data, we concluded that there are no attack datasets for sensor readings from smart devices for aging in place. The attributes of agetech attack data needed are as follows:
  • Data from smart device used for aging in place (AIP).
  • Data for sensor recordings not network traffic.
  • Anomaly sensor recordings data caused by security attacks and not severe health conditions or faulty devices.
One approach to address the lack of such data is generating synthetic agetech attack samples. First, we studied the attack patterns in a general purpose IoT attack dataset that is not specifically for agetech, called TON_IoT data, to understand what generally happens to sensor readings when various attacks were launched. Then, using benign agetech data collected in our lab, we leveraged the acquired attack knowledge to generate agetech data using our proposed methods.

4.2. TON_IoT Data

4.2.1. Dataset Overview

The TON_IoT dataset consists of data collected from Internet of Things (IoT) and Industrial Internet of Things (IIoT) sensors, network traffic and Transport Layer Security (TLS) data, and operating systems datasets for Ubuntu 14 and Windows 7 and 10 [17]. Different attack vectors were executed against the IoT gateways, web applications, and computer systems in the network. The attacks included ransomware attack, man-in-the-middle (MITM) attack, cross-site scripting (XSS) attack, password attack, and distributed denial of service (DDoS) attack. Using parallel processing, benign and attack data samples were collected from the IoT telemetry services, host audit traces and network traffic.
We used the TON_IoT dataset to explore the changes in IoT device records when there are cyber attacks by conducting in-depth data analysis to understand the changes in data patterns. For illustration, we focused specifically on the temperature readings under the TON_IoT weather data subset as explained in the following section.

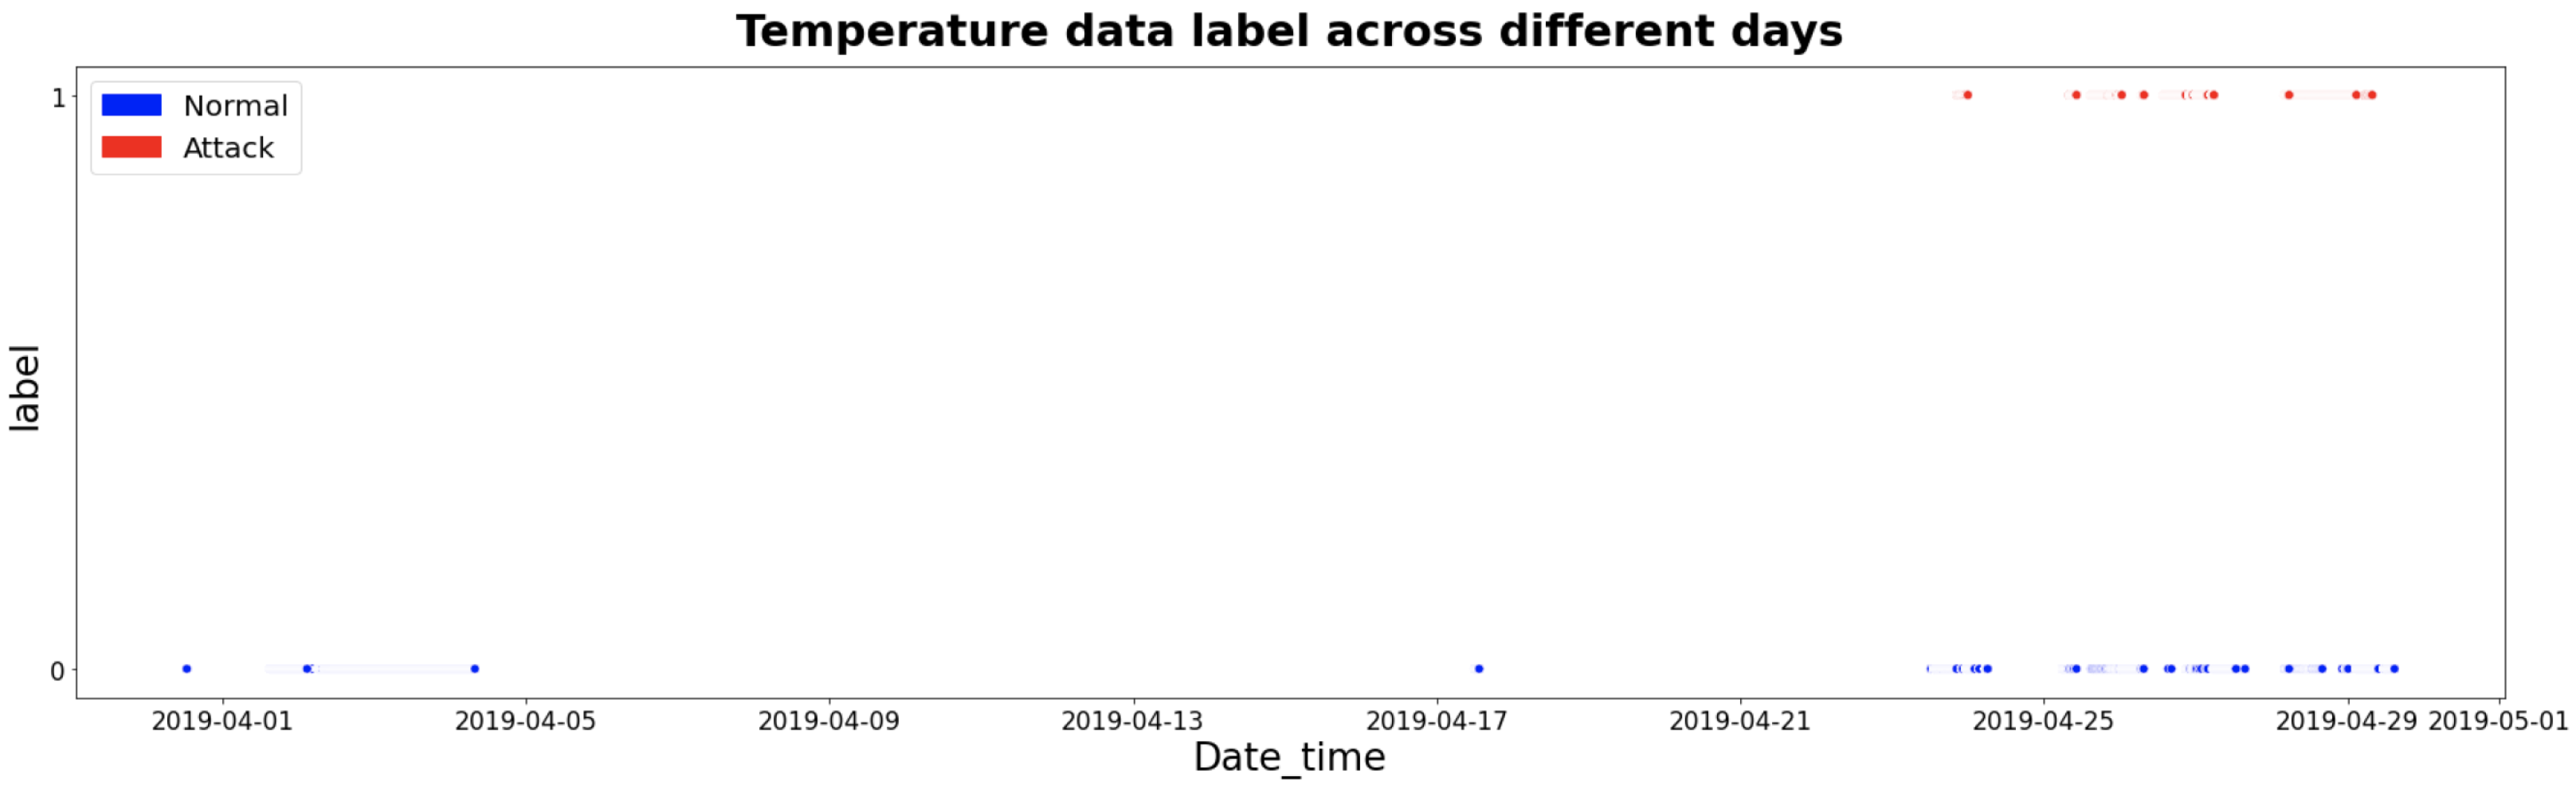
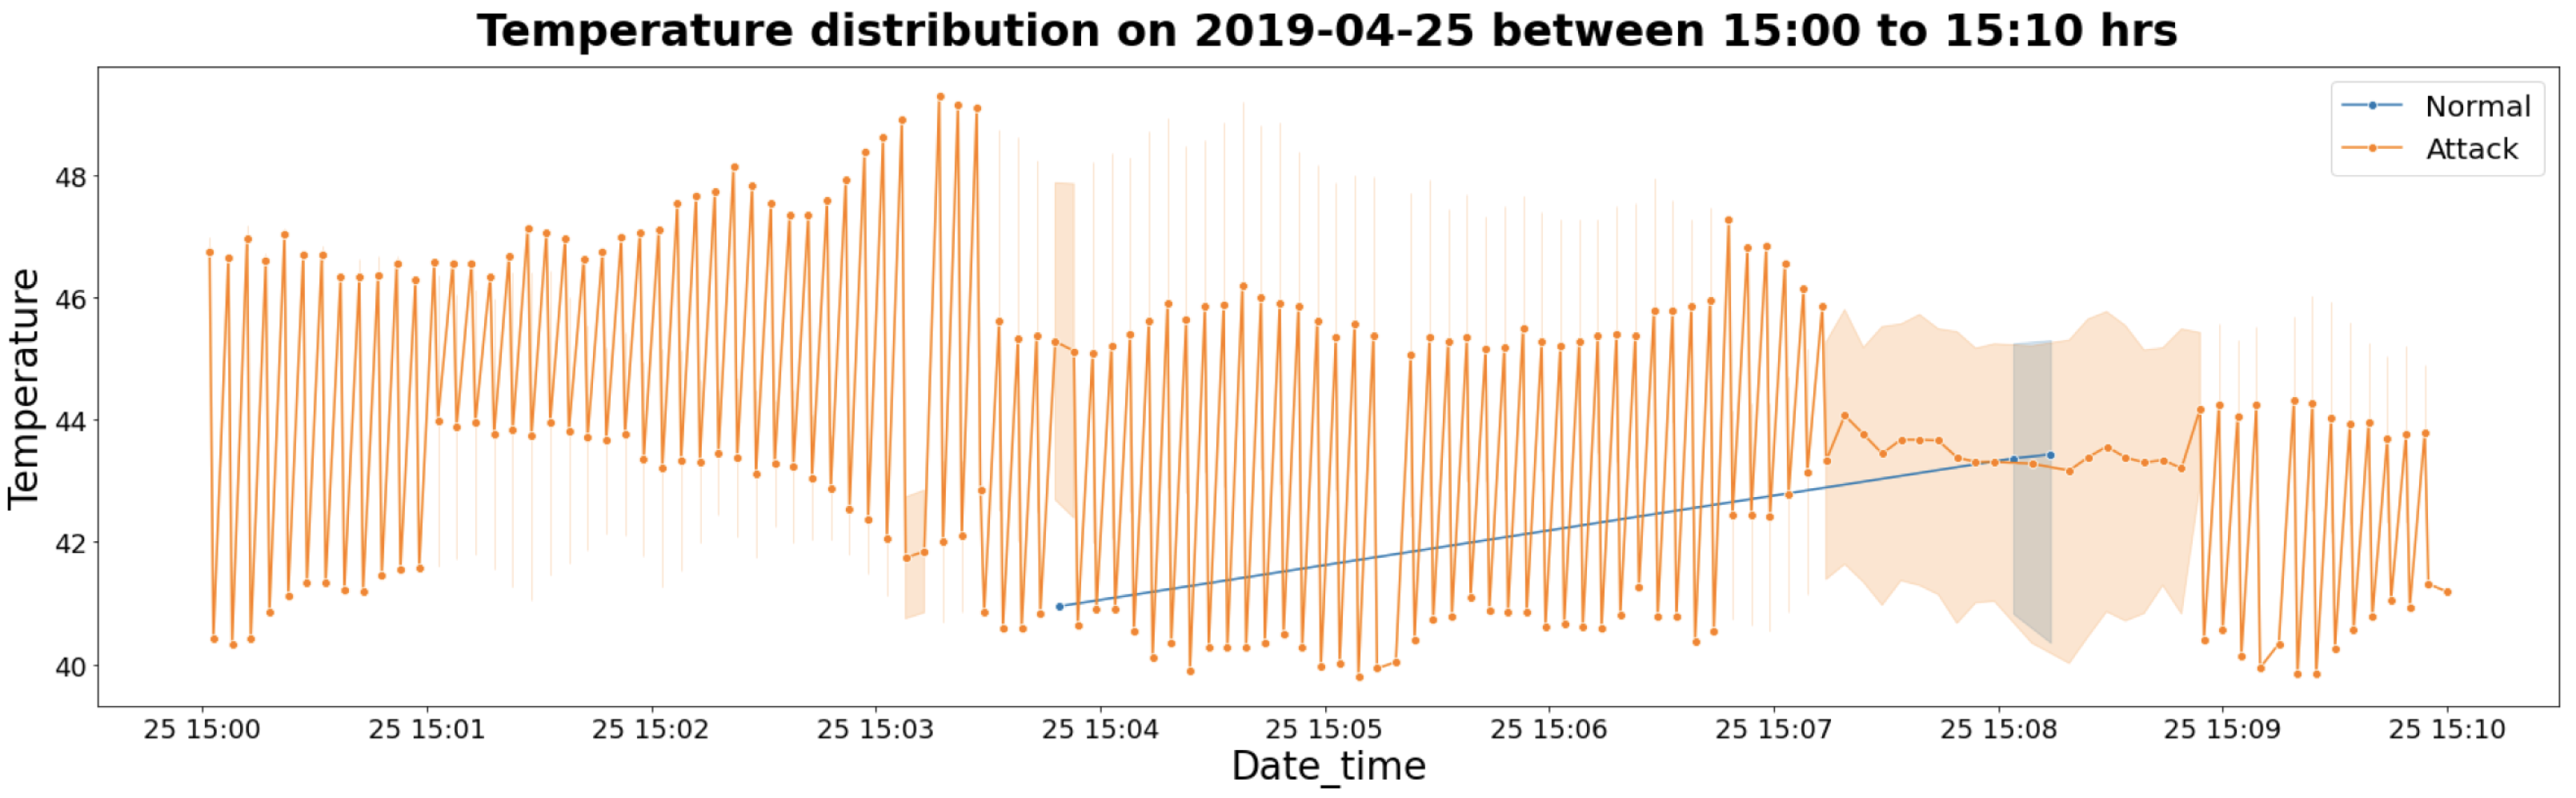
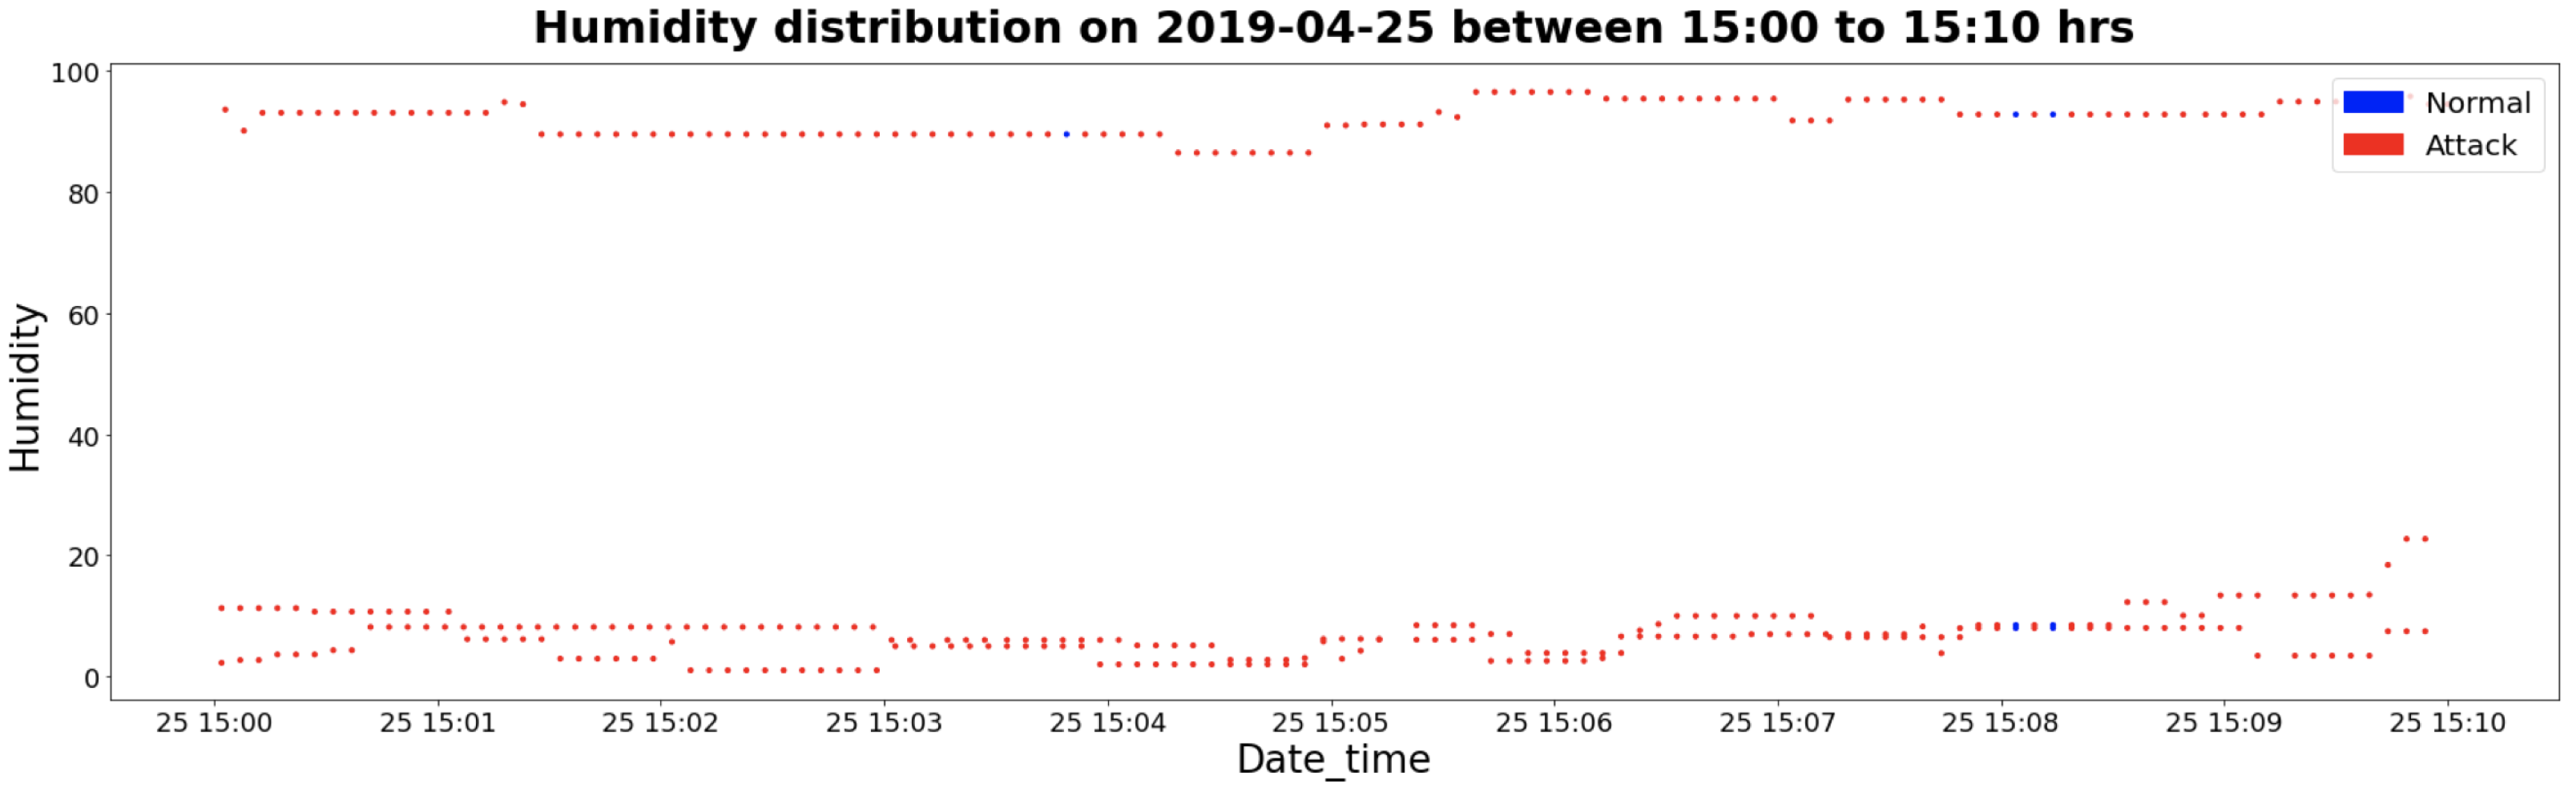
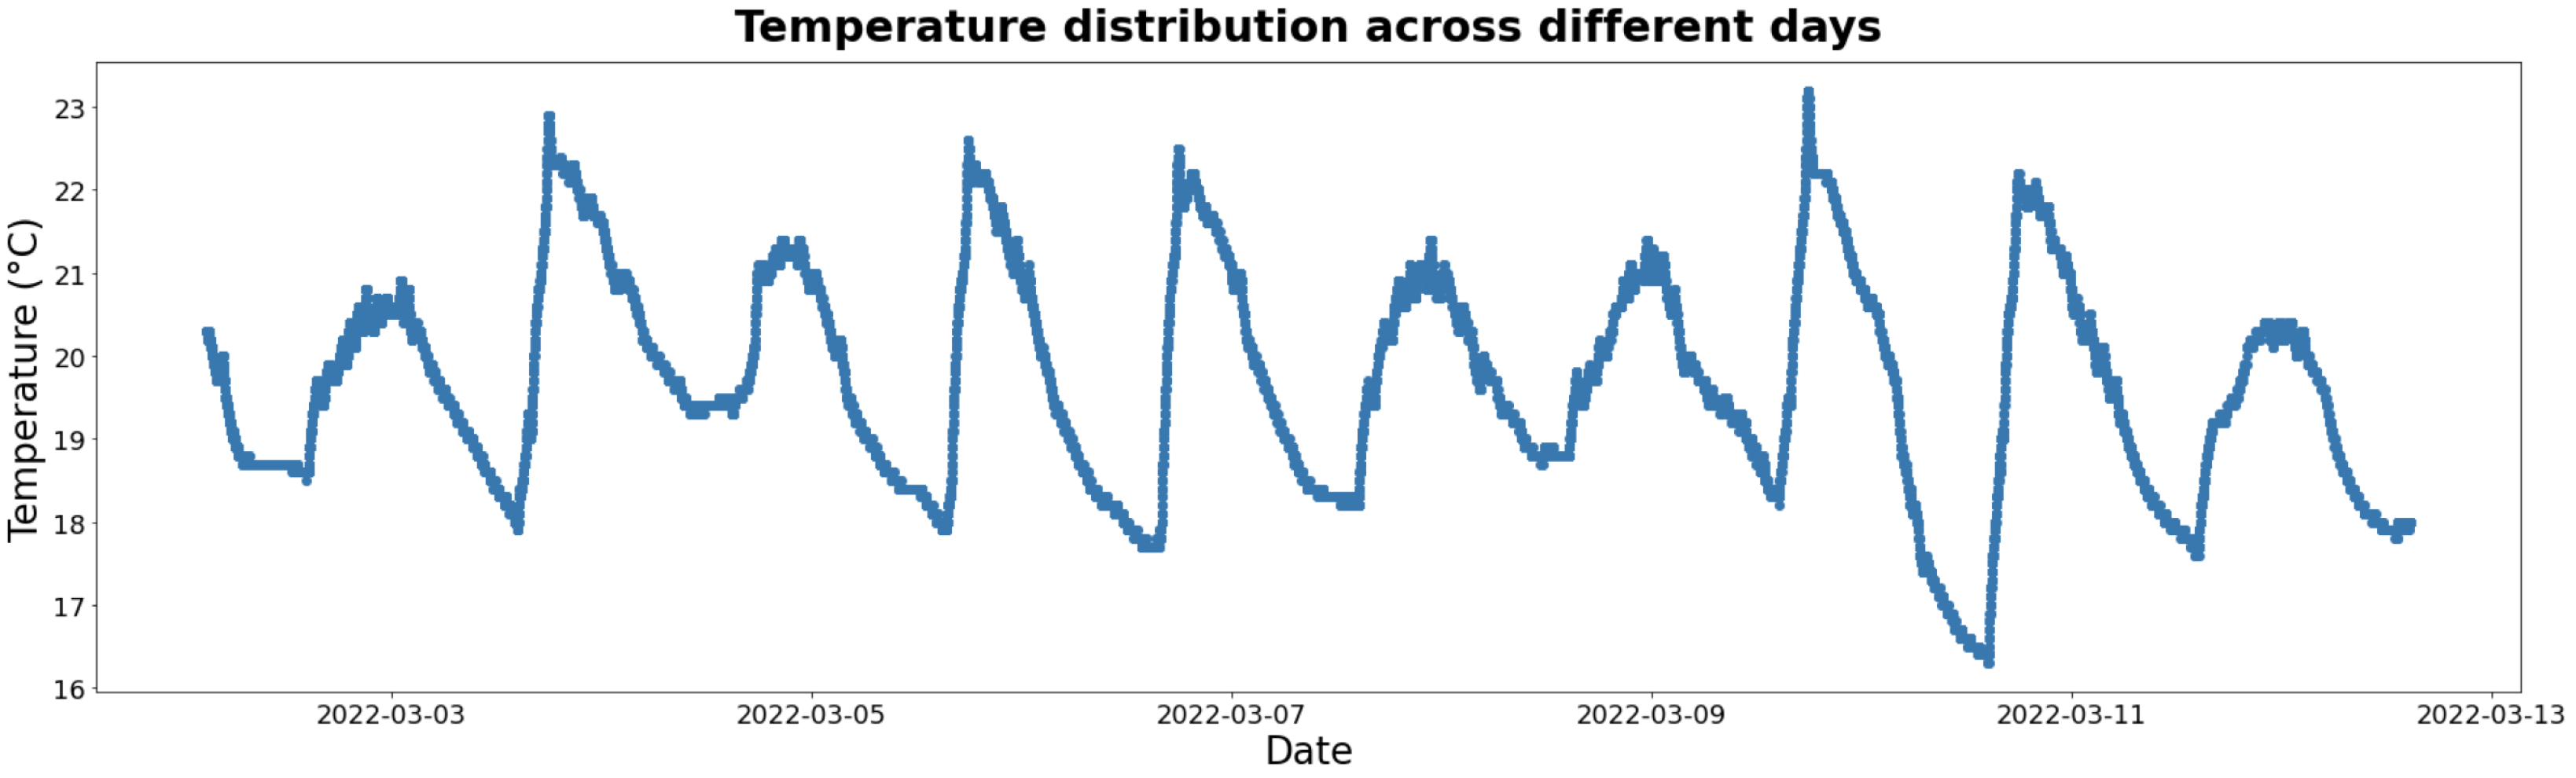
4.2.2. TON_IoT Weather Data—Temperature

In checking the various TON_IoT data subsets, the attacks happened around 25 April 2019 and 29 April 2019. Therefore, we had to investigate further and see what was different on those specific days compared to other days like 2 April 2019 and 4 April 2019, which mostly have normal activities. Figure 1 helps with such understanding by showing the data labels across the different days. The separation between the benign and attack readings is an indication that an anomaly could be dependent on what the value is at the specific time that is different from what normally happens at that specific time. The anomalies are not dependent on whether the values are abnormally large or small but are rather dependent on the pattern of the values at the specific time. Most of the attacks happened when the temperature was about 25–30 with pressure 20 and above, and with humidity in the range of 60–90.
Figure 2 shows a scatter plot of temperature within a 10 min range on a day where mostly attacks happened. Figure 3 shows the weather temperature data distribution for 10 min on a day where there were no attacks. These two figures illustrate with clarity the variation in data patterns when an attack happens versus benign samples.
In Figure 4 and Figure 5, line plots are used to further highlight the difference between benign sensor readings and sensor readings under attack.
From Figure 4 and Figure 5, it can be observed that there is a difference in the sequence of data when there is an attack, for instance, the reading moves from 46.49 to 46.99, then to 40.41 and back to 46.70. There is some sort of duplicate and then a drastic drop. In contrast, normal readings vary from 48.48 to 42.32, then to 35.51 and back to 48.98. They decrease gradually and then increase. There is also an obvious difference in the data progression over time for humidity on a normal occurrence versus an attack, as illustrated in Figure 6 and Figure 7, respectively.

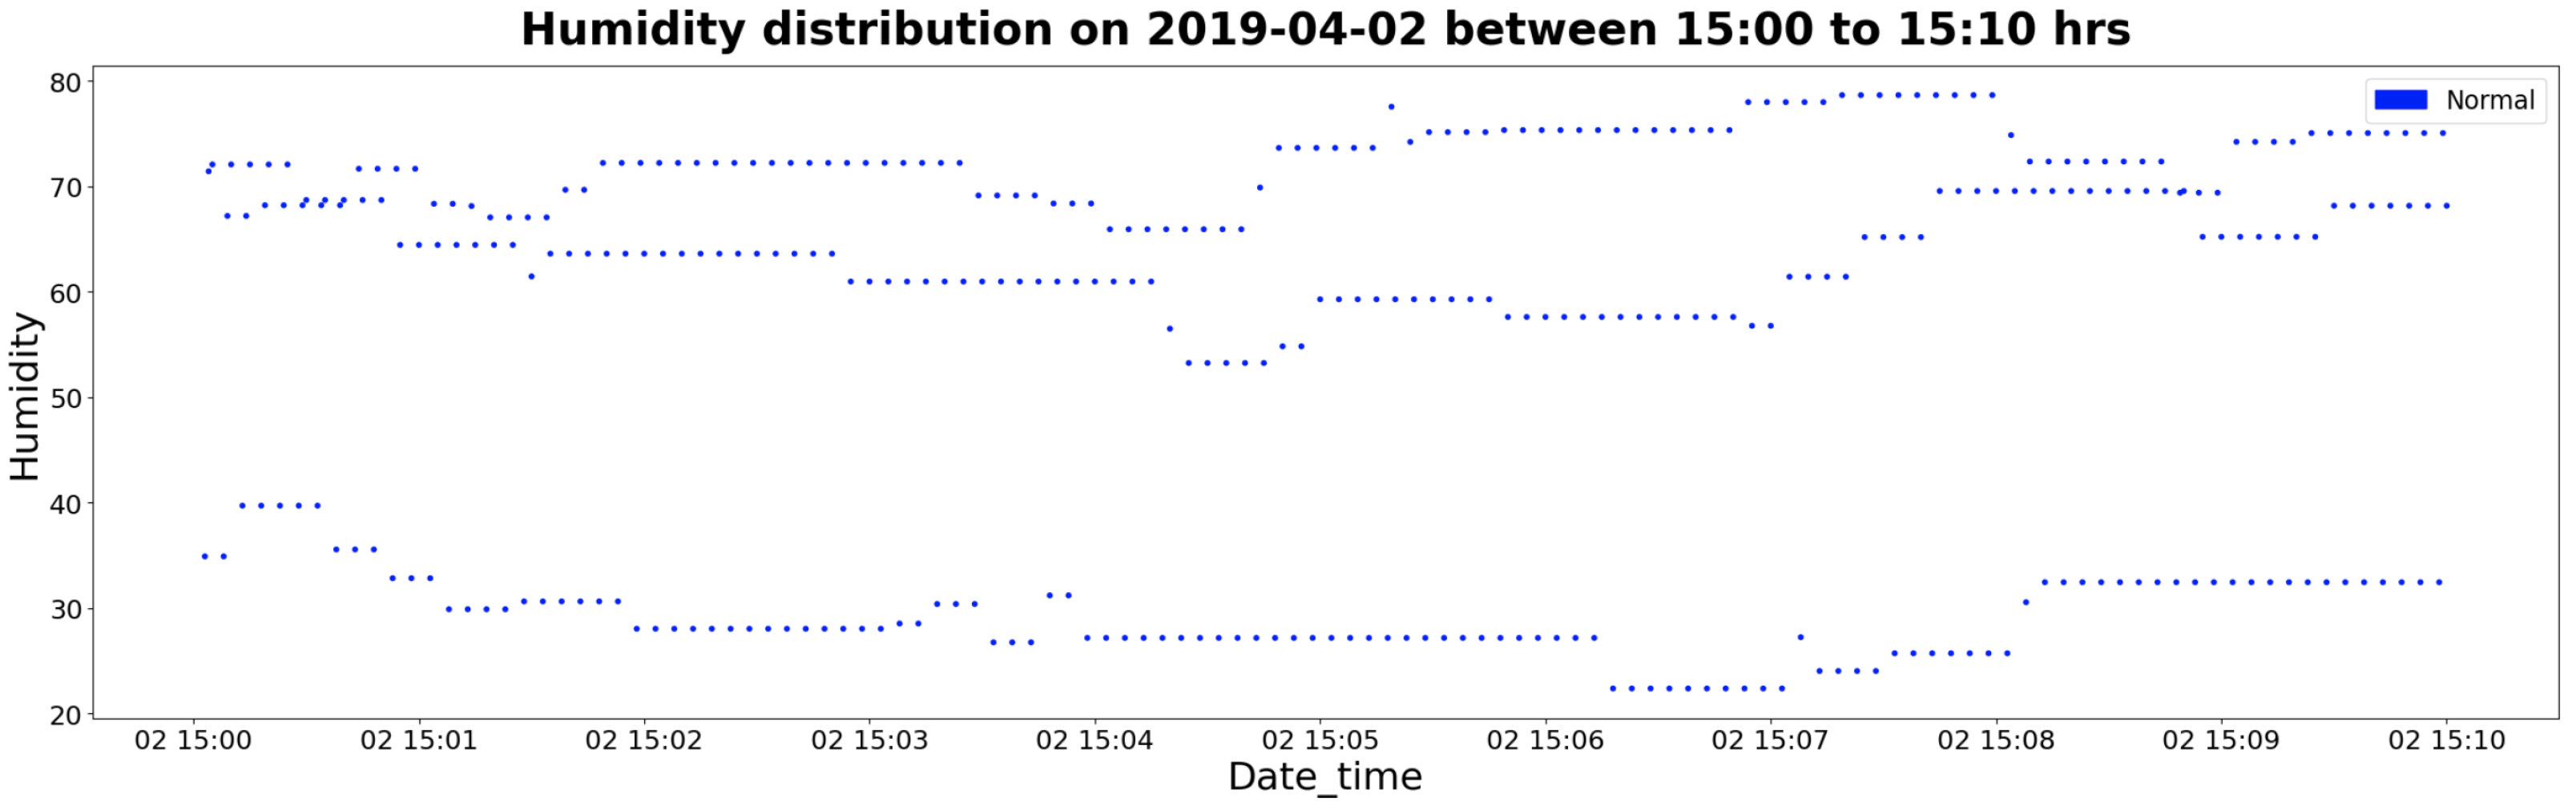
4.3. Normal Agetech Data from ISOT Lab

A temperature sensor that can be used to monitor the temperature in an elderly person’s home as they age in place was set up in the Information Security and Object Technology (ISOT) research lab. This was used to collect normal temperature sensor readings, and in this work, this data are referred to as agetech normal data Figure 8 shows a scatter plot of the agetech normal temperature data on different days.
Having observed the data trends and patterns in the TON_IoT weather data temperature feature, the focus was to replicate these patterns on this agetech normal data to generate agetech attack data. This was performed using different methods outlined in the next section.

5. Proposed Data Generation Methods

In this section, we present four different methods to generate synthetic attack data for agetech and discuss the obtained results.

5.1. Proposed Methods

5.1.1. Method 1: Changing the Pattern of Every Three Elements

In the TON_IoT data, there is a difference in the sequence of data for legitimate and attack scenarios. For instance, in legitimate scenarios, the temperature changes from 48.48 to 42.32, then to 35.51 and back to 48.98; it decreases gradually and then increases. When there is an attack, for example, the temperature changes from 46.4920 to 46.9990, then to 40.4164 and back to 46.70. There is some sort of duplicate and then a drastic drop.
Checking more attack examples shows that there is a similar pattern for every three elements on the list. For example, in some cases, the temperature changes from 46.7055 to 46.6044, and then to 40.3269, or from 47.1682 to 46.7616, and then to 40.4317. In another case, the temperature goes from 46.7256 to 46.4768, and then to 40.8577. From the above consideration, it can be noted that, for the TON_IoT data, there is a pattern in the values, where, for every three elements, the first two elements are almost the same with a slight difference of about −0.1 to 0.5, then the third value goes up from the second element by about 6.1771. This data pattern for an attack scenario was replicated in the agetech data to generate attack data.
Figure 9 shows the normal agetech data over a time period of 1 h. One hour was considered for better visibility when plotting and the scatter plot records only consist of blue color because they are all normal readings. Figure 10 shows the attack data generated by changing the pattern of every three elements as explained. The scatter plot consist of red color referring to the attack records and blue color referring to normal readings. As per the scatter plot, it can be observed that this generated attack data have a different pattern from the benign data.

5.1.2. Method 2: Using the Difference Borrowed from TON_IoT Data

A total of 350 samples on a day with benign records and 350 records on a day when attacks happen within the same time range were selected from the TON_IoT data, and the difference between the temperature of a day with normal readings and a day with attack readings was computed. This difference was applied to 350 samples of agetech data to create attack data of a similar pattern. In summary, this is explained as follows:
1.
From TON_IoT data: n o r m a l d a t a a t t a c k d a t a = d i f f e r e n c e
2.
On agetech data: n o r m a l d a t a d i f f e r e n c e = a t t a c k d a t a
Figure 11 shows a sample of 350 records from normal agetech data. Figure 12 shows the attack data generated by applying the difference borrowed from TON_IoT data. It can be observed that there is a clear difference in the data pattern of the generated attack data.

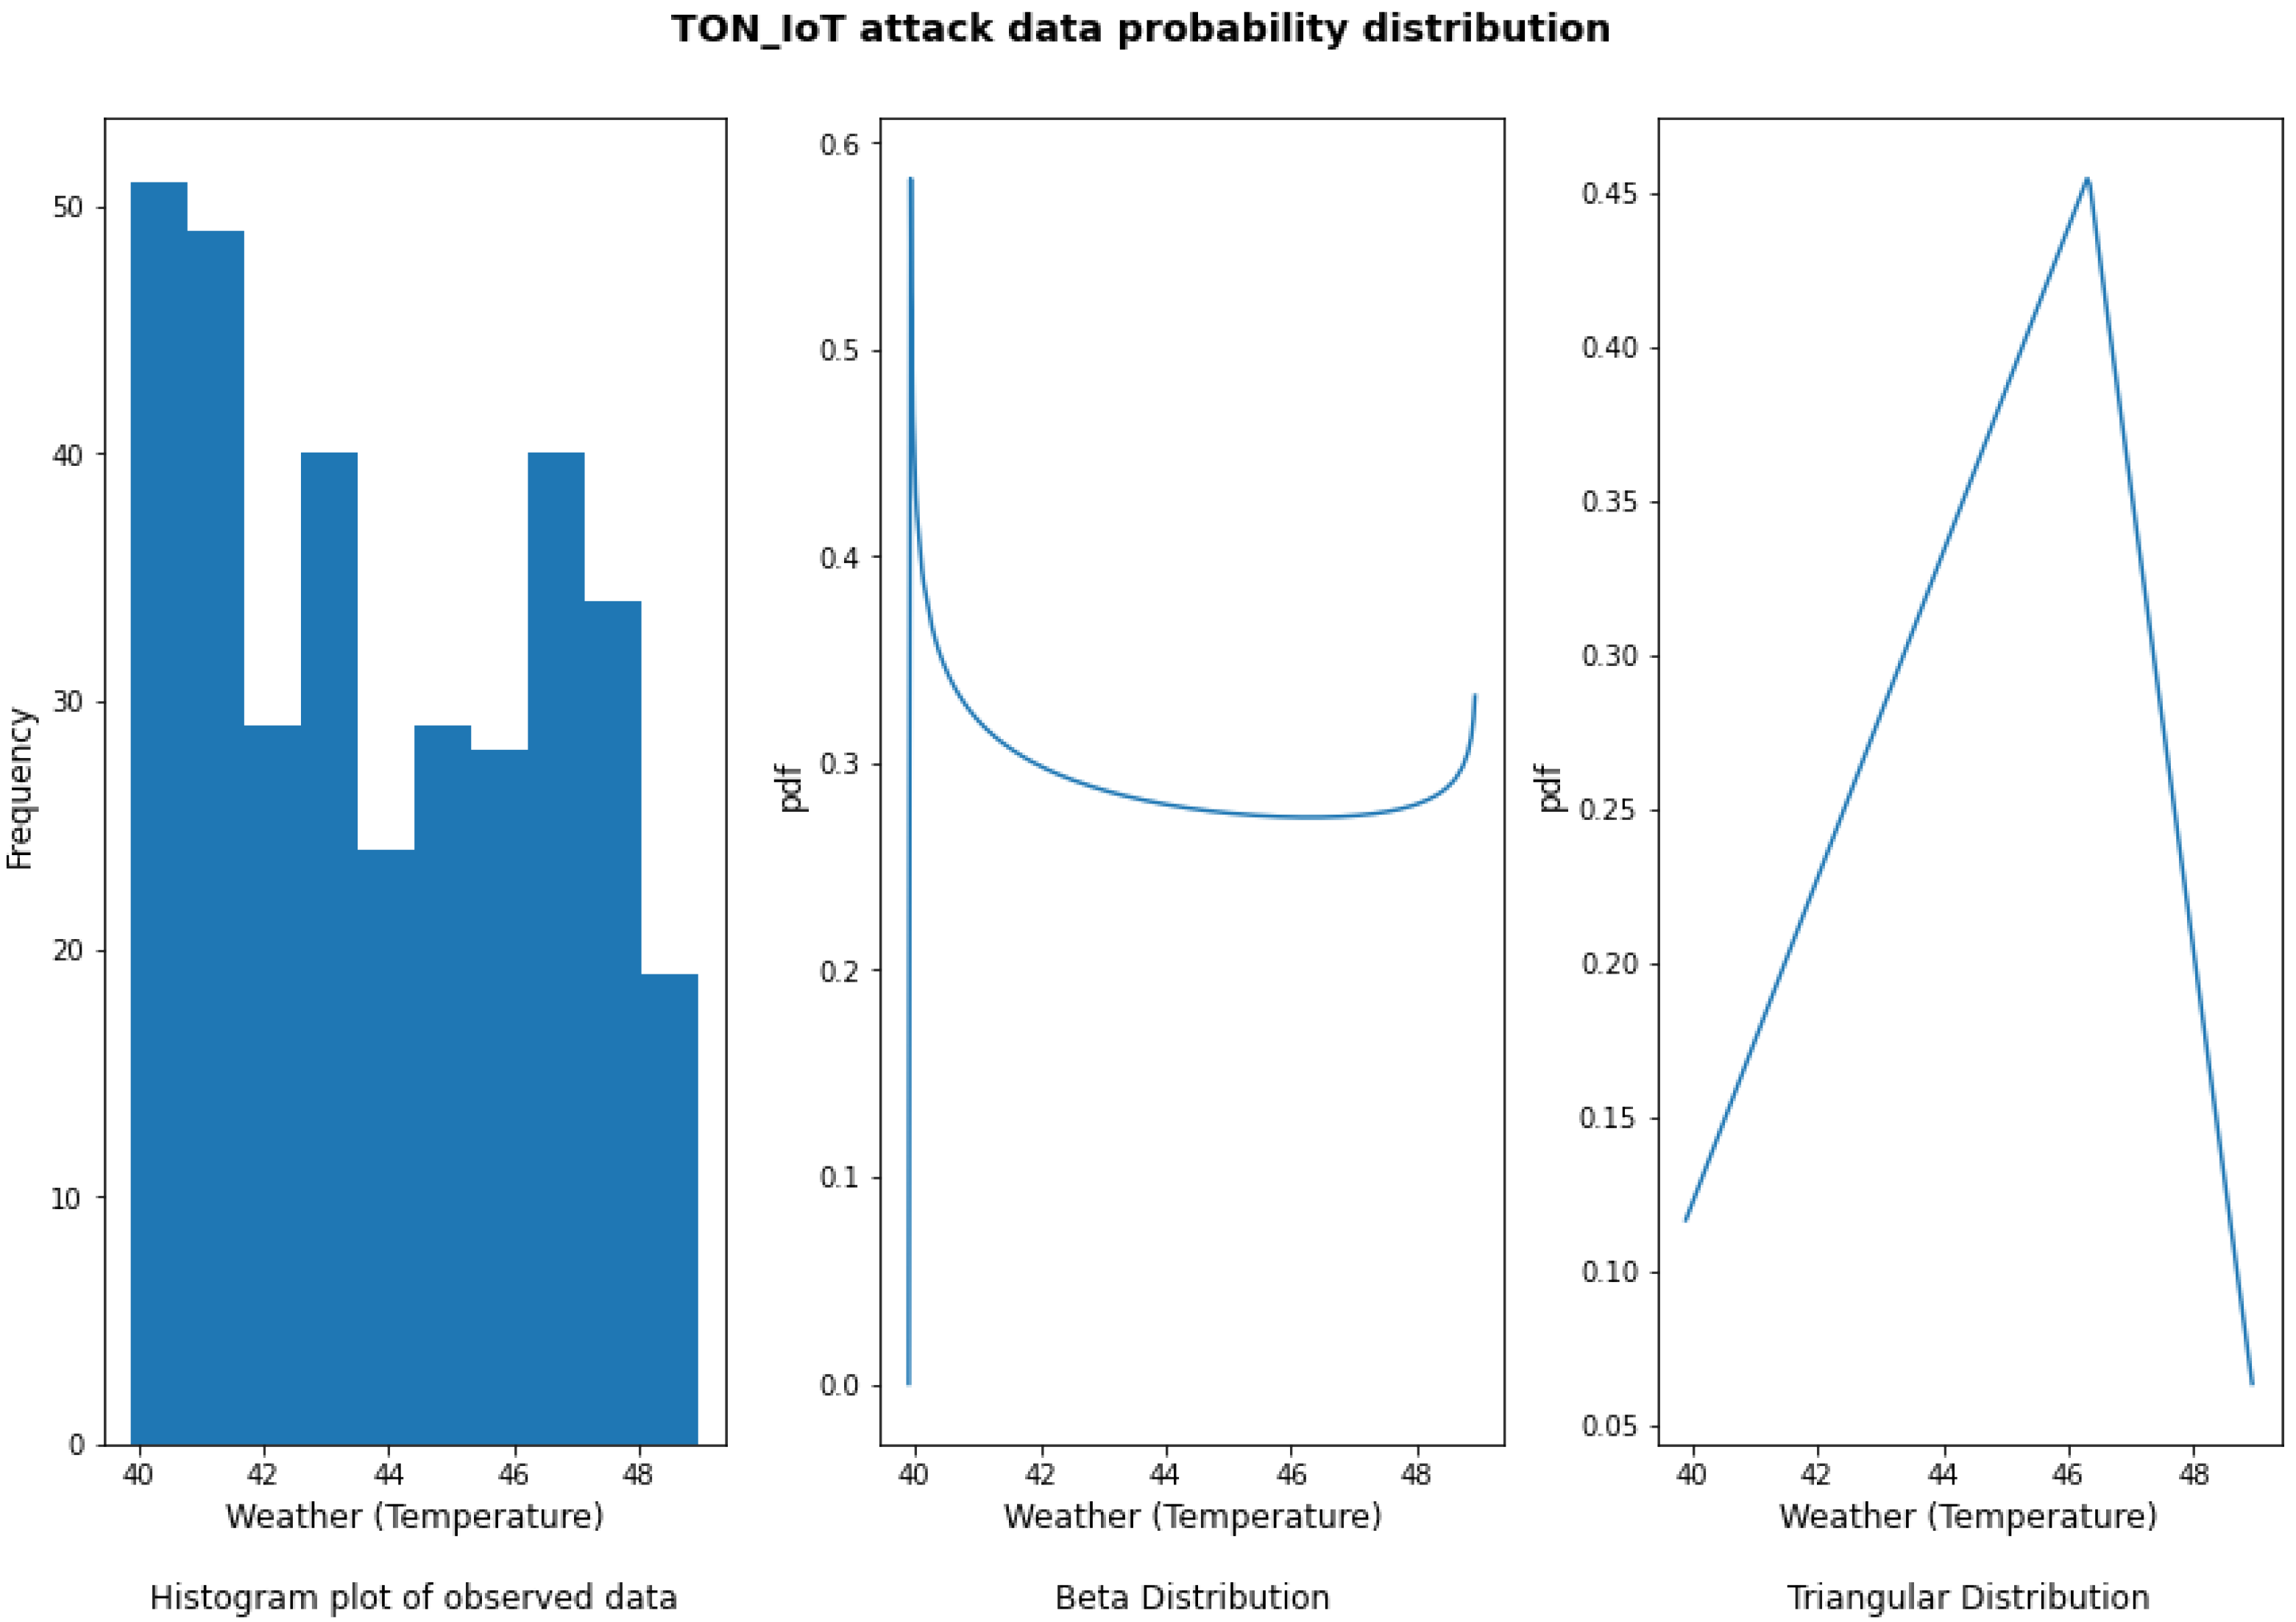
5.1.3. Method 3: Using Probability Distribution

The TON_IoT temperature data were evaluated to determine a probability distribution that has the highest goodness of fit on normal and attack data based on chi square value.
Figure 13 depicts the TON_IoT temperature normal data probability distribution. The beta distribution had the lowest chi square value and, hence, the best goodness of fit.
Figure 14 shows the TON_IoT temperature attack data probability distribution. The beta distribution had the lowest chi square value and, hence, the best goodness of fit.
Figure 15 shows the probability distribution for the agetech temperature normal data. The weibull_max distribution had the lowest chi square value and, hence, the best goodness of fit.
It was observed that the probability distribution with the highest goodness of fit for TON_IoT normal temperature data was different for the agetech normal temperature data, and therefore it is difficult to replicate the data pattern based on probability distribution, especially when the datasets have different distributions. Moreover, the probability distribution does not carry information about time, which is an important factor for these datasets, especially in simulating attack patterns. Therefore, another consideration was to look into using time series generative adversarial networks (TimeGAN), which are generative adversarial networks (GAN) that consider the timestamp information [18,19].

5.1.4. Method 4: Using the Probabilistic AutoRegressive (PAR) Model

There are different TimeGAN models. In this study, the PAR model was implemented. PAR is used to learn multivariate time series data and generate time series data that have the same properties and format as the learned ones [20]. It takes a long time to train the model and generate data; therefore, a subset of the agetech temperature data consisting of the first 10,000 records was used to train the model and generate as a result 10,000 synthetic records.
Figure 16 shows a scatter plot of 10,000 records from normal agetech data. Figure 17 shows the attack data generated by applying the PAR model to generate synthetic records that appear different from normal agetech data.

5.2. Data Validation

The data obtained using Method 1 and Method 2 were further analyzed. Each dataset consists of 2500 samples with approximately 14% of the dataset being attack records. The data were split into training and test datasets in a stratified manner, then used to train and test different machine learning models. The machine learning models implemented include Random Forest, K-Nearest Neighbor (KNN), eXtreme Gradient Boosting (XGBoost), Light Gradient Boosting Machine (LightGBM), and Categorical Boosting (CatBoost) classifiers. We explored many machine learning methods but these are the ones that achieved the best performance. The models were evaluated by computing two performance metrics, namely, accuracy and F-beta score. Accuracy is a commonly used metric for classification problems, but considering that the datasets are imbalanced, F-beta score is a better measure of performance and also it particularly penalizes more a misclassification error where an attack record is marked to be benign, minimizing false negatives. Table 2 shows the performance metrics for the dataset obtained using Method 1.
From Table 2, it can be observed that all models have a high accuracy score, which means there were few misclassified records. K-Nearest Neighbor has the highest F-beta score and is thus a better classifier for benign and malicious temperature sensor records for this dataset compared to the other models. Table 3 shows the performance metrics for the dataset generated using Method 2.
From Table 3, it can be noted that, for this dataset, the CatBoost classifier achieved the highest F-beta score. It has an F-beta score of 0.9855, which indicates that it was able to classify most of the records properly. Moreover, all the accuracy scores are high, indicating that there are a few misclassification errors but the models performed well.

5.3. Discussion

Four methods were explored to generate synthetic agetech attack data. Methods 1, 2, and 4 all provide attack data that, from the scatter plot and their trends, are evidently different from normal data. The generated attack data are actually abnormalities or anomalies that could be either due to actual attacks or caused by faulty devices. This is a well-known issue in security anomaly detection. However, because particularly methods 1 and 2 replicate the attack patterns from a general IoT dataset, there is a greater level of trust that the generated attack records reflect a real attack.

6. Conclusions

Ensuring robust security and privacy in agetech is crucial because of the projected increase of elderly people and use of smart devices as years go by. Agetech attack data can be very resourceful in learning cyber breaches and building systems for defense and the mitigation of negative impacts. Given the scarcity of such data, we have presented different methods for generating agetech synthetic attack data. This work was able to replicate temperature sensor attack data patterns from the TON_IoT data into agetech benign data. The generated agetech attack datasets were trained using machine learning models, which achieved good classification performance in predicting whether a sample is benign or malicious. Particularly the KNN model and CatBoost model achieved the best classification performance for the first and second synthetic attack datasets, respectively. An area of future research is to come up with more methods to generate and validate synthetic attack data because, from our search, there are limited studies that explore this area.

Author Contributions

Conceptualization, N.K. and I.T.; methodology, N.K. and I.T.; formal analysis, N.K.; investigation, N.K. and I.T.; resources, N.K., I.T. and M.M.; data curation, N.K.; writing—original draft preparation, N.K.; writing—review and editing, I.T. and M.M.; visualization, N.K. and I.T.; supervision, I.T. and M.M. All authors have read and agreed to the published version of the manuscript.

Funding

This project was supported in part by collaborative research funding from the National Research Council of Canada’s Aging in Place Program. Grant number: AiP-032.

Data Availability Statement

Data will be provided upon request.

Conflicts of Interest

The authors declare no conflict of interest.

References

  1. World Health Organization. Ageing and Health; World Health Organization: Geneva, Switzerland, 2022; Available online: https://www.who.int/news-room/fact-sheets/detail/ageing-and-health (accessed on 5 January 2023).
  2. Yamauchi, M.; Ohsita, Y.; Murata, M.; Ueda, K.; Kato, Y. Anomaly detection for smart home based on user behavior. In Proceedings of the 2019 IEEE International Conference On Consumer Electronics (ICCE), Las Vegas, NV, USA, 11–13 January 2019; pp. 1–6. [Google Scholar]
  3. Chimamiwa, G.; Alirezaie, M.; Pecora, F.; Loutfi, A. Multi-sensor dataset of human activities in a smart home environment. Data Brief 2021, 34, 106632. [Google Scholar] [CrossRef] [PubMed]
  4. Carnemolla, P. Ageing in place and the internet of things—How smart home technologies, the built environment and caregiving intersect. Vis. Eng. 2018, 6, 7. [Google Scholar] [CrossRef]
  5. Khaemba, N.; Traoré, I.; Mamun, M. Security and Privacy of IoT Devices for Aging in Place. In Artificial Intelligence for Cyber-Physical Systems Hardening; Springer International Publishing: Cham, Switzerland, 2023; pp. 181–201. [Google Scholar]
  6. Zhou, W.; Cao, X.; Li, X.; Sha, Y.; Chen, J.; Yan, Y.; Liu, X.; Kong, X. Attack sample generation algorithm based on dual discriminant model in industrial control system. J. Phys. Conf. Ser. 2021, 1828, 012123. [Google Scholar] [CrossRef]
  7. Pham, T.; Nguyen, Q.; Nguyen, X. Generating artificial attack data for intrusion detection using machine learning. In Proceedings of the Fifth Symposium On Information And Communication Technology, Hanoi, Vietnam, 4–5 December 2014; pp. 286–291. [Google Scholar]
  8. Belenko, V.; Krundyshev, V.; Kalinin, M. Synthetic datasets generation for intrusion detection in VANET. In Proceedings of the 11th International Conference On Security Of Information And Networks, Cardiff, United Kingdom, 10–12 September 2018; pp. 1–6. [Google Scholar]
  9. Sourav, S.; Chen, B. Distort to Detect, not Affect: Detecting Stealthy Sensor Attacks with Micro-distortion. In Proceedings of the 2021 IEEE International Conference On Communications, Control, And Computing Technologies For Smart Grids (SmartGridComm), Control, Aachen, Germany, 25–28 October 2021; pp. 412–418. [Google Scholar]
  10. Mahak, M.; Singh, Y. Threat modelling and risk assessment in internet of things: A review. In Proceedings of the Second International Conference On Computing, Communications, and Cyber-Security: IC4S 2020, Ghaziabad, India, 3–4 October 2020; pp. 293–305. [Google Scholar]
  11. What Is an IoT Device Vulnerability? Available online: https://www.fortinet.com/resources/cyberglossary/iot-device-vulnerabilities (accessed on 5 January 2023).
  12. Srihith, I.; Donald, A.; Srinivas, T.; Anjali, D.; Chandana, A. Firmware Attacks: The Silent Threat to Your IoT Connected Devices. Int. J. Adv. Res. Sci. Commun. Technol. (IJARSCT) 2023, 3, 145–154. [Google Scholar] [CrossRef]
  13. Rizvi, S.; Kurtz, A.; Pfeffer, J.; Rizvi, M. Securing the internet of things (IoT): A security taxonomy for IoT. In Proceedings of the 2018 17th IEEE International Conference On Trust, Security And Privacy In Computing And Communications/12th IEEE International Conference On Big Data Science And Engineering (TrustCom/BigDataSE), New York, NY, USA, 1–3 August 2018; pp. 163–168. [Google Scholar]
  14. Kröger, J. Unexpected inferences from sensor data: A hidden privacy threat in the internet of things. In Internet Of Things. Information Processing in An Increasingly Connected World: First IFIP International Cross-Domain Conference, IFIPIoT 2018, Held at The 24th IFIP World Computer Congress, WCC 2018, Poznan, Poland, 18–19 September 2018; Revised Selected Papers 1; Springer: Cham, Switzerland, 2019; pp. 147–159. [Google Scholar]
  15. Gangolli, A.; Mahmoud, Q.; Azim, A. A systematic review of fault injection attacks on IOT systems. Electronics 2022, 11, 2023. [Google Scholar] [CrossRef]
  16. Zahra, S.; Chishti, M. Ransomware and internet of things: A new security nightmare. In Proceedings of the 2019 9th International Conference On Cloud Computing, Data Science & Engineering (Confluence), Uttar Pradesh, India, 10–11 January 2019; pp. 551–555. [Google Scholar]
  17. Moustafa, N. The TON_IoT Datasets|UNSW Research. 2019. Available online: https://research.unsw.edu.au/projects/toniot-datasets (accessed on 5 January 2023).
  18. Gulrajani, I.; Ahmed, F.; Arjovsky, M.; Dumoulin, V.; Courville, A. Improved training of wasserstein gans. In Proceedings of the Advances In Neural Information Processing Systems, Long Beach, CA, USA, 4–9 December 2017; Volume 30. [Google Scholar]
  19. Hu, W.; Tan, Y. Generating adversarial malware examples for black-box attacks based on GAN. arXiv 2017, arXiv:1702.05983. [Google Scholar]
  20. PAR Model. 2018. Available online: https://sdv.dev/SDV/user_guides/timeseries/par.html (accessed on 5 January 2023).
Figure 1. Labels of temperature records across different days.
Jcp 03 00033 g001
Figure 2. Benign temperature records on 2 April 2019 for a time period of 10 min.
Jcp 03 00033 g002
Figure 3. Attack temperature records on 25 April 2019 for a time period of 10 min.
Jcp 03 00033 g003
Figure 4. Line plot of benign temperature records on 2 April 2019 over a period of 10 min.
Jcp 03 00033 g004
Figure 5. Line plot of attack temperature records on 25 April 2019 over a period of 10 min.
Jcp 03 00033 g005
Figure 6. Benign humidity records on 2 April 2019 over a time range of 10 min.
Jcp 03 00033 g006
Figure 7. Attack humidity records on 25 April 2019 over a time range of 10 min.
Jcp 03 00033 g007
Figure 8. Agetech normal data from ISOT lab—temperature over different days.
Jcp 03 00033 g008
Figure 9. Agetech normal data—temperature over 1 h.
Jcp 03 00033 g009
Figure 10. Agetech variation attack data—temperature over 1 h generated by changing the pattern of every 3 elements.
Jcp 03 00033 g010
Figure 11. Agetech data—350 records of normal temperature.
Jcp 03 00033 g011
Figure 12. Agetech diff-attack data—350 records of generated attack temperature.
Jcp 03 00033 g012
Figure 13. TON_IoT benign temperature data fitted on different probability distributions.
Jcp 03 00033 g013
Figure 14. TON_IoT attack temperature data fitted on different probability distributions.
Jcp 03 00033 g014
Figure 15. Agetech benign temperature data fitted on different probability distributions.
Jcp 03 00033 g015
Figure 16. Agetech normal data—first 10,000 records.
Jcp 03 00033 g016
Figure 17. Agetech synthetic records generated by PAR—10,000 records.
Jcp 03 00033 g017
Table 1. Threat model for agetech devices.
VulnerabilityPossible AttackExploitImpactMitigation
Weaknesses in services and protocols running on IoT device, faulty secure sockets layer (SSL) configurationMan-in-the-middle (MITM) attack/Eavesdropping attackHacker intercepts and sends data or modifies previously sent dataIncorrect sensor records, disrupt normal function, spy or cause harm to the userStrong encryption of communication
Default or easy passwordsPassword attack (Brute force attack)Attackers can guess passwords and gain access to deviceModify the device to whatever they want or destroy itUse strong passwords especially passphrases
Insecure default settings and update mechanisms [11]Firmware attackHacker cracks encryption keys or passwords used to secure firmware, Corrupt updates to compromise deviceLoss of data, Device control, Malware installation, Physical damage of device, Attacker can maintain access to device for long because they are difficult to detect, Connected devices turned into bots [12]Monitor the network for any suspicious activity, use strong passwords and keep firmware up to date
Insufficient sanitization of data input in the web interfaceCross-site scripting (XSS) attackExecuting of a malicious script through the web browser of the userAttacker can hijack the user’s session and cause distributed denial of service (DDoS) [13]Data validation of all input
Hidden sensors encapsulated in smart devices that do not need access permission unlike cameras, microphones and Global Positioning System (GPS), and these allow for covert surveillance of the person using the device [14]Keystroke inferenceDetermine keyboard and touchscreen inputs based on accelerometer data, gyroscope data, micro-motions and ambient-light sensorsCompromise entire technological ecosystem of the user when sensitive information like location, activities or passwords are leaked through embedded sensorsClassify disregarded types of sensor data like data about motion and light as sensitive by default so that it can be properly protected
Logic blocks weaknesses that can be tampered with, secure boot and flash encryption that can be bypassedFault injection attackIntroduces glitches like electromagnetic injection, clock glitching and voltage glitching into the device hardware, causing abnormal behavior of the software [15]Can disrupt the functioning of the system, negatively affect device drivers, change the behavior of application software and access control softwareMake use of software vulnerability detection tools and employ multi-layer protection
Unsecured query entry fieldStructured Query Language (SQL) injectionAttacker inputs an SQL query that consists of a valid request and malicious request that are also executed [13]Can lead to privilege escalations and access to what they are not authorized toInput validation and sanitization of code
Misconfigured IoT devicesDenial of Service (DoS) and Distributed Denial-of-Service (DDoS)Use of a botnet to send many requests that overwhelms the device such that it can’t perform its normal functionsThe device jams and becomes unusable or gets damagedHave systems in place for automatic detection and filtering of malicious activity
Poorly designed or older software without proper validation of the size or format of the input it receivesBuffer overflow attackAttacker sends an amount of data that is larger than the temporary data storage area causing the excess data to overwrite other parts of the program’s memoryAttacker can execute malicious code or take control of the systemEnsure there is proper input validation
Device lacks capability to check and verify what is being executed, device not secured with efficient security protocolsRansomware attackMalware can be stored in for example the wallpapers of a thermostat and once the user clicks on it, the attacker gains control of the system and tricks customer to send them money or gift card [16]Attacker can control the operation of the device. Also they could gain access to other IoT devices connected to the same networkAvoid clicking on suspicious links, always update device firmware, restrict permissions on IoT device, employ multi-layer protection
Table 2. Agetech_temp_elements_var_attack dataset (Method 1) metrics.
ModelAccuracyF-Beta Score
Random Forest0.98600.7593
KNN0.98200.9402
XGBoost0.93400.7593
LightGBM0.98400.8824
CatBoost0.95200.8286
Table 3. Agetech_temp_diff_attack dataset (Method 2) metrics.
ModelAccuracyF-Beta Score
Random Forest0.98600.9357
KNN0.97600.8754
XGBoost0.98600.9357
LightGBM0.99400.9738
CatBoost0.99400.9855
Disclaimer/Publisher’s Note: The statements, opinions and data contained in all publications are solely those of the individual author(s) and contributor(s) and not of MDPI and/or the editor(s). MDPI and/or the editor(s) disclaim responsibility for any injury to people or property resulting from any ideas, methods, instructions or products referred to in the content.

