
Efficacy of 15 nm Gold Nanoparticles for Image-Guided Gliosarcoma Radiotherapy

1
Centre for Medical Radiation Physics, University of Wollongong, Wollongong, NSW 2522, Australia
2
Australian Nuclear Science and Technology Organisation (ANSTO), Australian Synchrotron, Clayton, VIC 3168, Australia
3
Prince of Wales Hospital, Randwick, NSW 2031, Australia
*
Author to whom correspondence should be addressed.
J. Nanotheranostics 2023, 4(4), 480-495; https://doi.org/10.3390/jnt4040021
Submission received: 1 October 2023
/
Revised: 19 October 2023
/
Accepted: 20 October 2023
/
Published: 26 October 2023
(This article belongs to the Special Issue Emerging Strategies in Nanomedicine)
Abstract
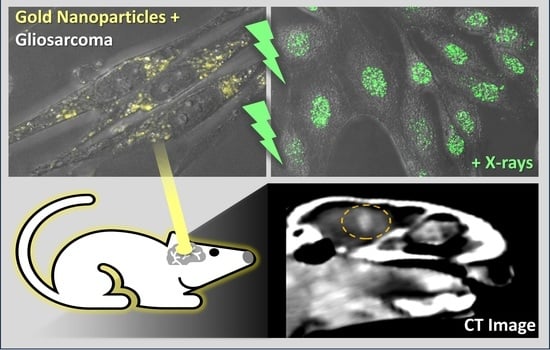
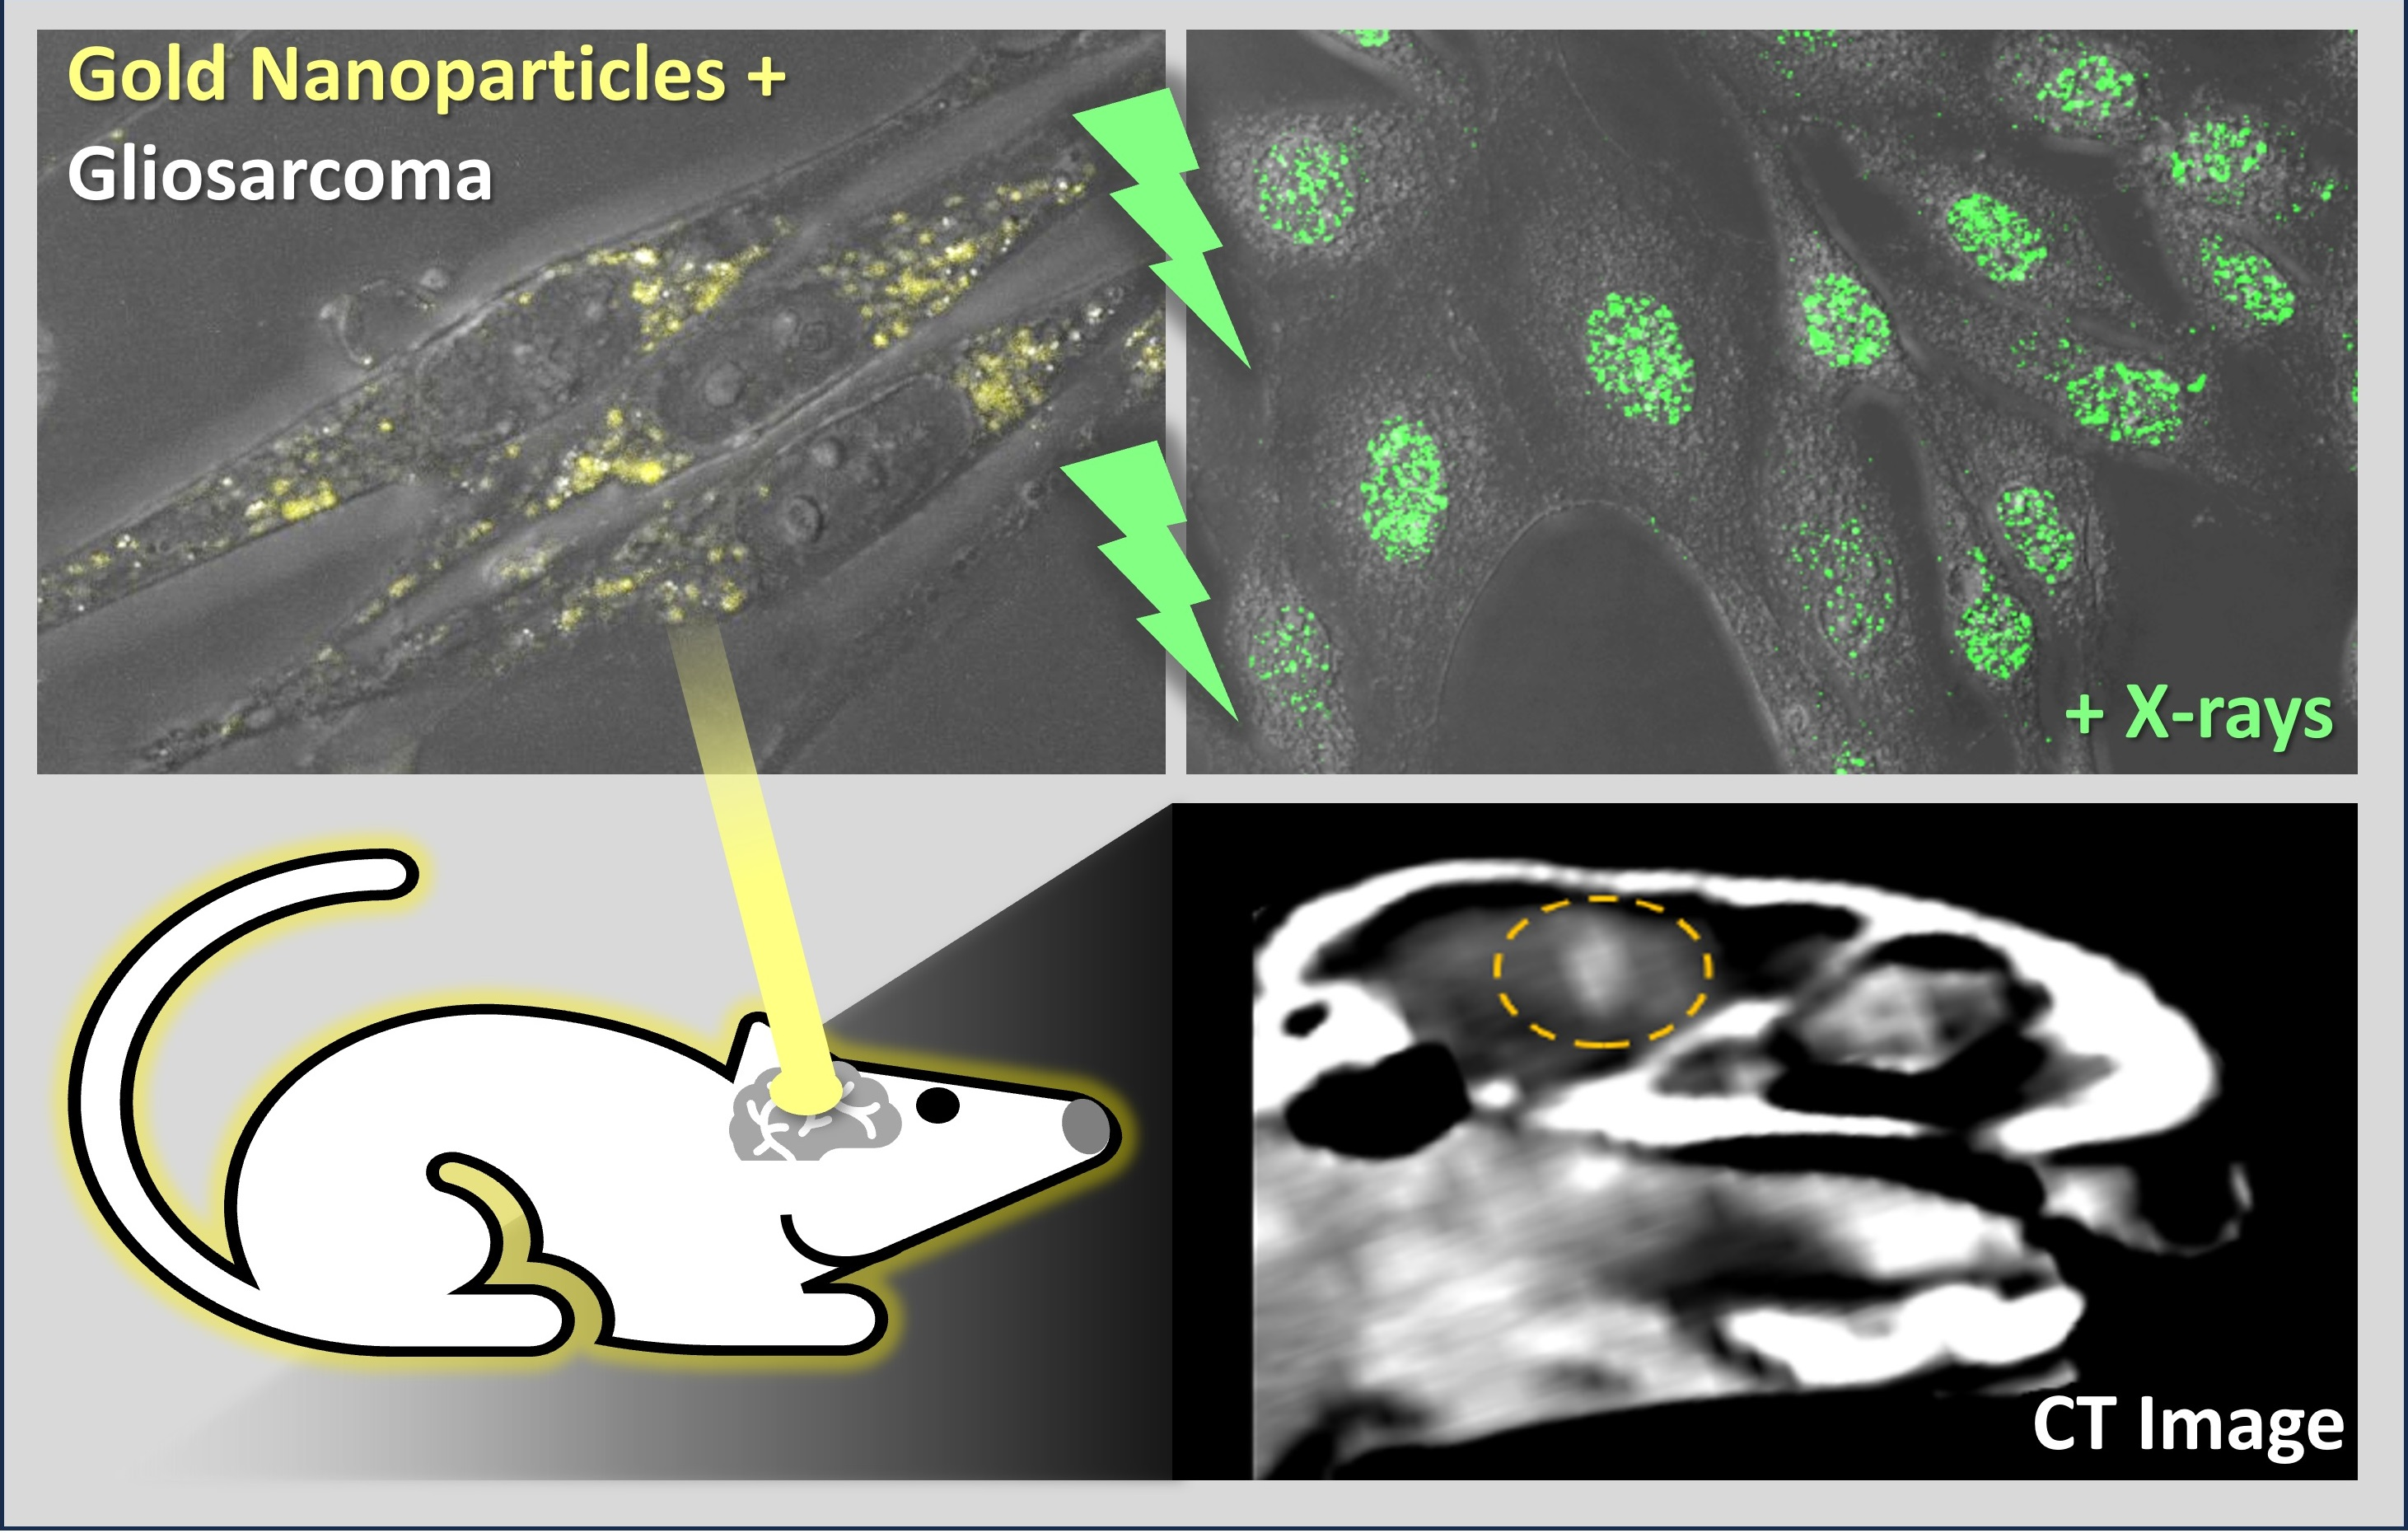
:Targeted brain cancer treatments are sorely needed to improve long-term prognosis, particularly for gliosarcoma and glioblastoma patients. Gold nanoparticles (GNPs) have unique properties including high atomic number, biocompatibility, and small size for cancer cell internalization. GNPs are consequently an ideal candidate for improved cancer targeting using image-guided radiotherapy. This work investigated 15 nm AuroVistTM GNPs for image-guided gliosarcoma radiotherapy and identified optimum GNP concentrations. The GNPs were found to be 15–20 nm using optical surface plasmon resonance absorption, with a (41.3 ± 0.3) nm hydrodynamic diameter. Confocal imaging showed that 50–500 µg/mL of the GNPs was well-internalized into the 9L cells within 24–48 h. γ-H2AX assays showed that 50–500 µg/mL of the GNPs radiosensitized the 9L cells irradiated with 125 and 150 kVp X-rays. However, only 500 µg/mL of the GNPs produced significant long-term dose enhancement with 150 kVp X-rays (with a sensitization enhancement ratio at 10% survival of 1.43, and 1.13 with 50 µg/mL) using clonogenic assay. CT imaging of the GNPs in the 9L tumors in Fischer rats further showed that GNP concentrations above 500 µg/mL were required to distinguish the tumor from the brain, and the GNPs were detected 48 h after injection. These promising results indicate that the GNPs can be used for selective gliosarcoma treatment with image-guided X-ray radiotherapy at concentrations above 500 µg/mL.
1. Introduction
The limiting factor in cancer control is normal tissue toxicity. Cancer treatments become challenging due to tumor location near or within sensitive tissue, and inherent resistance of tumor cells to radiation and chemotherapy. Glioblastoma multiforme and gliosarcomas are radiation-resistant brain cancers with poor long-term survival outcomes (just 2 years, and 6 months, respectively); and unfortunately, this statistic has not changed over the last 30 years [1]. Despite optimized cancer treatment regimens using chemotherapy, surgery, and radiotherapy, multiple difficulties are faced including low detection rates, risk to healthy brain tissue, chemical and radiation resistances, high quality of life impact, and high probabilities of cancer recurrence [2].
Improved cancer control with targeted treatments that simultaneously preserve healthy tissue is sorely needed to improve the outlook for gliosarcoma and glioblastoma treatment. Recent advances in nanomedicine present a more selective means of cancer treatment. Nanoparticles can be used as vehicles for chemotherapeutics [3] and as radiation sensitizers during radiotherapy [4,5]. This is primarily due to their high permeability and retention in cancer cells coupled with uniquely engineered properties designed to enhance cancer treatment. For radiotherapy, nanoparticles are designed to have sizes < 100 nm for cancer cell internalization and a high atomic number (Z) for high X-ray absorption, production of secondary electrons in excess, inducing oxidative stress, and damaging cellular components to destabilize cancer cells [4,5,6,7,8].
Gold nanoparticles (GNPs) have been well-studied for radiotherapy enhancement due to their biocompatibility, small sizes (from 100 nm to below 2 nm), and high Z (79). Simulation studies have modeled the interaction of X-rays with GNPs to understand their physical nanoscale and microscopic dose enhancement capability [9,10,11,12,13]; in vitro studies have characterized the uptake [14], cytotoxicity, and radiobiological effects of GNPs on multiple cell lines [13,15,16]; and preclinical studies have shown evidence that GNPs enhance the treatment of tumors using radiotherapy [5,15,17]. The factors that determine effective radiation dose enhancement with GNPs are numerous and include GNP concentration, size, shape, localization and uptake in cells, cell type, and external beam energy [6,9,14,15,18].
The properties that allow GNPs to be useful for radiation dose enhancement also assist in detection of GNPs for X-ray imaging [19]. GNPs have been shown to be useful contrast agents for computed tomography (CT) and micro-CT due to their relatively slow clearance, biocompatibility at high concentrations, and good visualization of highly vascularized regions and tumors [20,21]. GNPs in combination with gadolinium or other paramagnetic substances also allow contrast enhancement for magnetic resonance imaging (MRI) [22], and GNPs can be conjugated with other components for positron emission tomography (PET) and PET-CT [23]. GNPs have also shown that they can scatter and absorb large amounts of light when illuminated in the visible and near-infrared region of the visible spectrum, and their absorbance properties are tunable by changing the GNP size [24,25].
Though many benefits of GNPs have been identified for use in imaging and radiotherapy, clinical trials for GNPs as radiosensitizers have yet to occur. Much of the debate hindering clinical translation concerns the mechanisms of radiosensitization, variability in uptake or retention of GNPs in vivo, and concern over usable concentrations [26]. Other metal-based NPs have reached phase 1 clinical trials with properties for image guidance and radiotherapy [27], and so there may be a pathway for GNPs in the future. In this work, we investigated 15 nm GNPs, which have a promising history for radiotherapy and imaging [5,15,20,21], and we determined the concentrations required for effective image contrast and radiation dose enhancement in vitro and in vivo for gliosarcoma cancer. We show what factors affect the radiation- and image-enhancement with GNPs for image-guided radiotherapy of gliosarcoma in view of clinical transfer.
2. Materials and Methods
AuroVistTM 15 nm diameter GNPs were purchased from Nanoprobes Inc. (Yaphank, NY, USA) in a 200 mg/mL stock solution. The stock was diluted in Gibco® Dulbecco’s phosphate buffered saline (DPBS), without calcium and magnesium ions, to a final concentration of 10 mg/mL or 20 mg/mL depending on use. Prior to use, the GNP solution was vortexed in pulses for 30 s.
2.1. Size Characterization
The hydrodynamic size of the GNPs was measured with dynamic light scattering (DLS) using a Malvern Zetasizer Nano ZS. The Z-average size is comparable with the size measured by other techniques (such as X-ray diffraction) if the sample is spherical or near-spherical in shape, monodispersed, and the sample is prepared in a suitable dispersant. GNPs were diluted to 1 mg/mL in DPBS and 100 µL was added to a U-shaped 96-well plate for analysis using the Zetasizer. Readings were made by the Malvern machine at a temperature of 24.9 °C. Three samples from each well were taken with 10 runs in each.
The Z-average size of the GNPs was extracted from a correlation curve that represented particle dispersion fitted with an exponential function to determine the hydrodynamic diameter using a variation of the Stokes–Einstein equation [28].
Optical characteristics of the GNPs, such as surface plasmon resonance (SPR) and plasmon absorption, have recently gained interest for numerous applications including sensing and cell imaging [24,25]. Plasmons in the GNPs have sizes much smaller than photon wavelength, called localized surface plasmons, such that the plasmon oscillation is distributed over the whole particle volume. Only light with frequency in resonance with the plasmon oscillation excites the localized SPR, and therefore it is a useful indicator of GNP size [25]. To further confirm the individual GNP size, therefore, we investigated the optical absorbance of 0.125–0.635 mg/mL of the GNPs with a SpectraMax® M series plate reader using wavelengths 190–1000 nm.
2.2. Nanoparticle Uptake in 9L Gliosarcoma Cells
9L gliosarcoma (9LGS) cells were acquired from the European Collection of Cell Cultures (ECACC) and cultured in T75 cm2 flasks containing Gibco® Dulbecco’s modified eagle medium (DMEM) supplemented with 10% fetal bovine serum and 1% penicillin and streptomycin. 9LGS cells were incubated at 37 °C and 5% (v/v) CO2. Prior to GNP addition or radiotherapy, 9LGS cells were sub-cultured into T12.5 cm2 flasks (BD FalconTM) containing 5 mL of supplemented DMEM.
GNPs were added to 9LGS cells in T12.5 cm2 flasks at concentrations of 50 µg/mL or 500 µg/mL and incubated for 24 h or 48 h. To determine the uptake of the GNPs into the 9LGS cells, we used laser light scatter to detect the particles in two methods.
First, fluorescence-activated cell sorting (FACS) was considered to utilize laser light to detect the size of cells and scatter from internal cellular components. Cell side scatter (SSC) was used to estimate the GNP content. After incubation with the GNPs, cells were washed with DPBS, trypsinized, and harvested before centrifuging at 380 g for 5 min at room temperature. The cells were then washed twice with DPBS before resuspension in DPBS at a concentration of 106 cells/mL. Only the GNPs inside the cells are assumed to remain after these wash steps. A Becton Dickinson flow cytometer (BD Fortessa; BD Biosciences, USA) was then used to analyze the cell samples. Forward scatter (FSC) and SSC of cells with and without the GNPs were recorded. A laser wavelength of 488 nm was used. The data were analyzed using BD FACSDivaTM Software 8.0.
The second light scatter method allows visualization of the GNP congregation in cells using confocal imaging with laser light (similar to the method described in Kim et al. [29]). Cells were cultured in ibidi® 8-well µ-slides. GNPs were added to each cell 24 h prior to imaging in concentrations of 50 µg/mL and 500 µg/mL.
A Leica TCS SP5 confocal microscope was used to image live cells following incubation with or without the GNPs. The µ-slide was imaged with a 40× or 63× oil immersion objective lens and illuminated with a 20 mW argon laser at 488 nm to induce light scatter from the sample. Light was detected using a photomultiplier in the range of 498–550 nm. Bright field images were also collected.
2.3. Cell Irradiation with Gold Nanopartilces
The irradiation of the 9LGS cells with and without the GNPs was performed at the Prince of Wales Hospital (Randwick, New South Wales, Australia 2031) using a Nucletron Oldelft Therapax DXT 300 Series 3 Orthovoltage X-ray machine (Nucletron B.V., Veenendaal, The Netherlands).
T12.5 cm2 flasks or µ-slides containing the 9LGS cells were loaded with the GNPs 24 h before irradiation in 50 µg/mL or 500 µg/mL concentrations. The monolayer of the 9LGS cells was at 6 mm depth in growth medium on a solid water phantom for irradiation. The phantom was 50 cm from the X-ray source and in full particle equilibrium. X-rays were generated using a tube potential of 125 kVp or 150 kVp, with a beam current of 20 mA, and using inherent filtration of 3 mm Be, 0.35 mm Cu and 1.5 mm Al for 150 kVp, and 0.1 mm Cu and 2.5 mm Al for 125 kVp. Cells were irradiated with a dose rate at cell depth of 0.754 Gy/min and 0.785 Gy/min for 150 kVp and 125 kVp, respectively, and doses ranging from 1 to 8 Gy were used.
Following the irradiation, cells from T12.5 cm2 flasks were seeded into 100 mm Petri dishes containing 10 mL of supplemented DMEM and incubated for 3 weeks (14 doubling times) for clonogenic assay survival. Each independent flask was seeded in triplicate sets corresponding to each treatment. Dishes were stained with a crystal violet solution (2.3% crystal violet, 0.1% ammonium oxalate, 20% ethyl alcohol from Sigma Aldrich®), after washing with DPBS (with calcium and magnesium ions). The plating efficiency was determined from the surviving colonies divided by the initial number seeded, and survival was evaluated by taking the ratio of the treated samples plating efficiency with the plating efficiency of the control.
Cells in µ-slides were put on ice 15 min after irradiation to prevent further DNA damage repair and obtained only the effect of short-term DNA damage mechanisms. The cells were then fixed with 100% ice-cold methanol for 20 min and washed with ice-cold DPBS three times. The cells were treated twice with blocking solution of 3% bovine serum albumin (BSA) in DPBS. A primary antibody (Mouse anti-phospho-Histone H2AX, at Ser139 clone JBW301) was added 1:500 in 1% BSA DPBS to the cells and incubated for 2 h. The cells were washed with DPBS to remove the primary antibody before the secondary antibody (goat anti-Mouse IgG1 Cross-Absorbed, Alexa Fluor 488) was added 1:500 in 1% BSA DPBS and incubated for 1 h in darkness. Lastly, the cells were washed in DPBS and imaged with the Leica TCS SP5.
Confocal images were acquired with a 40× or 63× oil immersion lens. A xenon laser with wavelength 488 nm exposed the cells for γ-H2AX detection. Light was detected using a photomultiplier in the range of 510–600 nm. Bright field images were also collected.
Cell images were analyzed in Fiji [30]. The foci average per cell was counted over the total cell population over the entire height span of the cell nucleus (15.74 µm) in 26 slices.
2.4. Gold Nanoparticle Contrast in Computed Tomography
To determine the contrast capability of the GNPs, 0–20 mg/mL of the GNPs in DPBS was transferred to 1.5 mL Eppendorf tubes and imaged using a Toshiba Asteion CT at the University of Wollongong, Australia, with 1 mm slice thickness, and X-rays produced with 50 mA and 100 kVp or 120 kVp. Final spatial resolution of images after reconstruction was 0.35 mm. CT numbers of each sample were measured using Fiji by taking the same region of interest (ROI) inside the center of each Eppendorf on the images.
2.5. Preclinical Brain Cancer Gold Nanoparticle Uptake
All operative procedures and animal care were in conformity with the guidelines of the Australian Government code for the care and use of animals for scientific purposes and under the approval of the University of Wollongong animal ethics committee agreement (AE16/12). Five, male, 7-week-old Fischer-344 rats (obtained from the Animal Resource Centre (ARC), Canning Vale, Perth, Australia) were acclimatized for 1 week at the UOW animal facility. At 8 weeks old, the rats were implanted with the 9LGS cells under aseptic surgical conditions.
Two hours prior to each surgery, buprenorphine (0.4 mg/kg) was given voluntarily to the rats by mixing the crushed tablets in Nutella for oral administration. At least 30 min before surgery, rat cages were warmed using a heat lamp to encourage better maintenance of body temperature under anesthesia during the initial stages of surgical preparation. In the meantime, the 9LGS cells were harvested from T75 cm2 flasks by washing with DPBS and trypsinizing for 5 min. Cells were counted, centrifuged, and washed with DMEM (not containing FBS or PS) twice. After final resuspension in DMEM, the 9LGS concentration was 10,000 cells per µL for injection.
One at a time rats were then inducted with 5% isoflurane in oxygen using a Stinger Research Anesthetic Gas Machine (Darvall Vet, 46–48 Buffalo Road, Gladesville, NSW 2111, Australia). Rats were then transferred to the Kopf® Model 963 stereotactic frame for surgery and maintained at 2.5% isoflurane. The head was shaved and cleaned prior to placement on ear bars and a bupivacaine line block (7 mg/kg) was administered to the scalp for local analgesia. An incision was made, and a burr hole was made at 3.5 mm to the right of the bregma crossing. A 30 G, 2 µL 7000 series Neuros Hamilton® syringe (4970 Energy Way Reno, NV, USA) was then used to take up the 9LGS cells (prepared as above) after vortex. The syringe was lowered to 6 mm depth in the brain and retracted 0.5 mm to create a void for the cells. A total of 1 µL of cells was then injected at 5.5 mm in the brain and held for 2 min for retention before retraction. The wound was then sutured, and the rat was allowed to recover by providing it with additional fluids and hydrogel.
At 11 days post cell implantation, the rats were anesthetized at 2.2% isoflurane for CT imaging after induction with 5% isoflurane under the conditions mentioned. A Surflash 24G 3/4” catheter was inserted into the lateral tail vein and 0.7 mL of Iomeron-350 (Bracco Ltd., Via Caduti di Marcinelle 13, Milan, Italy) was injected. After 5 min, CT images were acquired of the head of the rat with 100 kVp and 150 mA X-rays with 1 mm slice thickness to verify the presence of the 9LGS tumor.
On day 12, two rats were prepared for surgery to implant the GNPs directly to the site of the tumor, as above. A total of 2 µL of the GNPs (at 20 mg/mL) was injected to the center of each tumor (measured on CT images prior) after making a 0.5 mm void. Rats were recovered and imaged with CT under anesthesia (as mentioned previously) with the remaining three rats as controls at 4 h, 6 h, 12 h, 24 h, and 48 h post injection. On the final day of imaging, iodine was readministered to determine the final tumor volume. CT images were analyzed with Fiji to determine the relative contrast enhancement between the surrounding brain (at 40 HU) and the GNPs in the tumor.
Finally, 1.5 mL Eppendorf tubes were also loaded with the GNPs in concentrations from 0 to 5 mg/mL in DPBS and imaged with the same CT machine at 100 kVp and 120 kVp (1 mm slices) to determine the contrast capability of the GNPs at similar concentrations estimated in the brain.
3. Results
3.1. GNP Size Characterization
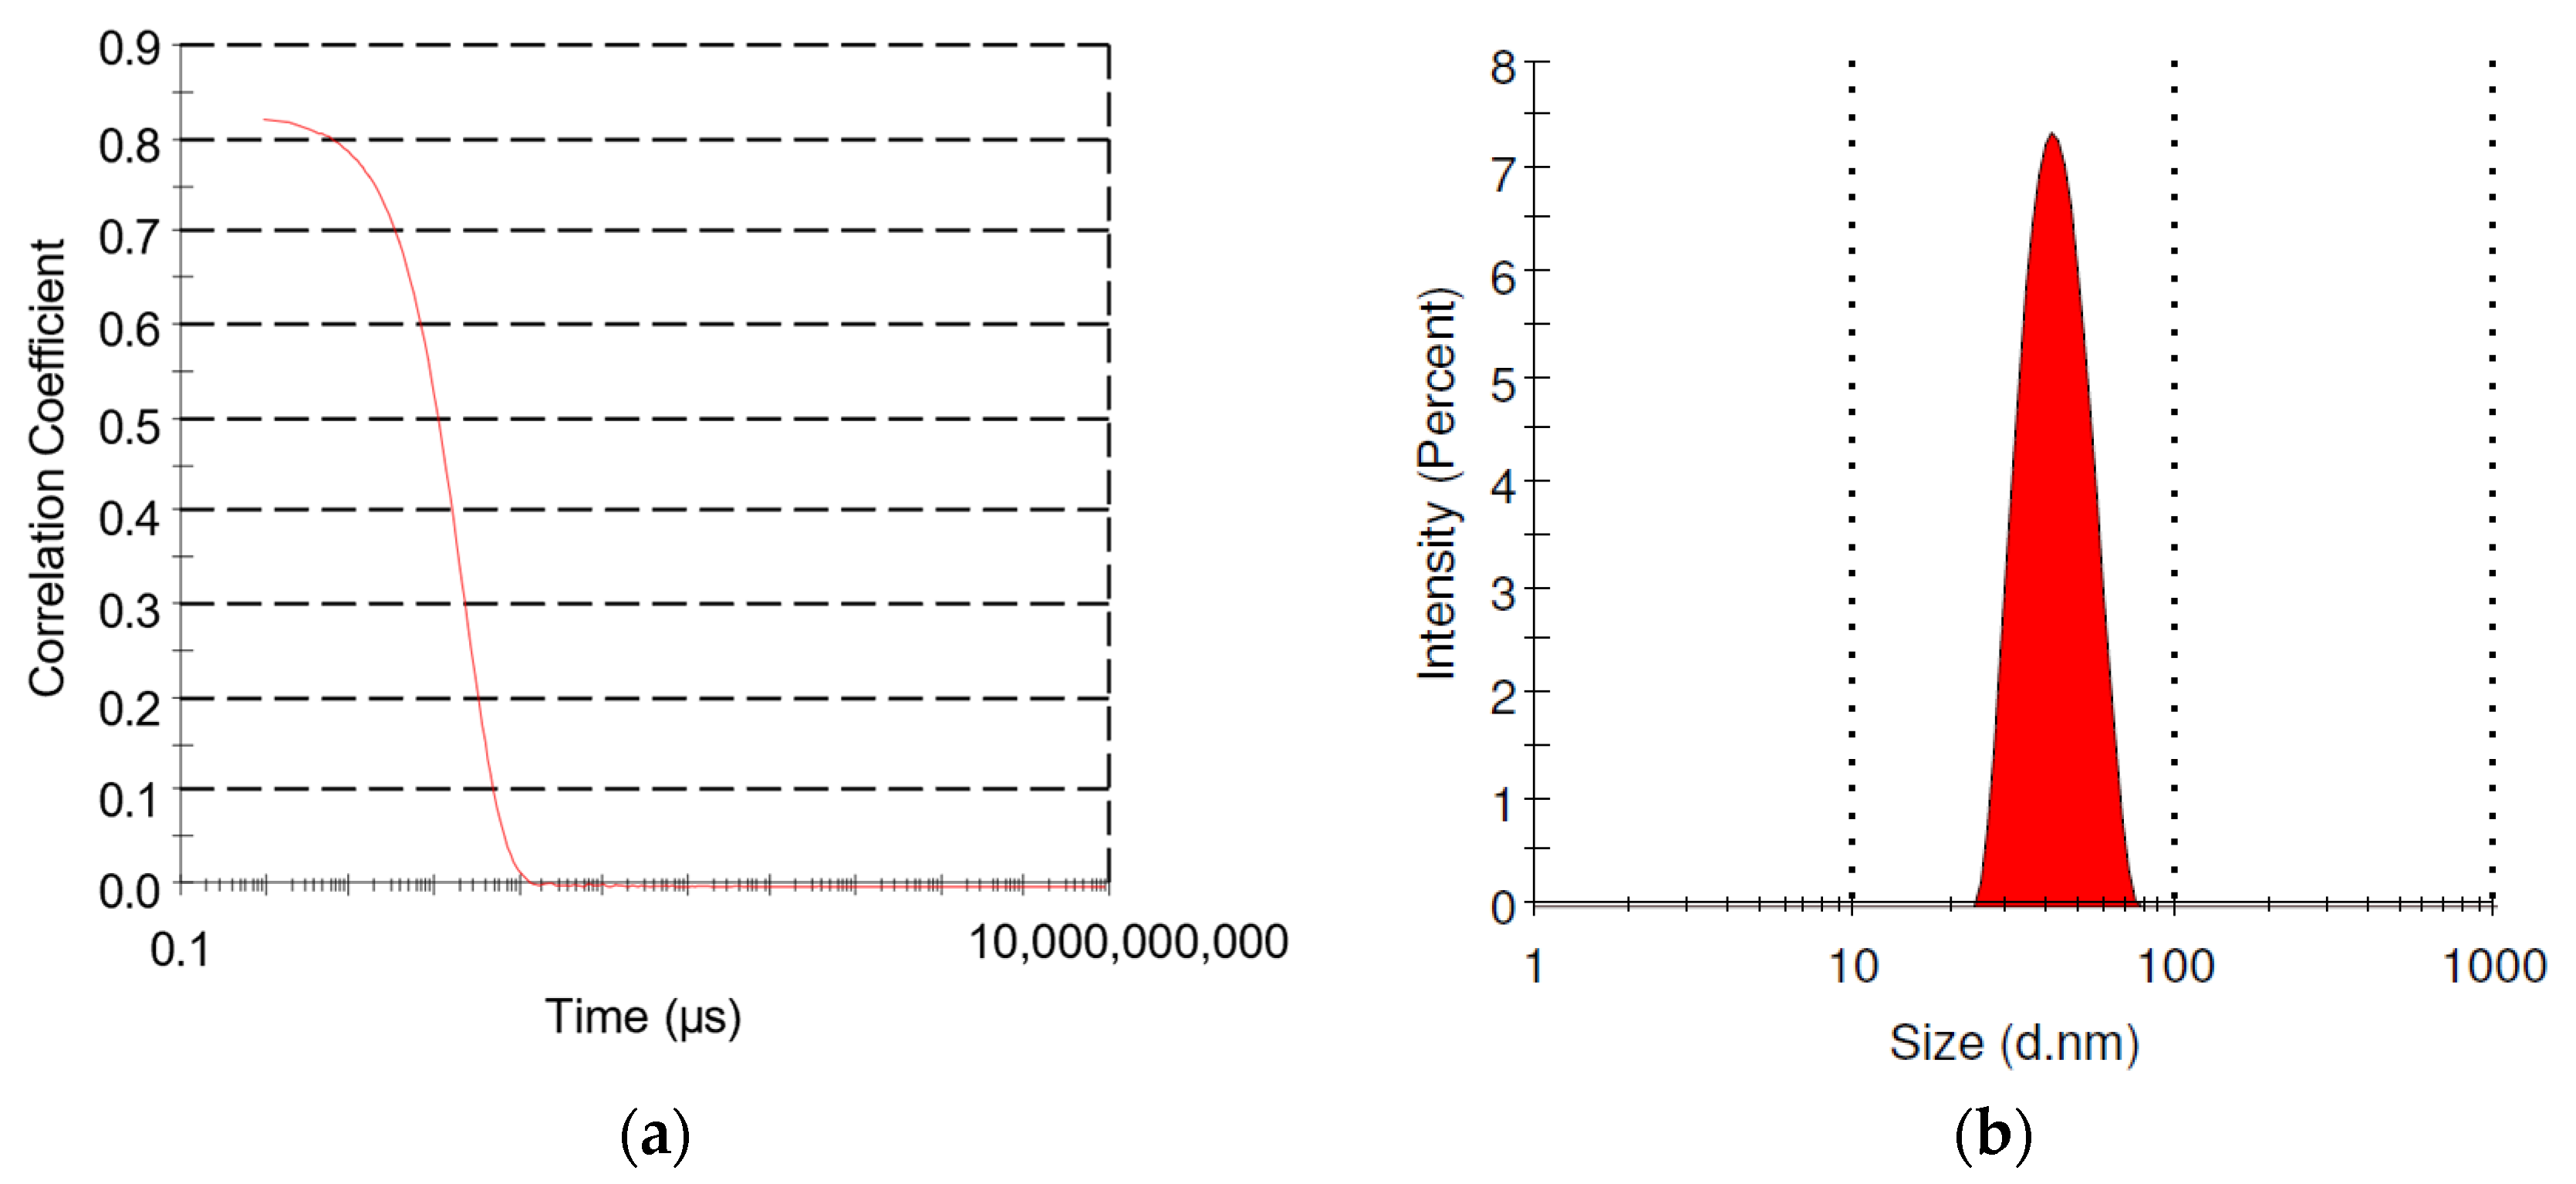
The size of AuroVistTM GNPs in solution was determined with DLS. Figure 1 shows the correlation curve and Z-average size of the GNPs in 1 mg/mL DPBS.
In solution, the Z-average size was found to be (41.3 ± 0.3) nm after four separate measurements (95% confidence). GNP sizes varied from 18–120 nm, however, which indicates some aggregation with 38% polydispersity (less than 20% is considered monodispersed). The polydispersity index of (0.141 ± 0.01) compares well with the previous findings by Domey et al. [20] using 0.05 mg/mL, who found the Z-average size to be (36.4 ± 0.4) nm and obtained a polydispersity index of (0.155 ± 0.02). A previous study by Bahamonde et al. [31] further showed that the mean diameter of the 15 nm AuroVistTM gold core was (13.09 ± 7.89) nm using TEM and found a Z-size of (42.64 ± 0.15) nm with a polydispersity index of (0.154 ± 0.005).
The gold core diameter of 15 nm is considerably smaller than the hydrodynamic diameter, which indicates there is a thick coating around the GNP core. Bahamonde et al. [31] used Raman spectroscopy to identify this coating as PEG or a polymer with very similar structure and conformation, as the manufacturer did not specify the coating material. PEG is a likely candidate and is commonly used, as it is a non-toxic, neutrally charged coating that is commonly used to stabilize GNPs for use in biomedicine [32].
As the nanoparticle size and coating play an important role in uptake into cancer cells, our GNP sizes show a good likelihood for cellular uptake, with optimum cancer cell uptake shown to occur for particles of approximately 50 nm size [14,18].
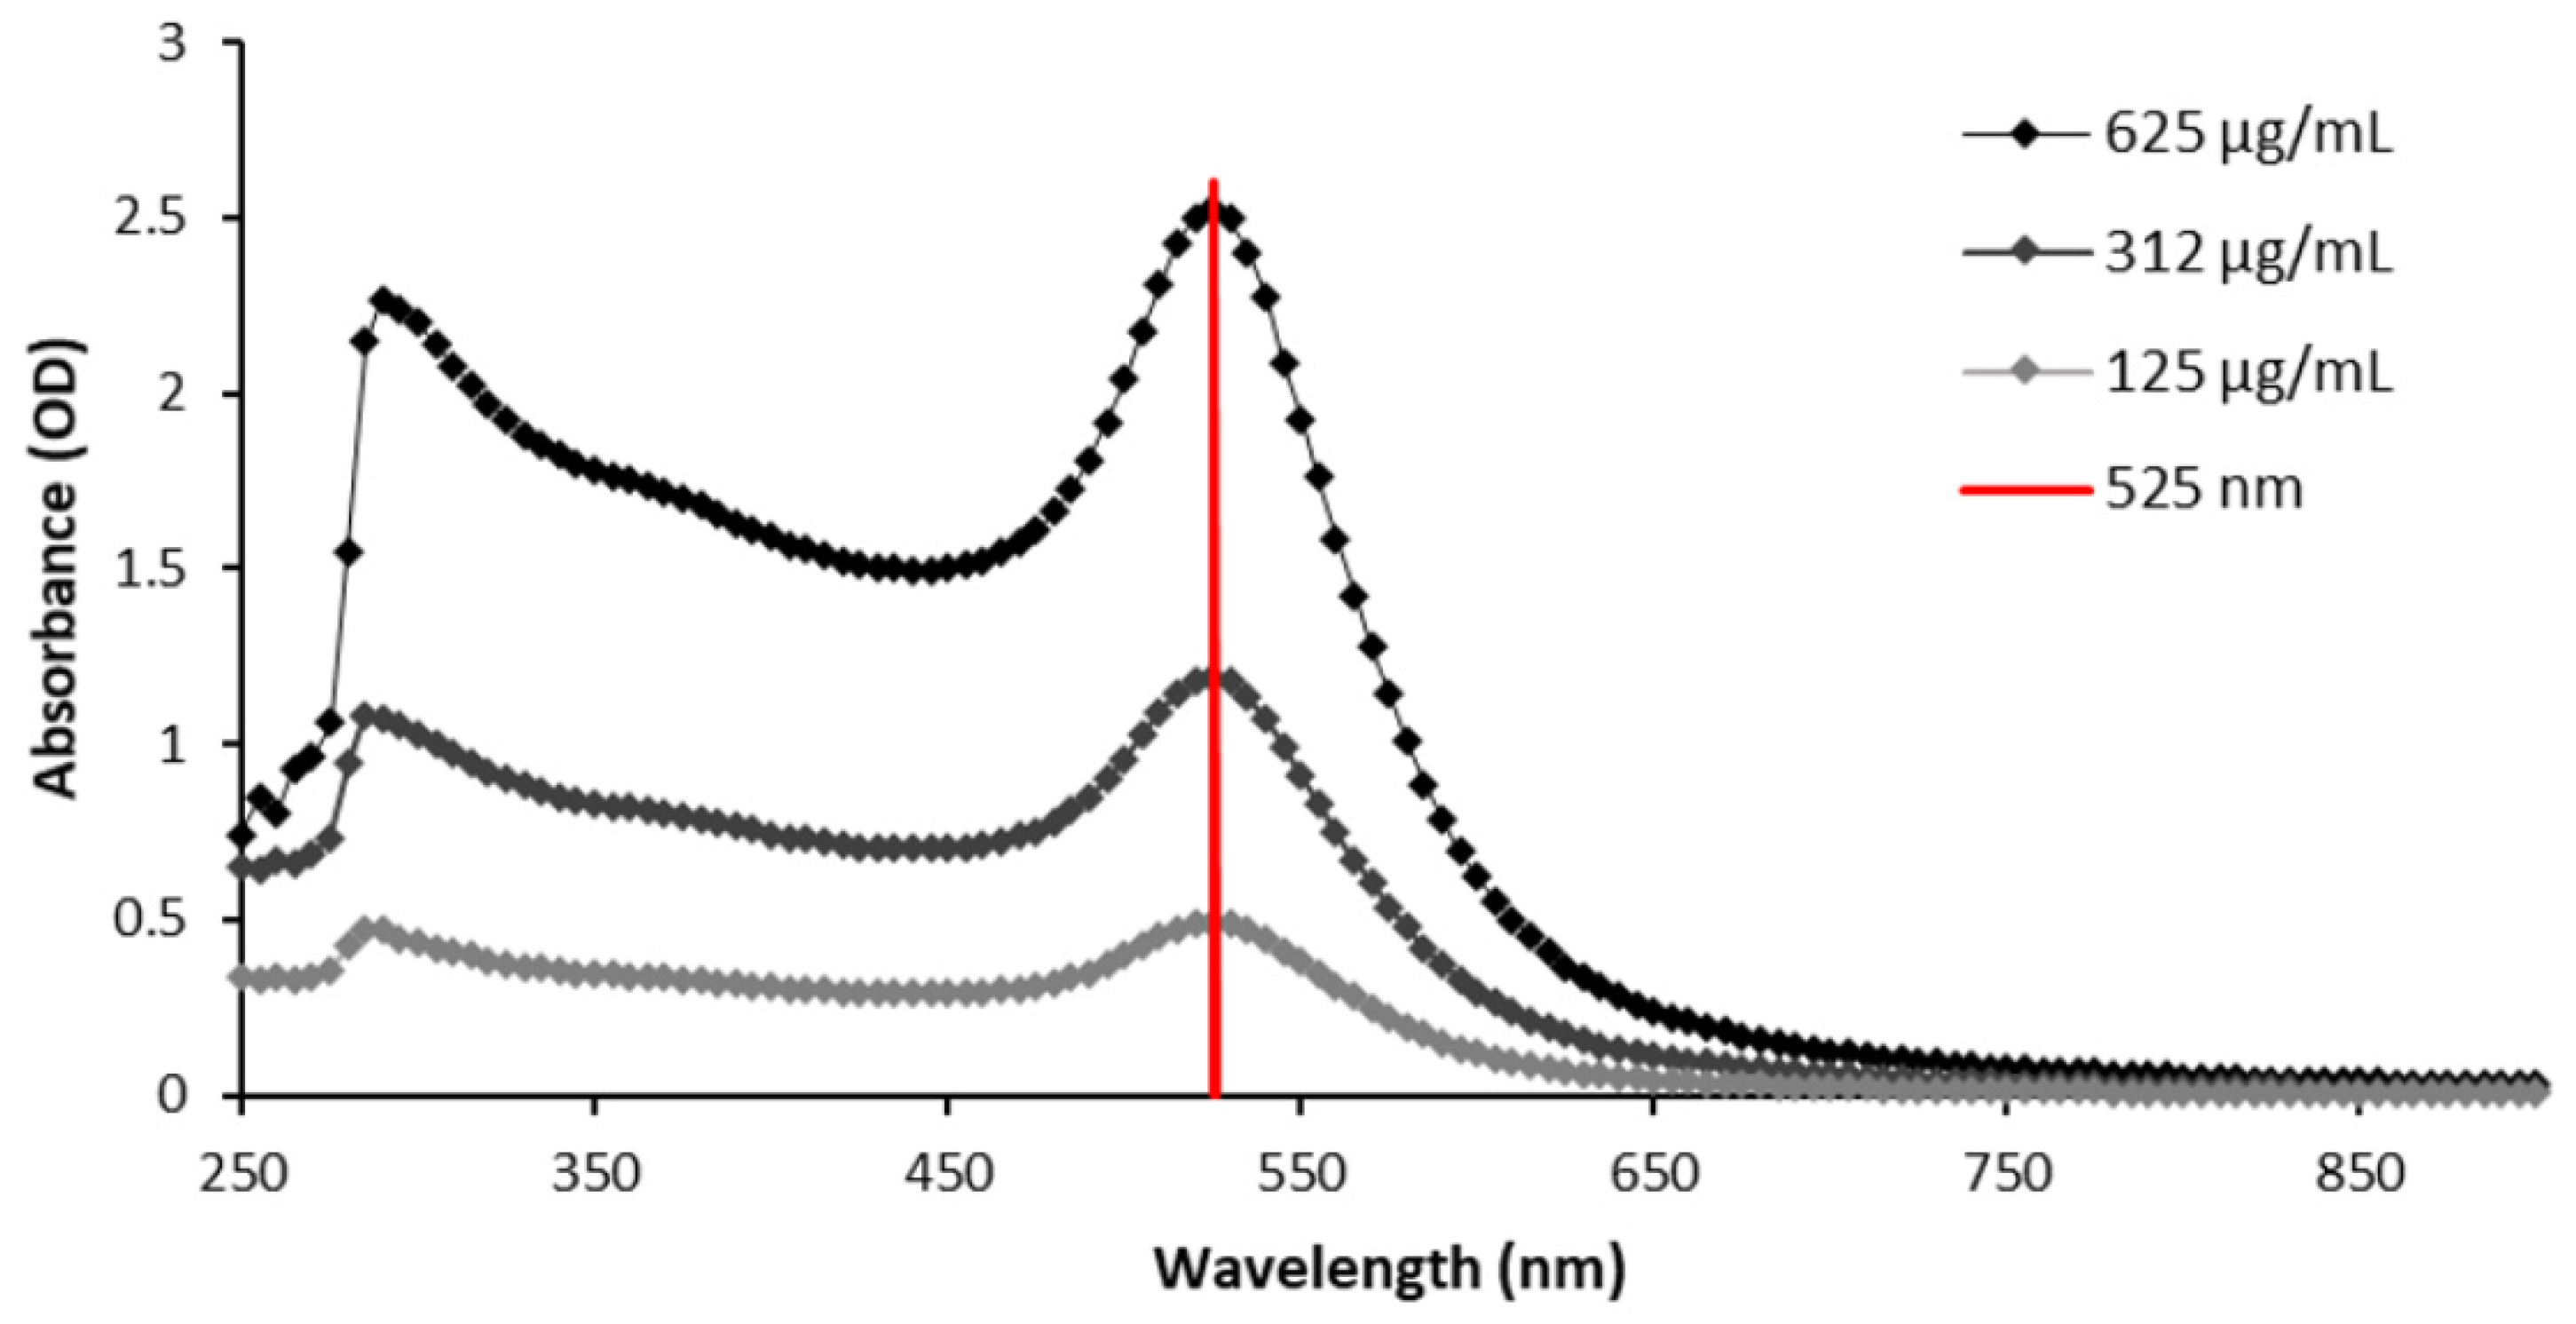
The optical properties the GNPs were characterized by a SpectraMax plate reader to investigate the presence of SPR in AuroVistTM GNPs and further confirm the GNP size. Light of wavelengths 190–1000 nm was exposed to the GNPs in concentrations of 0.125–0.625 mg/mL and the absorbance recorded. The results for the GNPs are shown in Figure 2. There is a clear absorbance peak at 525 nm for the GNPs that persists at each concentration. Another peak was observed at 290 nm. Increasing the concentration of the GNPs causes more absorbance, and the optical density (OD) reached saturation above 0.3 mg/mL The peak of 525 nm is expected from the GNPs of 15 nm diameter according to He et al. [25] and Chithrani et al. [14]. The GNPs between 12 and 41 nm show the maximum absorption peaks at 520–530 nm. With larger GNP sizes, the absorbance peak redshifts beyond 525 nm.
Therefore, from the SPR occurrence at 525 nm, we can conclude that these particles are <40 nm (physically less than the hydrodynamic diameter seen with DLS). He et al. [25] further found that maximum scattering peaks are located at 286 nm (seen with our GNPs at all concentrations), 310 nm (seen faintly with GNP concentrations > 0.312 mg/mL), and 480 nm (not seen here, but likely absorbed in the prominent peak at 525 nm). These may be promising targets for optical sensing of the GNPs in cells and other applications [24,25].
3.2. Gold Nanoparticle Uptake in Brain Cancer Cells
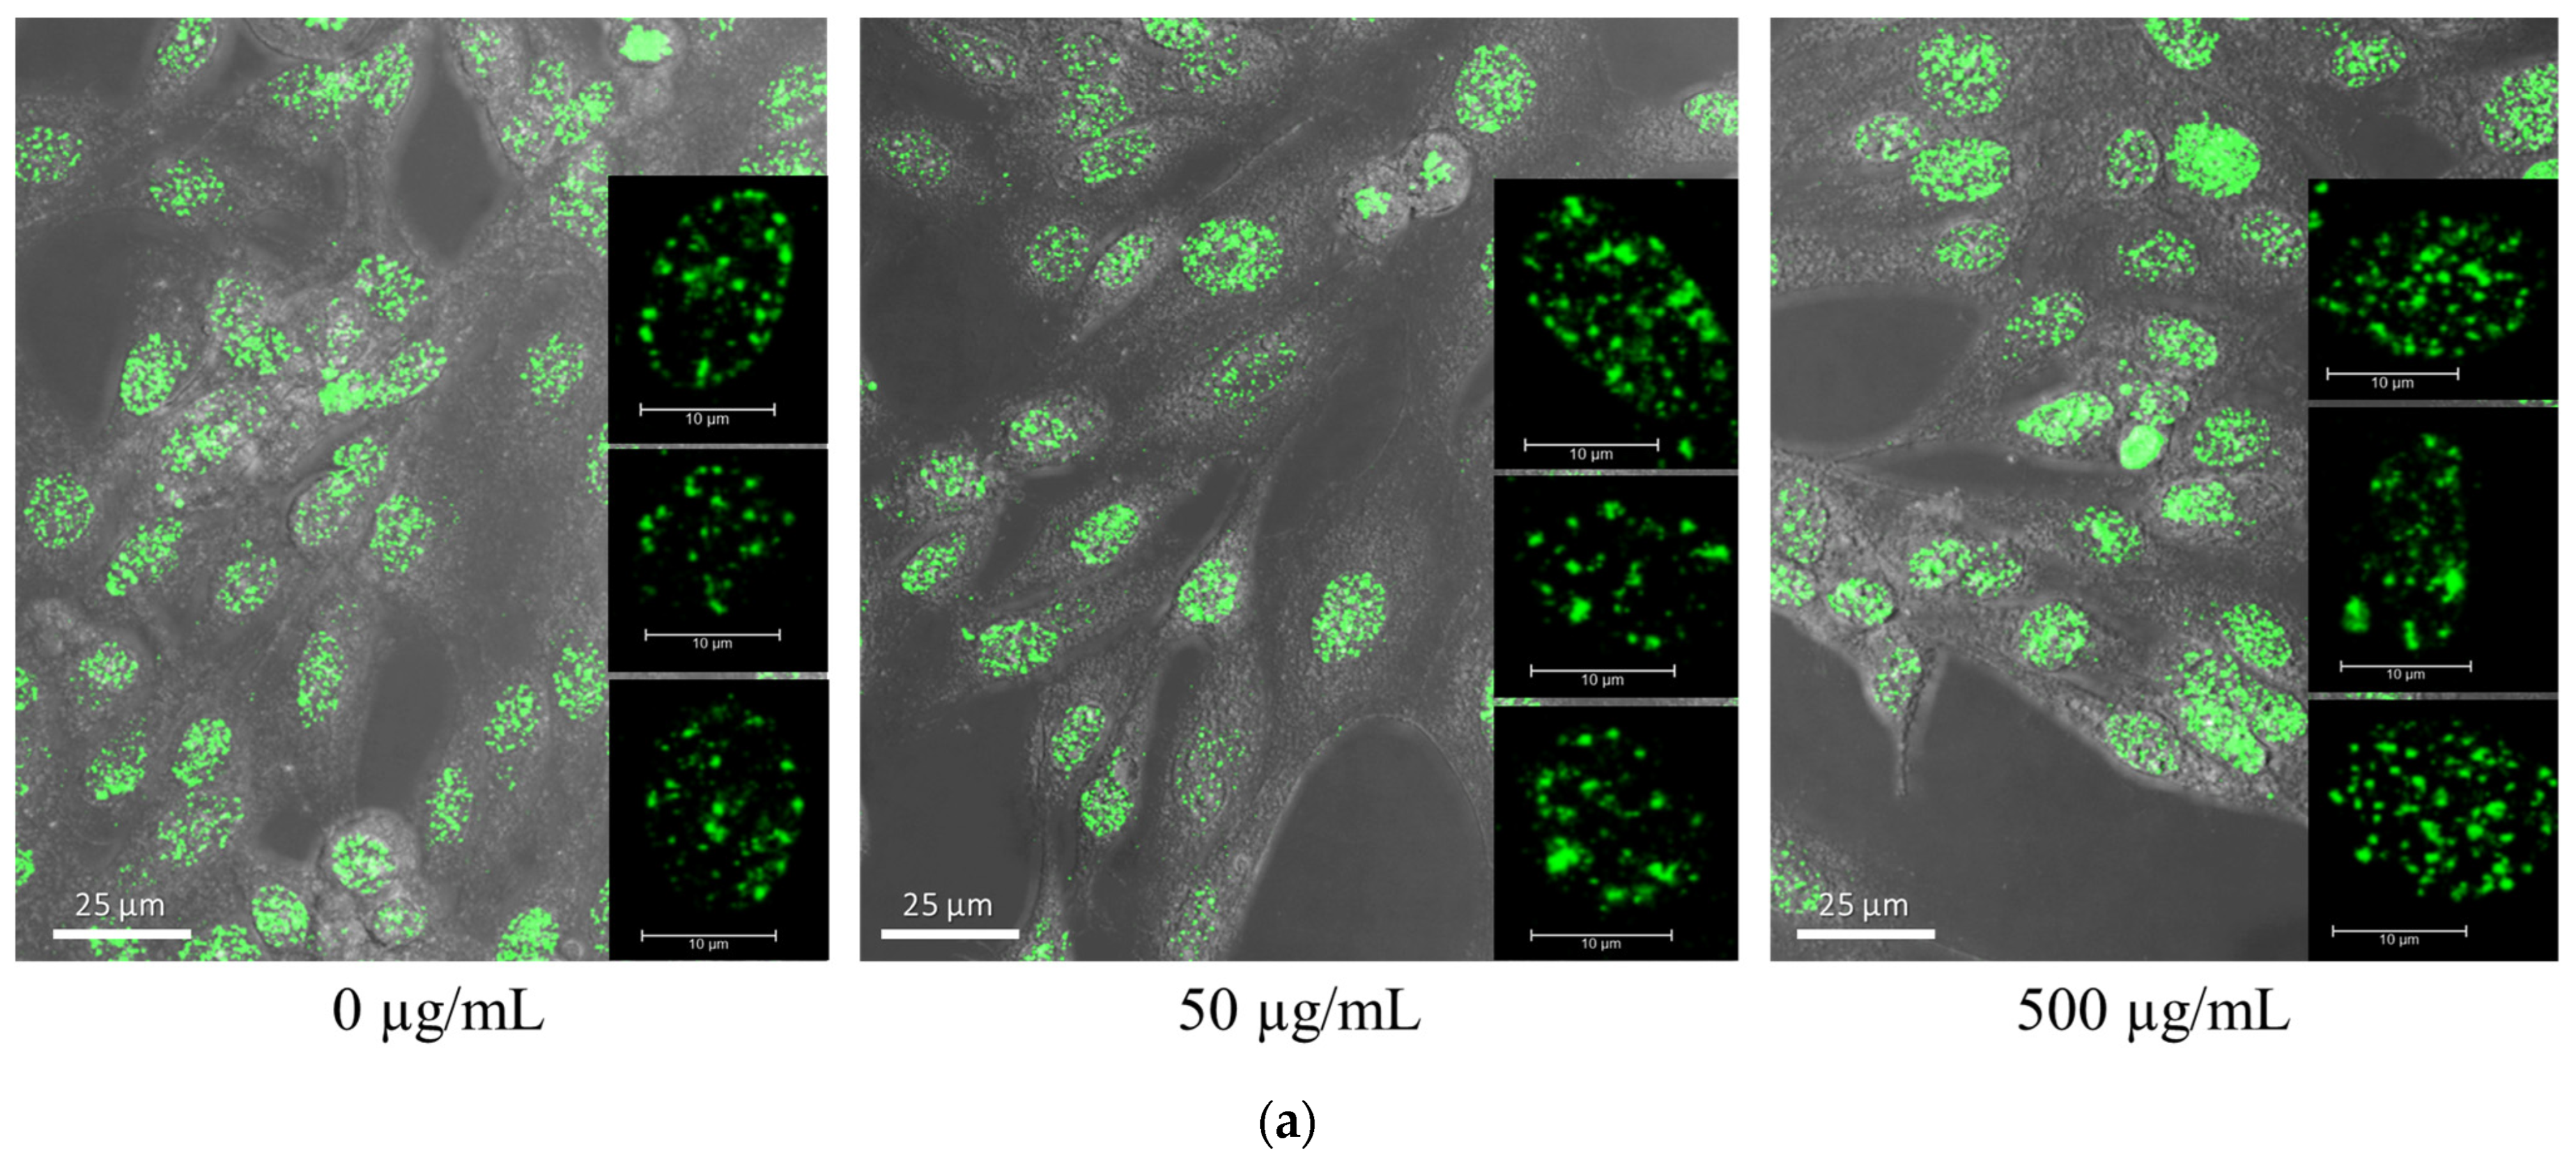
In establishing their size, the GNPs are good candidates for phagocytotic uptake by the 9LGS cells. GNP uptake and localization were confirmed in the 9LGS cells with 488 nm laser light scatter with confocal microscopy or FACS. Figure 3 shows the location of the GNPs detected within the 9LGS cells. Some of the light scatters from internal components in the 9LGS cells in the microscopy images (Figure 3a), but there were significantly more events in the cells with the GNPs.
With 50 µg/mL or 500 µg/mL of GNPs, more scatter sources were observed clustered around the cell nucleus, or above nucleus (rarely), but not within the nucleus (Figure 3b,c). However, some cells (particularly with 50 µg/mL GNPs) had scatter that was indistinguishable from the controls. Furthermore, the sources of the scatter in the 50 µg/mL of sample cases were difficult to find in most cells, but this may be a result of the microscope resolution of 90 nm and the GNPs’ expected size being <40 nm.
For 500 µg/mL, more GNP aggregates were observed physically as round, dark spots > 90 nm, and these surrounded the cell nucleus (Figure 3c). Light scatter from the GNPs was also more pronounced. Figure 3d provides an estimation of the quantity of the GNPs, assuming that sites <90 nm represent 1 GNP. This showed that the relative number of the GNPs between 50 and 500 µg/mL had increased, although the quantification efficacy of this method has yet to be assessed. However, there was high variation throughout the cell population that produced large errors in Figure 3d. This could be due to miscounted aggregated particles that were scored as single particles but were smaller than our image resolution.
Finally, the FACS results in Figure 3e show that the internal side scatter from 10,000 cells with GNPs at 50 µg/mL was elevated, but not significantly different from the control after 24 h. This agreed with our observations of cells with and without 50 µg/mL of the GNPs producing similar scatter on some of our confocal images. Longer incubation times did, however, further encourage the uptake of the GNPs further at 48 h, as the GNPs appeared to fall from suspension.
3.3. Gold Nanoparticle Dose Enhancement for Brain Cancer Radiotherapy
From our uptake study results, we investigated the potential of these GNPs for dose enhancement in external beam radiotherapy with concentrations of 50 and 500 µg/mL, incubated for 24 h. Figure 4 shows that the 500 µg/mL of the GNPs provided significant dose enhancement (p = 0.0004) leading to increased 9LGS cell death over all doses, compared to the control and with 50 µg/mL of the GNPs, which did not show a significant difference to the control survival (p = 0.6). This finding agreed with the low uptake probability observed in the previous section with 50 µg/mL of the GNPs compared to 500 µg/mL. We used 150 kVp X-rays to irradiate the 9LGS cells for clonogenic assay, as in previous work [8,13] due to the low X-ray beam energy beam that corresponds well to the optimal mass energy absorption coefficient of gold relative to water [33]. However, this may not produce the most efficient dose enhancement compared to low energy beams.
Further, the GNPs must be internalized in the cell or localized near the cell nucleus to cause additional cellular damage, including DNA damage, in the 9LGS cells during irradiation. This is due to the short range of secondary electrons produced by the GNPs with this beam energy [10,12,13]. The additional cell killing produced by the GNPs with radiation was not from cytotoxicity of the GNPs in absence of radiation, as the surviving fraction of the 9LGS cells with 50–500 µg/mL of the GNPs was (1 ± 0.1) relative to the control. This agrees with previous findings indicating the biocompatibility of the GNPs in cells [15].
Table 1 summarizes the radiobiological parameters from the clonogenic survival curve that were derived from the linear quadratic model [34]. The α parameter was similar between the control and the 50 µg/mL of the GNPs, with a slight increase in the β component, indicating a prevalence to clustered DNA damage [35]. Instead, the 500 µg/mL of the GNPs show an increase in both α (indicating more double strand DNA breaks) and β. The sensitization enhancement ratio (SER10) represents the dose enhancement produced by the GNPs from the ratio of the control dose to the GNP dose that produces 10% survival. Expectedly, the 500 µg/mL concentration produced the greatest dose enhancement of 1.43 (143%) compared to the 50 µg/mL of the GNPs with 1.13.
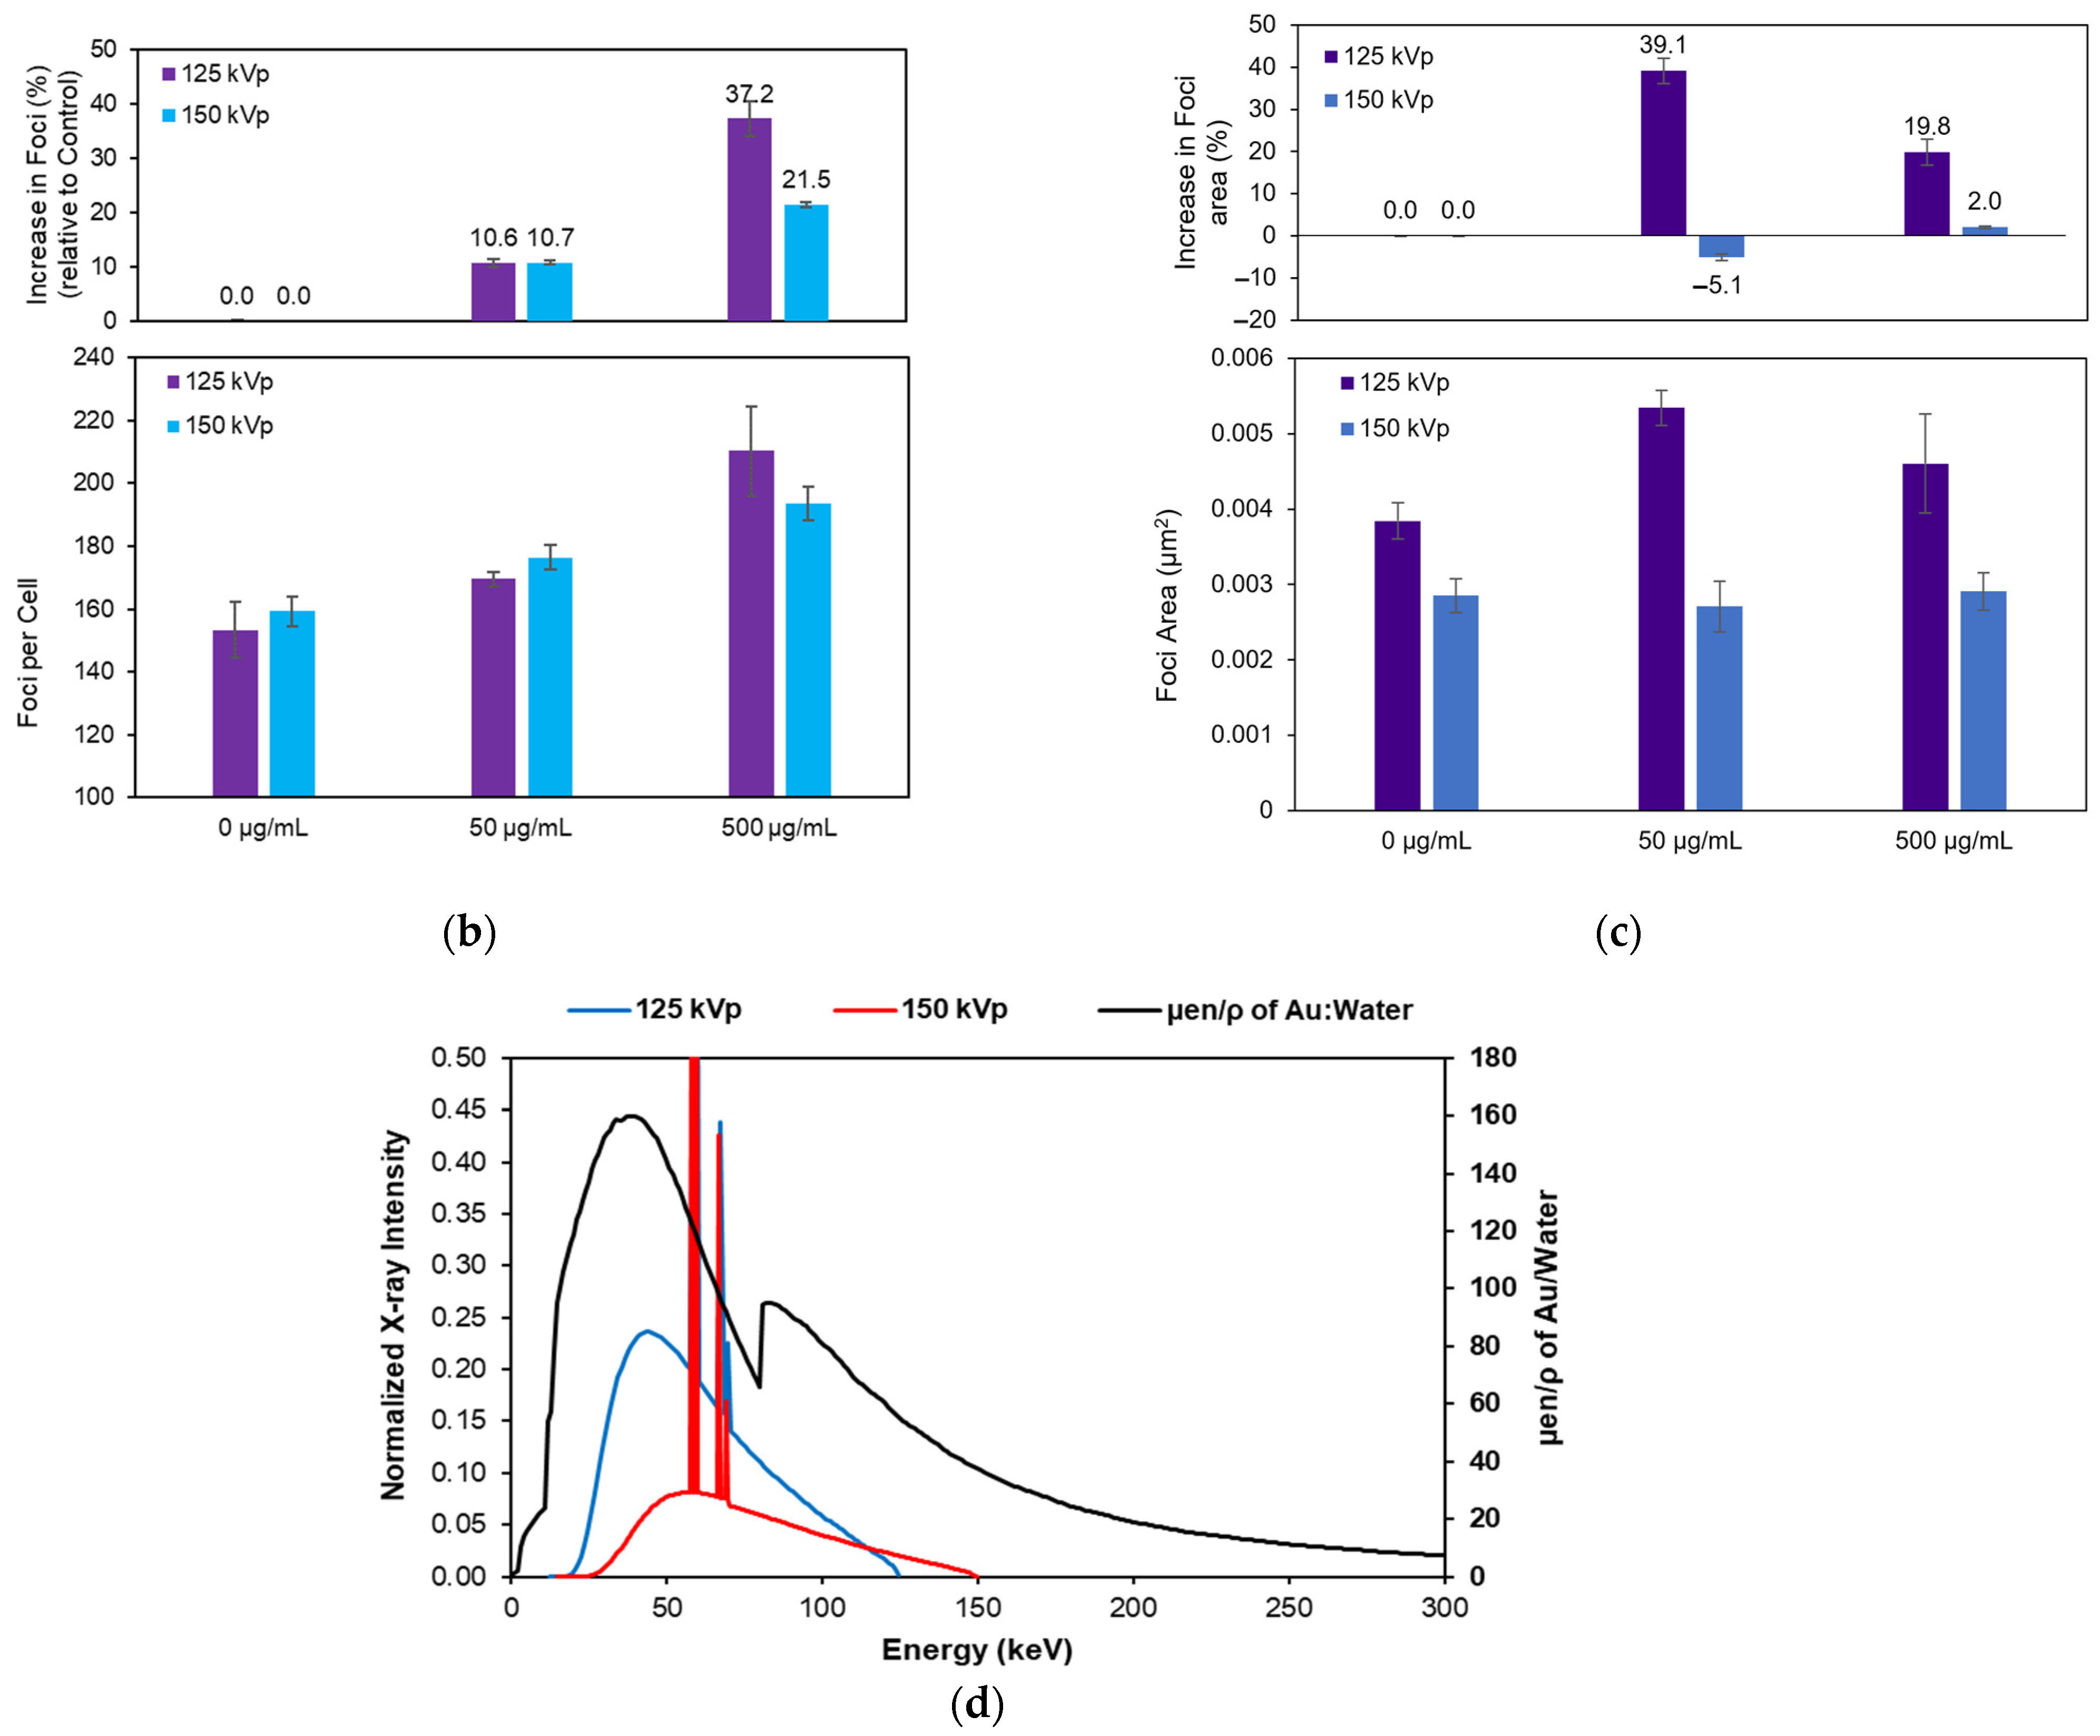
To further investigate the DNA damage produced by the GNPs during irradiation, a γ-H2AX assay was performed 15 min after irradiation with 2 Gy. Figure 5 shows confocal images acquired with a 488 nm argon laser to obtain γ-H2AX foci fluorescence. As the DNA damage is driven by secondary electron production, two beam energies were investigated: 120 kVp and 150 kVp, with mean energies of 49 keV and 67 keV, respectively (Figure 5d).
Compared to 2 Gy alone, the number of foci increased with 50 µg/mL and more so with 500 µg/mL of the GNPs. Overall, 500 µg/mL of the GNPs expectedly increased the number of foci with 150 kVp X-rays (Figure 5a,b). The average foci size using 500 µg/mL of the GNPs was also 7% larger than 50µg/mL with 150 kVp X-rays, indicating slightly more clustered radiation damage also.
However, more significant changes to foci density and size were obtained from the lower energy beam, with 15.7% more foci than 150 kVp for 500 µg/mL, and over 20% increase in the average foci area compared to 150 kVp. This indicates that the 125 kVp beam could produce more clustered DNA damage with 50 µg/mL or 500 µg/mL of the GNPs than the conventional 150 kVp case. Aside from higher LET secondary electrons, the 125 kVp spectrum also better targets the mass energy absorption coefficient ratio of gold to water, which has been discussed to produce greater dose enhancement [33,38]. This result will be further investigated in the future with clonogenic assay.
3.4. Preclinical Gliosarcoma Imaging with GNPs
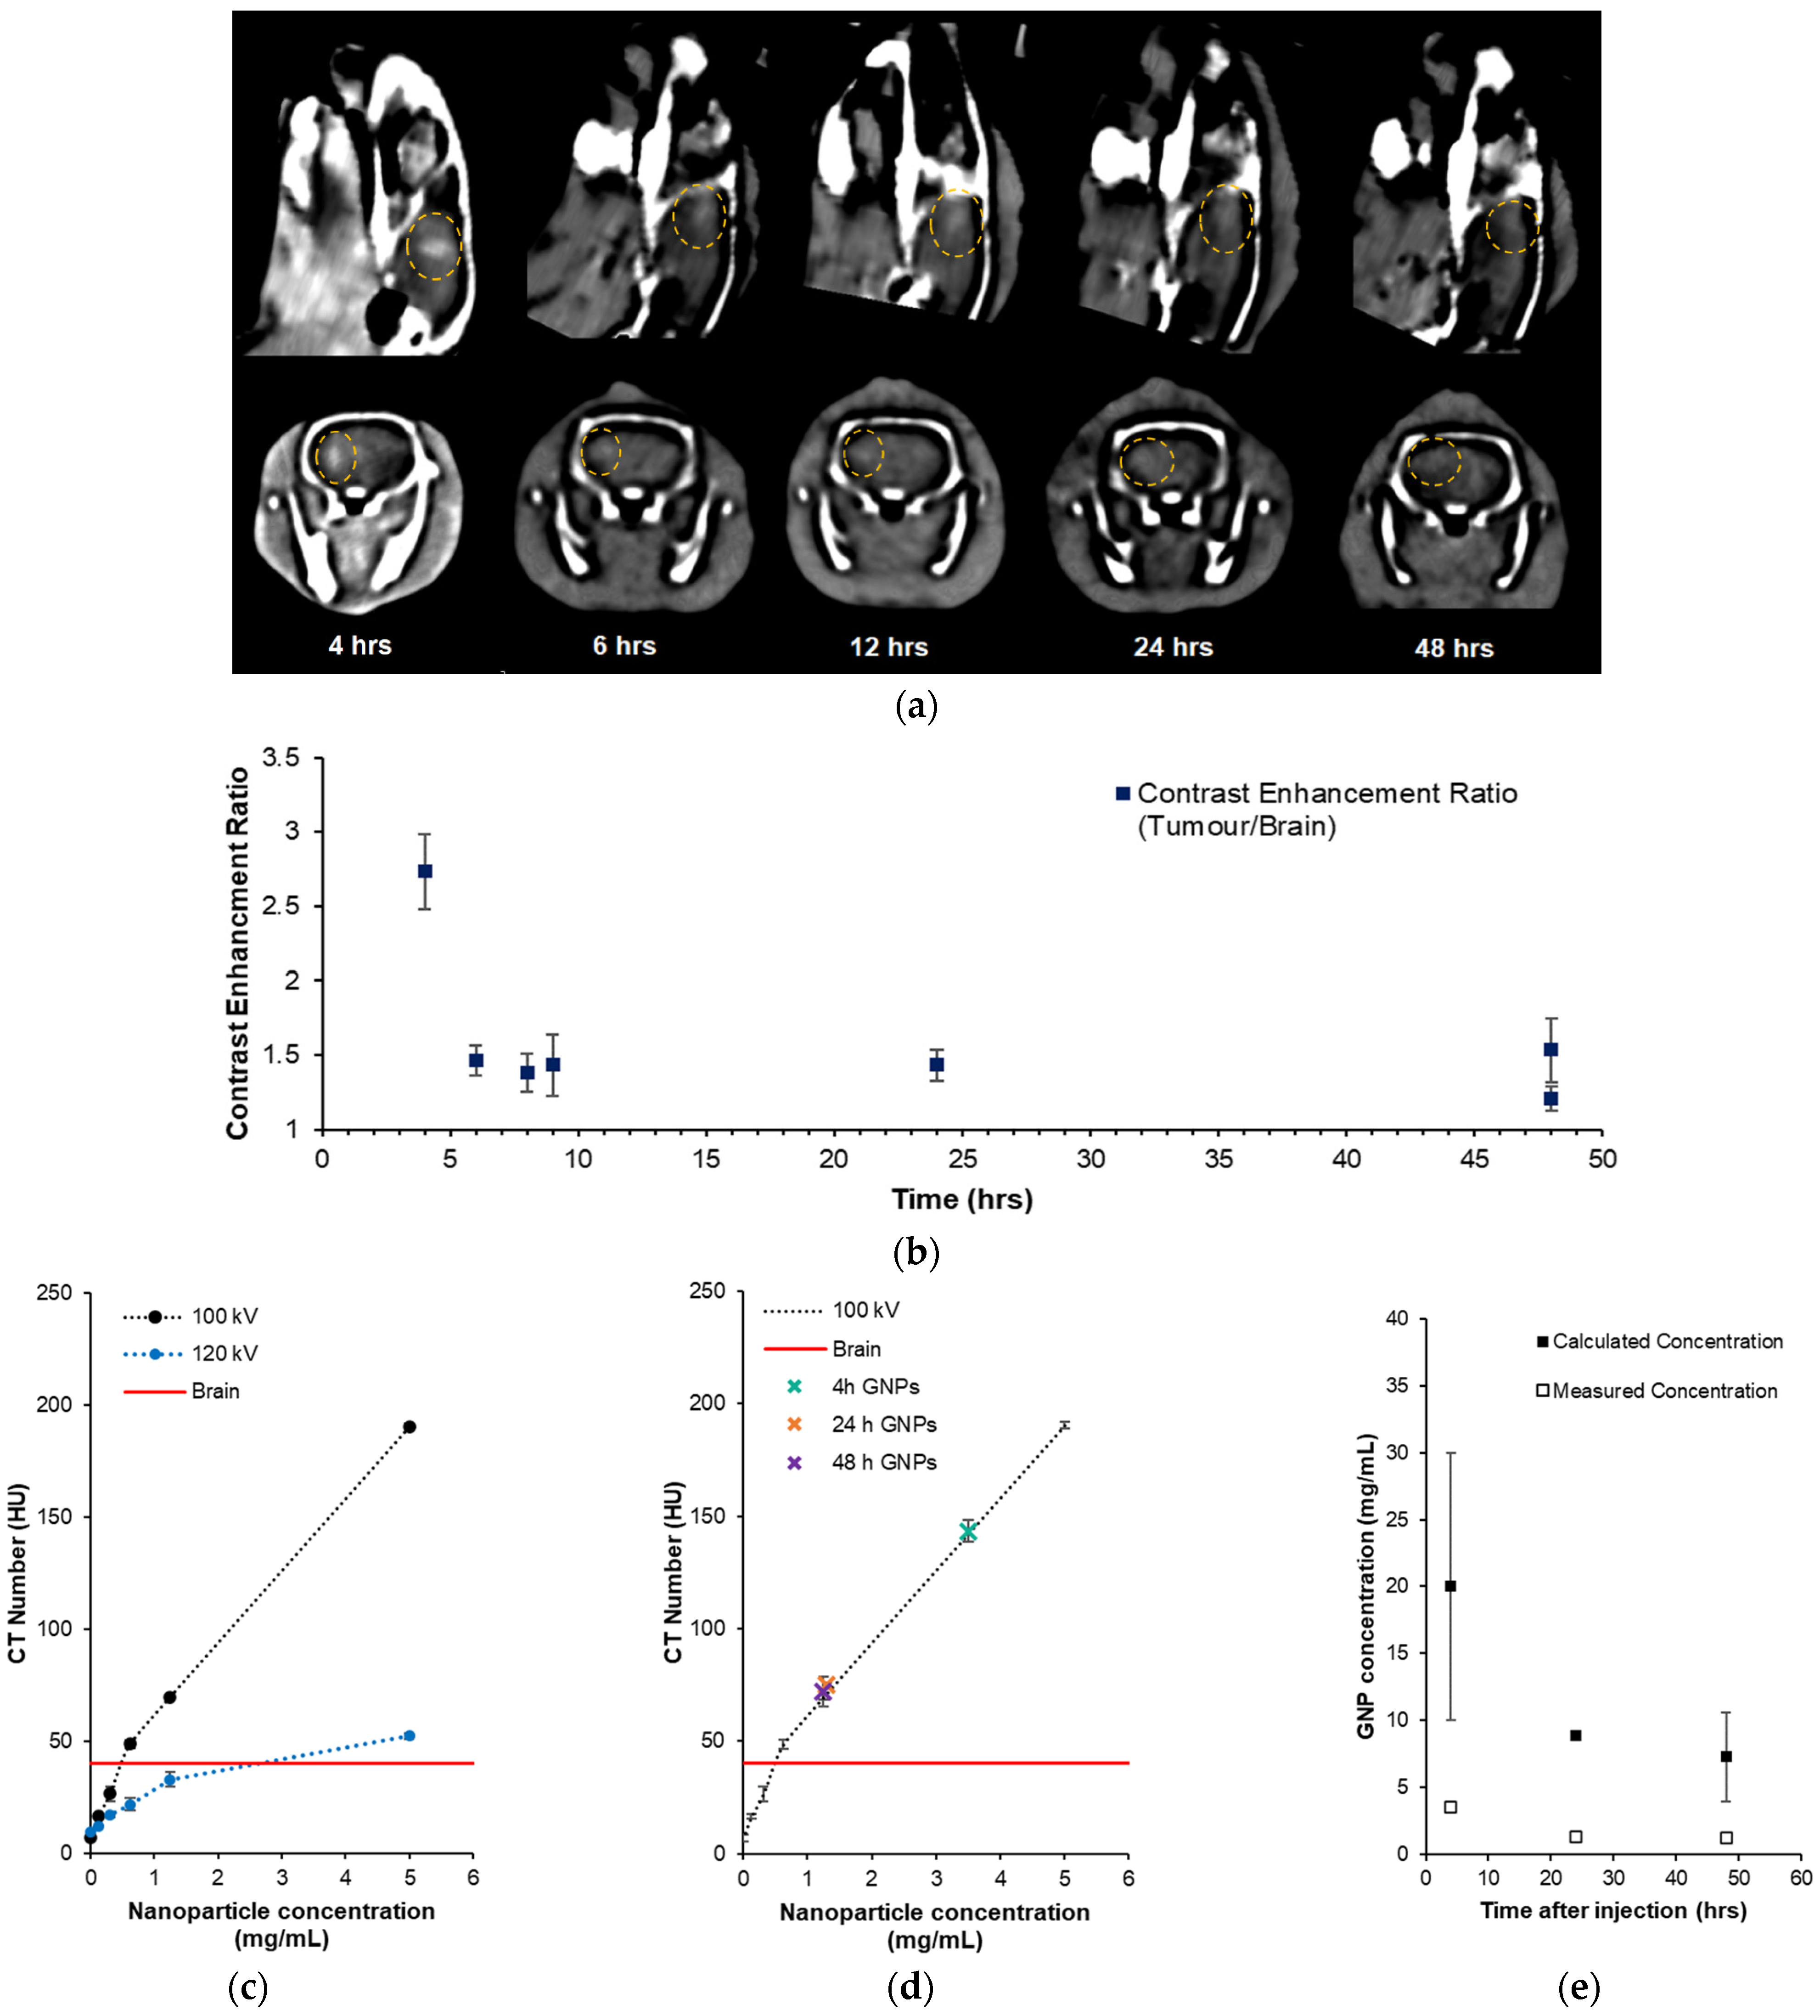
After characterization of the GNP uptake in the 9LGS and useful concentrations identified for radiotherapy, both the uptake and retention of the GNPs were investigated within the 9LGS tumors in vivo. Figure 6 shows the CT imaging results following direct injection of 40 µg of the GNPs up to 48 h. Tumors were defined best at 4 h post injection, and there was a significant decrease in the GNP contrast from 6 h, indicating diffusion away from the tumor. However, after 6 h, the GNPs could be observed at similar concentrations (indicated by the tumor contrast) for 24 h, with a slight decrease at 48 h. The contrast was significant compared to the normal brain with an average contrast enhancement ratio of (1.43 ± 0.03). CT images of known GNP concentrations show that concentrations >500 µg/mL and >2.5 mg/mL are required to produce adequate contrast in the brain with 100 kVp and 120 kVp CT images, respectively. This indicates that for preclinical imaging of the 9LGS tumors with the GNPs, a lower energy is best suited to enhance the contrast, and a comparable concentration to that used in our radiotherapy study can be used for targeted cancer imaging or image-guided radiotherapy.
From the CT numbers obtained in the brain in Figure 6c, we measured the corresponding concentration of the GNPs for 4 h, 24 h, and 48 h timepoints in Figure 6d. There is a 2.7-fold drop in GNP concentration between 4 and 24 h that corresponds to a 1.9-fold decrease in image contrast. This indicates that the GNPs were most useful for image contrast in the range of 0.5–1 mg/mL, rather than at high GNP concentrations.
A total of 40 µg of the GNPs was injected into the tumor at 0 h, and by using the tumor volumes found with iodine contrast prior to GNP NP injection and at 48 h (see Supplementary Material, Figure S1), we calculated the expected GNP concentration in the tumor if no GNPs diffused from the tumor. Figure 6e indicates that there must be GNP diffusion from the tumor site as the calculated GNP concentration is higher than the measured concentration by 5.7 times. This is expected, and the GNPs are known to clear from the site over time and are excreted by the kidneys [20]. As the tumor volume increased, the GNP concentration (both calculated and measured) decreased in a similar trend, indicating that the GNPs that remained after the initial injection were likely to be retained as the tumor grew.
These results show that the GNPs are in adequate concentration for CT imaging contrast when >500 µg/mL up to 24 h, and from the previous Section 3.3, significant radiation dose enhancement can be achieved at same concentrations (500 µg/mL).
4. Discussion
This study explored AuroVistTM GNP size, optical detection methods, and assessed the uptake and distribution of the GNPs in gliosarcoma cells for use in radiation dose enhancement and CT imaging. The GNP size of 15 nm provided by the manufacturer was confirmed within error with SPR absorbance [24,25], and we obtained a hydrodynamic diameter of 40 nm, which agreed with previous work [20]. GNPs less than 100 nm have shown good uptake into cancer cells in vitro, but there is preferential uptake with GNPs of 50 nm diameter [14]. Despite our smaller size, we showed that 500 µg/mL of the 15 nm GNPs congregated closely around the 9LGS cell nucleus in lysosomes and aggregated into visible clusters > 90 µm after 24 h. While we could determine the location of the GNPs in cells, we could not determine the precise quantity using laser light scatter and confocal microscopy, particularly when the GNPs aggregates were smaller than the resolution of the microscope. In future, we may consider other methods such as electron microscopy, as was previously performed [14], to relate the light scatter to the quantity of the GNPs in the cells.
For use in radiation dose enhancement, 1.9 nm GNP size has been shown to be preferable over the 15 nm GNPs in vitro. Bobyk et al. [15] showed that 10 mg/mL of 1.9 nm produced a SER10 of 1.92 and only 1.40 for the 15 nm GNPs irradiated with 50 keV X-rays. Our results showed that a similar SER10 (1.43 with 150 kVp X-rays) can be obtained at a much lower GNP concentration of 500 µg/mL if incubated for 24 h in cells. We note the importance of GNP internalization into the cells, which is more likely with longer incubation times, for radiation dose enhancement. In fact, the internalization and distribution of the GNPs around the cell nuclear DNA (a target for radiotherapy) have been shown to increase the physical and biological dose enhancement with X-rays in previous work [38,39].
Adequate incubation time appears key to allow GNP incorporation in cells, but despite 24 h incubation, we did not observe significant dose enhancement for 50 µg/mL of the GNPs with a SER10 of 1.13. This differs from the SER10 obtained in our previous work on other nanoparticle materials at the same concentration [7,8,40]. This is because the 15 nm AuroVistTM GNPs remain in suspension longer than our previous nanomaterials. However, after 48 h the GNPs fell out of suspension for significant internalization in vitro (Figure 3e), similar to previously studied materials.
The GNP uptake in vitro differs in vivo, however, due to the many differences between cells configured in a monolayer and cells in three dimensions with vascular support. Bobyk et al. [15] showed that the 15 nm of GNPs was preferred for in vivo uptake for cancer radiotherapy, differing from their in vitro results indicating that 1.9 nm of the GNPs was optimum. We further observed that 48 h after injection showed the lowest GNP concentration in the 9LGS tumor in vivo, despite the opposite finding in the 9LGS cells in vitro. Instead, raw nanoparticle components or nanoparticles no longer in suspension tend to disperse quickly from tumor sites in vivo (within 30 min), as shown in our previous work [8].
In this work, we were further able to estimate the GNP concentration in the brain using CT imaging of the GNPs in solution and direct injection of the GNPs into the 9LGS brain tumors. The tumor size was verified with iodine contrast prior to GNP injection and at 48 h to determine the tumor volume and calculate the GNP concentration. We found that, despite an estimated 5.7 times drop in the expected concentration of the GNPs if all nanoparticles remained in the tumor, a concentration > 500 µg/mL was measured in the tumor up to 24 h post direct injection. This is promising for radiation dose enhancement as we obtained significant 9LGS radiosensitization at the same concentration (Figure 4). This indicates that the GNPs could be used for X-ray/CT imaging prior to radiotherapy treatment within 24 h, which is feasible for clinical use. In future, we hope to confirm this hypothesis with a preclinical study using X-ray radiotherapy and GNPs to treat 9LGS cancer cells. In the future, we will also investigate the efficacy of direct injection compared to intravenous injection and determine any uptake differences. In this work, we opted for direct injection to ensure that the precise quantity of the GNPs injected into the tumor was known for better GNP concentration estimation using CT. Finally, we hope to repeat our work on more brain cancer cell lines in vitro and in vivo, and on spontaneous cancers in vivo.
For future clinical use, we must also consider that the energy of clinical beams is in the megavoltage range, rather than the kilovoltage range studied here. We sought to optimize the beam energies used for X-ray imaging in the kilovoltage range to allow for image-guided radiotherapy, possibly using the same source. Beam energy is a key parameter that must be explored further for optimal GNP dose enhancement. We showed that the 125 kVp X-rays produced a greater number of γ-H2AX foci and had larger foci area compared to the 150 kVp X-rays. We attribute this to the optimal mass energy absorption ratio of gold to water, and the short range of electrons produced by the 49 keV mean energy compared to 67 keV, producing electrons that travel up to 40 µm and 80 µm in water, respectively [41]. We noted that the γ-H2AX assay produced a useful indication of the cell death observed with 150 kVp X-ray clonogenic results, however, the foci count could not be directly related to the survival or the SER10. The γ-H2AX assay shows short-term radiation effects only, and the DNA damage accumulated after 15 min can be repaired or secondary mechanisms indirectly cause more DNA damage over time,. We did note that the foci area increased relative to the control with the GNPs irradiated with the lower beam energy, indicating that there was more clustered DNA damage. This has not been observed in other γ-H2AX studies with 662 keV or megavoltage irradiation of the GNPs [42,43], and it is likely that alternative mechanisms such as mitochondrial damage, oxidative stress, and nanoparticle cytotoxicity play a role in GNP radiosensitization of cancer cells in their long-term survival.
Kilovoltage treatments, such as microbeam radiation therapy (MRT), could also be used for brain cancer treatment [44,45,46]. MRT is currently in the preclinical research phase and uses microscopic radiosurgical beams to destabilize tumor vasculature selectively [43,45]. Nanoparticles in MRT show promising dose enhancement capability and further improve the selectivity of the treatment toward cancer cells [39,46].
The invasive nature of gliosarcoma, low prognosis, and high-risk location in the body make development of effective treatments paramount. GNPs can provide image guidance and tumor-targeted dose enhancement for brain cancer treatment with external beam radiotherapy, acting as a boost to conventional treatment. However, better understanding distribution of GNPs in these tumors is required for clinical translation, and optimizations for efficient dose enhancement must be considered such as beam energy, GNP uptake, GNP size, and retention.
5. Conclusions
This work has demonstrated the potential of 15 nm GNPs for image-guided radiotherapy in the treatment of gliosarcoma cancers of the brain. The 15 nm GNP size was confirmed by SPR absorption, and the GNPs had a hydrodynamic diameter of (41.3 ± 0.3) nm. As a result, the GNPs were well-internalized into the 9LGS cells, particularly with a 500 µg/mL GNP concentration in the cell medium. We further showed that 500 µg/mL of the GNPs can produce significant radiation dose enhancement (SER10 of 1.43) in the 9LGS cells, and the same concentration or greater can be used to produce a greater image contrast in CT when compared to the surrounding brain tissue. We saw stable congregation of the GNPs at ~500 µg/mL for at least 24 h in the gliosarcoma tumors in vivo, in agreement with the uptake observed in vitro with the same concentration at 24 h. We found the GNPs to be biocompatible, with no toxic effects from the GNPs in vivo up to 48 h or after 3 weeks with clonogenic assay (survival of (100 ± 10)%). Our results are promising for further study of GNPs for image-guided radiotherapy, showing that radiation doses to tumors can be escalated by the GNPs for better cancer control at concentrations that allow X-ray visualization of the tumor. By identifying usable GNP concentrations, we further provide data to encourage clinical translation of GNPs for radiotherapy.
Supplementary Materials
The following supporting information can be downloaded at: https://www.mdpi.com/article/10.3390/jnt4040021/s1, Figure S1: 9LGS tumor volume increase from day 11 to 14 using iodine contrast.
Author Contributions
Conceptualization, methodology, writing—review and editing, funding acquisition, supervision, project administration, M.T. Conceptualization, methodology, supervision, project administration, S.C. Conceptualization, writing—review and editing, funding acquisition, supervision, project administration, M.L. Conceptualization, methodology, formal analysis, investigation, data curation, visualization, writing—original draft, writing—review and editing, E.E. All authors have read and agreed to the published version of the manuscript.
Funding
This research was funded by an Australian Government Research Training Program Scholarship, two Australian National Health and Medical Research Council grants (APP1084994 and APP1093256), and community donations from the Arcadian Lamplighters Male Choir and Bulli Sea Lions, Australia.
Institutional Review Board Statement
The animal study protocol was approved by the Ethics Committee of the University of Wollongong (AE16/12, approved 17 October 2016).
Informed Consent Statement
Not applicable.
Data Availability Statement
The data presented in this study are available on request from the corresponding author. The data is not publicly available due to data Embargo and intellectual protection.
Acknowledgments
We acknowledge the access granted and facilities provided by Prince of Wales Hospital, Australia, University of Wollongong (UOW), Australia, Australia, and the University of Wollongong Animal House. We are grateful for support from the UOW animal research staff, UOW Animal Ethics Committee, and UOW Animal Welfare Officer Sarah Toole. We acknowledge Nan Li and Nathan Thorpe for their scientific input and experimental assistance for this work.
Conflicts of Interest
The authors declare no conflict of interest.
References
- Von Neubeck, C.; Seidlitz, A.; Kitzler, H.H.; Beuthien-Baumann, B.; Krause, M. Glioblastoma multiforme: Emerging treatments and stratification markers beyond new drugs. Br. J. Radiol. 2015, 88, 20150354. [Google Scholar] [CrossRef]
- Sizoo, E.M.; Braam, L.; Postma, T.J.; Roeline, H.; Pasman, W.; Heimans, J.J.; Klein, M.; Reijneveld, J.C.; Taphoorn, M.J.B. Symptoms and problems in the end-of-life phase of high-grade glioma patients. Neuro-Oncology 2010, 12, 1162–1166. [Google Scholar] [CrossRef]
- Wang, S.; Cheng, K.; Chen, K.; Xu, C.; Ma, P.; Dang, G.; Yang, Y.; Lei, Q.; Huang, H.; Yu, Y.; et al. Nanoparticle-based medicines in clinical cancer therapy. Nano Today 2022, 45, 101512. [Google Scholar] [CrossRef]
- Bonvalot, S.; Rutkowski, P.L.; Thariat, J.; Carrère, S.; Ducassou, A.; Sunyach, M.P.; Agoston, P.; Hong, A.; Mervoyer, A.; Rastrelli, M.; et al. NBTXR3, a first-in-class radioenhancer hafnium oxide nanoparticle, plus radiotherapy versus radiotherapy alone in patients with locally advanced soft-tissue sarcoma (Act.In.Sarc): A multicentre, phase 2-3, randomised, controlled trial. Lancet Oncol. 2019, 20, 1148–1159. [Google Scholar] [CrossRef] [PubMed]
- Hainfeld, J.F.; Slatkin, D.N.; Smilowitz, H.M. The use of gold nanoparticles to enhance radiotherapy in mice. Phys. Med. Biol. 2004, 49, 309–315. [Google Scholar] [CrossRef]
- Chen, Y.; Yang, J.; Fu, S.; Wu, J. Gold Nanoparticles as Radiosensitizers in Cancer Radiotherapy. Int. J. Nanomed. 2020, 15, 9407–9430. [Google Scholar] [CrossRef] [PubMed]
- Stewart, C.; Konstantinov, K.; McKinnon, S.; Guatelli, S.; Lerch, M.; Rosenfeld, A.; Tehei, M.; Corde, S. First proof of bismuth oxide nanoparticles as efficient radiosensitisers on highly radioresistant cancer cells. Phys. Medica 2016, 32, 1444–1452. [Google Scholar] [CrossRef]
- Engels, E.; Westlake, M.; Li, N.; Vogel, S.; Gobert, Q.; Thorpe, N.; Rosenfeld, A.; Lerch, M.; Corde, S.; Tehei, M. Thulium Oxide Nanoparticles: A new candidate for image-guided radiotherapy. Biomed. Phys. Eng. Express 2018, 4, 044001. [Google Scholar] [CrossRef]
- Mesbahi, A.; Jamali, F.; Garehaghaji, N. Effect of photon beam energy, gold nanoparticle size and concentration on the dose enhancement in radiation therapy. BioImpacts 2013, 3, 29–35. [Google Scholar]
- McMahon, S.J.; Hyland, W.B.; Muir, M.F.; Coulter, J.A.; Jain, S.; Butterworth, K.T.; Schettino, G.; Dickson, G.R.; Hounsell, A.R.; O’Sullivan, J.M.; et al. Biological consequences of nanoscale energy deposition near irradiated heavy atom nanoparticles. Sci. Rep. 2011, 1, 18. [Google Scholar] [CrossRef]
- Butterworth, K.T.; McMahon, S.J.; Taggart, L.E.; Prise, K.M. Radiosensitization by gold nanoparticles: Effective at megavoltage energies and potential role of oxidative stress. Transl. Cancer Res. 2013, 2, 269–279. [Google Scholar]
- Butterworth, K.T.; McMahon, S.J.; Currell, F.J.; Prise, K.M. Physical basis and biological mechanisms of gold nanoparticle radiosensitization. Nanoscale 2012, 4, 4830–4838. [Google Scholar] [CrossRef]
- Engels, E.; Bakr, S.; Bolst, D.; Sakata, D.; Li, N.; Lazarakis, P.; McMahon, S.J.; Ivanchenko, V.; Rosenfeld, A.B.; Incerti, S.; et al. Advances in modelling gold nanoparticle radiosensitization using new Geant4-DNA physics models. Phys. Med. Biol. 2020, 65, 225017. [Google Scholar] [CrossRef]
- Chithrani, B.D.; Ghazani, A.A.; Chan, W.C.W. Determining the Size and Shape Dependence of Gold Nanoparticle Uptake into Mammalian Cells. Nano Lett. 2006, 6, 662–668. [Google Scholar] [CrossRef] [PubMed]
- Bobyk, L.; Edouard, M.; Deman, P.; Vautrin, M.; Pernet-Gallay, K.; Delaroche, J.; Adam, J.F.; Estève, F.; Ravanat, J.L.; Elleaume, H. Photoactivation of gold nanoparticles for glioma treatment. Nanomed. Nanotechnol. Biol. Med. 2013, 9, 1089–1097. [Google Scholar] [CrossRef]
- Ferrero, V.; Visonà, G.; Dalmasso, F.; Gobbato, A.; Cerello, P.; Strigari, L.; Visentin, S.; Attili, A. Targeted dose enhancement in radiotherapy for breast cancer using gold nanoparticles, part 1: A radiobiological model study. Med. Phys. 2017, 44, 1983–1992. [Google Scholar] [CrossRef] [PubMed]
- Joh, D.Y.; Sun, L.; Stangl, M.; Al Zaki, A.; Murty, S.; Santoiemma, P.P.; Davis, J.J.; Baumann, B.C.; Alonso-Basanta, M.; Bhang, D.; et al. Selective targeting of brain tumors with gold nanoparticle induced radiosensitization. PLoS ONE 2013, 8, e62425. [Google Scholar] [CrossRef]
- Shang, L.; Nienhaus, K.; Nienhau, G. Engineered nanoparticles interacting with cells: Size matters. J. Nanobiotechnol. 2014, 12, 5. [Google Scholar] [CrossRef]
- Hainfeld, J.F.; Slatkin, D.N.; Focella, T.M.; Smilowitz, H.M. Gold nanoparticles: A new X-ray contrast agent. Br. J. Radiol. 2006, 79, 248–253. [Google Scholar] [CrossRef]
- Domey, J.; Teichgräber, U.; Hilger, I. Gold nanoparticles allow detection of early-stage edema in mice via computed tomography imaging. Int. J. Nanomed. 2015, 10, 3803–3814. [Google Scholar] [CrossRef]
- Cai, Q.Y.; Kim, S.H.; Choi, K.S.; Kim, S.Y.; Byun, S.J.; Kim, K.W.; Park, S.H.; Juhng, S.K.; Yoon, K.H. Colloidal gold nanoparticles as a blood-pool contrast agent for x-ray computed tomography in mice. Investig. Radiol. 2007, 42, 797–806. [Google Scholar] [CrossRef]
- Luo, D.; Johnson, A.; Wang, X.; Li, H.; Erokwu, B.O.; Springer, S.; Lou, J.; Ramamurthy, G.; Flask, C.A.; Burda, C.; et al. Targeted Radiosensitizers for MR-Guided Radiation Therapy of Prostate Cancer. Nano Lett. 2020, 20, 7159–7167. [Google Scholar] [CrossRef]
- Zhao, Y.; Sultan, D.; Detering, L.; Luehmann, H.; Liu, Y. Facile synthesis, pharmacokinetic and systemic clearance evaluation, and positron emission tomography cancer imaging of 64Cu-Au alloy nanoclusters. Nanoscale 2014, 6, 13501–13509. [Google Scholar] [CrossRef]
- Anker, J.N.; Hall, W.P.; Lyandres, O.; Shah, N.C.; Zhao, J.; Van Duyne, R.P. Biosensing with plasmonic nanosensors. Nat. Mater. 2008, 7, 442–453. [Google Scholar] [CrossRef]
- He, Y.Q.; Liu, S.P.; Kong, L.; Liu, Z.F. A study on the sizes and concentrations of gold nanoparticles by spectra of absorption, resonance Rayleigh scattering and resonance non-linear scattering. Spectrochim. Acta Part A 2005, 61, 2861–2866. [Google Scholar] [CrossRef]
- Penninckx, S.; Heuskin, A.-C.; Michiels, C.; Lucas, S. Gold Nanoparticles as a Potent Radiosensitizer: A Transdisciplinary Approach from Physics to Patient. Cancers 2020, 12, 2021. [Google Scholar] [CrossRef] [PubMed]
- Verry, C.; Dufort, S.; Villa, J.; Gavard, M.; Iriart, C.; Grand, S.; Charles, J.; Chovelon, B.; Cracowski, J.L.; Quesada, J.L.; et al. Theranostic AGuIX nanoparticles as radiosensitizer: A phase I, dose-escalation study in patients with multiple brain metastases (NANO-RAD trial). Radiother. Oncol. 2021, 160, 159–165. [Google Scholar] [CrossRef]
- Stetefeld, J.; McKenna, S.A.; Patel, T.R. Dynamic light scattering: A practical guide and applications in biomedical sciences. Biophys. Rev. 2016, 8, 409–442. [Google Scholar] [CrossRef] [PubMed]
- Kim, C.S.; Li, X.; Jiang, Y.; Yan, B.; Tonga, G.Y.; Ray, M.M.; Solfiell, D.J.; Rotello, V.M. Cellular imaging of endosome entrapped small gold nanoparticles. MethodsX 2015, 2, 306–315. [Google Scholar] [CrossRef]
- Schindelin, J.; Arganda-Carreras, I.; Frise, E.; Kaynig, V.; Longair, M.; Pietzsch, T.; Preibisch, S.; Rueden, C.; Saalfeld, S.; Schmid, B.; et al. Fiji: An open-source platform for biological-image analysis. Nat. Methods 2012, 9, 676–682. [Google Scholar] [CrossRef] [PubMed]
- Bahamonde, J.; Brenseke, B.; Chan, M.Y.; Kent, R.D.; Vikesland, P.J.; Prater, M.R. Gold Nanoparticle Toxicity in Mice and Rats: Species Differences. Toxicol. Pathol. 2018, 46, 431–443. [Google Scholar] [CrossRef] [PubMed]
- Leopold, L.; Todor, I.; Diaconeasa, Z.; Rugină, D.; Ştefancu, A.; Leopold, N.; Coman, C. Assessment of PEG and BSA-PEG gold nanoparticles cellular interaction. Colloids Surf. A Physicochem. Eng. Asp. 2007, 532, 70–76. [Google Scholar] [CrossRef]
- Corde, S.; Joubert, A.; Adam, J.; Charvet, A.M.; Le Bas, J.F.; Estève, F.; Elleaume, H.; Balosso, J. Synchrotron radiation-based experimental determination of the optimal energy for cell radiotoxicity enhancement following photoelectric effect on stable iodinated compounds. Br. J. Cancer 2004, 91, 544–551. [Google Scholar] [CrossRef]
- McMahon, S.J. The linear quadratic model: Usage, interpretation and challenges. Phys. Med. Biol. 2019, 64, 01TR01. [Google Scholar] [CrossRef] [PubMed]
- Goodhead, D.T. Initial Events in the Cellular Effects of Ionizing Radiations: Clustered Damage in DNA. Int. J. Radiat. Biol. 1994, 65, 7–17. [Google Scholar] [CrossRef]
- Nowotny, R. XMuDat: Photon Attenuation Data on PC, Version 1.0.1. IAEA-NDS-195 International Atomic Energy Agency, Vienna, Austria. 1998. Available online: http://www.mds.iaea.or.at/reports/mds-195.htm (accessed on 24 September 2023).
- Poludniowski, G.; Landry, G.; DeBlois, F.; Evans, P.M.; Verhaegen, F. SpekCalc: A program to calculate photon spectra from tungsten anode X-ray tubes. Phys. Med. Biol. 2009, 54, 433–438. [Google Scholar] [CrossRef] [PubMed]
- McKinnon, S.; Engels, E.; Tehei, M.; Konstantinov, K.; Corde, S.; Oktaria, S.; Incerti, S.; Lerch, M.; Rosenfeld, A.; Guatelli, S. Study of the effect of ceramic Ta2O5 nanoparticle distribution on cellular dose enhancement in a kilovoltage photon field. Phys. Med. 2016, 32, 1216–1224. [Google Scholar] [CrossRef] [PubMed]
- Engels, E.; Corde, S.; McKinnon, S.; Incerti, S.; Konstantinov, K.; Rosenfeld, A.; Tehei, M.; Lerch, M.; Guatelli, S. Optimizing dose enhancement with Ta2O5 nanoparticles for synchrotron microbeam activated radiation therapy. Phys. Med. 2016, 32, 1852–1861. [Google Scholar]
- Brown, R.; Tehei, M.; Oktaria, S.; Briggs, A.; Stewart, C.; Konstantinov, K.; Rosenfeld, A.; Corde, S.; Lerch, M. High-Z nanostructured ceramics in radiotherapy: First evidence of Ta2O5-induced dose enhancement on radioresistant cancer cells in an MV photon field. Part. Part. Syst. Charact. 2014, 31, 500–505. [Google Scholar] [CrossRef]
- Berger, M.J.; Coursey, J.S.; Zucker, M.A.; Chang, J. ESTAR, PSTAR, and ASTAR: Computer Programs for Calculating Stopping-Power and Range Tables for Electrons, Protons, and Helium Ions (Version 1.2.3); National Institute of Standards and Technology: Gaithersburg, MD, USA, 2005. Available online: http://physics.nist.gov/Star (accessed on 24 September 2023).
- Dobešová, L.; Gier, T.; Kopečná, O.; Pagáčová, E.; Vičar, T.; Bestvater, F.; Toufar, J.; Bačíková, A.; Kopel, P.; Fedr, R.; et al. Incorporation of Low Concentrations of Gold Nanoparticles: Complex Effects on Radiation Response and Fate of Cancer Cells. Pharmaceutics 2022, 14, 166. [Google Scholar] [CrossRef]
- Pagáčová, E.; Štefančíková, L.; Schmidt-Kaler, F.; Hildenbrand, G.; Vičar, T.; Depeš, D.; Lee, J.H.; Bestvater, F.; Lacombe, S.; Porcel, E.; et al. Challenges and Contradictions of Metal Nano-Particle Applications for Radio-Sensitivity Enhancement in Cancer Therapy. Int. J. Mol. Sci. 2019, 20, 588. [Google Scholar] [CrossRef] [PubMed]
- Engels, E.; Li, N.; Davis, J.A.; Paino, J.; Cameron, M.; Dipuglia, A.; Vogel, S.; Valceski, M.; Khochaiche, A.; O’Keefe, A.; et al. Toward personalized synchrotron microbeam radiation therapy. Sci. Rep. 2020, 10, 8833-1–8833-13. [Google Scholar] [CrossRef] [PubMed]
- Brönnimann, D.; Bouchet, A.; Schneider, C.; Potez, M.; Serduc, R.; Bräuer-Krisch, E.; Graber, W.; von Gunten, S.; Laissue, J.A.; Djonov, V. Synchrotron microbeam irradiation induces neutrophil infiltration, thrombocyte attachment and selective vascular damage in vivo. Sci. Rep. 2016, 6, 33601. [Google Scholar] [CrossRef] [PubMed]
- Le Duc, G.; Miladi, I.; Alric, C.; Mowat, P.; Bräuer-Krisch, E.; Bouchet, A.; Khalil, E.; Billotey, C.; Janier, M.; Lux, F.; et al. Toward an Image-Guided Microbeam Radiation Therapy Using Gadolinium-Based Nanoparticles. ACS Nano 2011, 5, 9566–9574. [Google Scholar] [CrossRef] [PubMed]
Figure 1.
Dynamic light scatter output of the Malvern Zetasizer system analysis of 1 mg/mL GNPs, including raw correlation data (a) and size distribution in solution (b).
Figure 1.
Dynamic light scatter output of the Malvern Zetasizer system analysis of 1 mg/mL GNPs, including raw correlation data (a) and size distribution in solution (b).

Figure 2.
Optimal absorbance of AuroVistTM GNPs at concentrations of 0.125–0.625 mg/mL in DPBS, measured with a SpectraMax plate reader.
Figure 2.
Optimal absorbance of AuroVistTM GNPs at concentrations of 0.125–0.625 mg/mL in DPBS, measured with a SpectraMax plate reader.

Figure 3.
Confocal microscopy images of 9LGS cells acquired with 63× oil objective lens without GNPS (a) incubated with 50 µg/mL (b) and with 500 µg/mL (c) GNPs. Images are projected over 16 µm (42 slices in 0.38 µm steps) and the brightfield and 488 nm laser illuminated channels are overlayed. A summary of the estimated quantity of GNPs from the confocal images is shown for each GNP concentration (n = 15) (d). GNP uptake was also investigated with FACS (10,000 events, n = 3) using 50 µg/mL of GNPs incubated with 9LGS cells for 24 h and 48 h (e).
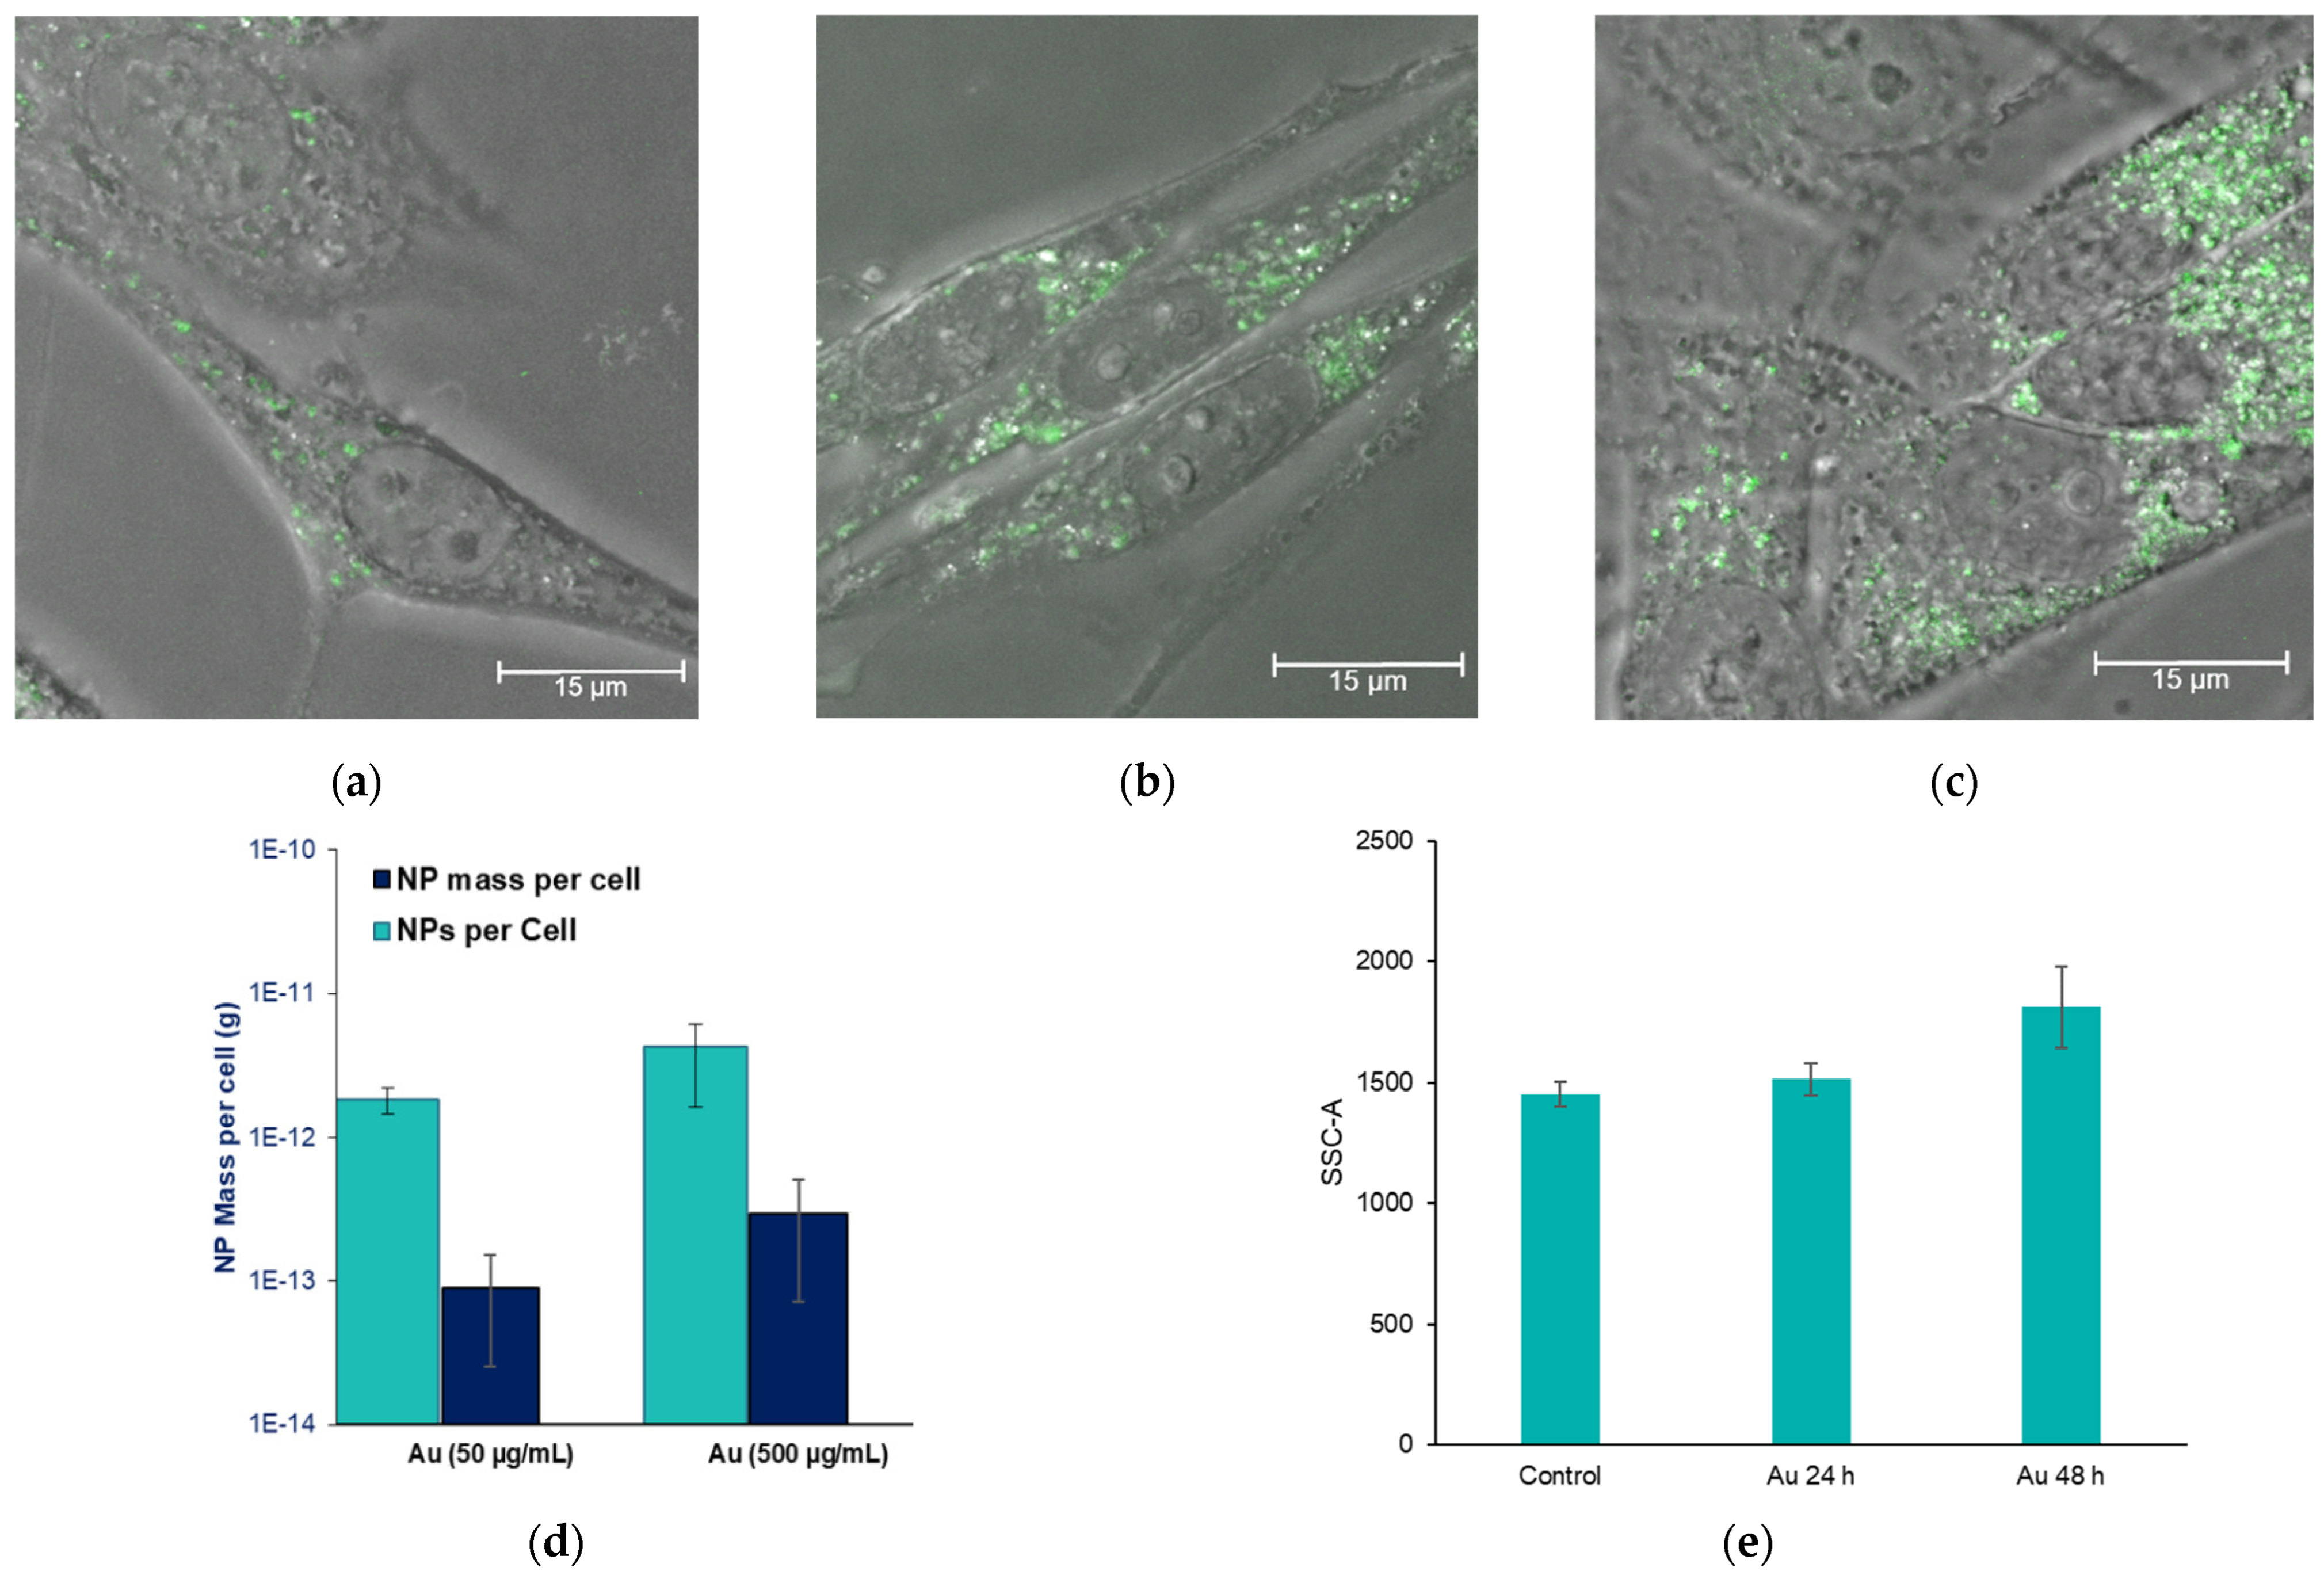
Figure 4.
Clonogenic assay survival data following irradiation of 9LGS cells with and without GNPs in concentrations of 50 µg/mL and 500 µg/mL (also shown in [13]). Survival curves are fitted with the linear quadratic model equation [34].
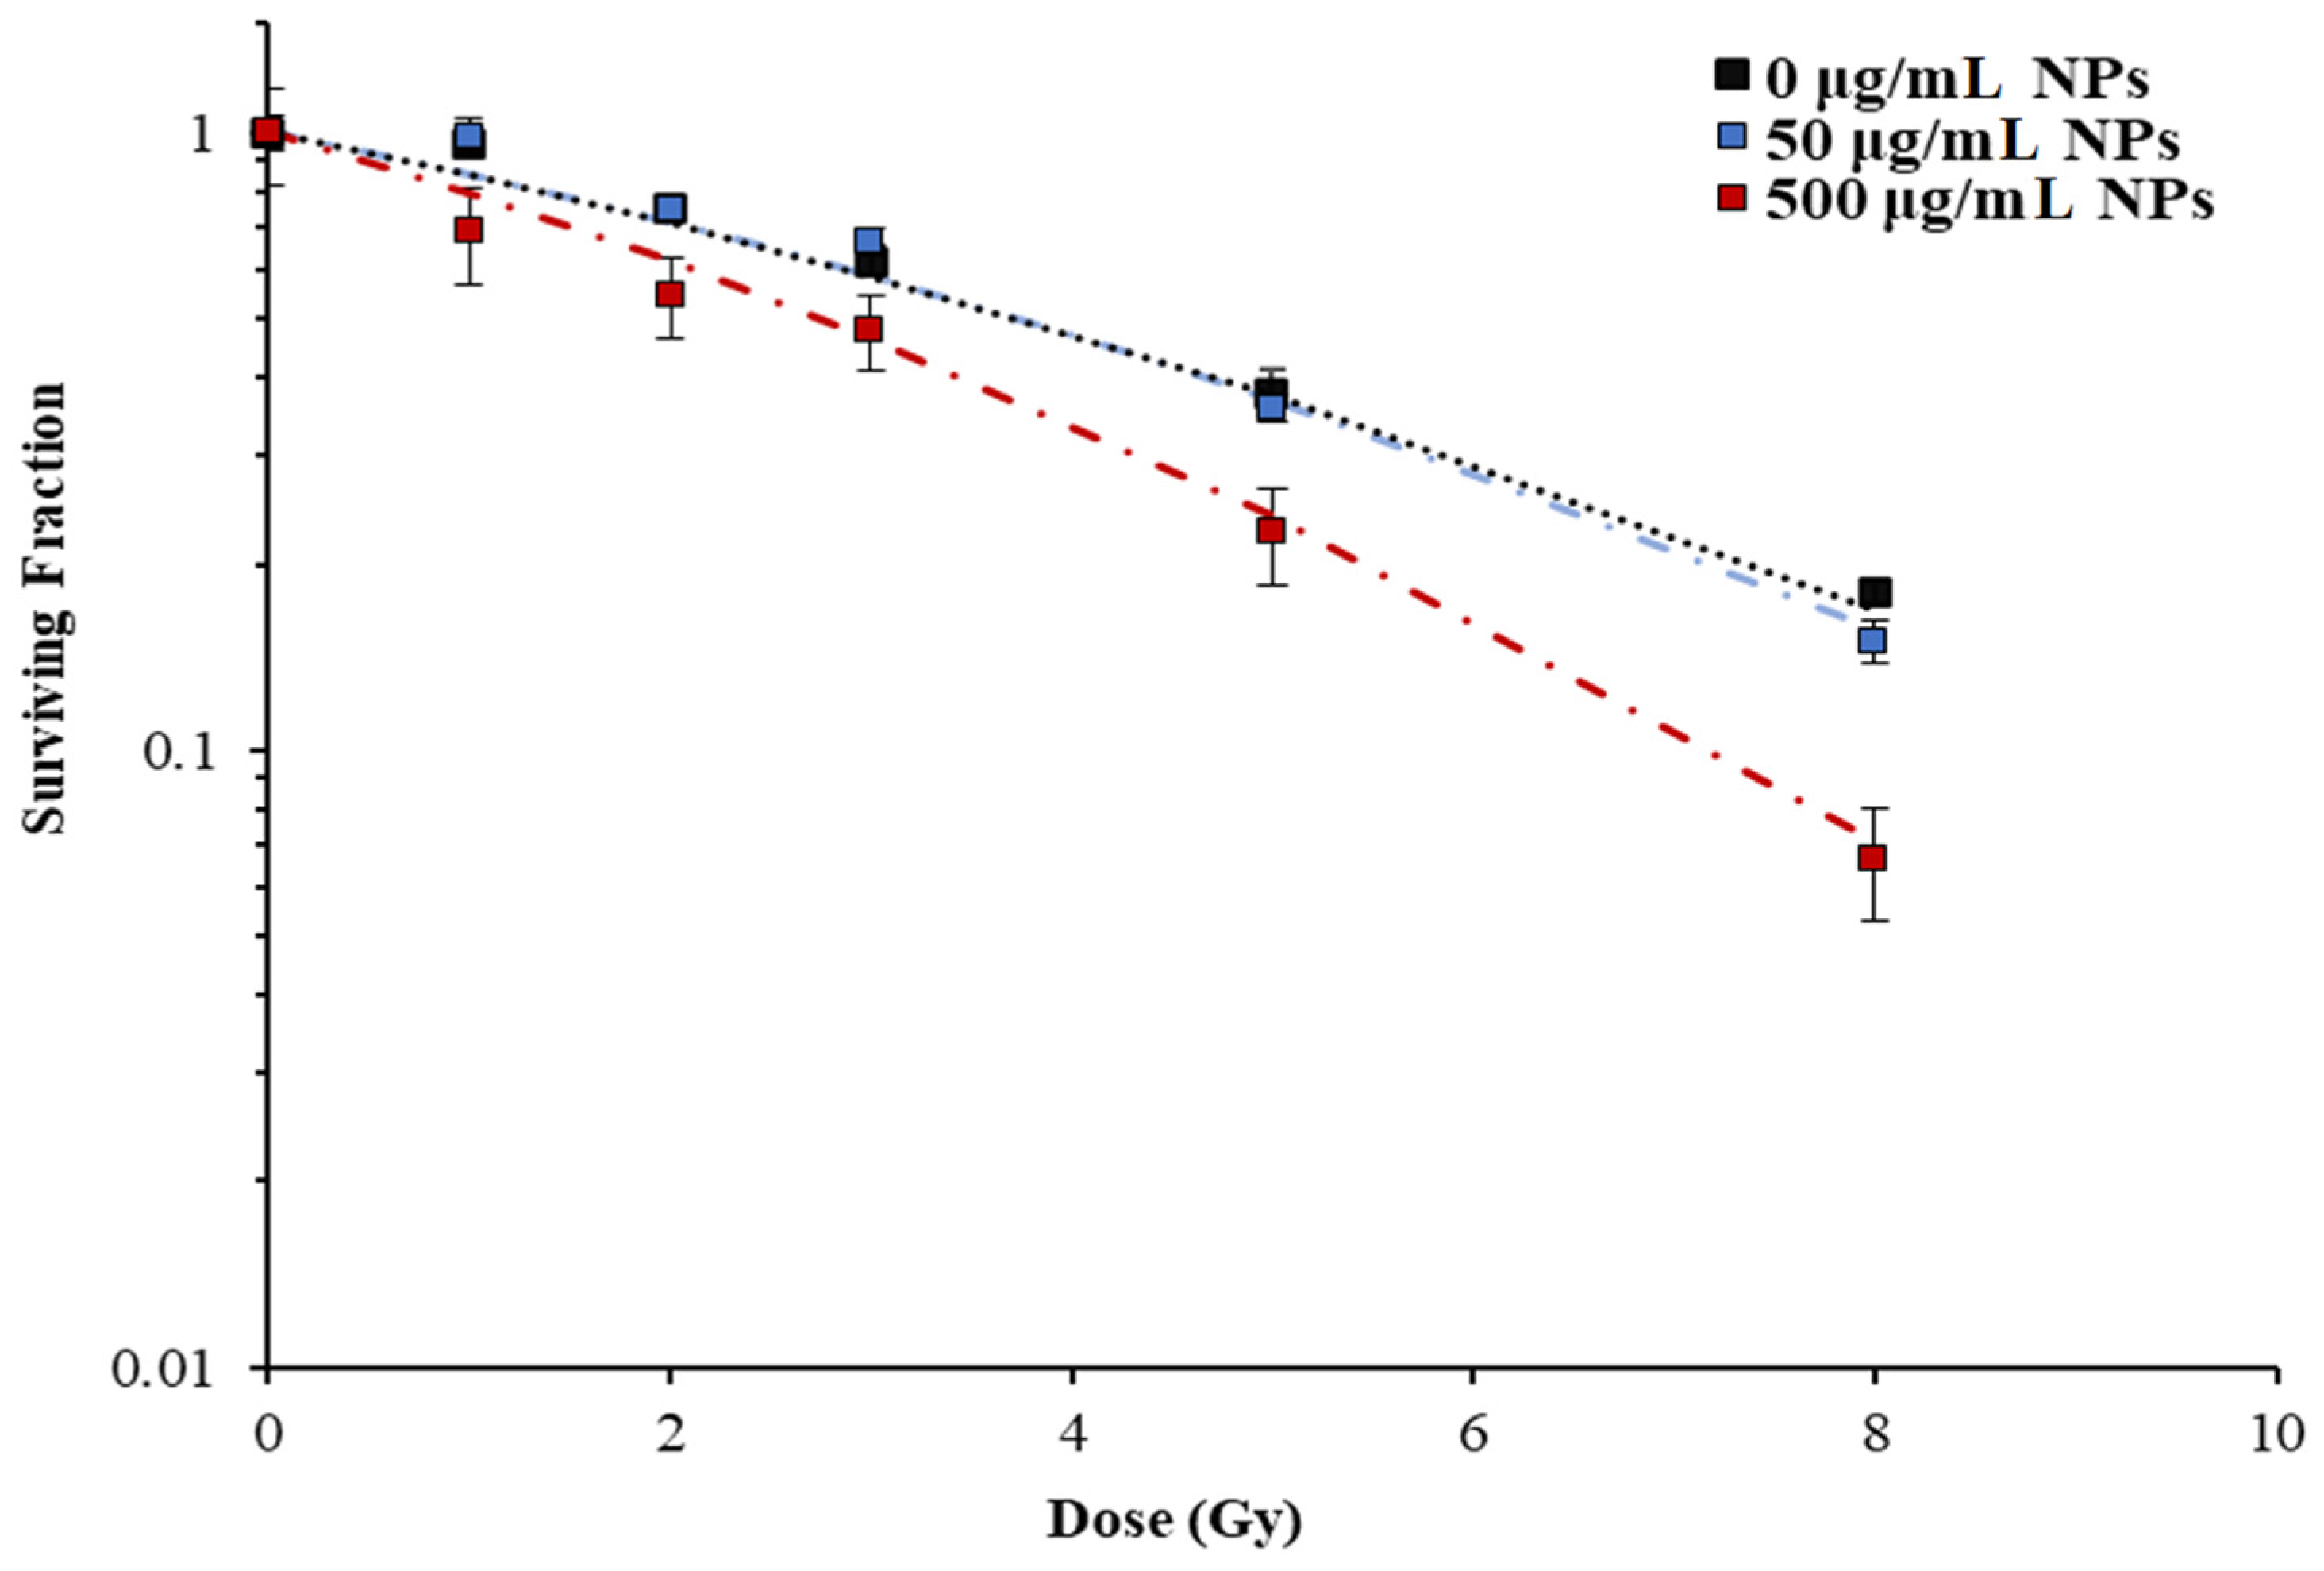
Figure 5.
DNA damage quantification using γ-H2AX confocal imaging following 2 Gy irradiation of 9LGS with GNPs (0–500 µg/mL) using 125 kVp and 150 kVp X-rays. A projection of γ-H2AX foci produced by the 150 kVp X-rays is shown overlayed with brightfield (a), including an insert of the 488 nm channel in one slice for three cells in each group. Confocal images were obtained 61–74 individual cells over four sets to obtain the average number (b) and area (c) of the foci of each treatment. The mass energy absorption coefficient ratio of gold to water [36] is compared with the 125 kVp and 150 kVp spectra generated with SpekCalc [37], (d).


Figure 6.
GNP CT contrast, uptake, and diffusion with time in 9LGS tumors. Overall, 100 kVp images were acquired with a Toshiba Asteion following GNP injection up to 48 h (a). The contrast enhancement ratio was determined between the tumor with GNPs to the brain (b). The GNP concentration and corresponding image contrast were compared using 100 kVp and 120 kVp CTs (c), which determined the measured concentration of GNPs in the tumor at 4 h, 24 h, and 48 h (d). This was compared with the calculated GNP concentration in the tumors using the 40 µg in tumor volumes from day 12 to day 14 (48 h) (e).

Table 1.
Summary of survival results in Figure 4. Radiobiological parameters, α and β, were derived from the linear quadratic model, and the sensitization enhancement ratio (SER10) was calculated from the linear quadratic fit as the ratio of the control dose to the GNP dose at 10% survival. Some survival data from 0 µg/mL and 500 µg/mL of GNPs were shown previously [13].
| Treatment | α (Gy−1) | β (Gy−2) | SER10 |
|---|---|---|---|
| 150 kVp, 0 µg/mL GNPs | 0.13 ± 0.03 | 0.0011 ± 0.008 | 1 |
| 150 kVp, 50 µg/mL GNPs | 0.13 ± 0.04 | 0.015 ± 0.005 | 1.13 |
| 150 kVp, 500 µg/mL GNPs | 0.33 ± 0.03 | 0 | 1.43 |
Disclaimer/Publisher’s Note: The statements, opinions and data contained in all publications are solely those of the individual author(s) and contributor(s) and not of MDPI and/or the editor(s). MDPI and/or the editor(s) disclaim responsibility for any injury to people or property resulting from any ideas, methods, instructions or products referred to in the content. |
© 2023 by the authors. Licensee MDPI, Basel, Switzerland. This article is an open access article distributed under the terms and conditions of the Creative Commons Attribution (CC BY) license (https://creativecommons.org/licenses/by/4.0/).
Share and Cite
MDPI and ACS Style
Engels, E.; Lerch, M.; Corde, S.; Tehei, M. Efficacy of 15 nm Gold Nanoparticles for Image-Guided Gliosarcoma Radiotherapy. J. Nanotheranostics 2023, 4, 480-495. https://doi.org/10.3390/jnt4040021
AMA Style
Engels E, Lerch M, Corde S, Tehei M. Efficacy of 15 nm Gold Nanoparticles for Image-Guided Gliosarcoma Radiotherapy. Journal of Nanotheranostics. 2023; 4(4):480-495. https://doi.org/10.3390/jnt4040021
Chicago/Turabian StyleEngels, Elette, Michael Lerch, Stéphanie Corde, and Moeava Tehei. 2023. "Efficacy of 15 nm Gold Nanoparticles for Image-Guided Gliosarcoma Radiotherapy" Journal of Nanotheranostics 4, no. 4: 480-495. https://doi.org/10.3390/jnt4040021