
Graphene Oxide Chemical Refining Screening to Improve Blood Compatibility of Graphene-Based Nanomaterials

1
Department of Chemical Sciences, University of Padova, 35131 Padova, Italy
2
Department of Biomedical Sciences, University of Padova, 35131 Padova, Italy
*
Authors to whom correspondence should be addressed.
J. Nanotheranostics 2024, 5(1), 13-28; https://doi.org/10.3390/jnt5010002
Submission received: 21 December 2023
/
Revised: 2 February 2024
/
Accepted: 6 February 2024
/
Published: 20 February 2024
(This article belongs to the Special Issue Carbon Nanomaterials as Nano-Theranostic Tools in Disease Treatment)
Abstract
:Graphene oxide (GO) nanoparticles, due to their favorable water solubility, compared to graphene (GA), are a hot research topic in biomedical and pharmaceutical research. However, GO clinical translation may be complicated by its high surface/volume ratio enhancing the interaction with human blood components. In fact, GO’s bi-dimensional nature and strong negative charge may lead to severe biological effects, such as thrombogenicity and immune cell activation. This study explores the impact of further GO surface chemical modulation on major adverse effects: blood plasma coagulation and hemolysis. To this aim, we refined GO nanoparticles by fine-tuned reduction chemistry, esterification and introduction of negative or positive charges. With this approach, we were able to mitigate plasma coagulation and hemolysis at variable degrees and to identify GO derivatives with improved biocompatibility. This opens the door to the progress of graphene-based nanotheranostic applications.
1. Introduction
Recent years have seen a burst of biomedical research on graphene-based materials (GBMs), due to the appealing physical and chemical properties of this family of nanomaterials [1,2]. GO and GO derivatives display a large set of toxicological effects in vitro and could generate variable adverse pathophysiological phenomena in vivo [3]. Hemocompatibility is the first biological action to be screened due to the rapid interaction of the material with blood solutes and cellular elements. Adverse effects of NPs and their derivatives and especially their potential interaction with plasma proteins and blood cells, the first being RBC, is an extraordinarily important subject that must be rigorously addressed [4,5]. Our choice to test RBC damage and lysis due to GO derivatives may be of special interest for the study of drug delivery using RBC as carriers [6,7,8,9]. Indeed, the membrane of RBC may be re-arranged (for example, increasing its rigidity) by the RBC-associated nanosystems in these applications, negatively impacting their medical translation [10,11,12].
The destabilization of red blood cells can lead to hemolysis and T-cell cytotoxicity [13,14,15]; moreover, it has been demonstrated that glomerular cells also display susceptibility to hemolysis [16] and red blood cell breakdown can lead to sudden kidney failure [17]. However, the formation of a protein “corona”, or the adsorption of serum proteins to the GO, has been shown to mitigate cell and red blood cell (RBC) toxicity [18,19,20], likely due to the nanosurface masking effect. Previous studies [21] showed that amino-functionalized, positively charged GO has a reduced hemolytic and thrombogenic activity, compared to negatively charged GO. In such an approach, the GO carboxylic groups were replaced by amino groups, and this resulted in a reduction in platelet activation and aggregation.
However, plasma coagulation also involves the possible activation of the “contact” coagulation cascade, where the plasma FXII (or Hageman Factor) initiates the cascade leading to fibrin deposition by recognizing surfaces with proper features. Among these features the administration of high surfaces with a negative charge, as is the case of GO, which is very critical.
The nomenclature given to GBM as well as the various methods of synthesis denote a source of misperception since, in some scientific works, what authors describe as graphene/functionalized graphene is another member of this ultrathin carbon family and this leads to (sometimes apparent) contradictions in the results ascribed to the same GBM [22,23]. If we try to narrow down the specific GO family, the effects of GO on biological systems are often compared to its reduced form, named reduced graphene oxide (rGO). Like GO, rGO can be obtained with several protocols and can be categorized by variable C/O atom ratios [24]. In some other works, GO has been compared to GBMs that are physically and chemically (i.e., addition of heteroatoms or molecules) different from rGO. Thus, the in vivo fate of the entire GBMs is largely influenced by several factors, including the way of administration, the intrinsic nanomaterial chemistry and the composition of the physiological environment. As a result, the biological outcome of GBM cannot be fully rationalizable [25,26]. Moreover, different studies have validated that GO functionalization with different chemical groups significantly reduces toxicity and enhances the biocompatibility of graphene (reviewed in [3]). Various physicochemical characteristics including lateral size, shape, dose, exposure time, number of layers, chemical composition, surface charge, stability, purity, and surface functionality can influence the fate after injection when materials are bare to the rich milieu of blood proteins [27,28,29]. The proteins in the bloodstream can determine a fast and dramatic change in the biological “identity” of nanomaterials. The ending result is the development of a new interface, consisting of a dynamic shell of blood macromolecules. This layer, given the protein enrichment, is usually named the protein corona or the biomolecular corona (BC) [30,31]. The BC, in general, has been reported to have a strong influence on the interactions between nanoparticles and cells, for example, improving their uptake and clearance by phagocytes. Recent studies have investigated molecular interactions of GO with human blood plasma proteins [32]. The existence of size-dependent interactions between GO nanoflakes and albumin, fibrinogen and globulin [31] was demonstrated and this effect influences the overall biodistribution and the effective delivery of nanotheranostic to planned target sites [33]. In another recent study, the focus was on the interaction of GO flakes with human serum albumin (HSA), both in its isolated state and in blood plasma conditions. In the isolated HSA case at low ionic strength, strong binding interactions between GO flakes and HSA were observed. However, it was found that HSA–GO molecular interactions were significantly hampered in blood plasma, showing that ionic strength is particularly important for these interactions [34]. Thus, to date, the BC role of GO and its rGO forms needs to be fully explored to better understand the impact of this biomolecular layer for an improved understanding to move their application, safely, in in vitro and in vivo models.
In this work, we want to shed light on these inconsistencies. In particular, we will consider the link between the chemical properties of graphene oxide (and its functionalized/reduced derivatives), the protein binding and the in vitro response. We focus on GO due to its low-cost production and hydrophilic nature, which still make it preferable to other GBMs. Starting from GO, we fine-modified the surface C/O ratio by hydrazine reduction [35,36,37] and hence also the charge (ζ-potential), a parameter which was expected to influence the interaction with soluble and cell-displayed host biomolecules. Subsequently, we tested the hemolytic activity, i.e., the ability to induce RBC lysis, of all formulations (both reduced GO and functionalized GO) first in a protein-free buffer and then in a more physiological buffer containing 60% of human serum. All GO derivatives were then tested for their ability to alter the kinetics of spontaneous coagulation of human plasma.
2. Materials and Methods
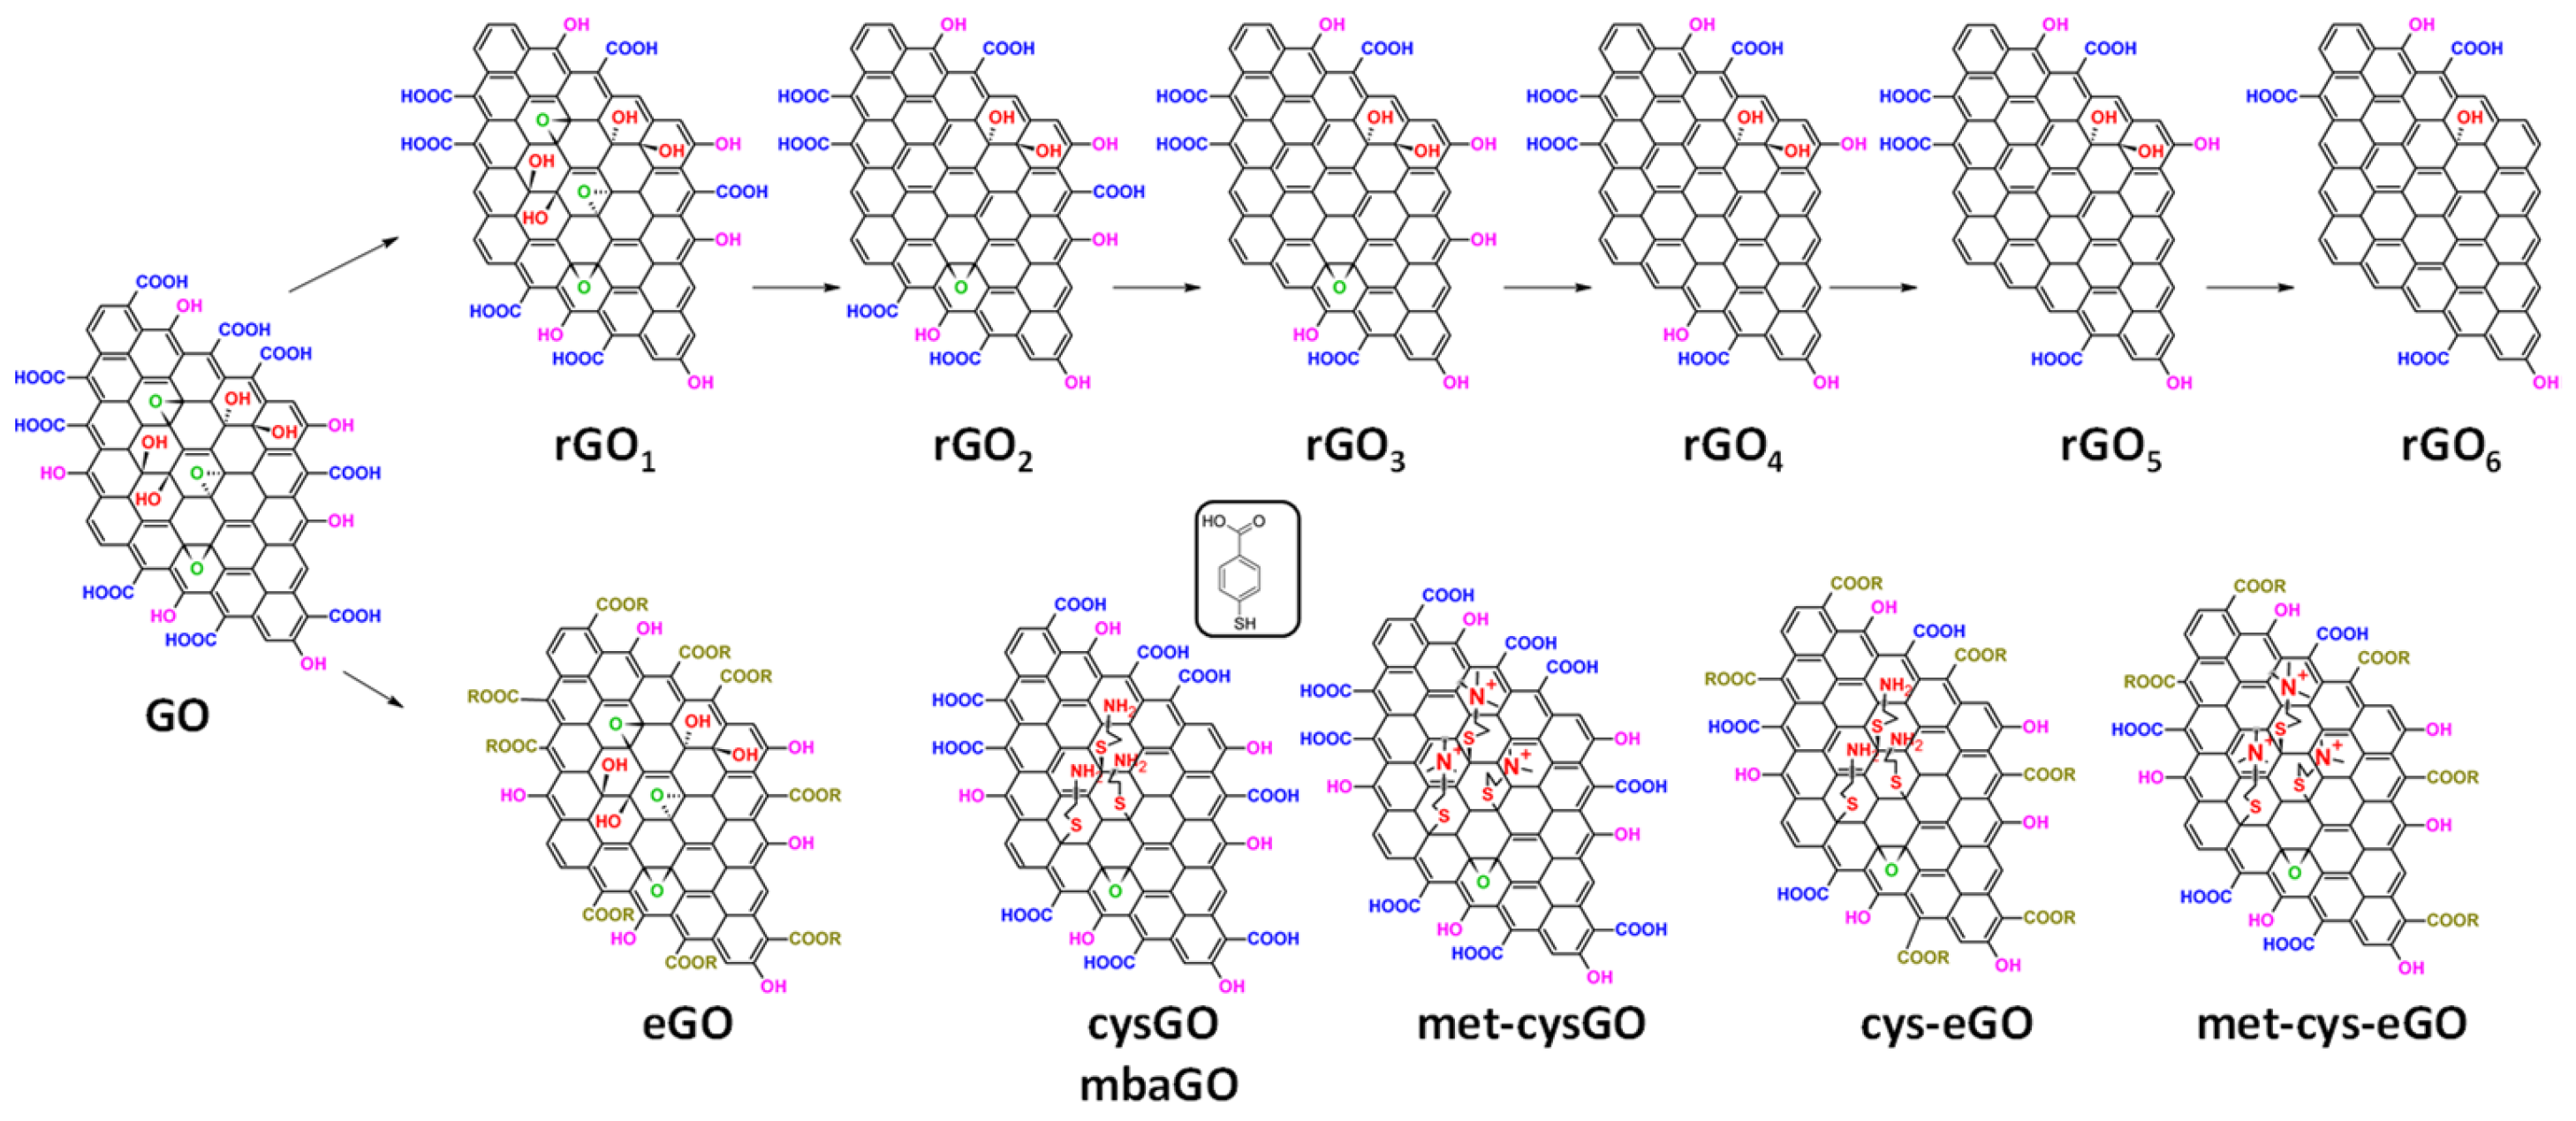
The synthetic name and the schematic chemical structure of GO and the GO-derived compounds studied in this work are summarized below (see Scheme 1):
2.1. GO Synthesis
GO was synthesized from graphite powder using a modified Hummer’s method: 1 g of graphite powder was slowly added to a 9:1 mixture of H2SO4 and H3PO4 (25 mL) in an ice water bath, 3 g of KMnO4 was added and the solution was stirred for a whole day at room temperature. After that, the solution was sonicated for 1 h at 35 °C to completely exfoliate the oxidized graphite. Deionized water (50 mL) was added slowly to the solution, the temperature rapidly increased to 98 °C due to the dilution of the present strong acids, the solution was maintained at this temperature for 20 min. Successively, another 140 mL of deionized water was added, and the temperature was lowered to 60 °C. At this point, 2 mL of H2O2 (30% solution in water) was added dropwise to reduce the residual KMnO4, and the solution was stirred for 30 min, sonicated for 1 h, stirred again for 30 min and sonicated for 1 h. The solution was repeatedly centrifuged to collect the solid product, then it was dialyzed versus milliQ water for a whole week to remove the residual salts. The obtained water solution of GO was freeze-dried to obtain the solid product.
2.2. GO Reduction with Hydrazine (rGO)1–6
A set of samples (rGO)1–6 showing a different degree of reduction in GO were obtained as follows: 250 mg of GO was added to 100 mL of water and sonicated in a beaker for 15 min. The dark brown dispersion was then transferred in a 250 mL three-necked round-bottom flask and the suspension pH was then brought to pH 10 by slowly adding a solution of NH3/H20 1M from an initial value of pH 2.7. Before starting the reaction, 20 mL of the dispersion was taken out as the starting point of the reaction. The volume of hydrazine hydrate added was adjusted during the course of the reaction course, starting from 12.5 μL. The degree of reduction at different times of the reaction was monitored by recording the UV spectra of several aliquots of samples. By monitoring the reaction, a considerable reduction was observed only after 17 h from its beginning. Thus, a sample of 6.25 mL was then taken out from the reaction (rGO1). Successively, another 5 μL of hydrazine hydrate was added to the reaction vessel. After 1 h from the addition, another sample of 6.25 mL was taken out (rGO2). The reaction was then monitored for an additional 24 h showing any change in the degree of reduction. Thus, another 6 μL of hydrazine hydrate was added showing an acceleration in the chemical reduction process. Subsequently, four samples of 6.25 mL each were taken after, respectively, 1, 2, 6, 11 h from the last addition of hydrazine. Samples are named, respectively, (rGO3), (rGO4), (rGO5), (rGO6). All samples were then dialyzed and lyophilized. Elemental analyses, ζ-potential, UV-Vis and FT-IR spectra were recorded from these samples.
2.3. Esterification of GO (eGO)
200 mg of GO was dispersed in 100 mL of DMF. After 15 min of sonication, 10 mL of methanol and 1 mL of trimethylsilyldiazomethane (TMS-DAM) were added to the mixture in a round-bottom flask and plugged with N2 at 40 °C for 3 h. The mixture was then vacuum filtered and washed 2 times with methanol, dichloromethane and diethyl ether. A total mass of 113 mg of a solid brown product was obtained.
2.4. Functionalization of GO with Cysteamine (cysGO)
Following the procedure of Luong et al. [38] 100 mg of GO was dispersed with 50mL of DMF in a three-necked round-bottom flask. The dark brown dispersion was sonicated for 30 min. Afterwards, a magnetic stirrer was added, and the dispersion was placed in an inert environment by air removal and nitrogen bubbling. In a septate vessel, 56 mg of azobisisobutyronitrile (AIBN, thermal initiator) and 78 mg of HCl*cysteamine were mixed with 5 mL of DMF. The mixture was added by a syringe to the three-necked round-bottom flask and another cycle of air removal/nitrogen bubbling was performed to keep the reaction environment inert. To initiate the reaction, the obtained mixture was heated to 70 °C and kept at this temperature for 12 h. A solution of NaOH (1M) in ethanol/water mixture (15:5 mL) was then added under stirring in order to achieve an alkaline pH. The solid product was then collected with vacuum filtration and washed twice with ethanol and 3 times with water, in order to remove impurities. After several washing steps with dichloromethane and diethyl ether, 156 mg of product was obtained. To qualitatively test the presence of amine groups in the synthesized material, a Kaiser test was performed. The purple colour confirmed the occurrence of the chemical functionalization.
2.5. GO Functionalization with Mercaptobenzoic Acid (mbaGO)
Following the procedure of Luong et al. [38], 100 mg of GO was dispersed with 50 mL of DMF in a three-necked round-bottom flask. The dark brown dispersion was sonicated for 30 min. Afterwards, a magnetic stirrer was added, and the dispersion was set in an inert environment by air removal and nitrogen bubbling. In a septate vessel, 56 mg of AIBN and 105 mg of mercaptobenzoic acid were mixed with 5 mL of DMF. The mixture was added by a syringe in the three-necked round-bottom flask and another cycle of air removal/nitrogen bubbling was made to keep the reaction environment inert. In order to make the reaction start, the obtained mixture was heated to 70 °C and kept at this temperature for the next 12 h. The solid product was then collected with vacuum filtration and washed two times with ethanol and 3 times with water, in order to remove impurities. After several washing steps with dichloromethane and diethyl ether, 82 mg of product was obtained.
2.6. Ester GO Functionalization with Cysteamine (cys-eGO)
Previously obtained eGO (100 mg) was used and the mass of AIBN and cysteamine hydrochloride was doubled (112 mg and 156 mg, respectively). The reaction was conducted for three days instead of one. At the end of the reaction time, to neutralize the acid pH, 40 mL (30 mL ethanol and 10 mL water) of NaOH 0.1 M was added to the mixture. This was vacuum filtered and washed with water, DCM and Et2O. A solid black product with a mass of 96 mg was obtained.
2.7. Methylation of Cysteamine Functionalized GO (met-cysGO)
Previously obtained cysGO (78 mg) was dispersed with 25 mL of DMF in a 50 mL round-bottom flask. After 15 min of sonication, 500 μL of iodomethane (as a large excess) and 500 μL of DIPEA were added. The reaction was kept under stirring for one day. The mixture was then vacuum-filtered and washed first with ethanol and subsequently with DCM and Et2O. The final product was composed of black flakes with a total mass of 45 mg.
2.8. Methylation of Cysteamine Functionalized GO Ester (met-cys-eGO)
Previously obtained cys-eGO (50 mg) was used for the methylation reaction. The procedure used was the same as reported for the methylation of met-cysGO; thus, analogue volumes of DMF, iodomethane and DIPEA were used. After filtration and washings with EtOH, DCM and Et2O, 31 mg of solid black product was obtained.
2.9. Compounds Characterization
UV absorption spectra were carried out with 1mL quartz cuvettes on a Shimadzu UV-2501PC.
FT-IR spectra were obtained by measuring the transmittance of KBr tablets with an FT-IR Nexus spectrometer.
ζ-potential values were obtained with suspension of the nanoparticles at a concentration of 0.01 mg/mL and a pH around 10 with a dynamic light scattering set-up of a DLS Zetasizer NanoS.
PBS buffer at pH 10 was chosen as the solvent for UV-VIS and ζ-potential analyses because, at this pH, we observed the maximum solubility for all the investigated GO samples.
Information about the elemental composition of our solid compounds was obtained by a Thermo Scientific FLASH 2000 CHNS analyzer (Thermo Scientific, Waltham, MA, USA) using a method called dynamic flash combustion.
2.10. Procoagulant Activity Assay
Selected compound suspensions were dissolved at the concentration of 0.5 mg/mL in deionized water and subjected to water bath sonication (30 min, 286 W, 35 kHz). Frozen citrated plasma was thawed at 37 °C for 30 min using a thermoblock and centrifuged at 10,000 rpm for 8 min to remove any platelets and debris. Serial dilutions of compounds (50 μg/mL, 5 μg/mL, 500 ng/mL, 50 ng/mL, 5 ng/mL and 2.5 ng/mL) were made in 150 mM NaCl.
Plasma (80 μL/well) was loaded onto a 96-well microtiter plate and mixed with 100 μL/well of each serial dilution, in duplicate, or with 150 mM NaCl as negative control (spontaneous coagulation). Coagulation was initiated by adding 20 μL of 150 mM CaCl2 per well and microtiter plates were then inserted in the plate reader (Skanit 4.1, Thermo Scientific, Waltham, MA, USA 02451), set at 37 °C. The coagulation kinetics were monitored in the following 90 min by reading the absorbance of each well (405 nm) every 1 min.
2.11. Hemolytic Activity Assay
RBCs, obtained from buffy coats of healthy human volunteers (kindly provided by the transfusion centre of the hospital of Padova, Italy), were washed three times with PBS by centrifuging at 2000 rpm for 10 min. At the end of this procedure, the washed RBCs from one buffy coat were suspended in 50 mL PBS (1% hematocrit).
GO and its derivatives, previously sonicated, were diluted in saline solution (150 mM NaCl) at a 2× concentration compared to their final concentrations in the assay (25 μg/mL and 2.5 μg/mL, respectively). Compounds (250 μL) were then mixed with an equal volume of RBCs. After 18- and 24-h incubation at 37 °C under gentle agitation, samples were centrifuged at 1500 rpm for 5 min and supernatants were collected. The released haemoglobin was measured by loading 100 μL of supernatants in duplicate in a microtiter plate and by reading their absorbance at 540 nm with a plate reader (Skanit 4.1, Thermo Scientific). In experiments conducted in the presence of serum, GO and its derivatives were diluted in saline solution at a 2× concentration compared to their final concentrations in the assay (2.5 μg/mL); afterwards, they were added to RBC resuspended in 60% human serum (kindly provided by the transfusion centre of Padua Hospital) and incubated at 37 °C for 18 h or 24 h.
3. Results
3.1. Characterization of Synthesized GO
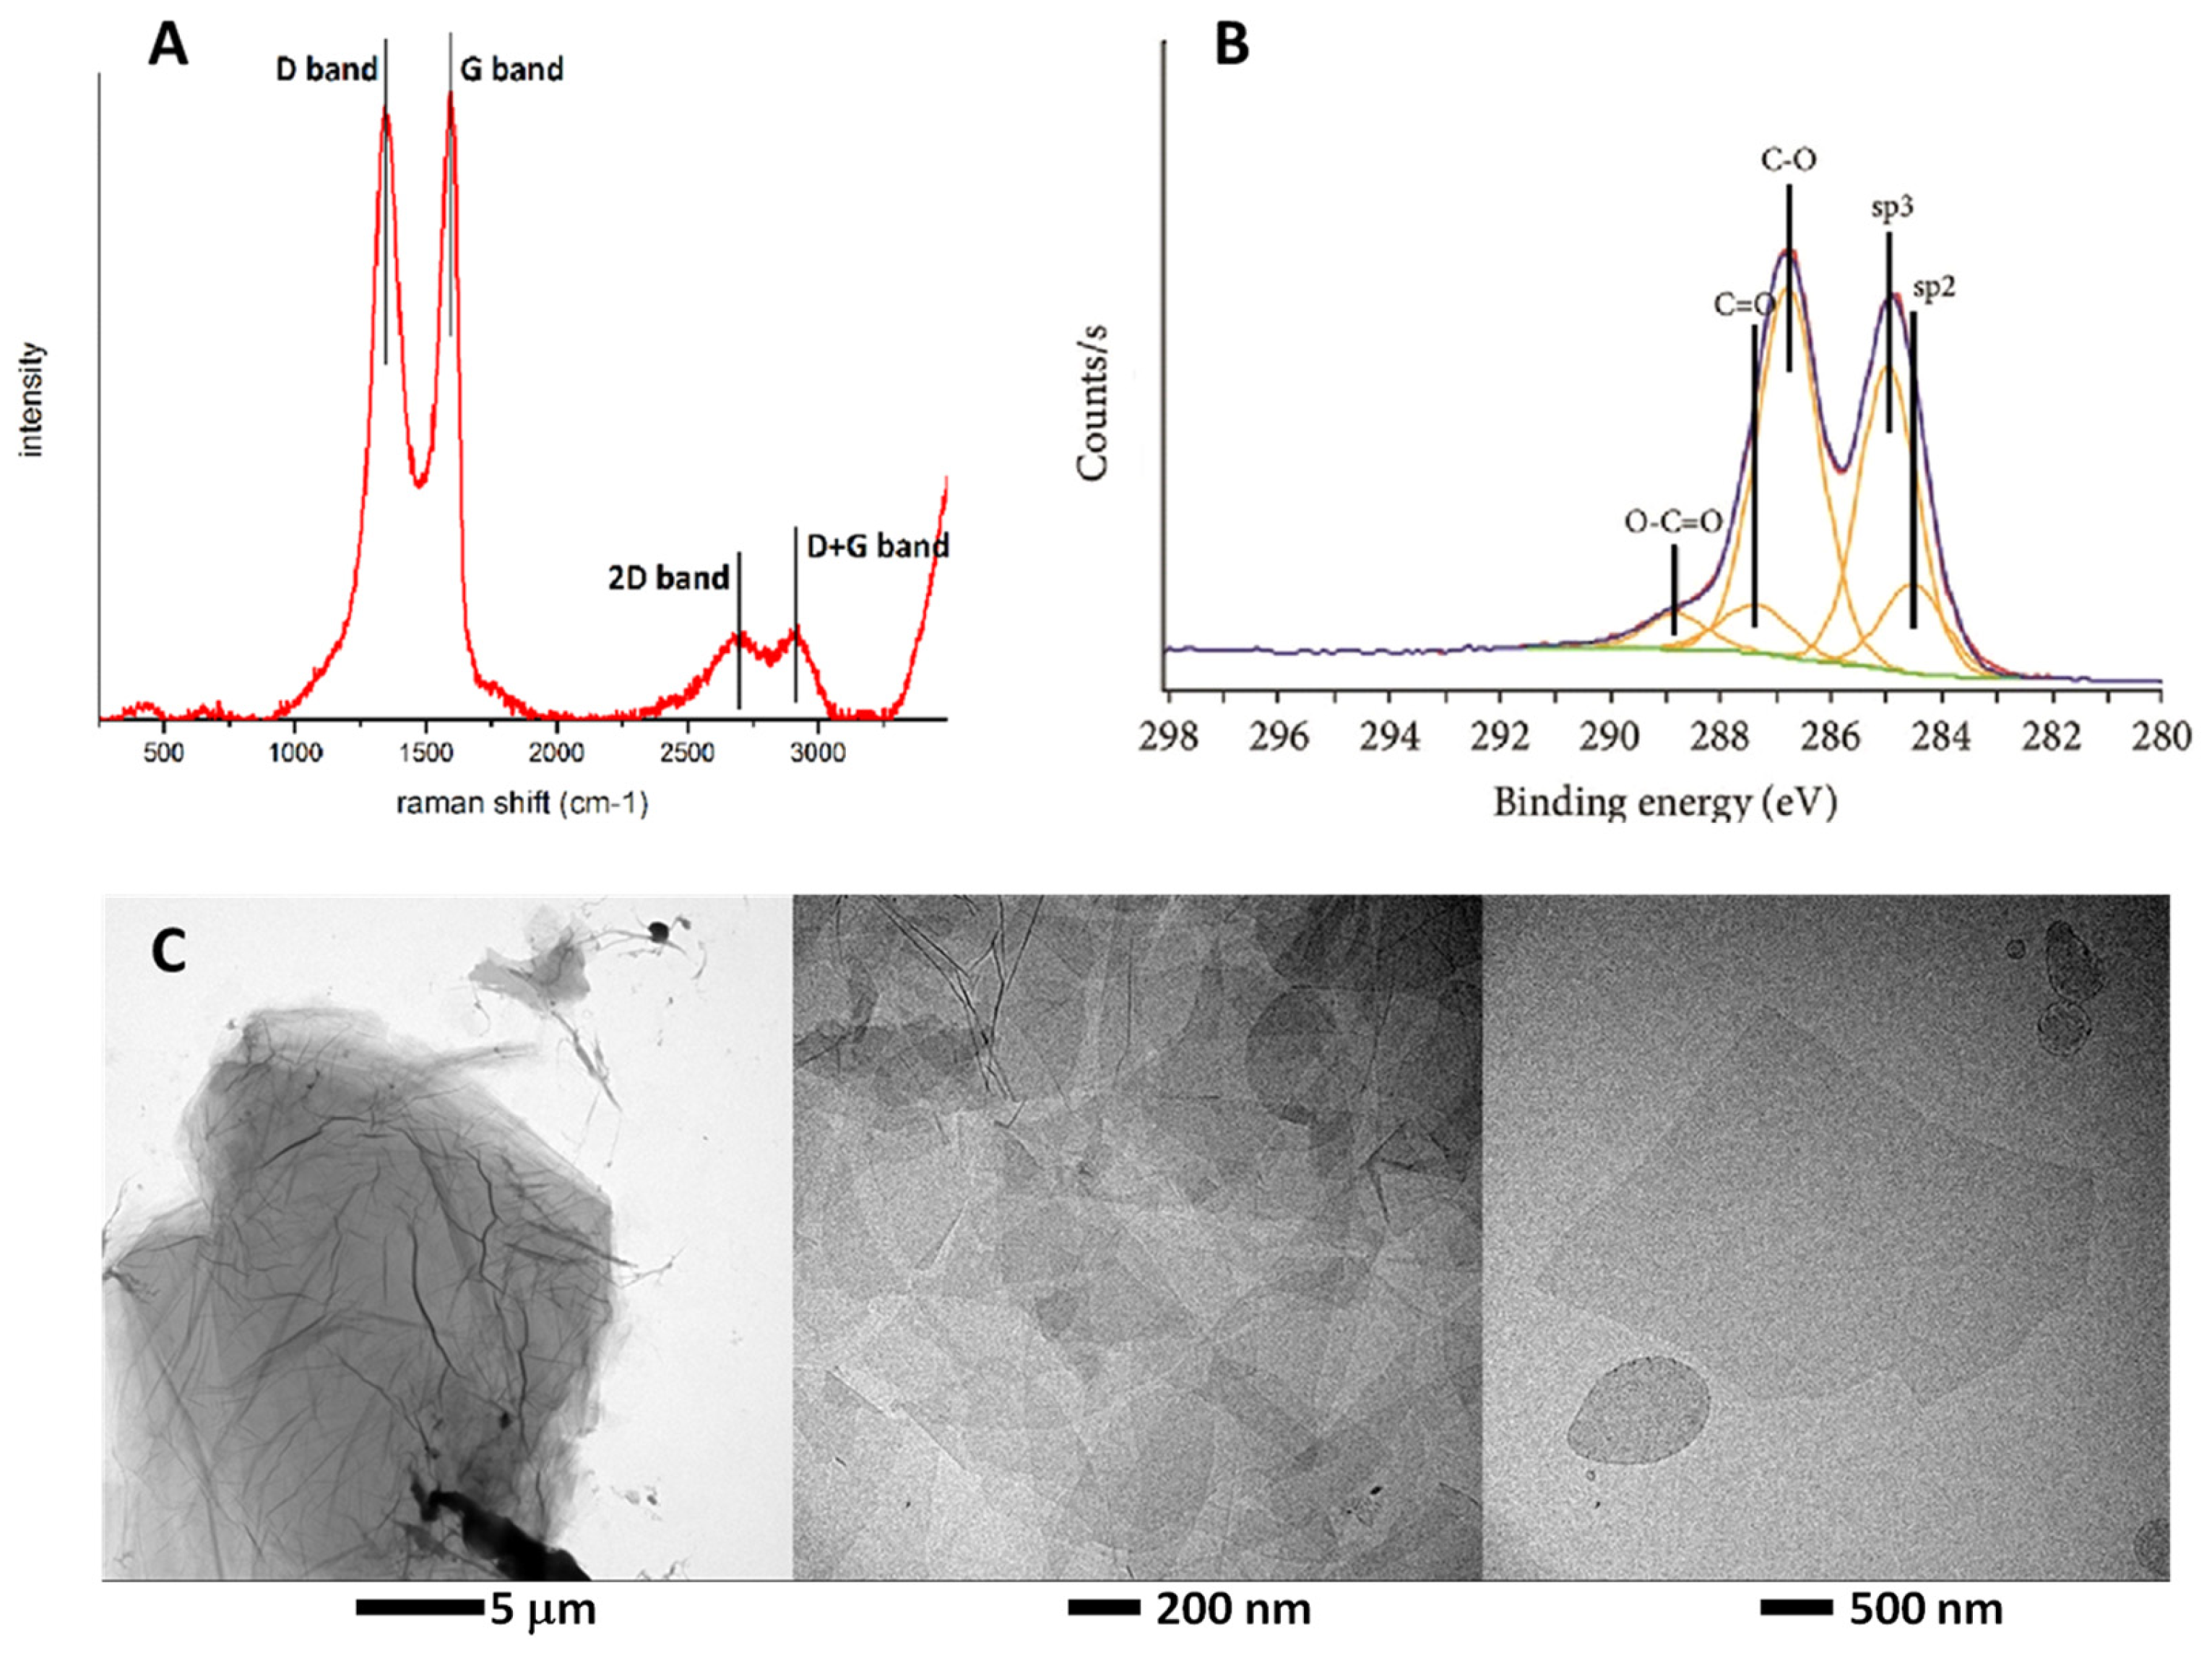
GO was analyzed with Raman spectroscopy and XPS spectroscopy. The Raman spectrum (Figure 1A, left upper panel) shows an intense peak at 1350 cm−1 (D band), an intense peak at 1600 cm−1 (G band), and two weak peaks at 2700 cm−1 (2D band) and 2900 cm−1 (D+G band). The XPS spectrum (Figure 1B, upper panel) shows a peak at about 285 eV corresponding to carbon and a peak at about 535 eV corresponding to oxygen. No other significant peaks are present, meaning that carbon and oxygen are the most abundant elements contained in the GO. Deconvolution of these peaks indicates the presence of aliphatic and aromatic carbon rings, carboxyl groups, carbonyl (both aldehydic and chetonic) groups, hydroxyl groups and epoxy groups. These groups are responsible for the high hydrophilicity of the GO. Our GO exhibits a dispersibility in water up to 5 mg/mL. TEM imaging of the sample shows its morphology as flake-like with some aggregates, indicating the sheets’ tendency to stick together (Figure 1C). Finally, by elemental analysis, we found a C-to-O ratio of 1.31.
3.2. Synthesis of Reduced GO (rGO)
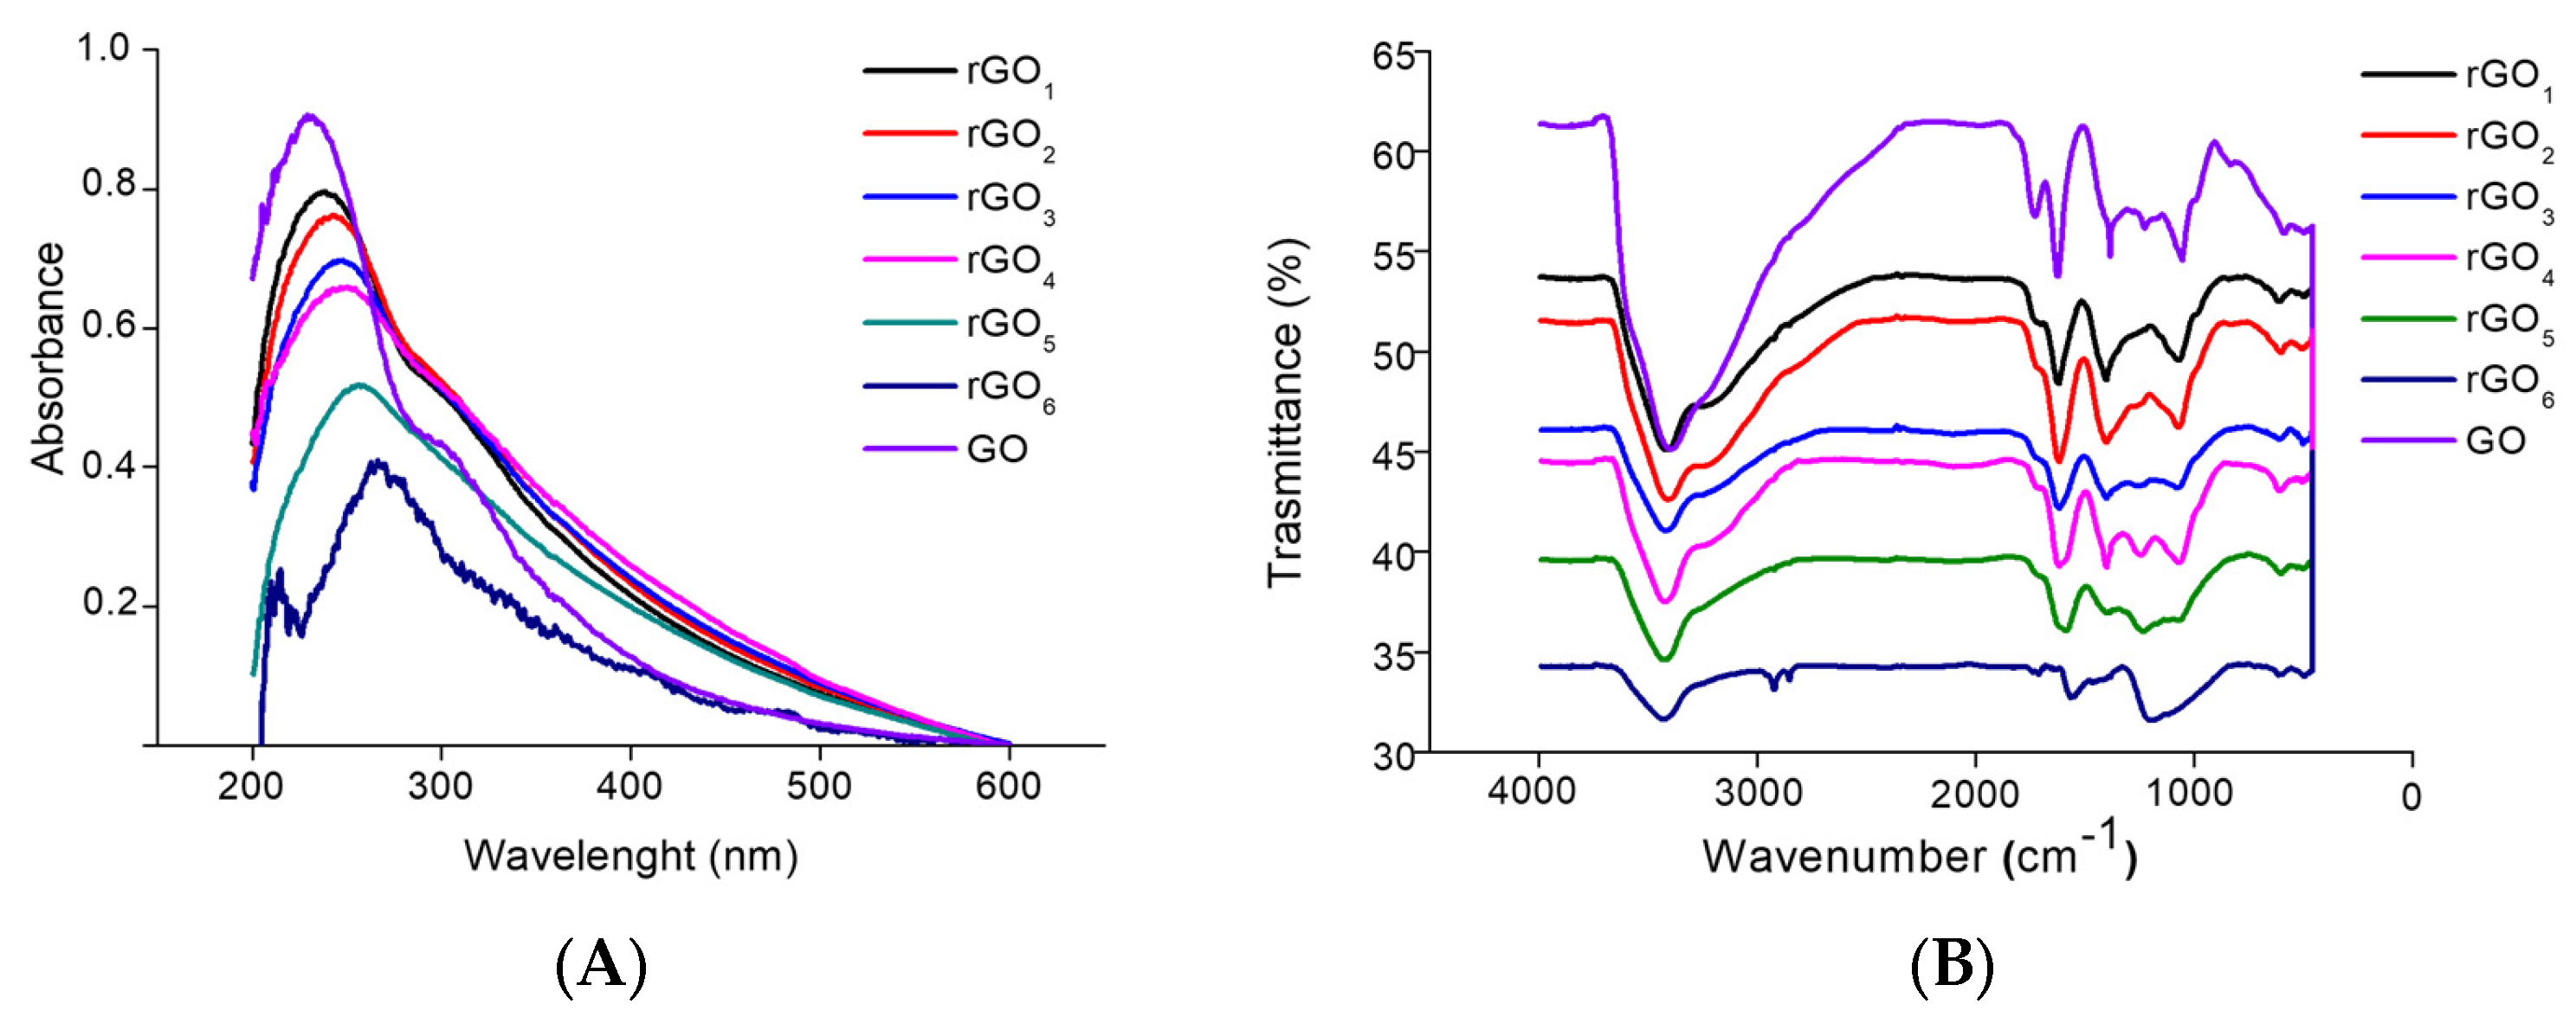
By following the protocol described in the experimental part, which combined the use of diluted hydrazine and controlled temperature, it was possible to obtain a certain number of moderately reduced GO samples characterized by distinct C/O ratios and a net negative charge that allowed them to stay moderately dispersed in water. In particular, starting from GO (C/O ratio = 1.31 and ζ-potential = −38.8 ± 2.0 mV), we obtained rGO1 with a C/O ratio of 1.37 and a ζ-potential of −39.5 ± 1.0 mV, rGO2 with a C/O ratio of 1.45 and a ζ-potential of −36.0 ± 1.0 mV, rGO3 with a C/O ratio of 1.49 and a ζ-potential of −39.3 ± 1.3 mV, rGO4 with a C/O ratio of 1.59 a ζ-potential of −35.6 ± 1.8 mV, rGO5 with a C/O ratio of 1.71 a ζ-potential of −29.9 ± 1.5 mV, and finally rGO6 with a C/O ratio of 1.75 a ζ-potential of −24.8 ± 2.5 mV. From UV-Vis spectra (Figure 2A), the π → π* band of C=C bond redshifts gradually from GO to rGO6. This is a clear sign of reduction and, in particular, of the restoration in the conjugated structure composed of sp2 hybridized carbon atoms. Concomitantly, the UV-Vis band corresponding to the n → π* transition of the C=O bond gradually disappears. The FT-IR spectra comparison of GO and rGOn clearly shows the removal of oxygen functional groups together with the increase in the reduction level (Figure 2B). This is particularly evident in the range 3400–1380 cm−1, a frequency range corresponding to alcoholic, epoxide and carbonyl oxygen-containing functional groups.
3.3. GO Covalent Functionalization
3.3.1. GO Esterification (eGO)
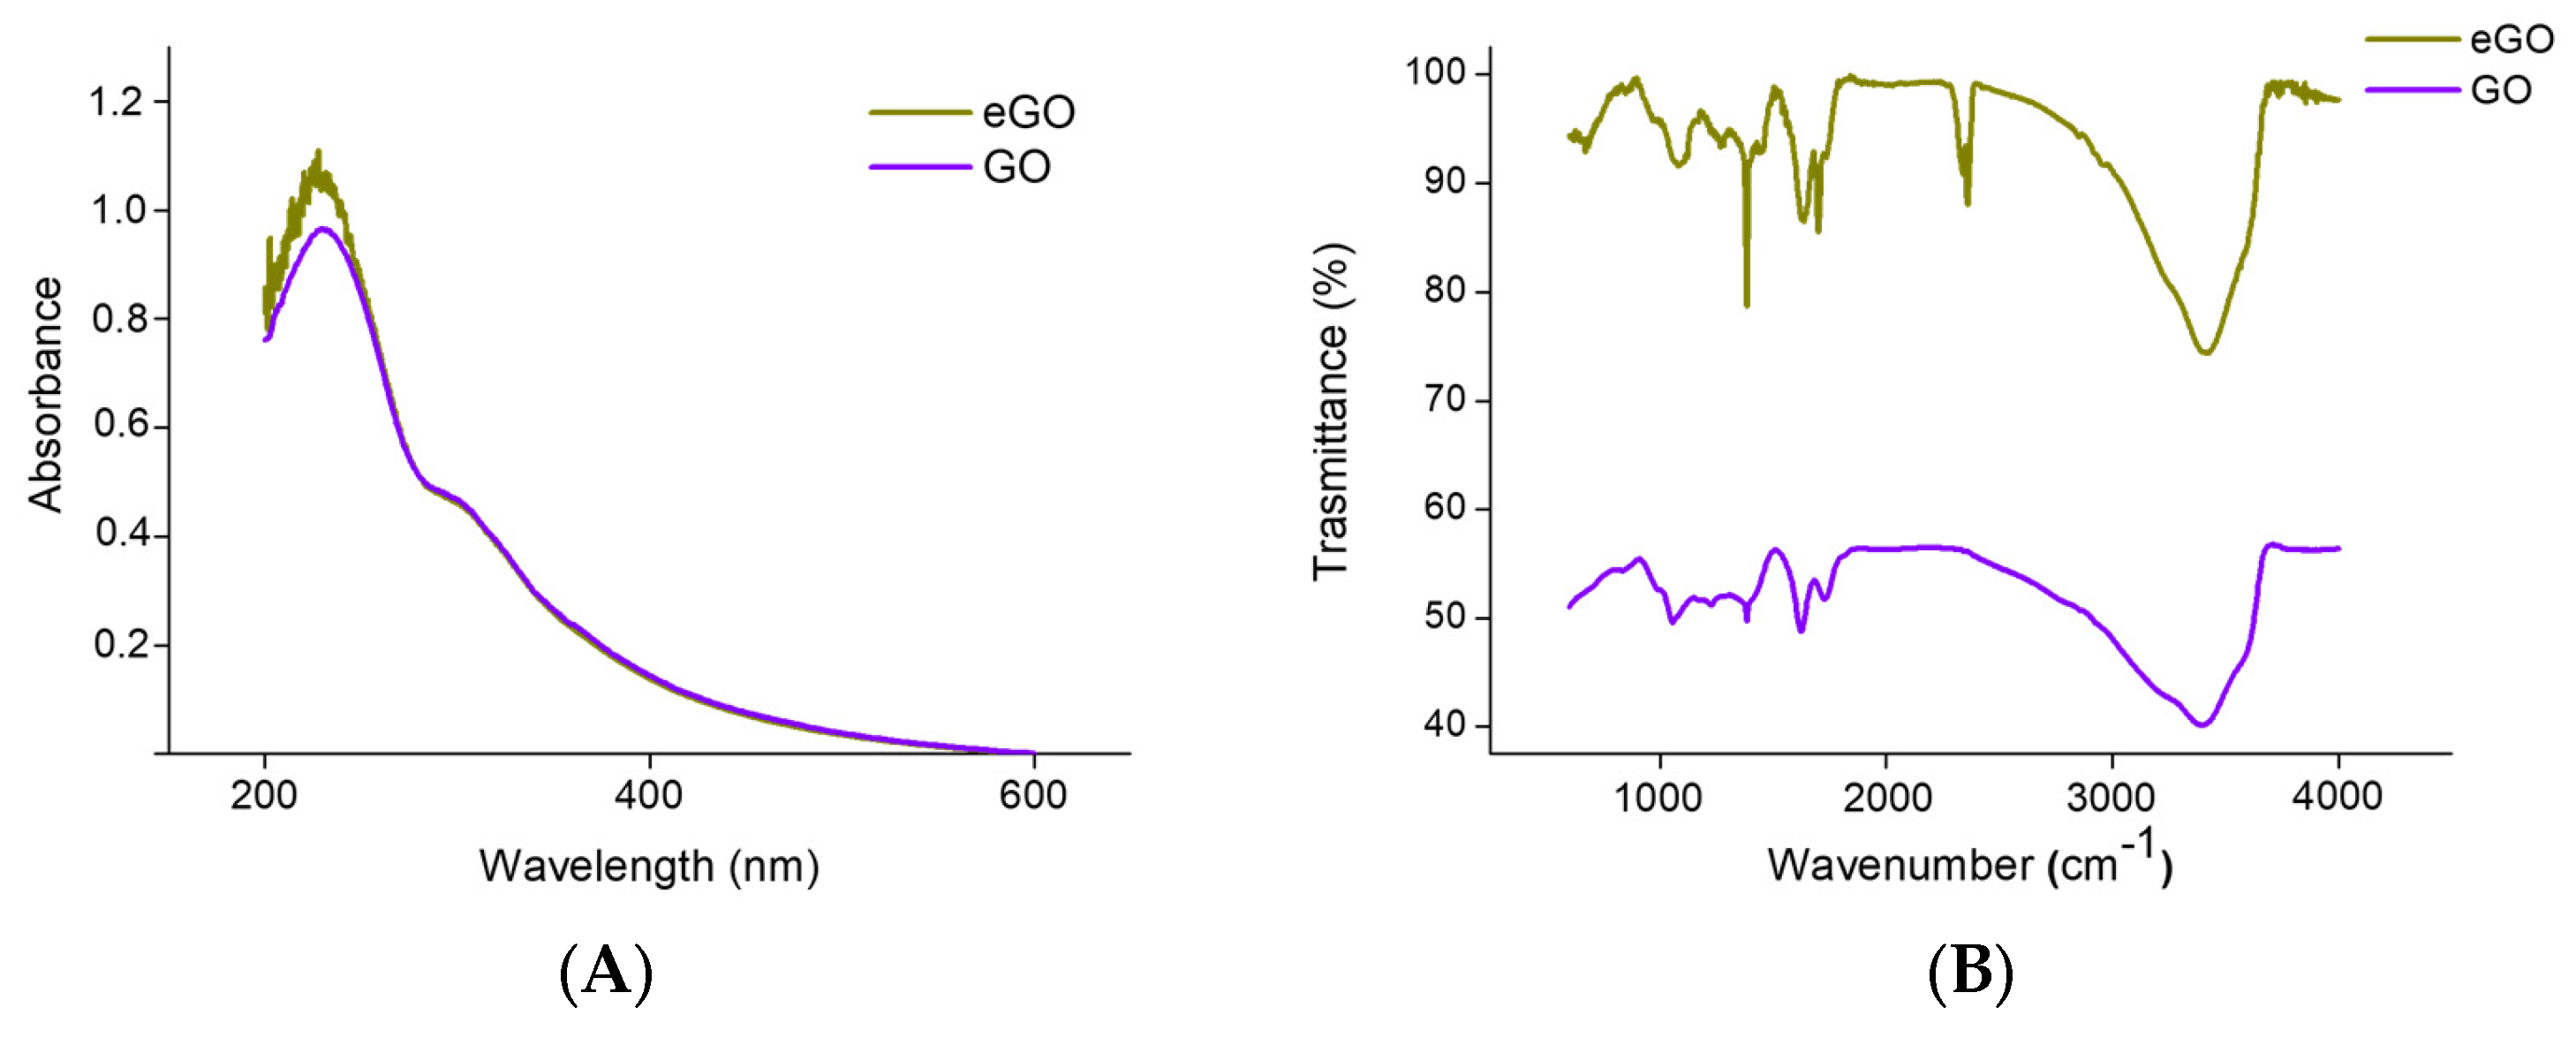
Esterification of the GO carboxylic group was performed by the TMS-DAM/MeOH method, as described in the experimental section. Confirmations of the reaction success can be seen from the comparison of elemental analysis and ζ-potential measures of GO and eGO (see Table 1). After the esterification, there was a slight increase in the C/O ratio, as expected by the addition of methyl groups and a decrease in the ζ-potential value.
As expected, the comparison of UV-Vis spectra of eGO and GO did not show changes in the position of the two main absorption bands of GO. From FT-IR the same comparison shows in eGO a sharp peak at 1730 cm−1, associated with the carboxyl C=O ester stretching (Figure 3).
3.3.2. GO Functionalization with Cysteamine (cys-GO), Mercaptobenzoic Acid (mba-GO) and eGO with Cysteamine (cys-eGO)
Functionalization with cysteamine or mercaptobenzoic acid GO was performed by the thiol-ene method using AIBN as the initiator. Confirmations of the success of the reaction can be seen from the comparison of elemental analysis and ζ-potential measures of GO, cys-GO, cys-eGO and mba-GO (see Table 2).
Cys-GO has an N/S molar ratio close to 1 and displays a large increment of the C/O ratio compared to GO. As expected, its ζ-potential is also lower than that of GO, given the presence of amino groups. In cys-eGO, we found a moderate lowering of the ζ-potential together with a moderate increase in C/O ratio, as expected. The ζ-potential of mba-GO gave a lower value than that of GO, and it may appear counterintuitive as we added carboxylic acids to its structure. It must be considered that, as claimed by Dimiev et al. [39], GO is not a stable structure and the addition of thiol groups into GO sp2 hybridized carbon domains could have compromised its vinylogy structure, thus decreasing the acidity of the hydroxyls groups (i.e., its negative charge). The high C/O molar supports the covalent functionalization of mercaptobenzoic acid into GO.
3.3.3. Exhaustive Methylation of GO and GO Ester Functionalized with Cysteamine
The exhaustive N-methylation of cysGO and cys-eGO was tested by elemental analysis showing an increase in their C/O ratio and by ζ-potential measurements (Table 3). Both met-cysGO and met-cys-eGO displayed a substantial increment in the C/O molar ratio compared to cysGO, while the N/S molar ratio remained stable. Methylation only partially decreases the overall ζ-potential values.
3.4. Biocompatibility Assays
3.4.1. Hemolytic Activity
The evaluation of the hemolytic potential of GO and its derivatives was based on the quantification of haemoglobin released from agonist-exposed human erythrocytes (RBCs).
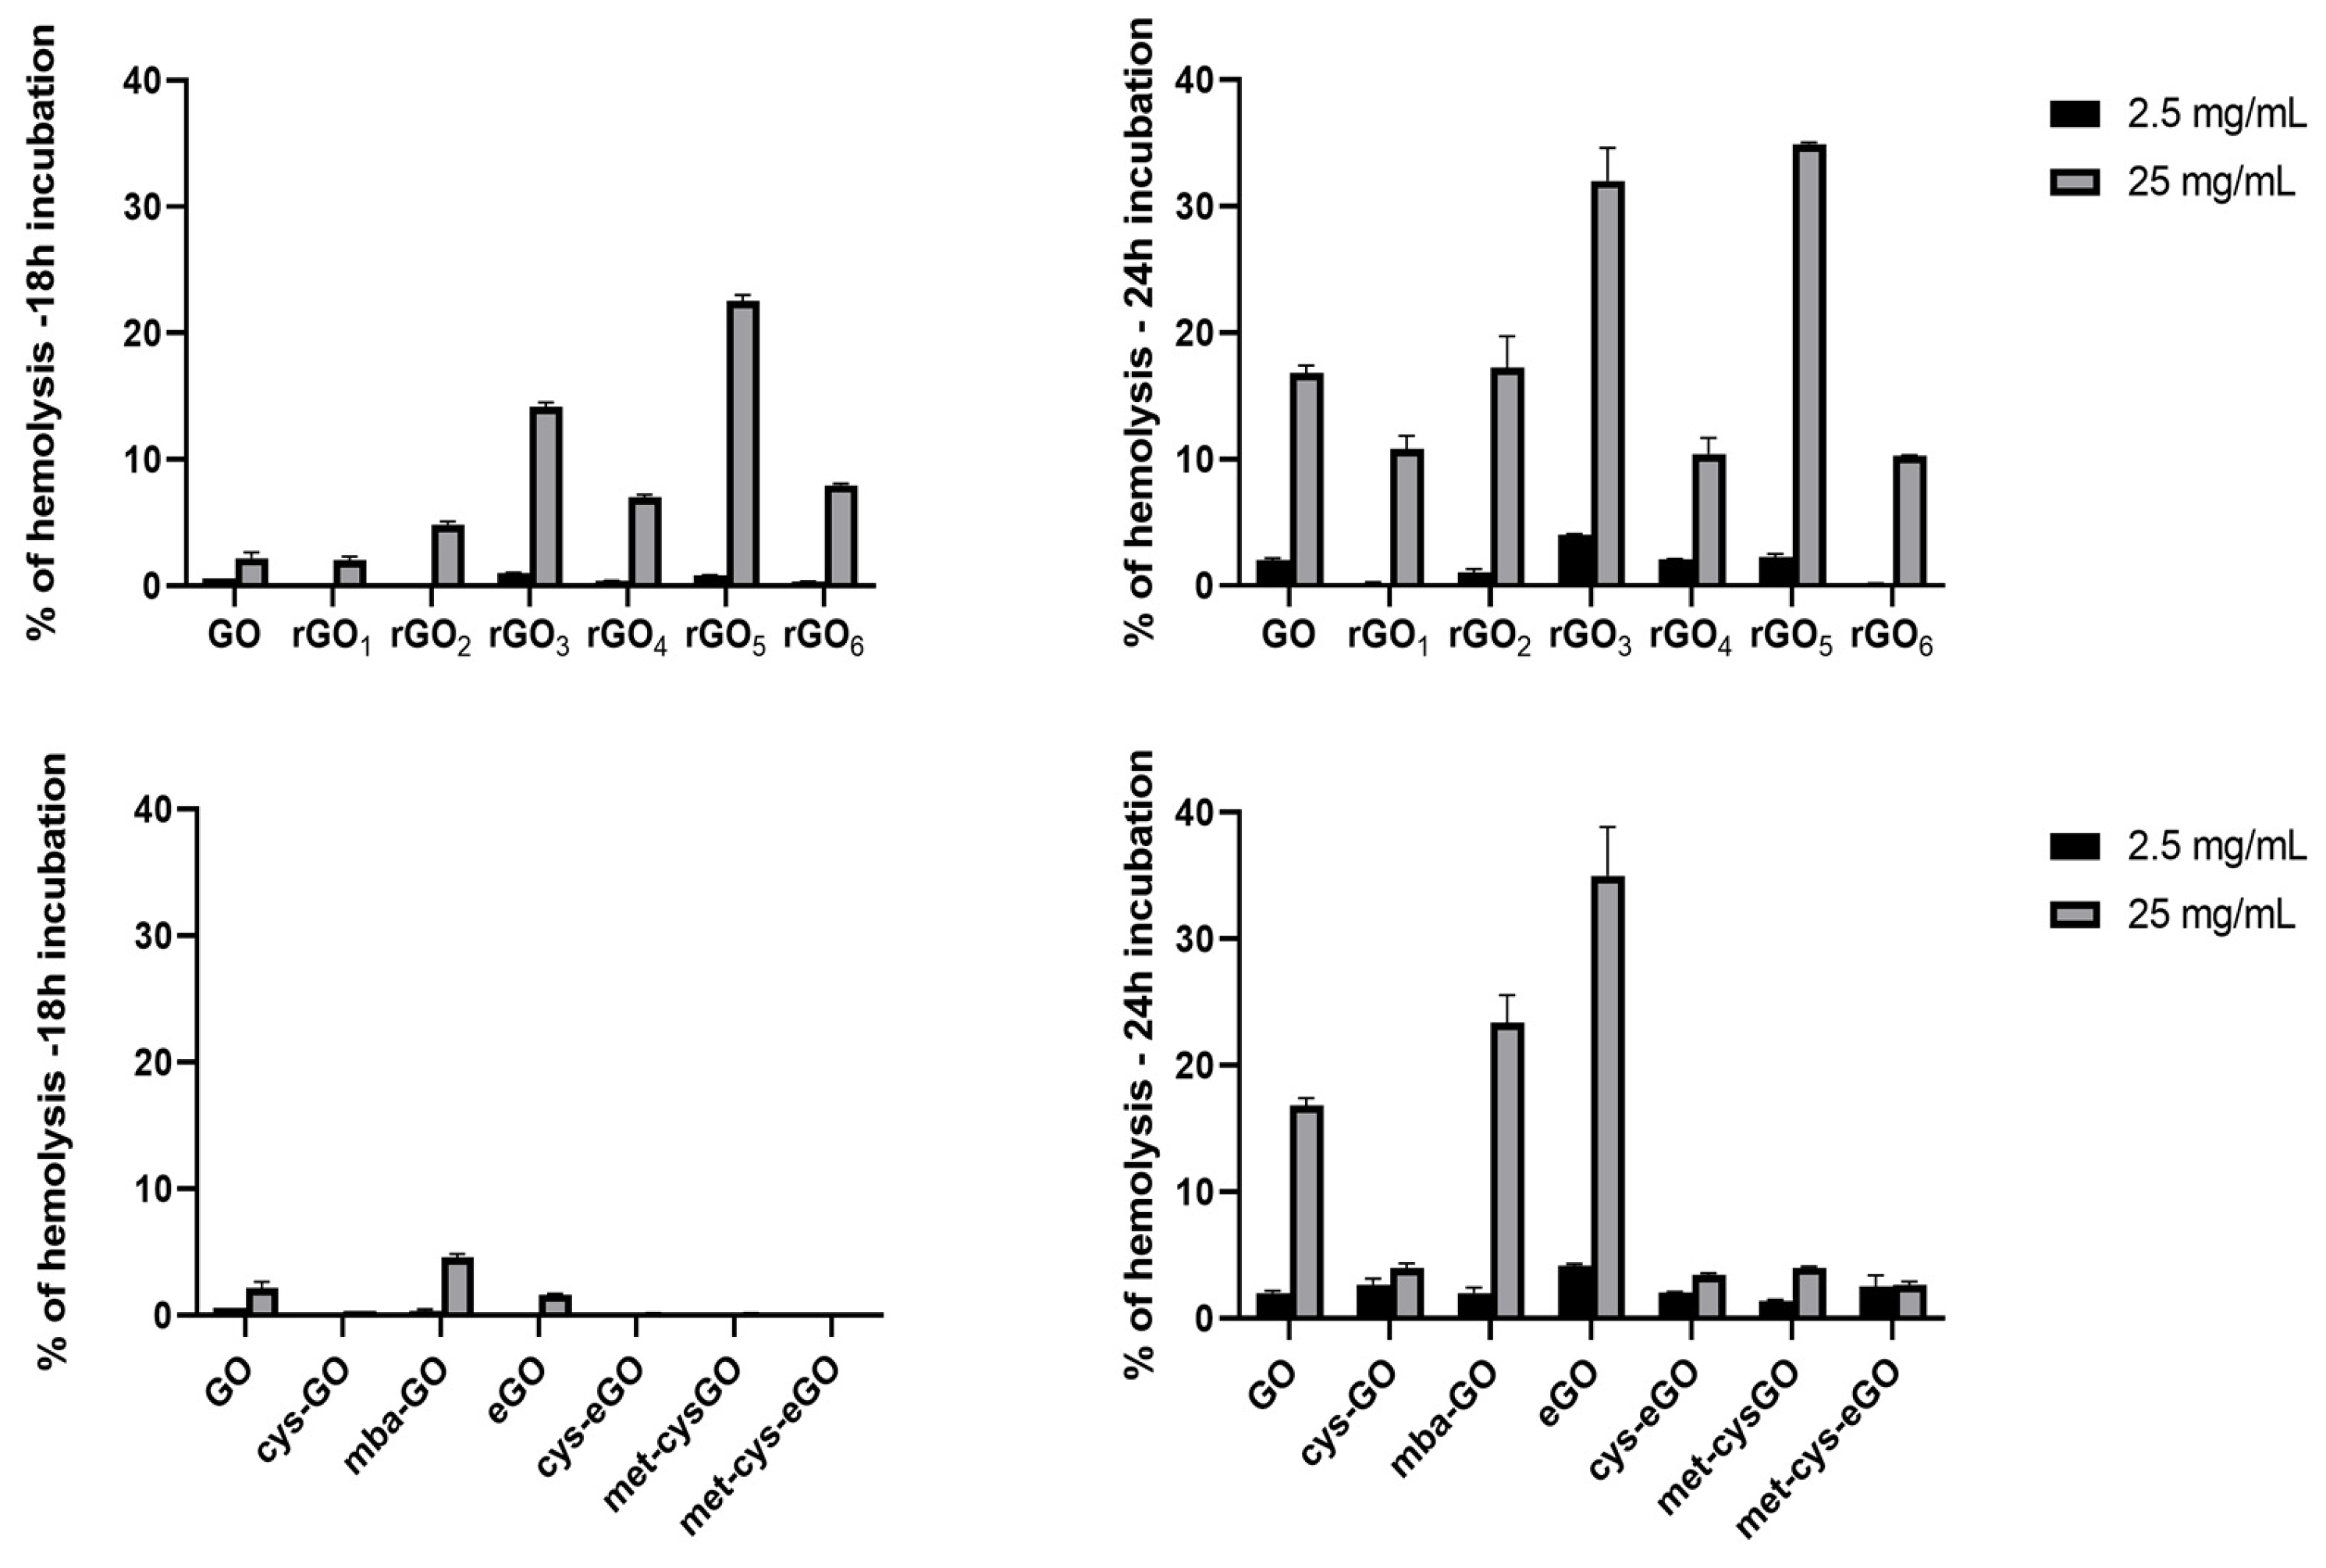
Results show that none of the studied GO forms has significant RBC membrane damaging actions at relatively low doses (2.5 µg/mL) after 18 and 24 h incubation (Figure 5). However, at higher doses (25 μg/mL), some GO derivatives induced RBC disruption with haemoglobin release. In particular, the rGO3 and rGO5 show the best activity (15–30% hemolysis), while GO and the other rGOs (rGO1, rGO2, rGO4 and the maximally reduced rGO6) induced a smaller effect (7–10%). The esterified GO (eGO) and the mercaptobenzoic acid-modified GO (mba-GO) showed a hemolysis comparable to GO after 24 h (10–15). On the contrary, cysteamine-derivatized (cysGO and cys-eGO) and methylcysteamine-derivatized GO (met-cys-GO and met-cys-eGO) were essentially free of hemolytic effects.
Such assay suggests that the modification with cystamine and methyl-cysteamine of GO and the esterified GO results in the most biocompatible GO derivatives.
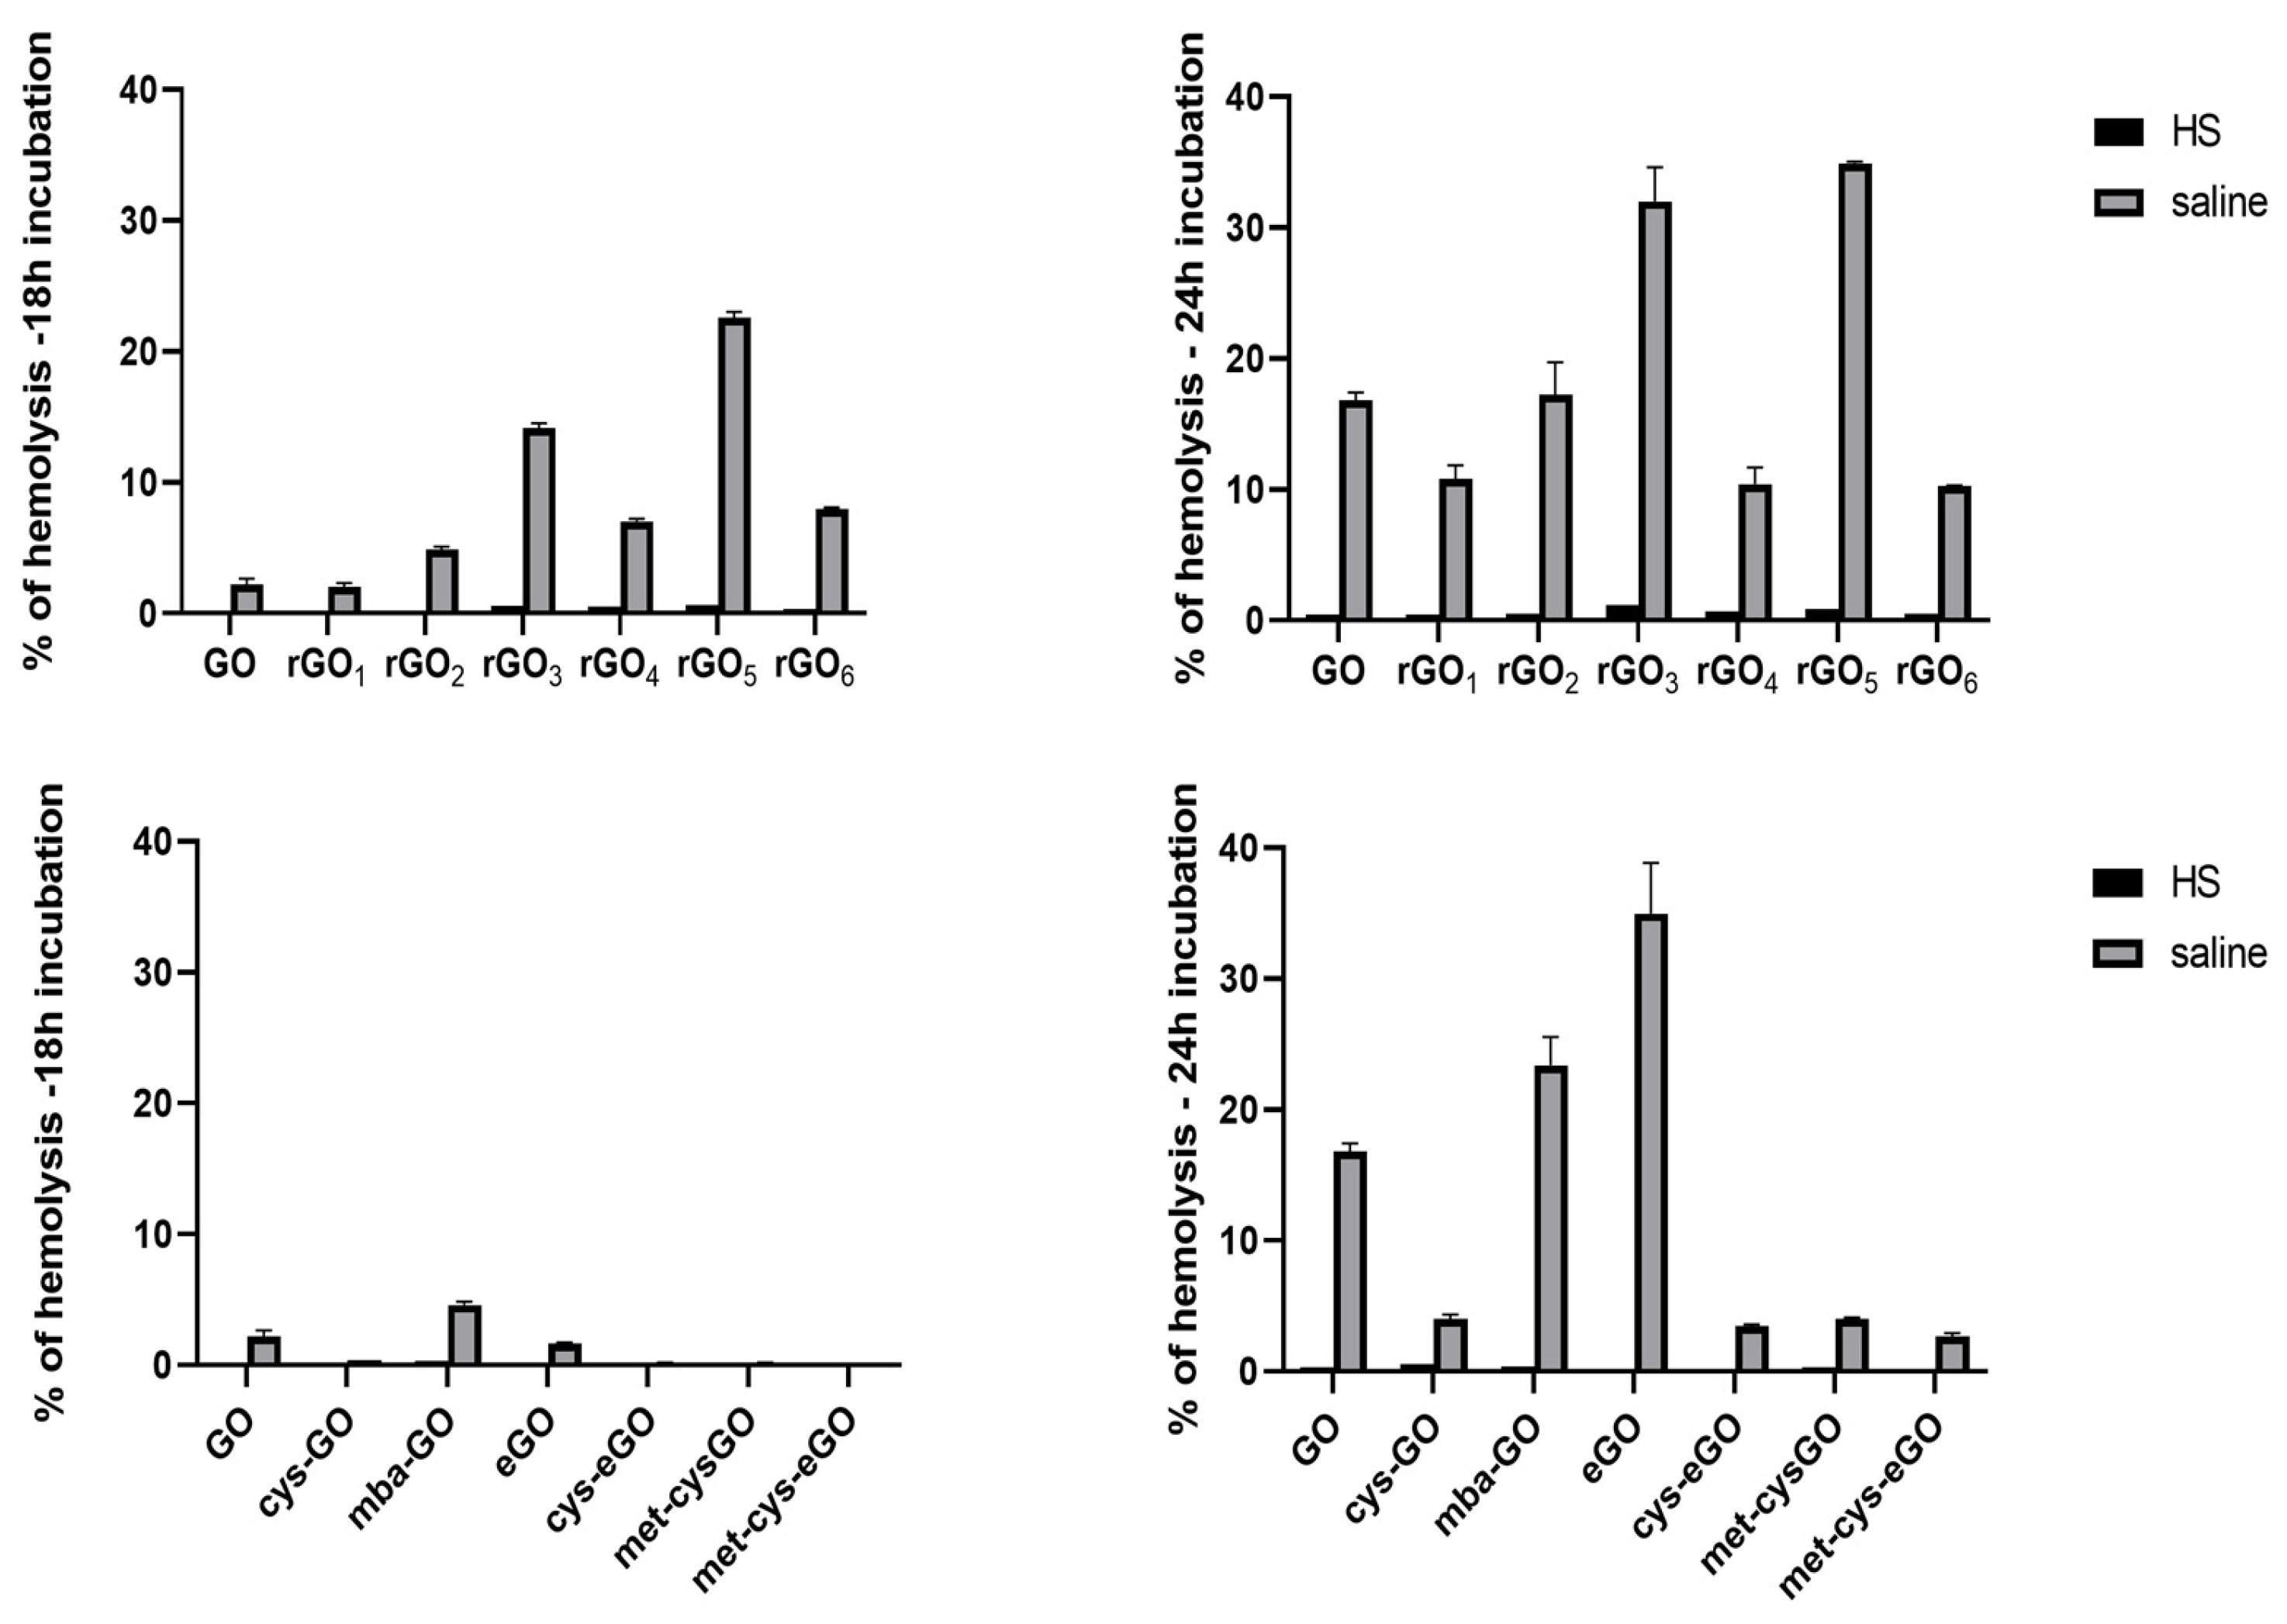
However, it is important to stress that the hemolytic action of GO and other active derivatives not only emerges at relatively high doses (>2.5 µg/mL) but is also partial (around 30% in the worst cases). Moreover, the hemolytic activity was performed in a protein-free buffer. Therefore, although informative on the direct interaction of GO-based materials with the RBC plasmamembrane, the assay may have little relevance in physiological protein-reach matrices, like serum or plasma. In fact, it is well known that nanomaterials after injection in the blood, can adsorb host proteins and macromolecules forming the so-called biomolecular corona. This phenomenon can mask the interactions of nanomaterials with other blood components, such as cells [40]. For this reason, to test the potential hemolysis activity in a more physiological medium, the hemolysis assay was repeated in 60% (v/v) human serum (HS) (Figure 6).
In such conditions, essentially no activity was observed with any GO formulations, strongly suggesting that the interaction of GO with serum protein (e.g., albumin, fibrinogen, immunoglobulins), may significantly lower the concentration of GO that may adsorb on RBCs.
3.4.2. Pro-Coagulant Activity
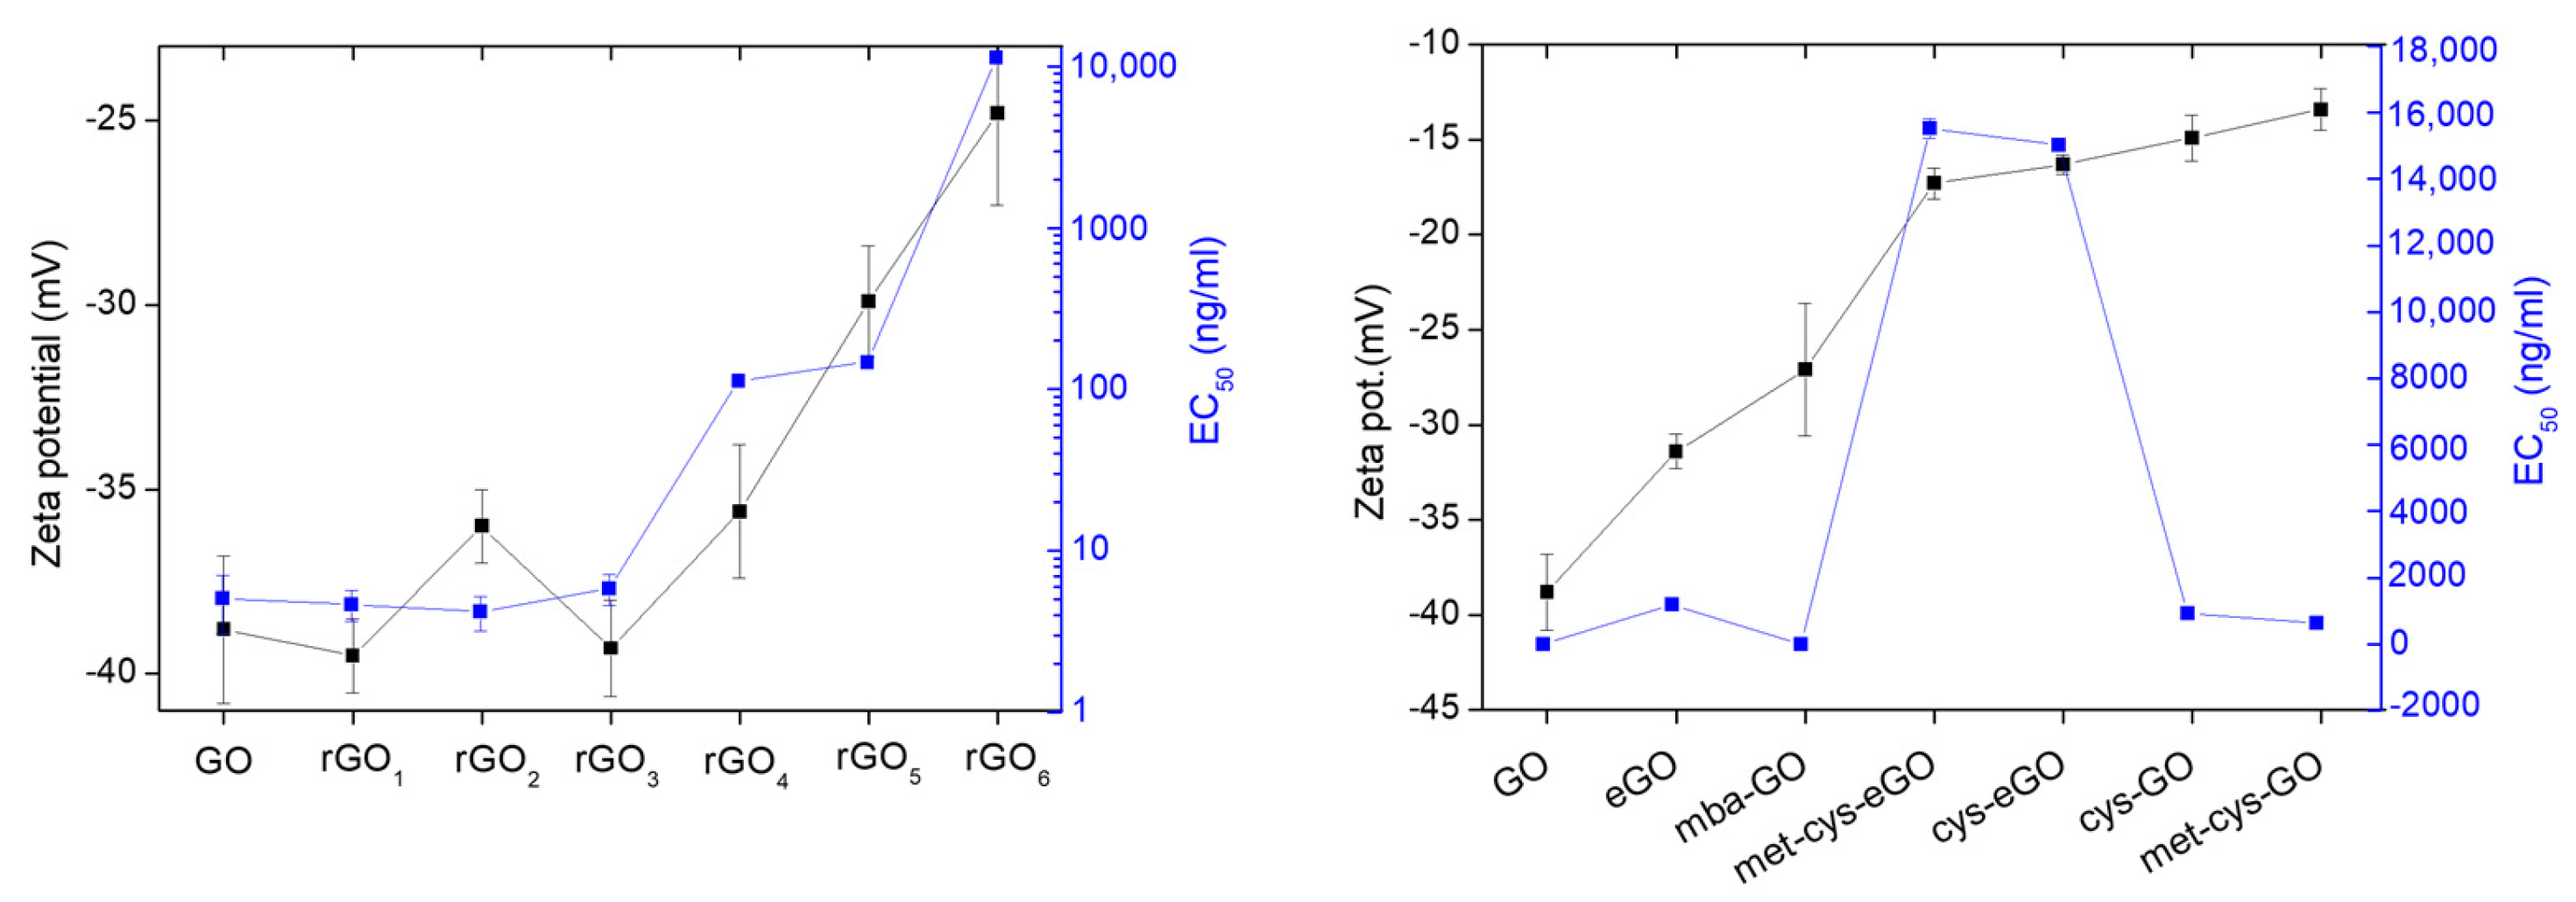
Hemolysis data indicate that blood proteins can interact with GO-based nanomaterials and that this virtually abolishes the membrane-destabilizing actions of some of them. However, the human serum, used in the assay, lost intrinsic procoagulant activity. Therefore, we also tested, in another set of experiments, the possible triggering of the coagulation cascade in citrated human plasma subjected to recalcification. In fact, nanomaterials could induce alteration in the balanced activity of the coagulation system key components by the contact with plasma coagulation factors and interaction with cells (platelets, monocytes, epithelial cells). These interactions could cause changes in the intensity of coagulation reactions or simply undesirable coagulation. The effects, in particular, are determined by the physicochemical properties of the specific nanomaterial such as surface charge and size [41]. The prompt interaction with plasma FXII may indeed be the first phenomenon to occur when potentially procoagulant NPs are injected into the blood, with the ensuing formation of the contact coagulation system and activation of the coagulation cascade and fibrin deposition. Interestingly, previous evidence suggests that GO can activate the intrinsic coagulation pathway [42]. Consistently, we show (Figure 7) that GO displays a very strong PCA in recalcified human plasma with an EC50% in the ng/mL range (~5 ng/mL). Such effective surface activation of the contact coagulation system is consistent with the strong negative surface (ζ-potential around −40 mV) of GO and the high surface-to-volume ratio, due to the bidimensional characteristics of the nanomaterial. The progressive reduction in GO through hydrazine leads to rGOs where, as expected, the ζ-potential becomes less negative and the PCA power decreases in parallel. The maximal reduction achieved here (rGO6) corresponded to nanomaterial with a ζ-potential above −30 mV (−25 mV) and led to a ~2000-fold reduction in the GO PCA (EC50%).
Moreover, we found that the combination of cysteamine or methyl-cysteamine modification with esterification of GO results in a strong decrease in plasma clotting (~3000-fold, EC50% 15 μg/mL). This only in part correlates with the ζ-potential decrease compared to GO (−16–13 mV vs. −39 mV). In fact, cysteamine and methyl-cysteamine-modified GO, although having ζ-potentials (−16–13 mV) similar to those of cysteamine/methyl-cysteamine-modified eGO (−13–12 mV), is only ~200-fold less procoagulant than GO (EC50% 0.94 µg/mL).
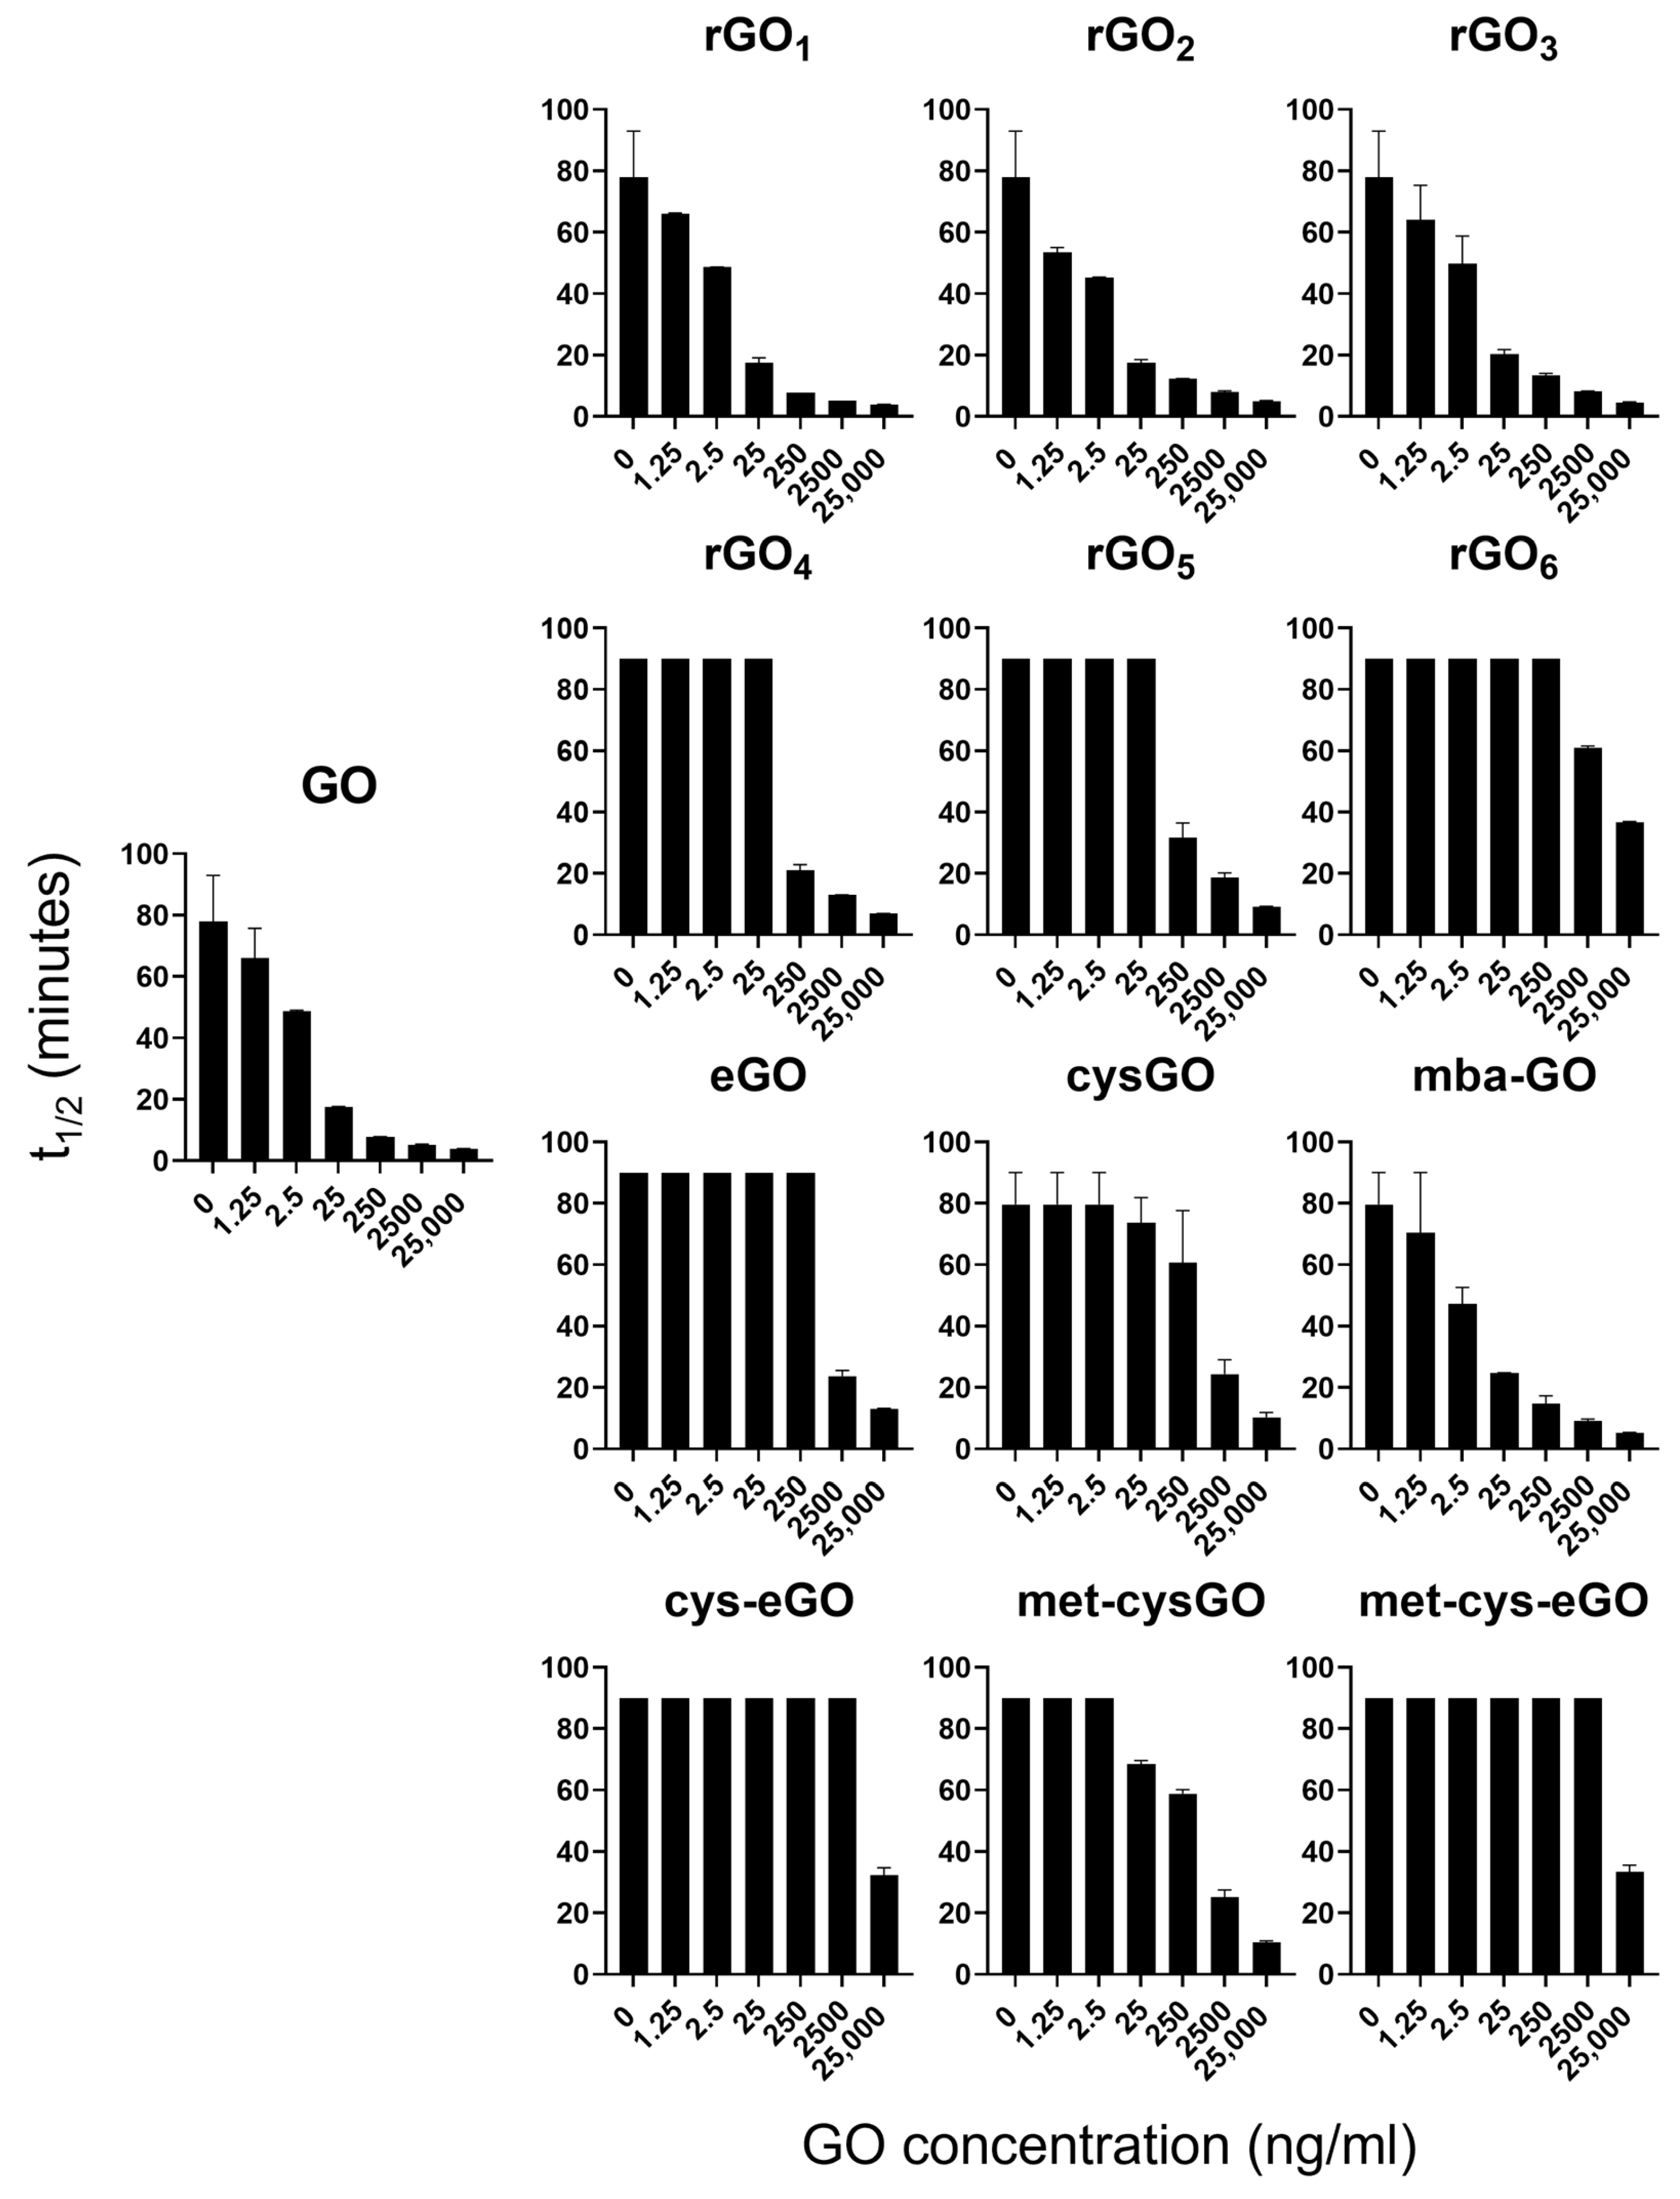
The coagulation half-time (t1/2) was then extrapolated from the curves (Figure 8). From the graphs presented in the figure, it is evident that the t1/2 remains similar to the physiological t1/2 at a higher concentration for rGO4 and rGO5 (25 ng/mL) with respect to GO, while for rGO6 it remains unchanged even at a concentration ten times higher (250 ng/mL). Esterified GO does not induce changes in the plasma coagulation kinetics up to the concentration of 250 ng/mL; functionalization with cysteamine of eGO further enhances its biocompatibility (t1/2 = 2500 ng/mL), while methylation of cys-eGO does not induce significant changes. Cysteamine functionalization of GO improves its biocompatibility: its t1/2 remains unchanged compared to the control, even in the presence of 25 ng/mL of cysGO. Also, in this case, methylation does not lead to a significant increase in the biocompatibility of met-cysGO.
4. Discussion
GO is a GA derivative with improved physicochemical characteristics, the first and foremost being better water solubility [43]. For this reason, GOs are promising nanotheranostic platforms [44,45,46]. However, the lamellar shape of the material, with a high surface administered and available for host molecules intersections, joined with a strong negative charge, due to the COO- group, dissociated at physiological pH, may induce toxic acute effects in blood [3,42]. Therefore, we decided to screen the blood compatibility of 13 different GO formulations based on reduction through treatment with hydrazine [47,48] and chemical modifications (esterification, cysteamine and mercaptobenzoic acid functionalization) in various combinations in vitro. To ensure a rapid screening, we tested red blood cell lysis and contact coagulation induced by the GO formulations. In fact, these are possibly the two most rapid and acute adverse actions of nanomaterials in the blood: plasma comes immediately in contact with them while red blood cells are by far the most abundant circulating cellular elements in blood. Investigating the impact of nanoparticles on the biocompatibility of red blood cells is of utmost importance, and it has to be conducted both in vitro and in vivo: in vitro, assessing how hemolysis could act in inducing complement activation, and oxidative stress, in vivo, studying the clearance and the uptake of blood components by RES, lungs and kidneys [49].
At the highest tested concentration (25 µg/mL), GO showed weak hemolytic activity after 24 h-incubation. Reducing GO using hydrazine only reduced hemolytic activity in some intermediates (rGO1 and rGO6). Cysteamine functionalization significantly reduced GO-induced hemolysis, however mercaptobenzoic acid and esterification increased hemolysis. Functionalization of eGO with cysteamine and subsequent methylation significantly decreased in hemolysis.
The hemolytic effect of GO and its derivatives is completely abolished in the presence of proteins (i.e., experiments of hemolysis conducted in human serum), strongly suggesting effective protein adsorption on the materials, masking the pristine membrane destabilizing graphene surfaces.
When tested for their ability to alter plasma coagulation kinetics, the most reduced compounds (rGO4, rGO5 and especially rGO6) displayed greater biocompatibility. Among those tested, esterification emerged as the functionalization significantly enhancing GO’s biocompatibility when assessed for its coagulation activation capability. Additionally, further functionalization with cysteamine and subsequent methylation rendered GO biocompatible up to a concentration of 25 µg/mL.
We therefore found that esterified GO further modified with cysteamine or methyl-cysteamine is the most biocompatible GO-based nanomaterial. Met-cys-eGO is free of potential hemolytic/membrane damaging effects and showed a strongly reduced ability to induce plasma coagulation. In general, we suggest that, given the relatively weak hemolytic effect and the apparent strong protective masking of active GO formulations, the most rapid adverse effect to be monitored in vitro assays is the plasma coagulation induction. Here we indeed show that GO is an extremely powerful trigger for contact coagulation of plasma with an EC50% (5 ng/mL) about 1000-fold reduced compared with that of amorphous silica NPs [50], a well-known procoagulant material (EC50% about 5 µg/mL), on a weight base. Given this extreme efficacy in plasma clotting, we indeed focused on the mitigation effects of various derivatives. We found that COO- esterification and NH2 derivatization lead to a still relatively negative particle with much reduced procoagulant action.
5. Conclusions
The most evident adverse effect of GO in the blood is likely plasma coagulation via the intrinsic contact system. Indeed, the strong negative charge and high surface/volume ratio make GO extremely effective in recruiting plasma FXII which triggers the contact coagulation system. However, through the screening of several GO derivatives, we found that the esterification of GO, which displayed -COO- groups, joined with the introduction of cationic -NH3+ or -N(CH3)3+ groups through thiol-ene chemistry, results in a significant increase in the ζ-potential and a strong diminishing of plasma coagulation. Our approach is important to easily screen biocompatibility. In fact, although HS ablates the intrinsic hemolytic effect of GO, we also show that in physiological conditions the plasma corona comprises the triggers of the contact coagulation systems, which also need to be controlled.
The present data set will be useful for further studies. For example, we here test human serum to evidence its interference with the intrinsic GOs-mediated RBC damage. However, serum is depleted with coagulation factors. Therefore, future studies will be necessary to set up a valuable plasma model anticoagulated with agents not affecting Ca2+ (like citrate): heparin, and hirudin-based agents to test the best conditions. Eventually, both in vitro and in vivo tests in preclinical models (e.g., murine) will have to be evaluated carefully, to validate the animal–human result comparisons.
Our study is relevant for two major reasons: first of all, we show that it is indeed possible to control major adverse reactions of GOs by a variety of chemical modifications. It is impressive how coagulation and RBC membrane stabilization can be modulated by relatively simple chemistry. Our most biocompatible derivative (met-cys-eGO) represents a valuable safe platform for GO-based nanomedicine tools for drug delivery and tissue regeneration. Eventually, we believe that the combination of two low-cost but high-throughput assays (plasma clotting and RBC lysis) will allow for easy initial screening in vitro of a high number of chemical structures and doses, with relatively cheap equipment. This powerful in vitro screening filter can rule out non-hemocompatible nanodrugs in a few days, allowing the attainment of rapid information on structure–function relationships and the speeding up of nanotheranostic development.
Author Contributions
Conceptualization, A.M. and E.P.; methodology, F.P., A.M., E.P. and R.T.; validation, F.P., A.M., E.P. and R.T.; formal analysis, F.P., A.M., E.P. and R.T.; investigation, F.P.; data curation, R.T.; writing—original draft preparation, A.M., E.P. and R.T.; writing—review and editing, A.M., E.P. and R.T.; funding acquisition, E.P. and R.T. All authors have read and agreed to the published version of the manuscript.
Funding
This research was funded by University of Padova (DOR to E.P. and R.T.).
Data Availability Statement
The raw data supporting the conclusions of this article will be made available by the authors on request.
Conflicts of Interest
The authors declare no conflict of interest. The funders had no role in the design of the study; in the collection, analyses, or interpretation of data; in the writing of the manuscript; or in the decision to publish the results.
References
- Banerjee, A.N. Graphene and its derivatives as biomedical materials: Future prospects and challenges. Interface Focus 2018, 8, 20170056. [Google Scholar] [CrossRef]
- Chua, C.K.; Pumera, M. Chemical reduction of graphene oxide: A synthetic chemistry viewpoint. Chem. Soc. Rev. 2014, 43, 291–312. [Google Scholar] [CrossRef]
- Ou, L.; Song, B.; Liang, H.; Liu, J.; Feng, X.; Deng, B.; Sun, T.; Shao, L. Toxicity of graphene-family nanoparticles: A general review of the origins and mechanisms. Part. Fibre Toxicol. 2016, 13, 57. [Google Scholar] [CrossRef]
- Glassman, P.M.; Hood, E.D.; Ferguson, L.T.; Zhao, Z.; Siegel, D.L.; Mitragotri, S.; Brenner, J.S.; Muzykantov, V.R. Red blood cells: The metamorphosis of a neglected carrier into the natural mothership for artificial nanocarriers. Adv. Drug Deliv. Rev. 2021, 178, 113992. [Google Scholar] [CrossRef]
- Moyes, R.B.; Kirch, H.; DeLoach, J.R. Enhanced biological activity of human recombinant interleukin 2 coupled to mouse red blood cells as evaluated using the mouse Meth A sarcoma model. Biotechnol. Appl. Biochem. 1996, 23, 29–36. [Google Scholar]
- Sabatino, R.; Antonelli, A.; Battistelli, S.; Schwendener, R.; Magnani, M.; Rossi, L. Macrophage depletion by free bisphosphonates and zoledronate-loaded red blood cells. PLoS ONE 2014, 9, e101260. [Google Scholar] [CrossRef] [PubMed]
- Magnani, M.; Pierigè, F.; Rossi, L. Erythrocytes as a novel delivery vehicle for biologics: From enzymes to nucleic acid-based therapeutics. Ther. Deliv. 2012, 3, 405–414. [Google Scholar] [CrossRef] [PubMed]
- Glassman, P.M.; Villa, C.H.; Ukidve, A.; Zhao, Z.; Smith, P.; Mitragotri, S.; Russell, A.J.; Brenner, J.S.; Muzykantov, V.R. Vascular Drug Delivery Using Carrier Red Blood Cells: Focus on RBC Surface Loading and Pharmacokinetics. Pharmaceutics 2020, 12, 44. [Google Scholar] [CrossRef]
- Murciano, J.C.; Higazi, A.B.D.; Cines, D.B.; Muzykantov, V.R. Soluble urokinase receptor conjugated to carrier red blood cells binds latent pro-urokinase and alters its functional profile. J. Control. Release 2009, 139, 190–196. [Google Scholar] [CrossRef] [PubMed]
- Tutwiler, V.; Litvinov, R.I.; Protopopova, A.; Nagaswami, C.; Villa, C.; Woods, E.; Abdulmalik, O.; Siegel, D.L.; Russell, J.E.; Muzykantov, V.R.; et al. Pathologically stiff erythrocytes impede contraction of blood clots. J. Thromb. Haemost. 2021, 19, 1990–2001. [Google Scholar] [CrossRef] [PubMed]
- Zhao, Z.; Kim, J.; Suja, V.C.; Kapate, N.; Gao, Y.; Guo, J.; Muzykantov, V.R.; Mitragotri, S. Red Blood Cell Anchoring Enables Targeted Transduction and Re-Administration of AAV-Mediated Gene Therapy. Adv. Sci. 2022, 9, e2201293. [Google Scholar] [CrossRef]
- Brenner, J.S.; Pan, D.C.; Myerson, J.W.; Marcos-Contreras, O.A.; Villa, C.H.; Patel, P.; Hekierski, H.; Chatterjee, S.; Tao, J.-Q.; Parhiz, H.; et al. Red blood cell-hitchhiking boosts delivery of nanocarriers to chosen organs by orders of magnitude. Nat. Commun. 2018, 9, 2684. [Google Scholar] [CrossRef]
- Sasidharan, A.; Panchakarla, L.S.; Sadanandan, A.R.; Ashokan, A.; Chandran, P.; Girish, C.M.; Menon, D.; Nair, S.V.; Rao, C.N.R.; Koyakutty, M. Hemocompatibility and macrophage response of pristine and functionalized graphene. Small 2012, 8, 1251–1263. [Google Scholar] [CrossRef]
- Ding, Z.; Zhang, Z.; Ma, H.; Chen, Y. In vitro hemocompatibility and toxic mechanism of graphene oxide on human peripheral blood T Lymphocytes and serum albumin. ACS Appl. Mater. Interfaces 2014, 6, 19797–19807. [Google Scholar] [CrossRef]
- Liao, K.H.; Lin, Y.S.; MacOsko, C.W.; Haynes, C.L. Cytotoxicity of graphene oxide and graphene in human erythrocytes and skin fibroblasts. ACS Appl. Mater. Interfaces 2011, 3, 2607–2615. [Google Scholar] [CrossRef]
- Frimat, M.; Boudhabhay, I.; Roumenina, L.T. Hemolysis Derived Products Toxicity and Endothelium: Model of the Second Hit. Toxins 2019, 11, 660. [Google Scholar] [CrossRef]
- Qian, Q.; Nath, K.A.; Wu, Y.; Daoud, T.M.; Sethi, S. Hemolysis and Acute Kidney Failure. Am. J. Kidney Dis. 2010, 56, 780–784. [Google Scholar] [CrossRef]
- Hu, W.; Peng, C.; Lv, M.; Li, X.; Zhang, Y.; Chen, N.; Fan, C.; Huang, Q. Protein corona-mediated mitigation of cytotoxicity of graphene oxide. ACS Nano 2011, 5, 3693–3700. [Google Scholar] [CrossRef]
- Duan, G.; Kang, S.G.; Tian, X.; Garate, J.A.; Zhao, L.; Ge, C.; Zhou, R. Protein corona mitigates the cytotoxicity of graphene oxide by reducing its physical interaction with cell membrane. Nanoscale 2015, 7, 15214–15224. [Google Scholar] [CrossRef]
- Ge, C.; Du, J.; Zhao, L.; Wang, L.; Liu, Y.; Li, D.; Yang, Y.; Zhou, R.; Zhao, Y.; Chai, Z.; et al. Binding of blood proteins to carbon nanotubes reduces cytotoxicity. Proc. Natl. Acad. Sci. USA 2011, 108, 16968–16973. [Google Scholar] [CrossRef]
- Singh, S.K.; Singh, M.K.; Kulkarni, P.P.; Sonkar, V.K.; Grácio, J.J.A.; Dash, D. Amine-modified graphene: Thrombo-protective safer alternative to graphene oxide for biomedical applications. ACS Nano 2012, 6, 2731–2740. [Google Scholar] [CrossRef]
- Bianco, A.; Cheng, H.M.; Enoki, T.; Gogotsi, Y.; Hurt, R.H.; Koratkar, N.; Kyotani, T.; Monthioux, M.; Park, C.R.; Tascon, J.M.; et al. All in the graphene family—A recommended nomenclature for two-dimensional carbon materials. Carbon 2013, 65, 1–6. [Google Scholar] [CrossRef]
- Palmieri, V.; Perini, G.; De Spirito, M.; Papi, M. Graphene oxide touches blood: In vivo interactions of bio-coronated 2D materials. Nanoscale Horiz. 2019, 4, 273–290. [Google Scholar] [CrossRef]
- De Silva, K.K.H.; Huang, H.H.; Joshi, R.K.; Yoshimura, M. Chemical reduction of graphene oxide using green reductants. Carbon 2017, 119, 190–199. [Google Scholar] [CrossRef]
- Almeida, J.P.M.; Chen, A.L.; Foster, A.; Drezek, R. In vivo biodistribution of nanoparticles. Nanomedicine 2011, 6, 815–835. [Google Scholar] [CrossRef]
- Sprong, T.; Stikkelbroeck, N.; van der Ley, P.; Steeghs, L.; van Alphen, L.; Klein, N.; Netea, M.G. Contributions of Neisseria meningitidis LPS and non-LPS to proinflammatory cytokine response. J. Leukoc. Biol. 2001, 70, 283–288. [Google Scholar] [CrossRef]
- Liu, Z.; Robinson, J.T.; Tabakman, S.M.; Yang, K.; Dai, H. Carbon materials for drug delivery & cancer therapy. Mater. Today 2011, 14, 316–323. [Google Scholar]
- Wang, Y.; Li, Z.; Wang, J.; Li, J.; Lin, Y. Graphene and graphene oxide: Biofunctionalization and applications in biotechnology. Trends Biotechnol. 2011, 29, 205–212. [Google Scholar] [CrossRef]
- Chung, C.; Kim, Y.K.; Shin, D.; Ryoo, S.R.; Hong, B.H.; Min, D.H. Biomedical applications of graphene and graphene oxide. Acc. Chem. Res. 2013, 46, 2211–2224. [Google Scholar] [CrossRef]
- Lundqvist, M.; Stigler, J.; Elia, G.; Lynch, I.; Cedervall, T.; Dawson, K.A. Nanoparticle size and surface properties determine the protein corona with possible implications for biological impacts. Proc. Natl. Acad. Sci. USA 2008, 105, 14265–14270. [Google Scholar] [CrossRef]
- Kenry Loh, K.P.; Lim, C.T. Molecular interactions of graphene oxide with human blood plasma proteins. Nanoscale 2016, 8, 9425–9441. [Google Scholar] [CrossRef]
- Wang, M.; Gustafsson, O.J.R.; Siddiqui, G.; Javed, I.; Kelly, H.G.; Blin, T.; Yin, H.; Kent, S.J.; Creek, D.J.; Kempe, K.; et al. Human plasma proteome association and cytotoxicity of nano-graphene oxide grafted with stealth polyethylene glycol and poly(2-ethyl-2-oxazoline). Nanoscale 2018, 10, 10863–10875. [Google Scholar] [CrossRef]
- Caputo, D.; Papi, M.; Coppola, R.; Palchetti, S.; Digiacomo, L.; Caracciolo, G.; Pozzi, D. A protein corona-enabled blood test for early cancer detection. Nanoscale 2017, 9, 349–354. [Google Scholar] [CrossRef]
- Lu, X.; Xu, P.; Ding, H.M.; Yu, Y.S.; Huo, D.; Ma, Y.Q. Tailoring the component of protein corona via simple chemistry. Nat. Commun. 2019, 10, 4520. [Google Scholar] [CrossRef]
- Gómez-Navarro, C.; Weitz, R.T.; Bittner, A.M.; Scolari, M.; Mews, A.; Burghard, M.; Kern, K. Electronic transport properties of individual chemically reduced graphene oxide sheets. Nano Lett. 2007, 7, 4520. [Google Scholar] [CrossRef]
- Li, D.; Müller, M.B.; Gilje, S.; Kaner, R.B.; Wallace, G.G. Processable aqueous dispersions of graphene nanosheets. Nat. Nanotechnol. 2008, 3, 101–105. [Google Scholar] [CrossRef]
- Robinson, J.T.; Zalalutdinov, M.; Baldwin, J.W.; Snow, E.S.; Wei, Z.; Sheehan, P.; Houston, B.H. Wafer-scale reduced graphene oxide films for nanomechanical devices. Nano Lett. 2008, 8, 3441–3445. [Google Scholar] [CrossRef]
- Luong, N.D.; Sinh, L.H.; Johansson, L.S.; Campell, J.; Seppälä, J. Functional graphene by thiol-ene click chemistry. Chem. A Eur. J. 2015, 21, 3183–3186. [Google Scholar] [CrossRef]
- Dimiev, A.M.; Alemany, L.B.; Tour, J.M. Graphene oxide. Origin of acidity, its instability in water, and a new dynamic structural model. ACS Nano 2013, 7, 576–588. [Google Scholar] [CrossRef]
- Shruthi Vighnesha, K.M.; Sandhya Sangeetha, D.N.; Selvakumar, M. Synthesis and Characterization of Reduced Graphene Oxide- Polyaniline Composite for Supercapacitor Applications. Surf. Eng. Appl. Electrochem. 2018, 54, 359–366. [Google Scholar] [CrossRef]
- Ilinskaya, A.N.; Dobrovolskaia, M.A. Nanoparticles and the blood coagulation system. Part II: Safety concerns. Nanomedicine 2013, 8, 969–981. [Google Scholar] [CrossRef] [PubMed]
- Feng, R.; Yu, Y.; Shen, C.; Jiao, Y.; Zhou, C. Impact of graphene oxide on the structure and function of important multiple blood components by a dose-dependent pattern. J. Biomed. Mater. Res. Part. A 2015, 103, 2006–2014. [Google Scholar] [CrossRef] [PubMed]
- Neklyudov, V.V.; Khafizov, N.R.; Sedov, I.A.; Dimiev, A.M. New insights into the solubility of graphene oxide in water and alcohols. Phys. Chem. Chem. Phys. 2017, 19, 17000–17008. [Google Scholar] [CrossRef] [PubMed]
- Esmaeili, Y.; Bidram, E.; Zarrabi, A.; Amini, A.; Cheng, C. Graphene oxide and its derivatives as promising In-vitro bio-imaging platforms. Sci. Rep. 2020, 10, 18052. [Google Scholar] [CrossRef]
- Mirrahimi, M.; Alamzadeh, Z.; Beik, J.; Sarikhani, A.; Mousavi, M.; Irajirad, R.; Khani, T.; Davani, E.S.; Farashahi, A.; Ardakani, T.S.; et al. A 2D nanotheranostic platform based on graphene oxide and phase-change materials for bimodal CT/MR imaging, NIR-activated drug release, and synergistic thermo-chemotherapy. Nanotheranostics 2022, 6, 350–364. [Google Scholar] [CrossRef]
- Liu, L.; Ma, Q.; Cao, J.; Gao, Y.; Han, S.; Liang, Y.; Zhang, T.; Song, Y.; Sun, Y. Recent progress of graphene oxide-based multifunctional nanomaterials for cancer treatment. Cancer Nano 2021, 12, 18. [Google Scholar]
- Park, S.; An, J.; Potts, J.R.; Velamakanni, A.; Murali, S.; Ruoff, R.S. Hydrazine-reduction of graphite- and graphene oxide. Carbon 2011, 49, 3019–3023. [Google Scholar] [CrossRef]
- Park, S.; Hu, Y.; Hwang, J.O.; Lee, E.S.; Casabianca, L.B.; Cai, W.; Potts, J.R.; Ha, H.W.; Chen, S.; Oh, J. Chemical structures of hydrazine-treated graphene oxide and generation of aromatic nitrogen doping. Nat. Commun. 2012, 3, 638–645. [Google Scholar] [CrossRef]
- Pan, D.C.; Myerson, J.W.; Brenner, J.S.; Patel, P.N.; Anselmo, A.C.; Mitragotri, S.; Muzykantov, V. Nanoparticle Properties Modulate Their Attachment and Effect on Carrier Red Blood Cells. Sci. Rep. 2018, 8, 1615. [Google Scholar] [CrossRef]
- Tavano, R.; Segat, D.; Reddi, E.; Kos, J.; Rojnik, M.; Kocbek, P.; Iratni, S.; Scheglmann, D.; Colucci, M.; Echevarria, I.M.R.; et al. Procoagulant properties of bare and highly PEGylated vinyl-modified silica nanoparticles. Nanomedicine 2010, 5, 881–896. [Google Scholar] [CrossRef]
Scheme 1.
Schematic chemical structure of GO, its derivatives showing different degrees of reduction (top panel), and functionalized derivatives of GO (bottom panel) investigated in this study.
Scheme 1.
Schematic chemical structure of GO, its derivatives showing different degrees of reduction (top panel), and functionalized derivatives of GO (bottom panel) investigated in this study.

Figure 1.
(A) Raman spectra of GO. (B) XPS spectra of GO in the C1s range (purple line) and a multipeak analysis for the carbon 1s (orange line). Green line was used to fit baseline. (C) TEM image of the GO showing aggregates (left), stacked flakes (centre) and single flakes (right).
Figure 1.
(A) Raman spectra of GO. (B) XPS spectra of GO in the C1s range (purple line) and a multipeak analysis for the carbon 1s (orange line). Green line was used to fit baseline. (C) TEM image of the GO showing aggregates (left), stacked flakes (centre) and single flakes (right).
Figure 2.
(A) UV spectra of reduced GO and rGO samples, obtained at a concentration of 0.05 mg/mL and pH 10. (B) Solid state FT-IR spectra of GO and rGO samples.
Figure 2.
(A) UV spectra of reduced GO and rGO samples, obtained at a concentration of 0.05 mg/mL and pH 10. (B) Solid state FT-IR spectra of GO and rGO samples.
Figure 3.
(A) Comparison of UV-Vis spectra of GO and eGO taken, respectively, at the concentrations 0.025 mg/m. (B) comparison of solid-state FT-IR spectra of GO and eGO.
Figure 3.
(A) Comparison of UV-Vis spectra of GO and eGO taken, respectively, at the concentrations 0.025 mg/m. (B) comparison of solid-state FT-IR spectra of GO and eGO.

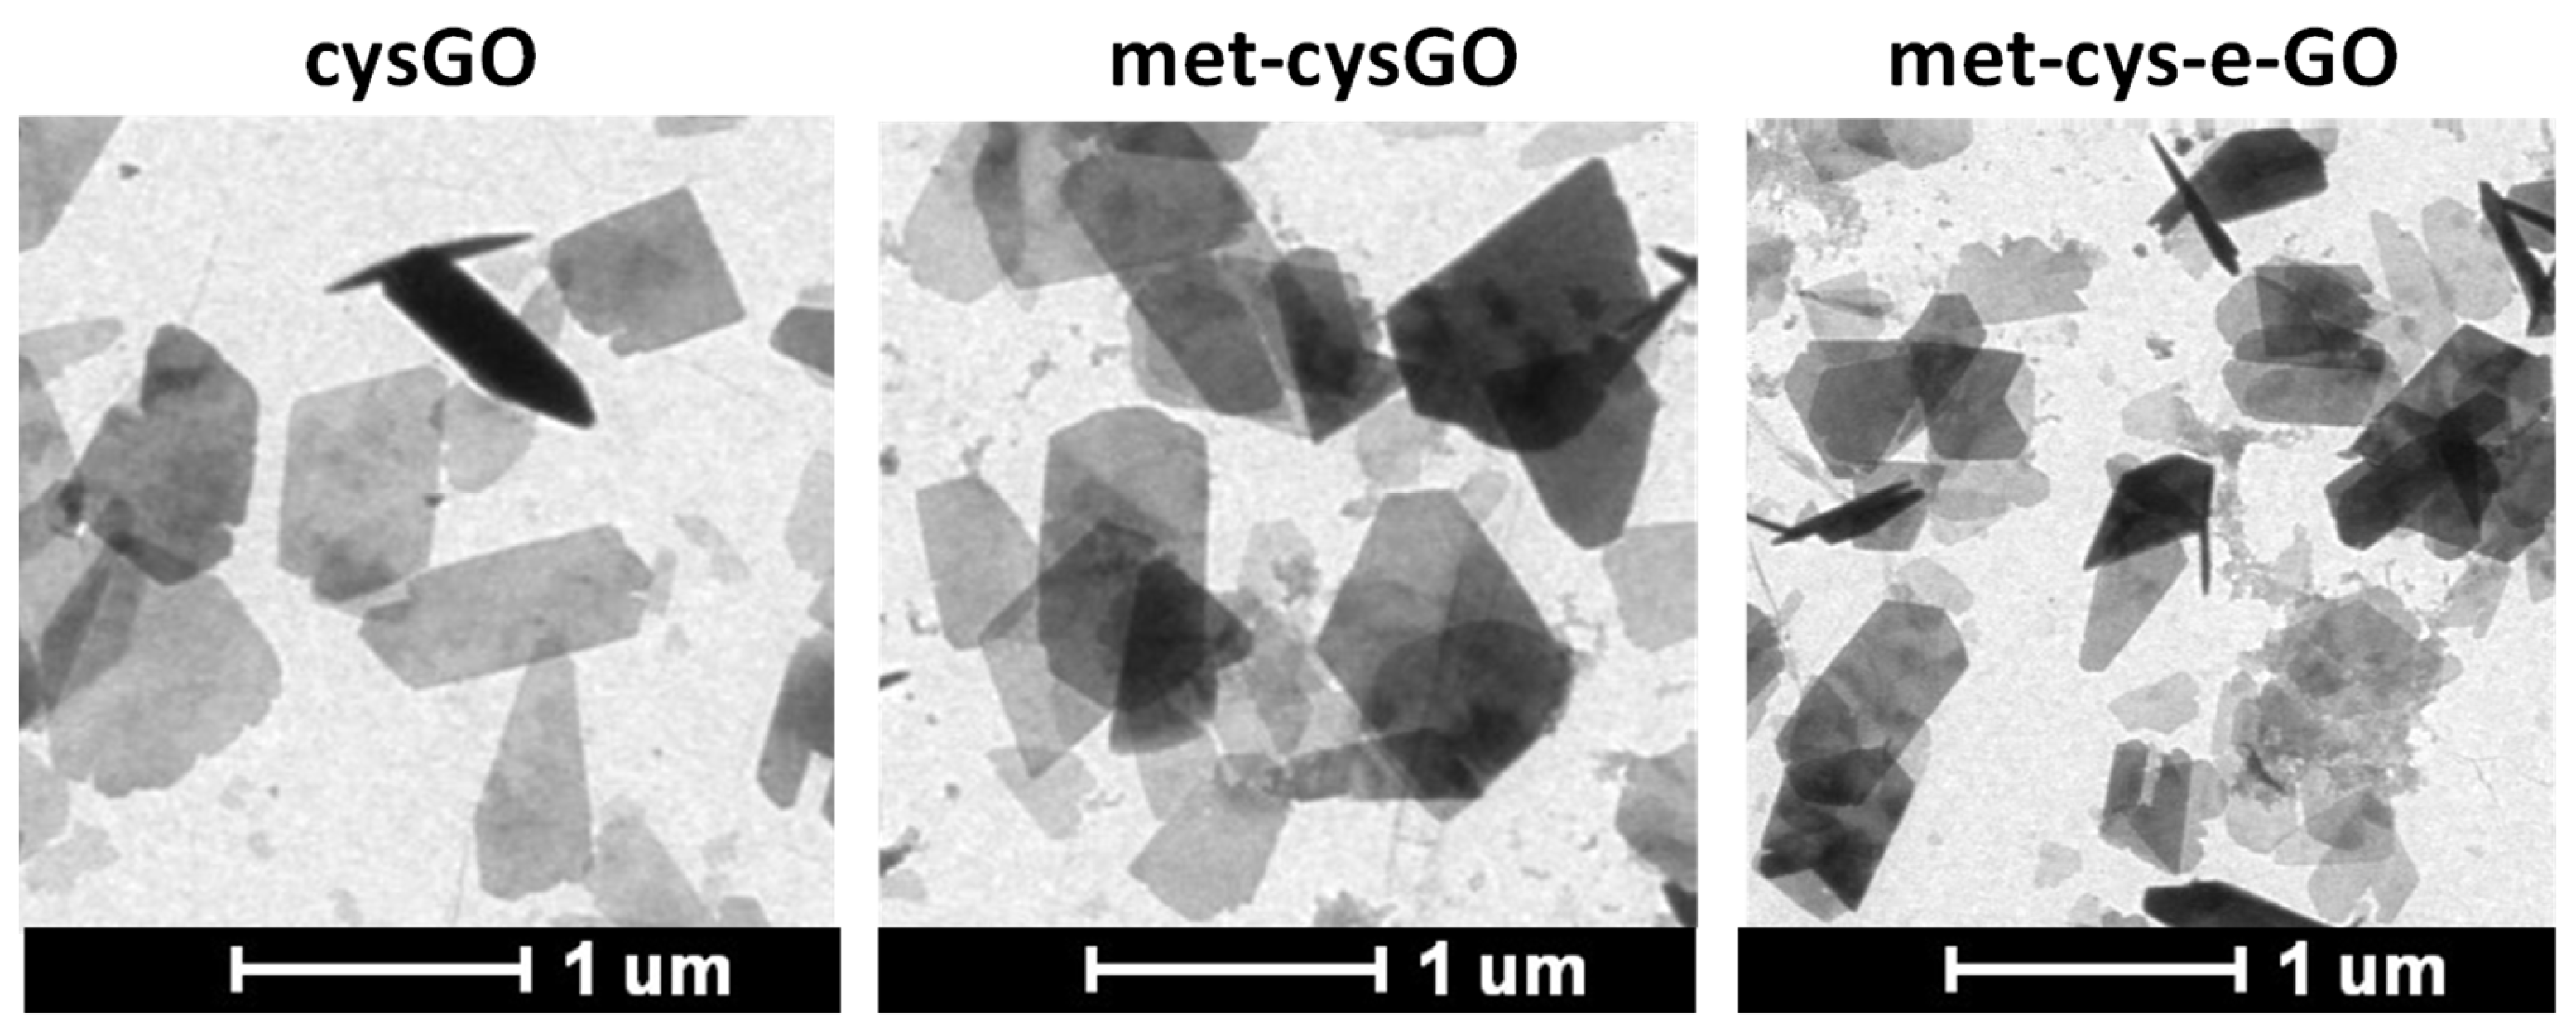
Figure 4.
TEM images of cysGO, met-cysGO and met-cys-e-GO.
Figure 5.
Hemolytic activity for GO and its selected reduced and functionalized derivatives at the concentrations of 2.5 μg/mL and 25 μg/mL, after 18 (left panels) and 24 h (right panels)-incubation with RBCs. Each data point is presented as mean ± absolute error (n = 2). Data are expressed as % of total hemolysis induced by pure distilled water (100% release).
Figure 6.
Hemolytic activity in HS and saline solution for GO and its selected reduced and functionalized derivatives at the concentration of 2.5 μg/mL, after 18 (left panels) and 24 h of incubation with RBCs (right panels). Each data point is presented as mean ± absolute error (n = 2).
Figure 6.
Hemolytic activity in HS and saline solution for GO and its selected reduced and functionalized derivatives at the concentration of 2.5 μg/mL, after 18 (left panels) and 24 h of incubation with RBCs (right panels). Each data point is presented as mean ± absolute error (n = 2).

Figure 7.
Comparison between ζ-potential measures (black squares) and EC50 (blue squares) for GO and its functionalized derivatives. ζ-potential data are presented as mean ± standard deviation (n = 3).
Figure 7.
Comparison between ζ-potential measures (black squares) and EC50 (blue squares) for GO and its functionalized derivatives. ζ-potential data are presented as mean ± standard deviation (n = 3).
Figure 8.
Pro-coagulant activity data for GO. Histograms representing values of t1/2 for the corresponding concentration of nanomaterial.
Figure 8.
Pro-coagulant activity data for GO. Histograms representing values of t1/2 for the corresponding concentration of nanomaterial.

Table 1.
ζ-potential value and C/O molar ratio for GO and eGO measured in PBS at pH 10.
| Ζ-Potential (mV) | C/O Molar Ratio | |
|---|---|---|
| GO | −38.8 ± 2 | 1.31 |
| eGO | −31.4 ± 0.9 | 1.58 |
Table 2.
ζ-potential value and C/O (eventually N/S) molar ratio for GO, cys-GO, cys-eGO and mba-GO measured in PBS at pH 10.
Table 2.
ζ-potential value and C/O (eventually N/S) molar ratio for GO, cys-GO, cys-eGO and mba-GO measured in PBS at pH 10.
| Ζ-Potential (mV) | C/O Molar Ratio | N/S Molar Ratio | |
|---|---|---|---|
| GO | −38.8 ± 2 | 1.31 | - |
| cysGO | −16.3 ± 1.2 | 1.64 | 1.05 |
| cys-eGO | −13.2 ± 0.5 | 1.71 | 1.08 |
| mbaGO | −27.1 ± 0.5 | 2.32 | - |
Table 3.
Comparison of ζ-potential, N/S molar ratio and C/O molar ratio for cysGO, cys-eGO, met-cysGO and met-cys-eGO measured in PBS at pH 10.
Table 3.
Comparison of ζ-potential, N/S molar ratio and C/O molar ratio for cysGO, cys-eGO, met-cysGO and met-cys-eGO measured in PBS at pH 10.
| ζ-Potential (mV) | C/O Molar Ratio | N/S Molar Ratio | |
|---|---|---|---|
| cysGO | −16.3 ± 1.2 | 1.64 | 1.05 |
| met-cysGO | −13.4 ± 1.1 | 1.76 | 1.09 |
| cys-eGO | −13.2 ± 0.5 | 1.71 | 1.08 |
| met-cys-eGO | −12.3 ± 0.8 | 1.95 | 0.97 |
Disclaimer/Publisher’s Note: The statements, opinions and data contained in all publications are solely those of the individual author(s) and contributor(s) and not of MDPI and/or the editor(s). MDPI and/or the editor(s) disclaim responsibility for any injury to people or property resulting from any ideas, methods, instructions or products referred to in the content. |
© 2024 by the authors. Licensee MDPI, Basel, Switzerland. This article is an open access article distributed under the terms and conditions of the Creative Commons Attribution (CC BY) license (https://creativecommons.org/licenses/by/4.0/).
Share and Cite
MDPI and ACS Style
Pieretti, F.; Moretto, A.; Papini, E.; Tavano, R. Graphene Oxide Chemical Refining Screening to Improve Blood Compatibility of Graphene-Based Nanomaterials. J. Nanotheranostics 2024, 5, 13-28. https://doi.org/10.3390/jnt5010002
AMA Style
Pieretti F, Moretto A, Papini E, Tavano R. Graphene Oxide Chemical Refining Screening to Improve Blood Compatibility of Graphene-Based Nanomaterials. Journal of Nanotheranostics. 2024; 5(1):13-28. https://doi.org/10.3390/jnt5010002
Chicago/Turabian StylePieretti, Fabio, Alessandro Moretto, Emanuele Papini, and Regina Tavano. 2024. "Graphene Oxide Chemical Refining Screening to Improve Blood Compatibility of Graphene-Based Nanomaterials" Journal of Nanotheranostics 5, no. 1: 13-28. https://doi.org/10.3390/jnt5010002