Urinary Metabolomics around Parturition Identifies Metabolite Alterations in Dairy Cows Affected Postpartum by Lameness: Preliminary Study

 ,
, 
 ,
,  and
and 
Abstract
:Summary
Abstract
1. Introduction
2. Materials and Methods
2.1. Animals and Monitoring of Clinical Health Status
2.2. Urine Sample Collection
2.3. NMR Compound Identification and Quantification
2.4. Statistical Analysis
3. Results
3.1. 1NMR Urinary Analysis of Lame Cows
3.2. Metabolite Alterations before Diagnosis of Lameness
3.3. Metabolite Alteration During Lameness Week
3.4. Metabolite Alterations after Diagnosis of Lameness
4. Discussion
5. Conclusions
Supplementary Materials
Author Contributions
Funding
Acknowledgments
Conflicts of Interest
References
- Van Nuffel, A.; Zwertvaegher, I.; Pluym, L.; Van Weyenberg, S.; Thorup, V.M.; Pastell, M.; Sonck, B.; Saeys, W. Lameness detection in dairy cows: Part 1. How to distinguish between non-lame and lame cows based on differences in locomotion or behavior. Animals 2015, 5, 838–860. [Google Scholar] [CrossRef] [PubMed] [Green Version]
- Solano, L.; Barkema, H.W.; Pajor, E.A.; Mason, S.; LeBlanc, S.J.; Zaffino Heyerhoff, J.C.; Nash, C.G.; Haley, D.B.; Vasseur, E.; Pellerin, D.; et al. Prevalence of lameness and associated risk factors in Canadian Holstein-Friesian cows housed in freestall barns. J. Dairy Sci. 2015, 98, 6978–6991. [Google Scholar] [CrossRef] [PubMed] [Green Version]
- Adams, A.E.; Lombard, J.E.; Fossler, C.P.; Román-Muñiz, I.N.; Kopral, C.A. Associations between housing and management practices and the prevalence of lameness, hock lesions, and thin cows on US dairy operations. J. Dairy Sci. 2017, 100, 2119–2136. [Google Scholar] [CrossRef] [PubMed]
- Jewell, M.T.; Cameron, M.; Spears, J.; McKenna, S.L.; Cockram, M.S.; Sanchez, J.; Keefe, G.P. Prevalence of hock, knee, and neck skin lesions and associated risk factors in dairy herds in the Maritime Provinces of Canada. J. Dairy Sci. 2019, 102, 3376–3391. [Google Scholar] [CrossRef] [PubMed] [Green Version]
- van der Linde, C.; de Jong, G.; Koenen, E.P.; Eding, H. Claw health index for Dutch dairy cattle based on claw trimming and conformation data. J. Dairy Sci. 2010, 93, 4883–4891. [Google Scholar] [CrossRef]
- Nocek, J.E. Bovine acidosis: Implications on laminitis. J. Dairy Sci. 1997, 80, 1005–1028. [Google Scholar] [CrossRef]
- Cook, N.B.; Nordlund, K.V.; Oetzel, G.R. Environmental influences on claw horn lesions associated with laminitis and subacute ruminal acidosis in dairy cows. J. Dairy Sci. 2004, 87, E36–E46. [Google Scholar] [CrossRef] [Green Version]
- Baird, L.G.; O’Connell, N.E.; McCoy, M.A.; Keady, T.W.; Kilpatrick, D.J. Effects of breed and production system on lameness parameters in dairy cattle. J. Dairy Sci. 2009, 92, 2174–2182. [Google Scholar] [CrossRef] [Green Version]
- Guard, C.L. The cost of common diseases of dairy cattle. In Proceedings of the Central Veterinary Conferences, San Diego, CA, USA, November 2008. [Google Scholar]
- Garbarino, E.; Hernandez, J.; Shearer, J.; Risco, C.; Thatcher, W. Effect of lameness on ovarian activity in postpartum Holstein cows. J. Dairy Sci. 2004, 87, 4123–4131. [Google Scholar] [CrossRef] [Green Version]
- Melendez, P.; Bartolome, J.; Archbald, L.F.; Donovan, A. The association between lameness, ovarian cysts and fertility in lactating dairy cows. Theriogenology 2003, 59, 927–937. [Google Scholar] [CrossRef]
- Zhang, G.; Hailemariam, D.; Dervishi, E.; Deng, Q.; Goldansaz, S.A.; Dunn, S.M.; Ametaj, B.N. Alterations of innate immunity reactants in transition dairy cows before clinical signs of lameness. Animals 2015, 5, 717–747. [Google Scholar] [CrossRef]
- Hernandez, J.; Garbarino, E.; Shearer, J.; Risco, C.; Thatcher, W. Comparison of milk yield in Holstein cows with different degrees of lameness. J. Am. Vet. Med. Assoc. 2005, 227, 1292–1296. [Google Scholar] [CrossRef] [Green Version]
- Canadian Council on Animal Care. Guide to the Care and Use of Experimental Animals, 2nd ed.; Olfert, E.D., Cross, B.M., McWilliam, A.A., Eds.; CCAC: Ottawa, ON, Canada, 1993; Volume 1, pp. 1–298. [Google Scholar]
- National Research Council. Nutrient Requirements of Dairy Cattle, 7th ed.; NRC National Academy Press: Washington, DC, USA, 2001. [Google Scholar]
- Sprecher, D.J.; Hostetler, D.E.; Kaneene, J.B. A lameness scoring system that uses posture and gait to predict dairy cattle reproductive performance. Theriogenology 1997, 47, 1179–1187. [Google Scholar] [CrossRef]
- Dervishi, E.; Zhang, G.; Hailemariam, D.; Mandal, R.; Wishart, D.S.; Ametaj, B.N. Urine metabolic fingerprinting can be used to predict the risk of metritis and highlight the pathobiology of the disease in dairy cows. Metabolomics 2018, 14, 83. [Google Scholar] [CrossRef]
- Saude, E.J.; Slupsky, C.M.; Sykes, B.D. Optimization of NMR analysis of biological fluids for quantitative accuracy. Metabolomics 2006, 2, 113–123. [Google Scholar] [CrossRef]
- Bouatra, S.; Aziat, F.; Mandal, R.; Guo, A.C.; Wilson, M.R.; Knox, C.; Bjorndahl, T.C.; Krishnamurthy, R.; Saleem, F.; Liu, P.; et al. The human urine metabolome. PLoS ONE 2013, 8. [Google Scholar] [CrossRef] [Green Version]
- Weljie, A.M.; Newton, J.; Mercier, P.; Carlson, E.; Slupsky, C.M. Targeted profiling: Quantitative analysis of 1H-NMR metabolomics data. Anal. Chem. 2006, 78, 4430–4442. [Google Scholar] [CrossRef]
- Wishart, D.S. Quantitative metabolomics using NMR. Trends Anal. Chem. 2008, 27, 228–237. [Google Scholar] [CrossRef]
- R Development Core Team. R: A Language and Environment for Statistical Computing; R Foundation for Statistical Computing: Vienna, Austria, 2008; ISBN 3-900051-07-0. Available online: http://www.R-project.org (accessed on 15 November 2019).
- Xia, J.; Broadhurst, D.I.; Wilson, M.; Wishart, D.S. Translational biomarker discovery in clinical metabolomics: An introductory tutorial. Metabolomics 2013, 9, 280–299. [Google Scholar] [CrossRef] [Green Version]
- Karnovsky, A.; Weymouth, T.; Hull, T.; Tarcea, V.G.; Scardoni, G.; Laudanna, C.; Sartor, M.A.; Stringer, K.A.; Jagadish, H.V.; Burant, C.; et al. Metscape 2 bioinformatics tool for the analysis and visualization of metabolomics and gene expression data. Bioinformatics 2012, 28, 373–380. [Google Scholar] [CrossRef] [Green Version]
- Shannon, P.; Markiel, A.; Ozier, O.; Baliga, N.S.; Wang, J.T.; Ramage, D.; Amin, N.; Schwikowski, B.; Ideker, T. Cytoscape: A software environment for integrated models of biomolecular interaction networks. Genome Res. 2003, 13, 2498–2504. [Google Scholar] [CrossRef]
- Emmanuel, D.G.; Dunn, S.M.; Ametaj, B.N. Feeding high proportions of barley grain stimulates an inflammatory response in dairy cows. J. Dairy Sci. 2008, 91, 606–614. [Google Scholar] [CrossRef] [Green Version]
- Ducker, G.S.; Rabinowitz, J.D. One-carbon metabolism in health and disease. Cell Metab. 2017, 25, 27–42. [Google Scholar] [CrossRef] [Green Version]
- Rowe, P.B.; Sauer, D.; Fahey, D.; Craig, G.; McCairns, E. One-carbon metabolism in lectin-activated human lymphocytes. Arch. Biochem. Biophys. 1985, 236, 277–288. [Google Scholar] [CrossRef]
- Bao, X.R.; Ong, S.E.; Goldberger, O.; Peng, J.; Sharma, R.; Thompson, D.A.; Vafai, S.B.; Cox, A.G.; Marutani, E.; Ichinose, F.; et al. Mitochondrial dysfunction remodels one-carbon metabolism in human cells. eLife 2016, 5. [Google Scholar] [CrossRef]
- Nathan, C.F.; Murray, H.W.; Wiebe, M.E.; Rubin, B.Y. Identification of interferon-γ as the lymphokine that activates human macrophage oxidative metabolism and antimicrobial activity. J. Experim. Med. 1983, 158, 670–689. [Google Scholar] [CrossRef] [Green Version]
- Murr, C.; Grammer, T.B.; Meinitzer, A.; Kleber, M.E.; März, W.; Fuchs, D. Immune activation and inflammation in patients with cardiovascular disease are associated with higher phenylalanine to tyrosine ratios: The ludwigshafen risk and cardiovascular health study. J. Amino Acids 2014. [Google Scholar] [CrossRef] [Green Version]
- Geisler, S.; Gostner, J.M.; Becker, K.; Ueberall, F.; Fuchs, D. Immune activation and inflammation increase the plasma phenylalanine-to-tyrosine ratio. Pteridines 2013, 24, 27–31. [Google Scholar] [CrossRef]
- Ploder, M.; Neurauter, G.; Spittler, A.; Schroecksnadel, K.; Roth, E.; Fuchs, D. Serum phenylalanine in patients post trauma and with sepsis correlate to neopterin concentrations. Amino Acids 2008, 35, 303–307. [Google Scholar] [CrossRef]
- Combs, G.F.; McClung, J.P. Pantothenic Acid, the Vitamins, Fundamental Aspects in Ntrition and Health, 5th ed.; Academic Press: Cambridge, MA, USA, 2017; pp. 387–398. [Google Scholar]
- Brockman, R.P. Glucose and short-chain fatty acid metabolism. In Quantitative Aspects of Ruminant Digestion and Metabolism; Forbes, J.M., France, J., Eds.; CAB International: Wallingford, UK, 1993; pp. 249–263. [Google Scholar]
- Craig, R.M.; Atkinson, A.J., Jr. D-xylose testing: A review. Gastroenterology 1988, 95, 223–231. [Google Scholar] [CrossRef]
- Xian, X.; Gopal, S.; Couchman, J.R. Syndecans as receptorsand organizers of the extracellular matrix. Cell Tissue Res. 2010, 339, 31–46. [Google Scholar] [CrossRef]
- Ramnath, R.; Foster, R.R.; Qiu, Y.; Cope, G.; Butler, M.J.; Salmon, A.H.; Mathieson, P.W.; Coward, R.J.; Welsh, G.I.; Satchell, S.C. Matrix metalloproteinase 9-mediated shedding of syndecan 4 in response to tumor necrosis factor α: A contributor to endothelial cell glycocalyx dysfunction. FASEB J. 2014, 11, 4686–4699. [Google Scholar] [CrossRef]
- Goodall, K.J.; Poon, I.K.; Phipps, S.; Hulett, M.D. Soluble heparan sulfate fragments generated by heparanase trigger the release of pro-inflammatory cytokines through TLR-4. PLoS ONE 2014, 9. [Google Scholar] [CrossRef]
- Peroni, J.F.; Harrison, W.E.; Moore, J.N.; Graves, J.E.; Lewis, S.J.; Krunkosky, T.M.; Robertson, T.P. Black walnut extract-induced laminitis in horses is associated with heterogeneous dysfunction of the laminar microvasculature. Equine Vet. J. 2005, 37, 546–551. [Google Scholar] [CrossRef]
- Marechal, X.; Favory, R.; Joulin, O.; Montaigne, D.; Hassoun, S.; Decoster, B.; Zerimech, F.; Neviere, R. Endothelial glycocalyx damage during endotoxemia coincides with microcirculatory dysfunction and vascular oxidative stress. Shock 2008, 5, 572–576. [Google Scholar] [CrossRef]
- Robertson, T.P.; Bailey, S.R.; Peroni, J.F. Equine laminitis: A journey to the dark side of venous. Vet. Immunol. Immunopathol. 2009, 129, 164–166. [Google Scholar] [CrossRef]
- Häussinger, D. The role of liver in acid-base regulation. In Anesthesia, Pain, Intensive Care and Emergency Medicine; Guillo, A., Ed.; Springer: Berlin/Heidelberg, Germany, 1998; pp. 371–380. [Google Scholar]
- Häussinger, D. Liver regulation of acid-base balance. Miner. Electrolyte Metab. 1997, 23, 249–252. [Google Scholar]
- Noda, Ch.; Ichihara, A. Control of ketogenesis from amino acids. J. Biochem. 1976, 80, 1159–1164. [Google Scholar] [CrossRef]
- Iseri, V.J.; Klasing, K.C. Changes in the amount of lysine in protective proteins and immune cells after a systemic response to dead Escherichia coli: Implications for the nutritional costs of immunity. Integr. Comp. Biol. 2014, 54, 922–930. [Google Scholar] [CrossRef]

| Metabolite (µM) | −8 Weeks Prior to Parturition | −4 Weeks Prior to Parturition | ||||||
|---|---|---|---|---|---|---|---|---|
| Lameness | Control | p-Value | Fold-Change | Lameness | Control | p-Value | Fold Change | |
| Formate | 24.63 (6.72) | 49.64 (29.68) | 0.01 | −2.02 | 27.88 (22.80) | 42.67 (24) | 0.03 | −1.53 |
| Tyrosine | 8.90 (2.76) | 15.40 (5.47) | 0.01 | −1.73 | 6.90 (4.36) | 13.06 (5.05) | 0.006 | −1.89 |
| Uracil | 15.66 (5.98) | 146 (99) | 0.001 | −9.36 | 29.96 (9.26) | 144 (97) | 0.01 | −4.82 |
| N,N-Dimethyl-glycine | 1.79 (0.79) | 4.07 (1.92) | 0.01 | −2.27 | 1.81 (0.95) | 4.01 (3.17) | 0.01 | −2.21 |
| Pantothenate | 13.12 (3.32) | 9.58 (3.47) | 0.03 | 1.37 | 12.89 (5.47) | 6.81 (3.04) | 0.001 | +1.89 |
| Hypoxanthine | 2.90 (0.92) | 1.77 (1.12) | 0.03 | 1.64 | 4.61 (3.49) | 1.73 (1.37) | 0.003 | +2.67 |
| Lysine | 30.59 (3.77) | 18.44 (7.77) | 0.001 | 1.66 | 32.28 (16.54) | 15.84 (6.79) | 0.001 | +2.04 |
| Metabolites | AUC | 95% CI | Adjusted p-Value |
|---|---|---|---|
| Uracil, 2-Aminobutyrate, 3-Hydroxy-3-methylglutarate, Valine and Tyrosine | −8 weeks before parturition 0.95 | 0.81–1 | 0.002 |
| Lysine, Histidine, Methanol, and Tyrosine | −4 weeks before parturition 1 | 1–1 | 0.001 |
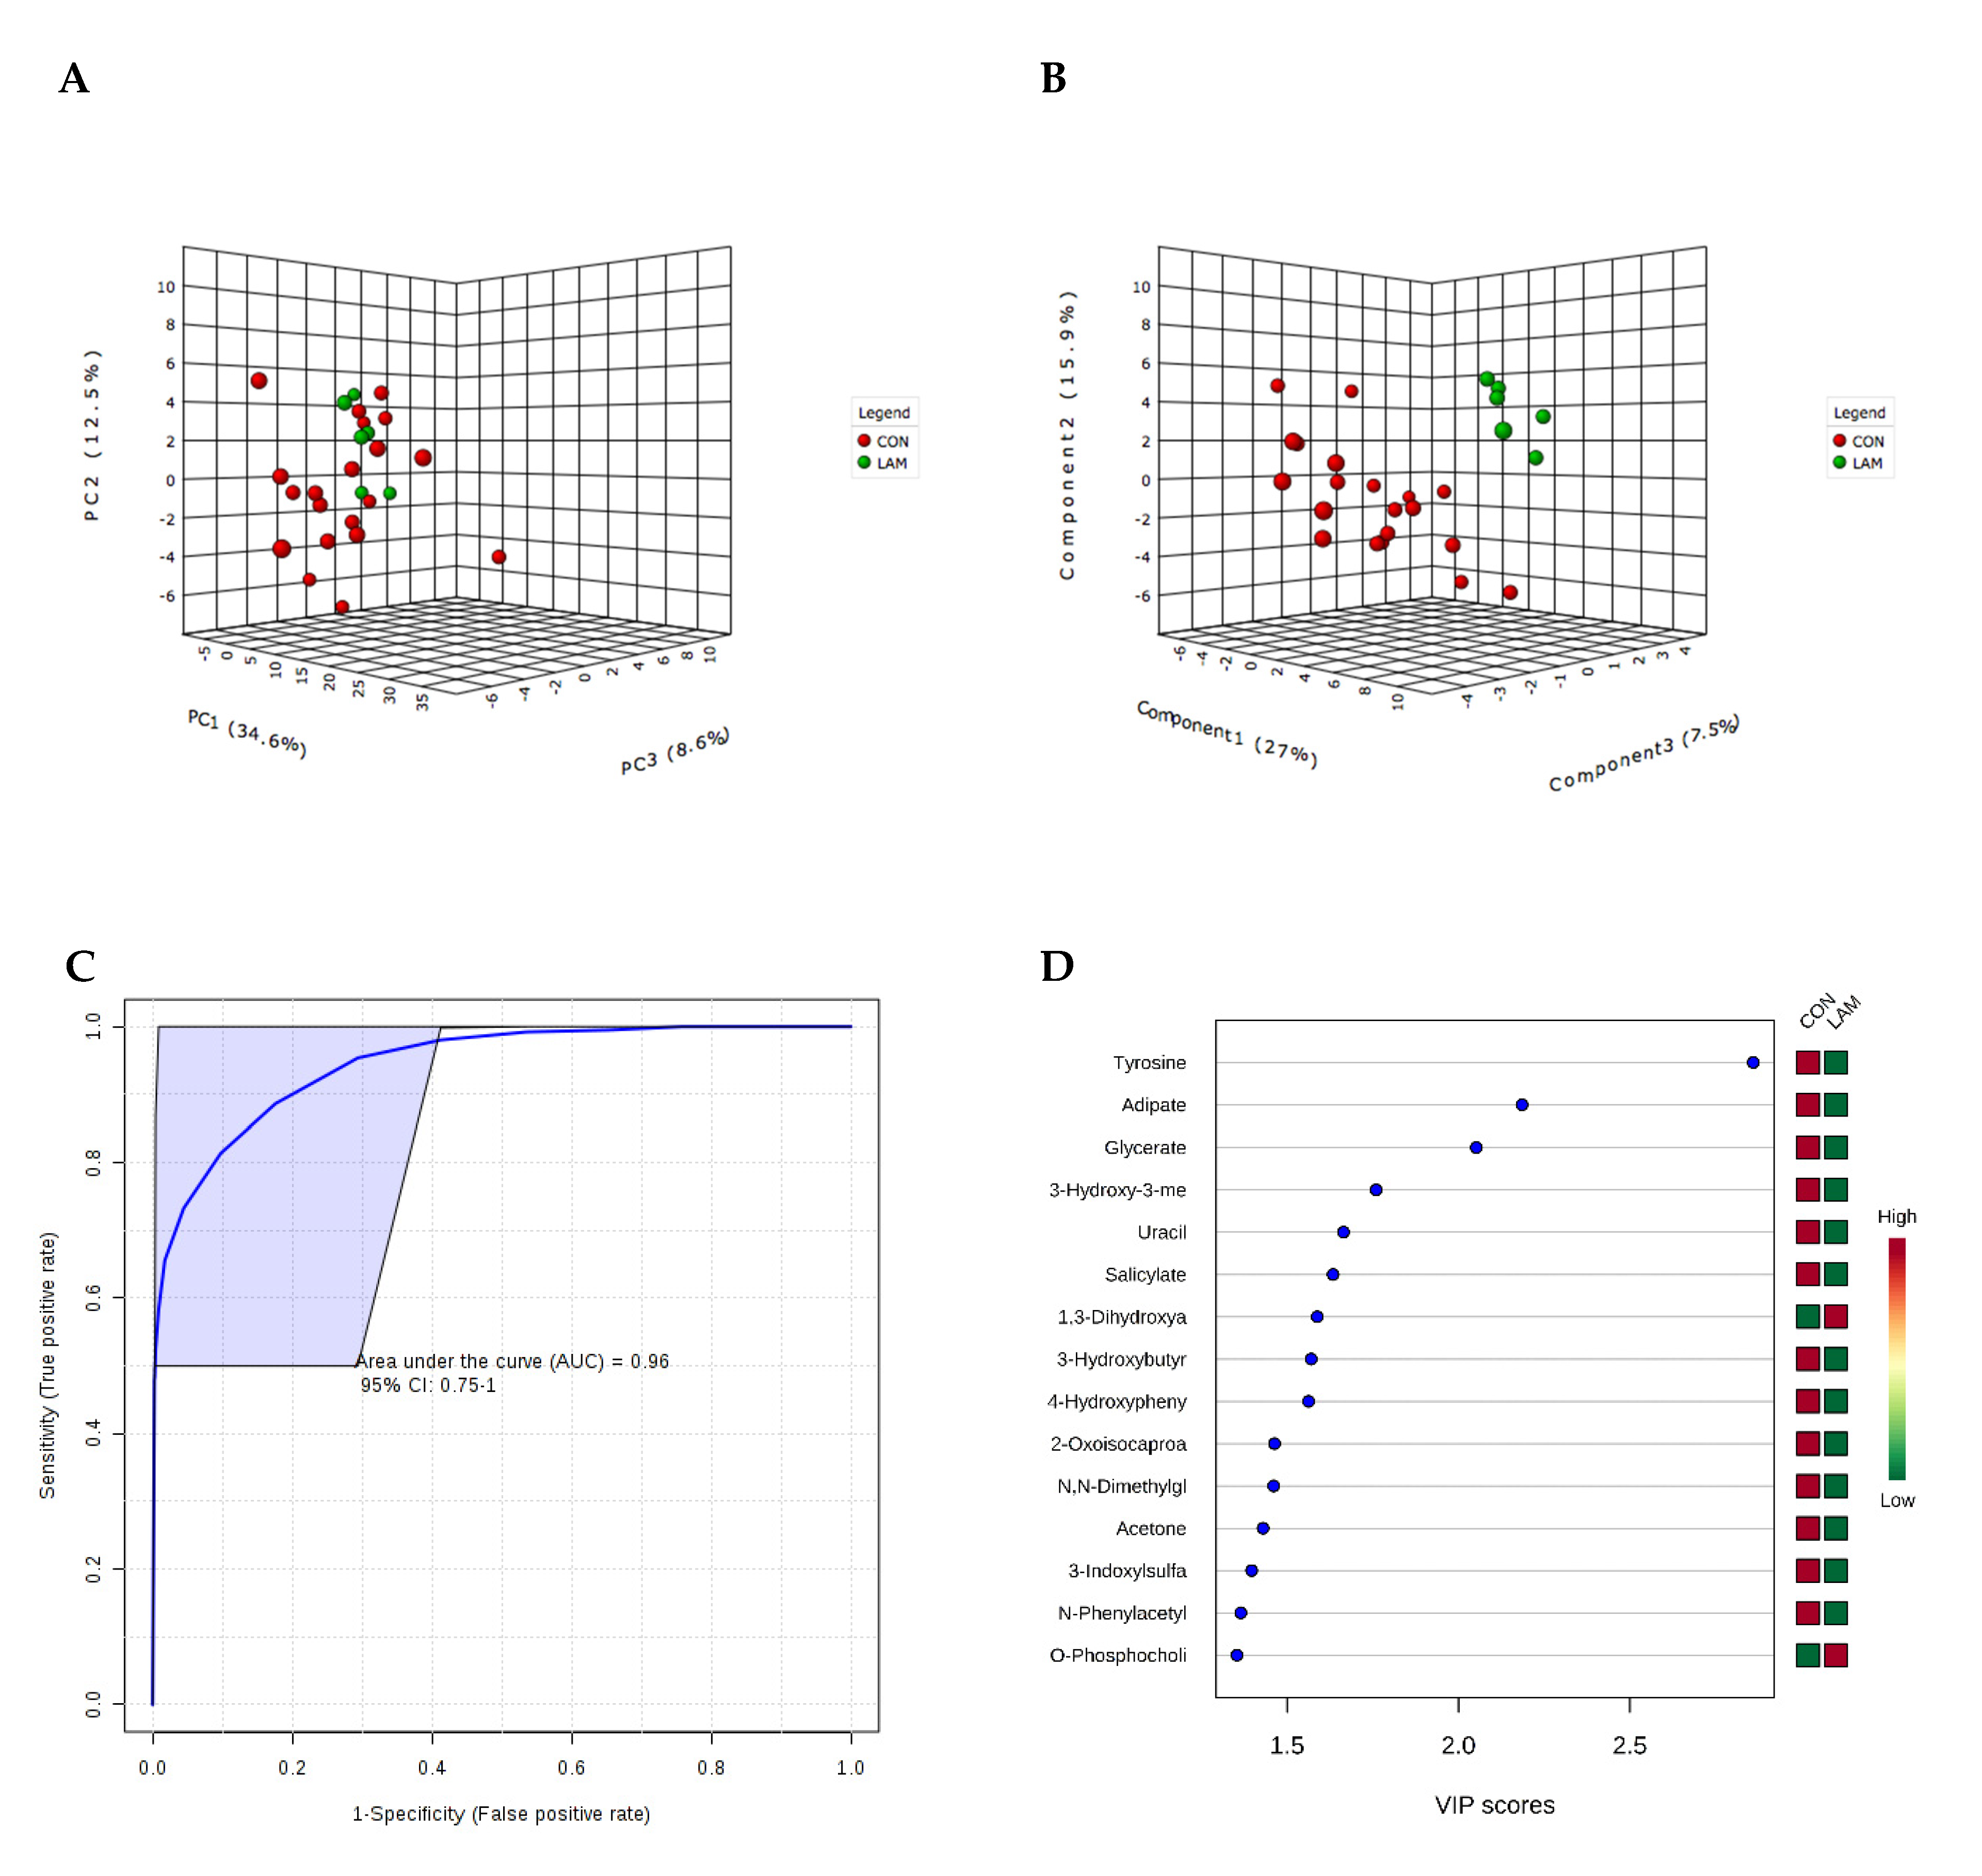
| Tyrosine, Adipate and Glycerate | Week of LAM diagnosis 0.96 | 0.75–1 | 0.015 |
| N-Acetylaspartate, Glutamine, Imidazole, Pantothenate, beta-Alanine and Trimethylamine | +4 weeks after parturition 0.78 | 0.11–1 | NS |
| Hipurate, Pantothenate and 1,3-Dihydroxyacetone | +8 weeks after parturition 0.91 | 0.5–1 | NS |
| Metabolite µM | Lameness | Control | p-Value | Fold Change |
|---|---|---|---|---|
| 2-Hydroxyisobutyrate | 4.46 (0.53) | 5.74 (2.08) | 0.02 | −1.29 |
| 3-Hydroxy-3-methylglutarate | 7.16 (2.05) | 12.52 (6.31) | 0.02 | −1.75 |
| 4-Hydroxyphenylacetate | 7.54 (3.60) | 18.98 (13.15) | 0.001 | −2.52 |
| Adipate | 60.11 (14.01) | 96.98 (33.54) | 0.002 | −1.61 |
| Glycerate | 42.0 (21.44) | 85.14 (55.35) | 0.01 | −2.03 |
| Tyrosine | 8.54 (3.50) | 24.44 (10.66) | 0.0001 | −2.86 |
| Uracil | 48.78 (14.23) | 194.56 (153.12) | 0.0004 | −3.99 |
| Urea | 1707 (464.55) | 7893,42 (6576,60) | 0.0005 | −4.62 |
| Valine | 8.21 (2.06) | 11.86 (5.74) | 0.02 | −1.44 |
| +4 Weeks after Parturition | ||||
|---|---|---|---|---|
| Metabolite µM | Lameness | Control | p-Value | Fold Change |
| Glutamine | 59.73 (40.63 | 25.97 (11.27) | 0.04 | +2.3 |
| Imidazole | 68.80 (46.40) | 30.72 (5.87) | 0.02 | +2.24 |
| N-Acetylaspartate | 36.02 (19.12) | 11.27 (3.83) | 0.02 | +3.2 |
| Pantothenate | 29.28 (11.75) | 16.65 (10.14) | 0.04 | +1.76 |
| +8 weeks after parturition | ||||
| 1,3-Dihydroxyacetone | 16.76 (6.76) | 6.16 (4.14) | 0.008 | +2.72 |
| Galactose | 21.48 (6.49) | 10.63 (9.23) | 0.04 | +2.02 |
| Hippurate | 166.94 (67.97) | 41.67 (31.89) | 0.002 | +4.01 |
| Pantothenate | 25.49 (12.33) | 12.33 (8.92) | 0.04 | +2.07 |
© 2020 by the authors. Licensee MDPI, Basel, Switzerland. This article is an open access article distributed under the terms and conditions of the Creative Commons Attribution (CC BY) license (http://creativecommons.org/licenses/by/4.0/).
Share and Cite
Zhang, G.; Dervishi, E.; Zwierzchowski, G.; Mandal, R.; Wishart, D.S.; Ametaj, B.N. Urinary Metabolomics around Parturition Identifies Metabolite Alterations in Dairy Cows Affected Postpartum by Lameness: Preliminary Study. Dairy 2020, 1, 6-19. https://doi.org/10.3390/dairy1010002
Zhang G, Dervishi E, Zwierzchowski G, Mandal R, Wishart DS, Ametaj BN. Urinary Metabolomics around Parturition Identifies Metabolite Alterations in Dairy Cows Affected Postpartum by Lameness: Preliminary Study. Dairy. 2020; 1(1):6-19. https://doi.org/10.3390/dairy1010002
Chicago/Turabian StyleZhang, Guanshi, Elda Dervishi, Grzegorz Zwierzchowski, Rupasri Mandal, David S. Wishart, and Burim N. Ametaj. 2020. "Urinary Metabolomics around Parturition Identifies Metabolite Alterations in Dairy Cows Affected Postpartum by Lameness: Preliminary Study" Dairy 1, no. 1: 6-19. https://doi.org/10.3390/dairy1010002