
High Glass Waste Incorporation towards Sustainable High-Performance Concrete


CTAC—Centre for Territory, Environment and Construction, University of Minho, 4800-058 Guimarães, Portugal
*
Author to whom correspondence should be addressed.
CivilEng 2024, 5(1), 41-64; https://doi.org/10.3390/civileng5010003
Submission received: 19 September 2023
/
Revised: 3 November 2023
/
Accepted: 13 December 2023
/
Published: 10 January 2024
(This article belongs to the Special Issue High-Performance Concrete and Durability of Concrete Structures)
Abstract
:The use of waste as supplementary cementitious materials (SCMs) in concrete is already widespread, with glass waste being an increasingly used option. The utilization of glass waste as a partial substitute for cement in small proportions has shown satisfactory outcomes. Nevertheless, substituting cement in high proportions requires further investigation. Experimental research was carried out on the mechanical and durability properties of concrete with the replacement of cement by glass powder (GP), at a high volume equal to 50%. Binder content (cement plus GP) varied from 300 to 500 kg/m3. The results are promising regarding the use of the high volume of GP in high-performance concretes. The specimens with 500 kg/m3 of binder (50% of which was GP-G250) achieved almost 55 MPa at 28 days. The specimen with the lowest resistance was G150, with 32 MPa. This result may be related to the high pozzolanic activity index of the used GP. The specimens with GP showed satisfactory performance regarding chloride migration, with diffusion coefficients always below those of the reference specimens. The G250 concrete showed a reduction of 58%. Regarding open porosity, concretes with 50% GP had a lower porosity than the reference concretes. The smallest reduction (21%) occurred in the G150 concrete. The reduction in porosity provided by the fineness of the GP may be the main cause of this high performance. Concerning capillary absorption, the GP concretes have a reduction that varies between 47% for G150 and 67% for G250. This fact may be related to the existence of a larger quantity of larger-sized capillary pores in the reference concretes.
1. Introduction
Concrete has established itself over the years as a fundamental material for human development. Due to its ease of molding, ability to create relatively complex structures at low cost using readily available materials, simple production processes, and low maintenance requirements, as well as its high durability, concrete has become the most widely consumed manufactured material on the planet. Approximately 14 billion cubic meters of concrete are used each year, and this number is expected to increase by 12% to 23% by 2050 [1].
The production of cement, the key binder in concrete, accounts for approximately 7% of global CO2 emissions [2], making it a priority target for actions to reduce global emissions.
The increasing demand for new construction puts pressure on existing non-renewable natural resources. These resources are not infinite, and sustainable consumption is necessary to ensure that future generations will have access to them.
Within the scientific community there has been significant investment in the search for alternative materials to partially replace cement in concrete production [3,4,5,6,7,8]. On the other hand, several studies have focused on the use of a wide range of materials as a replacement or even for incorporation as aggregate [9,10,11], whether in an attempt to find a destination for a waste or even in the search to improve specific characteristics of concrete or mortars. Among the studied alternatives, many are derived from industrial or agricultural waste or by-products such as fly ash [12,13,14,15,16,17], silica fume [18], blast furnace slag [19], rice husk ash [20], sludge from the cutting of ornamental rocks [21,22,23], coal bottom ash [24], and ceramic waste [25].
Many of these materials have little or no significant value and are often considered a problem in waste management, leading to various inconveniences in landfills. Therefore, enabling the reuse of these waste materials as inputs holds special value as it promotes a circular economy, helps reduce emissions, and contributes to a more sustainable production cycle.
Glass is one of the most versatile materials. Glass packaging is an inorganic, homogeneous, and inert product resulting from the fusion, at approximately 1600 °C, of its raw materials: silica (sand), calcium oxide (lime), sodium carbonate, vitrifying agents, fluxes, stabilizers, cullet (recycled glass), and other secondary components [26]. More than 23.4 million tons of glass were produced for the European and global markets in 2021 [27]. It is expected that total glass production will increase due to industrialization and the growing substitution of plastic packaging with glass.
The total amount of glass waste (all types) in the EU in 2020 was 17,830,000 tons [28]. In Portugal, in 2021, 410,243 tons of waste from glass packaging were accounted for, with only 50% being recycled [28]. The remaining balance poses a significant management problem for landfills in large cities, as glass is non-biodegradable. While this is detrimental, it can be understood that if properly managed, it can become a great benefit since glass is 100% recyclable.
Although a significant portion of glass is recycled in the production of new glass when glass waste is not suitable for recycling, the material can be ground and used for other purposes, and that is where it becomes interesting for the construction industry. The use of glass powder derived from glass containers, incorporated into concrete as a partial substitute for cement, has shown promising potential. It is an abundant and inexpensive waste material that is easy to transform into an input, meeting the requirements for cement replacement not only in terms of mechanical demands [29,30,31] but also in terms of durability [32]. Moreover, it is an environmentally appealing solution to reduce landfill volume, contributing to the reduction in global emissions, and preserving natural resources [30,31].
Recycled glass derived from containers has been used both as fine aggregate in concrete [32] and as supplementary cementitious materials (SCMs) [33,34,35,36,37,38] due to its amorphous nature and high silica content.
Studies also show that when glass waste is used as finely ground powder [39], the fine glass particles behave as a pozzolanic material [40], reacting with cement hydrates to form secondary calcium silicate hydrate (C-S-H), enhancing the long-term strength and durability of concrete [41].
The particle size of glass is, therefore, a key factor for its use as a substitute for cement [42]. Particles below 75 μm are potentially favorable for pozzolanic reactions [43,44,45,46]. ASTM C1866 [47] recommends that the particle size be below 45 μm.
Mechanical strength is a crucial property when considering the structural use of concrete. Shao et al. [29] measured the mechanical strength of a soda–lime glass as an additive using three different glass powders (maximum particle sizes of 150, 75, and 38 μm). Compressive strength tests were conducted on concrete samples with 30% volume substitution of cement with glass powder to study the development of strength in concrete containing glass at early and late ages. The results indicated that the mixture containing 38 μm glass powder performed the best, surpassing the reference strength at 90 days. It was also evident that glass demonstrated an increase in strength at later ages, indicating a slower pozzolanic behavior.
Shayan & Xu [32] investigated the use of glass waste and the effect of glass powder as a cement replacement material at 20–30% weight content and as a natural sand replacement, at 40–75% content in concretes, with a water/cement ratio of 0.49. The glass powder used had an average particle size of 10 μm. It was concluded that 30% glass powder could be incorporated as a cement or aggregate replacement in concrete without any long-term detrimental effects.
Aliabdo et al. [45] conducted a series of studies using glass powder derived from grinding glass packaging. Several types of concrete were produced using glass powder as a cement substitute or as an addition. The incorporations were conducted at weight percentages of 5, 10, 15, 20, and 25%, with two binder dosages (350 and 450 kg/m3) and water-to-binder ratios of 0.50 and 0.35, respectively. The glass powder had particles finer than 75 μm. Tests conducted at 7, 28, and 56 days demonstrated that the compressive strength increased up to a certain substitution dosage but decreased for higher substitution percentages. The use of 5.0% glass powder as a cement substitute slightly improved the compressive strength. This behavior was consistent across different test ages. Furthermore, the use of a glass powder percentage higher than 10% had a negative effect on the compressive strength of the concrete. This could be due to the lower content of Portland cement at higher substitution levels.
Du and Tan [48], using a water-to-binder ratio of 0.485, studied the effect of compressive strength on concrete made with glass powder as a cement replacement at 15%, 30%, 45%, and 60% by weight of the total cementitious materials. Both cement and glass powder showed the same median particle size of around 10 μm. The results indicate that with a longer curing age (28 and 90 days), the compressive strength continuously increases with the glass powder replacement level up to 45%, and the concrete mixture with 60% glass powder exhibits a comparable strength to the reference mixture.
Ozer Zeybek et al. [35] studied the effect of waste glass on the mechanical properties of concrete with waste glass powder, as a partial replacement for cement with 0%, 10%, 20%, 30%, 40%, and 50%. They conducted a series of compressive strength, splitting tensile strength, and flexural strength tests. At 28 days, with 0.5 w/b, WGP particle size (0.1–0.2 mm), and using a CEM I 32.5, they found reductions by 3%, 6%, 13%, 23%, and 37%, respectively. The authors observed a 38% reduction in flexural strength. In this study, among the literature presented are the works of Kalakada et al. [49], with a 65% reduction in compressive strength for concrete with 50% of WGP, and of Abdulazeez et al. [50] who showed that a 20% addition of the waste glass leads to a 36% reduction in the splitting tensile strength and with the addition of 50% glass powder.
Amin et al. [51] studied a UHPC by utilizing GW as a cement substitute with rates of 0%, 10%, 20%, 30%, 40%, and 50% and as a substitute for the fine aggregate, with substitution ratios of 0%, 50%, and 100%. The cement content varied between 500 and 1000 kg/m3. The GW particle size was under 75 μm. Using superplasticizer, fume silica, steel fiber, and a low w/b ratio, they noted that the compressive strength values increased up to a certain level, i.e., a 20% replacement ratio of PC with GP, which is thus considered the optimum ratio to achieve the best compressive strength results. After this level, it decreased. According to the authors, one of the factors that justify the results is the fineness of the glass powder, which favors pozzolanic reactions. For all investigated mixtures of UHPC, the maximum obtained values for compressive strength, splitting tensile strength, flexural strength, and modulus of elasticity at 28 days were 176.3 MPa, 18 MPa, 25.7 MPa, and 57.82 GPa, respectively, when there was 20% replacement of PC with GP.
Some authors report a reduction and others an increase in resistance [52]. However, understanding the conditions under which these results occurred is perhaps the most important part of the analysis. Furthermore, the statement that it decreases or increases cannot ignore the use for which the concrete is intended. A reduction in strength does not always mean the concrete is bad. Maybe it can limit a certain use, but it can be useful for another purpose.
Compressive strength is undoubtedly the main characteristic to be evaluated in concrete. However, considerations regarding durability have also become highly relevant in determining the quality of concrete. Therefore, it is essential to study issues related to durability as well. Thus, an overview of previous experimental studies on water absorption, capillary suction, and chloride ingress on cement-based materials incorporating glass powder as an SCM is discussed here.
Kamali et al. [53] determined the non-stationary chloride migration coefficient, obtained from the rapid migration test, for concrete with 5, 10, 15, and 20% replacement by glass powder at 28, 56, and 91 days of curing. The water/binder ratio was 0.5. The median particle size was close to 8.4 μm. The conclusion was that glass powder exhibited lower migration coefficients than the control concrete at all ages, except for the concrete with 10% glass powder at 28 days of curing, and the reduction in chloride permeability values increased with increasing replacement levels of cement with glass powders. It is believed that the increased compactness of concretes made with glass powder residue makes the mixture more resistant to chlorides due to better particle packing, and a reduction in the porosity and permeability of the concrete. Chloride permeability values are directly related to the electrical conductivity of concrete, and as such, depend on pore solution [54].
Matos et al. [55] studied crushed waste glass used in mortar as a partial weight cement replacement (0%, 10%, and 20%) material to ascertain applicability in concrete. Absorption by capillarity proved to be similar for crushed waste glass and the control mortar. This situation may be explained by the similar fineness of both crushed waste glass and cement. The CTH rapid method results show that using crushed waste glass as a partial cement replacement drastically enhances resistance to chloride penetration compared to the control mortar, especially for the 20% replacement dosage.
Previous research also indicated that capillary pores were reduced with glass powder incorporation due to the additional calcium silicate hydrate (C-S-H) gel generated, providing a denser microstructure [8].
Glass powder incorporation also showed increased chloride ion penetration resistance in concrete specimens [56,57]. A significant reduction in water absorption due to the reduced volume of voids was observed when glass powder was used as a partial cement replacement in recycled concrete aggregate [8]. Increasing the glass powder dosage as a cement replacement by up to 20% reduced the water absorption in concrete specimens [58].
There is a trend towards using glass powder in concrete mixtures in the range of 10% to 30% due to the demonstrated benefits being better within this interval. However, there is not as much available information for higher incorporation rates, especially when using water reducers in the mixture. Many studies have focused on finding the optimal dosage that maximizes the effects of glass powder incorporation. However, in 2019, 86% of the concrete produced in Europe was of class C30/C37 or lower [59]. Therefore, the concrete that achieves around 35 MPa to 40 MPa of average strength in standard cubic specimens should be viable for most usual applications.
In this sense, an experimental research campaign was carried out to produce high-performance sustainable concrete, reducing the percentage of cement in its composition without compromising its compressive strength and durability for usual applications. To reach this goal, a reference mixture was defined with the use of 300 kg/m3 of cement content as a control. A high glass powder incorporation rate was established as a replacement for cement (50%), with the aim to evaluate the reduction in cement content to 150, 200, and 250 kg. A high replacement percentage (50%) was defined to evaluate relevant reductions in cement content; in this case, the intention was to evaluate compositions for every 50 kg reduction in cement content. With this action it would be possible to study various possibilities for applying concrete, as we understand that the requirements must be compatible with the needs. In other words, the determination of the composition must meet the normative requirements; however, the efficiency and rational use of the material require that the solution is proportionate to the need. Exaggerations lead to waste, which is not sustainable. The expected result is that the introduction of glass powder will lead to a reduction in the water requirement of the mixture and an enhancement of the chemical bonds between the compounds, improving overall performance and enabling the production of high-performance concrete with low cement consumption while also improving its durability.
2. Research Significance and Limitations
The existing literature focuses on determining an ideal incorporation percentage for GP. Our focus was to advance on large incorporations, which in terms of GP, has not yet been fully studied. There are many papers with large incorporations of fly ash, but with GP, there is still a lot to be studied. Our focus was to evaluate GP as an SCM, seeking to reduce the cement content as much as possible and evaluating the extent to which the impact produced would affect its use. When studying dosages with reductions every 50 kg in cement dosage, our interest was to demonstrate the feasibility of use in various concrete applications. To avoid waste, the concrete dosage must consider regulatory requirements but must be proportional to the requirements.
It is important to clarify that, at this research stage, the focus lies on the mechanical and durability aspects of the developed material. However, evaluating the sustainability of the process through life cycle analysis and studying economic impact are aspects that should be considered in an informed decision-making process.
3. Materials
Concrete specimens were produced using fine and coarse aggregate, cement, glass powder, water, and superplasticizer. The fine aggregate, silica sand (0/4), is monogranular, with a maximum diameter of 4 mm, a fineness modulus of 2.10, and a bulk density of 2620 kg/m3. The coarse aggregate used was crushed stone (4/10) with a maximum diameter of 16 mm, a fineness modulus of 8.08, and a bulk density of 2197 kg/m3. Cement with a composition of 95% clinker (CEM I 42.5 R) was used. The choice of a non-blended cement was crucial to ensure that the results obtained were not distorted by any potential influence of added materials in its composition. The superplasticizer used was, Masters Builders Solutions, Basf’s MasterGlenium Sky 617, Madrid, Spain with a relative density of 1041 g/cm3 and a solid content of 20%. The GP was obtained from recycled glasses. They were ground until reaching a similar diameter to cement in order to avoid the alkali–silica reaction (ASR), as previous research indicates that ASR does not occur when glass powder particle size is lower than 75 µm [32,55,60]. The average diameter of the obtained glass powder was 26 µm, with a bulk density of 2604 kg/m3 and a specific surface area of 493 m2/kg.
3.1. Obtaining Glass Powder
The glass was collected in the city of Guimarães, Portugal, and subjected to a cleaning and decontamination process. Then it was ground under laboratory conditions to achieve the desired particle size distribution. A soda–lime glass of green color was adopted considering previous research [61]. Figure 1 summarizes the process to obtain the GP used.
- Cleaning and decontamination: The bottles were submerged in water for 48 h to facilitate the removal of gross dirt (caps, corks, and beverage residue), labels, and excess glue. Then, the bottles were brushed inside and outside under running water.
- Drying: The bottles were placed in a ventilated oven for one hour at a controlled temperature of 105 ± 1 °C.
- Production of glass shards: The bottles were manually broken, generating glass shards (size about 50 mm).
- Primary grinding: The shards were introduced into a jaw crusher, undergoing two passes (2 cycles), lasting about 5 min.
- The by-product (a), after the cycles in step D, was large glass shards (size about 10 mm).
- Intermediate grinding: The grains obtained in step E were inserted into a hammer mill, again undergoing two passes in the equipment, lasting about 5 min.
- The by-product (b), after the cycles in step F, was fine glass shards (size about 1 mm).
- Final grinding: To reduce the grain size, the material was introduced, in portions of 5 kg, into a metallic ball mill or “Los Angeles” mill, where it remained for 40 cycles of 15 min each, totaling 10 h of grinding (33 rpm), with an abrasive mass of 8.410 kg. The final product obtained was the GP used in concrete compositions.
- Glass powder used in concretes.
The process of transforming the waste into glass powder was carried out using the equipment and conditions existing in the laboratory. This caveat is important because in industrial conditions, it would probably be possible to optimize this process, which would significantly modify a cost and life cycle analysis, which must be evaluated locally, case by case.
3.2. Materials’ Characterization
The materials used in the campaign were characterized according to the following items.
3.2.1. Chemical Composition of the Binders
The chemical compositions of the cement and GGW, obtained through X-ray fluorescence (Hitachi—EA1000VX, Tokyo, Japan), are shown in Table 1. It is possible to observe that the soda–lime-type glass used has a predominance of silica (69.2%), sodium oxide (13.4%), and calcium oxide (11.8%).
For the standard specification for ground glass pozzolan for use in concrete, ASTM C1866 [47] specifies that the minimum SiO2 content should be above 60% and that the concentration of Na2O should be a maximum of 15% to pozzolanic materials. Therefore, it can be verified that the glass powder used meets these requirements, as it has 69.2% SiO2 and 13.4% Na2O. In the evaluation of the chemical composition, a slightly higher Fe2O3 content (1.3%) is observed compared to the limit indicated in this standard, which is 1.0%. It is believed that this is mainly due to the addition of iron oxide in the manufacturing of the bottles to achieve the green color in the glass, and this fact does not significantly influence the results.
3.2.2. Specific Surface Area/Bulk Density
Considering the importance of material fineness in determining its pozzolanic effects, the Blaine specific surface area, NP EN 196-6 [62], and bulk density, EN 1097-6 [63], of the cement and GP were determined, Table 2.
The Blaine specific surface area (Se) correlates the surface (area) of a particle with its volume (size). The Se of the glass powder is 493 m2/kg. Despite being a value lower than that of cement, 599 m2/kg, it indicates a relatively high surface area, which can contribute to its reactivity when incorporated into cementitious composites.
The bulk density (ρ) of the glass powder, 2.604 kg/m3, is lower than cement, 3.142 kg/m3. This value represents the mass of the glass powder per unit volume and provides an indication of its compactness and flowability. These measurements help to assess the physical properties of the glass powder and its suitability for use in concrete and mortar applications.
In all laboratory tests, natural siliceous sand was used (fine aggregate), with a maximum diameter of 4 mm and density of 2620 kg/m3, Figure 2, with the granulometric curve shown in item 3.2.3. The sand was supplied by the company Extractopuro Lda, originating in Santa Iria da Ribeira de Santarém, Portugal, commercial name 0/4.
As coarse aggregate (gravel), 4/10 granite crushed stone, Figure 3, was used, with a maximum diameter of 10 mm and density of 2197 kg/m3, supplied by the company Bezerras Lda, Santa Maria de Airão, Guimarães, Portugal, with the granulometric curve shown in item 3.2.3.
3.2.3. Particle Size
The occurrence of alkali–silica is one of the major concerns in the application of GP. However, the accepted conclusion is that the size of the glass particle used is decisive to avoid this harmful reaction. Particles below 75 um prevent the alkali–silica reaction from being triggered. Some authors [55,60], when studying glass as an aggregate in concrete and mortars, came to the conclusion that coarse particles would be harmful to the mixture. This is one of the reasons why we try to use GP as the SCM and with a granulometry close to cement.
The particle size distribution of cement and glass powder was determined using the laser diffraction method (Malvern Instruments, Malvern, UK, Mastersizer 3000 equipment), Figure 4b. Through this test it is possible to determine the diameters D10, D50, and D90, which are values corresponding to particle sizes below the evaluated percentages (10%, 50%, and 90%), respectively. The particle size distribution of the aggregates was determined by sieving, Figure 4a. The grinding of the glass was conducted in such a way as to produce a powder with an average particle size (D50) close to that of the cement. Table 3 shows the results of diameters D10, D50, and D90, obtained at the end of the grinding process.
3.2.4. Glass Powder Activity Index
The GP used was subjected to compression testing in mortars at the ages of 28 and 90 days, with a partial replacement of 25% of the cement by glass powder, as recommended by the EN 450-1 standard [64], to determine its pozzolanic activity index. The results obtained, 71.8% at 28 days and 85.1% at 90 days [65], met the minimum requirement of 70% at 28 days and 80% at 90 days, indicating the pozzolanic activity of the glass powder used.
3.2.5. Glass Powder Morphology
Scanning electron microscope (SEM—Hitachi SU1510, Tokyo, Japan) analysis was performed on the GP. In a second phase of this campaign, to be carried out soon, samples of G150, G200, and G250 concrete will be evaluated. SEM analysis was carried out to show the typical morphology of the surface of the GP. The particles of the GP are composed of glassy structures and irregular shapes with sharp edges, as shown in Figure 6a (×500) and Figure 6b (×1000).
Figure 7 shows the X-ray diffraction (XRD) pattern of glass powder.
4. Specimens and Test Methods
Concrete specimens, cylindrical and cubic, were produced to carry out the mechanical and durability tests. The concrete mixtures were prepared according to Table 4. The reference mix “C300” was prepared without additions, with a binder content of 300 kg/m3. It was defined with the aim of representing a common concrete, with a resistance of around 35 MPa (class C30/37). The other mixtures (G150, G200, and G250) were produced with a partial replacement of 50% of the volume of cement by glass powder. The difference between them was the binder dosage, which was 300, 400, or 500 kg/m3 respectively. These dosages were established to provide reductions of 50 kg of cement between each one. To calculate the weight of the GP, the calculation was made considering the difference in the density of the GP and the cement. Therefore, 124.26 kg of GP occupied the same volume as 150 kg of cement (G150), 165.74 kg of glass powder occupied the same volume as 200 kg of cement (G200), and 207.23 kg of glass powder occupied the same volume as 250 kg of cement (G250).
The mixing, molding, and curing procedures were strictly the same for all mixtures, as shown in Figure 8 and Figure 9. Immediately after mixing (Figure 8b—first stage, only aggregates; Figure 8c—second stage, add cement; Figure 8d—third stage, add GP), the specimens were molded using standardized metal molds, (Figure 9a) and after, they were immediately covered with plastic film, which remained in place for 24 h. The next step involved demolding, identifying the specimens, and initiating the curing process underwater, Figure 9c, at 21 °C for the specified ages (7, 14, and 28 days). After curing periods, the tests shown in Table 5 were carried out. Figure 10 presents a flowchart of the GP–concrete experimental program over time.
4.1. Mechanical Resistance
In the first stage of this study, we will focus only on mechanical resistance. If satisfactory results are obtained, other tests will be conducted in a new campaign such as: splitting tensile strength and flexural tensile strength.
Compressive Strength Test
4.2. Durability Indicator Tests
Indicators are fundamental for analyzing the behavior of a material. Initially, open porosity, capillarity, and chloride action are studied here. In a future campaign, tests such as carbonation and resistivity will be evaluated.
4.2.1. Water Absorption by Immersion (Open Porosity)
The water absorption test was performed based on the LNEC E394 standard [67]. The specimens were kept in a drying oven at 105 °C until constant mass was achieved. Then the specimens were weighed (dry weight—W1). Afterwards, specimens were immersed in water, 1/3 per hour (Figure 12). The weights were then measured at 24 h intervals until constant mass was achieved, between two measurements, determining the wet weight (W2) and hydrostatic weight (W3). Water absorption was determined by using Equation (1).
4.2.2. Capillary Absorption
The capillary absorption test was performed based on the LNEC E393 standard [68]. The specimens were kept in a drying oven at 105 °C until they reached constant mass, Figure 13. Afterwards, 25 mm from the bottom of the cube surfaces of specimens was sealed using a silicone sealant gel, to ensure a uniform water entrance by capillarity allowing only a one-dimensional flow from the bottom surface. The initial weight of the test specimen was then determined. Shortly after, the specimens were placed in a container with water until approximately 5 ± 1 mm of bottom. The specimens were weighed at 0, 10, 20, 30, and 60 min, and then at each hour up to six hours, and finally, at every 24 h up to the point they reached constant mass. Capillary absorption at time t was calculated by dividing the increase in mass by the area of the lower face of the specimen that was in contact with water, according to Equation (2).
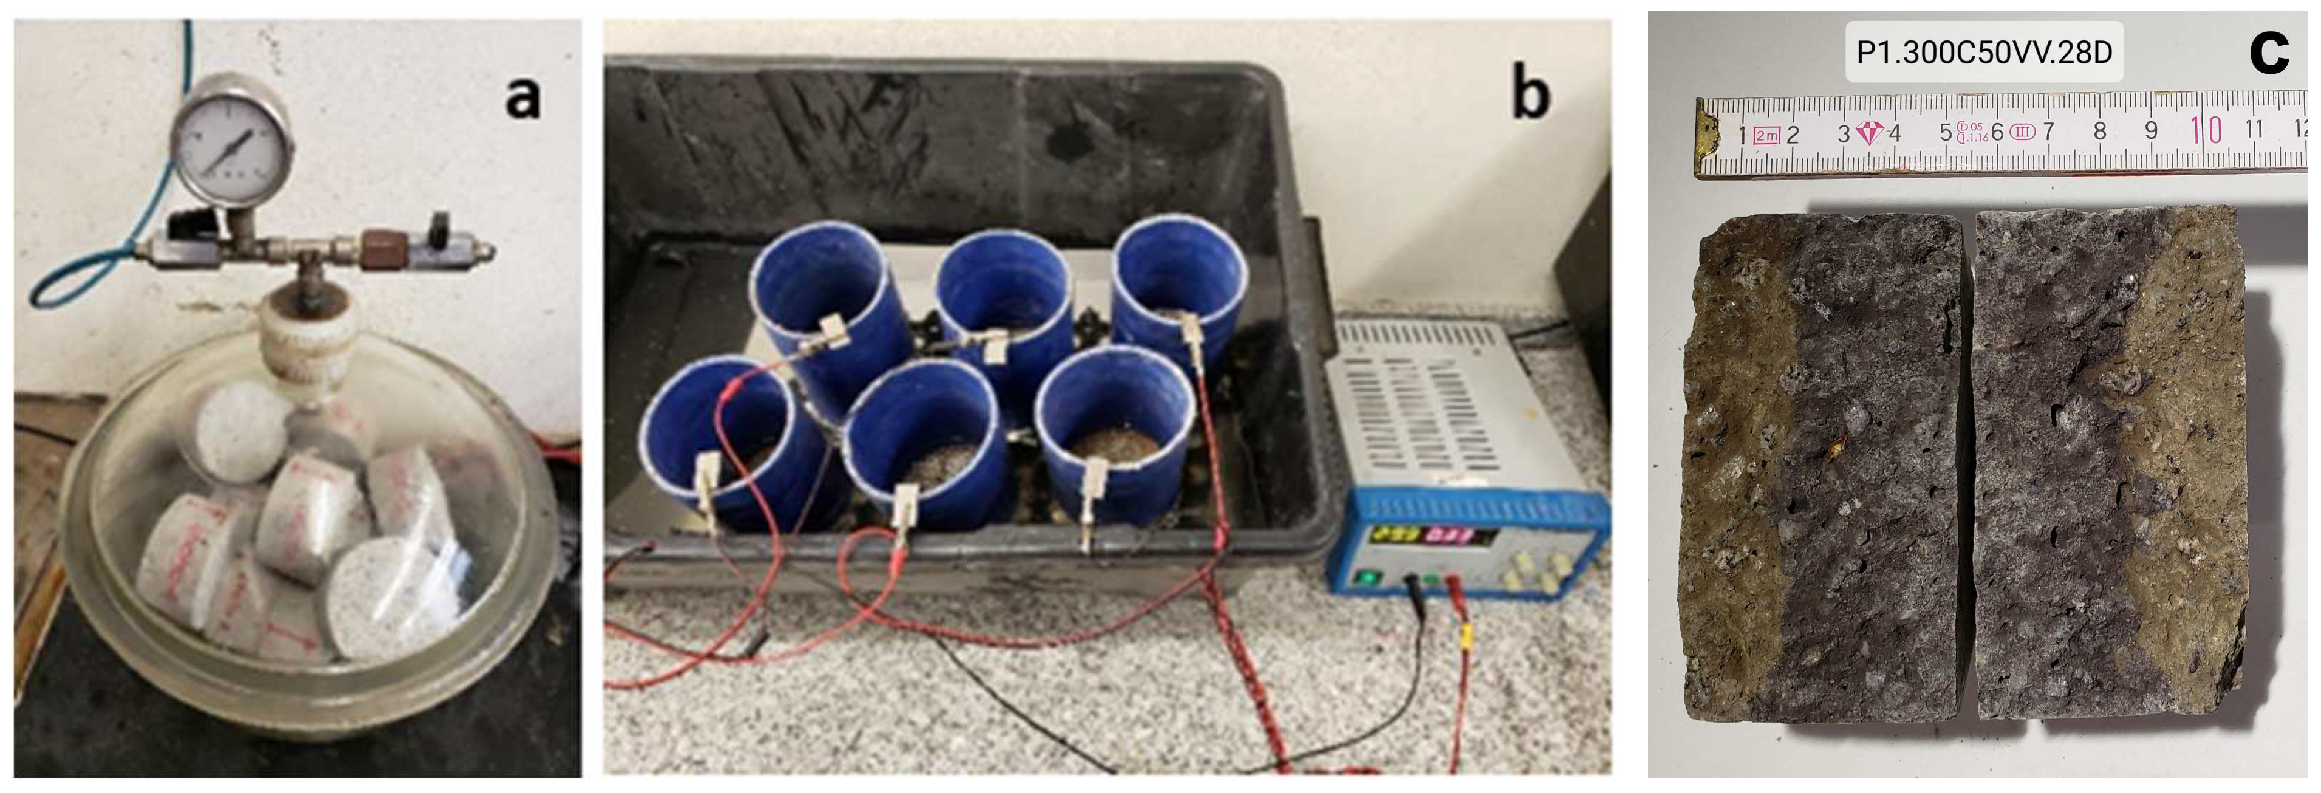
4.2.3. Diffusion Coefficient of Chlorides
The determination of chloride penetration resistance followed the LNEC E463 specification [69]. In this test, the passage of electrical current through a circular slice of concrete is measured under an electrical potential. The concrete slice, 50 mm thick, is cut from a cylinder or core, identified, and placed in the chamber for saturation under a vacuum with the saturated CH solution, Figure 14a, for the time established in the specification. It is then placed as a membrane between two liquid cells. The lateral face of the test piece is protected to allow only the lower and upper faces to be in contact with the cathodic and anodic solutions. One cell contains 0.3 M NaOH and the other 3% NaCl, Figure 14b. After completing the established time with the application of electrical potential, the specimens are divided axially and a 0.1 M solution of silver nitrate (AgNO3) is sprayed on the divided surfaces, Figure 14c. Silver nitrate reacts with chloride to form a white silver chloride precipitate (AgCl) on the surface of split samples, which can be used to evaluate the depth of chloride penetration. When the white precipitate of silver chloride became visible, the depth of penetration was measured every 10 mm, from the center to the edges, until seven measurements were obtained. The non-steady state migration coefficients were then calculated, according to Equation (3).
where:
D = the diffusion coefficient in the non-steady state, ×10−12 (m2/s).
U = the absolute value of the applied voltage (V).
T = the average value of the initial and final temperatures in the anodic solution (°C).
L = the thickness of the specimen (mm).
Xd = the average value of the depth of penetration (mm).
t = the duration of the test, in hours.
Figure 14.
Diffusion coefficient of chlorides’ setup—(a) vacuum chamber, (b) test being carried out, and (c) measurement of results.
Figure 14.
Diffusion coefficient of chlorides’ setup—(a) vacuum chamber, (b) test being carried out, and (c) measurement of results.
5. Test Results and Discussion
5.1. Mechanical Resistance
Compressive Strength
Figure 15 presents an example of the typical rupture that occurred in concrete specimens containing GP.
The development of compressive strength over time, from 7 days to 28 days, is presented in Figure 16, for all studied mixtures. The results shown correspond to the average of three samples studied and their standard deviation.
Figure 16 clearly shows an increase in compressive strength values with the progression of the curing period. This increase is more pronounced for concretes with 50% GP compared to the reference concrete during the studied period. The main cause is associated with the development of pozzolanic reactions that are characteristic of concretes containing an SCM. Between 7 and 28 days, there is an increase in compressive strength of only 5.81 MPa (19,37%) for the reference concrete without an SCM (C300), while the increase in concretes with 50% GP is 11.62 MPa (56.76%) at G150, 10.97 MPa (33.75%) at G200, and 14.23 MPa (35.16%) at G250. These differences are expected to be more pronounced at 90 days. This occurs mainly because pozzolanic reactions occur later and are more prolonged in concretes with the addition of glass powder.
Using a water-to-binder ratio of 0.485, Du et al. [48] studied the effect of compressive strength on concrete made with glass powder as a cement replacement at 15%, 30%, 45%, and 60% by weight of the total cementitious materials. The mean diameter of the glass particles was 10 μm. The binder dosages used were the same as those we used. Despite the differences in the size of the glass powder particle and the higher water-binding ratio, the results obtained by the authors show a trend similar to ours. Despite having concluded in their studies that 30% incorporation is more resistant than the reference mixture, the fact that calls our attention is that even with 60% incorporation, the results are still relevant. Even with high incorporations it is possible to obtain concrete with interesting resistance. With 60% replacement, the authors obtained concrete with almost 40 MPa after 28 days, with only 152 kg/m3 of cement.
Deep Paul et al. [70] obtained 48.15 MPa of compressive strength at 28 days, for concrete with 40% replacement, A/L = 0.40, and a dosage of 368.8 kg/m3 of binder or 221.28 kg/m3 of cement. According to the authors, these results can be attributed to the additional formation of hydrated calcium silicate (C-S-H) from the GP pozzolanic reaction. The C-S-H gel strengthens the interface in the transition zone, increasing resistance.
As previously mentioned, the intention of this study was not to determine the optimal level of glass powder incorporation but rather to demonstrate the feasibility of producing concretes with high incorporations (50%) and a significant reduction in cement consumption, resulting in concretes with an average compressive strength of around 35 MPa without compromising durability. From this perspective, the most striking result was obtained with G150. With a very low cement dosage of only 150 kg/m3, it was possible to achieve 32.09 MPa at 28 days, and this number is expected to increase significantly because when glass powder is used, pozzolanic reactions occur more slowly, suggesting that even better results will be obtained at later ages. Concretes with smaller reductions in cement consumption (G250—50 kg/m3 less and G200—100 kg/m3 less) showed encouraging results as they achieved strengths of 54.74 and 43.47 MPa, respectively, at 28 days. These strengths make these concretes suitable for use in most current construction projects.
5.2. Durability Indicator Tests
5.2.1. Absorption of Water by Immersion (Open Porosity)
Figure 17 shows the water absorption by immersion results from the concrete studied (Table 4). The results correspond to the medium values of the three specimens tested.
Observing Figure 17, concretes with 50% substitution of cement by GP show better performance in terms of water absorption by immersion compared to the reference concrete (0% GP). This statement is true regardless of the total amount of binder (cement plus GP) used in the mixture.
Comparing the reference concrete, C300, with its equivalent in terms of binder (150 kg/m3 of cement plus 150 kg/m3 of GP), G150, a reduction in water absorption of approximately 21% can be observed. Among the concretes with 50% GP, it is observed that the higher the binder content, the greater the reduction in water absorption. The results obtained are consistent with those found by Deep Paul et al. [70], in that the percentage of water absorption decreases with increased glass powder content. The percentage decrease in water absorption was 15% for concrete with glass powder incorporation of 40%. The explanation according to the authors is that the: “decrease in porosity with the increase in glass powder content is due to the dense porous microstructure of glass powder concretes provided by the glass powder pozzolanic reaction”.
Figure 17 classifies the achieved results according to the classification of the French Association of Civil Engineering [71]. According to this classification, the concrete with 0% GP (C300) falls into the “weak” category. However, the use of 50% GP (G150) raises the concrete’s category to “satisfactory”. As the binder content increases, the concrete’s category increases as well, with G200 being classified as “high” and G250 being on the borderline between “high” and “very high”.
Since the water absorption by immersion test is an indicator of the open porosity of concrete, it can be said that concretes with 50% GP, cured for 28 days, have lower porosity than reference concretes. The reduction in porosity is a trend already identified in concretes with a low percentage of GP, where this reduction seems to be more pronounced. This difference in the reduction can be related to the curing period.
Regarding the relationship between compressive strength and open porosity, for concretes with 50% glass powder, a close relationship is confirmed. Figure 18 shows a clear trend towards higher compressive strength results for less porous concretes. In the case of G200 and G250 concretes, despite a small difference in porosity values (0.42%), there is a significant difference in compressive strength values (11.27 MPa). This shows that, for the studied case, the relationship between open porosity and compressive strength is not linear. Moreover, it is evident that porosity alone is not a determining factor for achieving high strength. Relevant issues such as aggregate particle size, methods and mixing [72], and curing, among others, can exert an influence. In the case of this study, the different w/b ratios must also be considered. The results were probably influenced by this factor.
5.2.2. Absorption of Water through Capillarity
The kinetics of capillary absorption is presented through curves that indicate the variation in the amount of water absorbed per unit surface area of the specimen in contact with water, as a function of the square root of time. These curves are shown in Figure 19 and Figure 20, representing the average value of water absorption by capillarity obtained for three specimens, for 22 days or 4 h, respectively.
As expected for this type of test, the observed behavior reflects a more significant capillary absorption in the initial phase, with a steeper slope of the curve. During this phase, water penetrates through the accessible pores with larger dimensions [73].
The reference concrete (0% GP) stands out, presenting a curve with a significantly higher slope compared to the curves related to concretes with 50% GP. This fact may be related to the existence of a larger quantity of larger-sized capillary pores in the reference concretes.
The capillary absorption coefficients shown in Figure 20 (calculated for the first 4 h of testing, Coutinho [73]) support this statement. The water absorption rate of concretes with 50% GP is significantly lower than the rate of the reference concrete. This reduction varies between 47% for G150 and 67% for G250.
After the initial phase, Figure 20, the curve presented in Figure 19 acquires a slower pace, eventually reaching a stabilization plateau that represents the filling of the capillary network. During this phase, the finer capillary pores are filled (where absorption is slower), as well as the pores that depend on these smaller pores for access [73]. Once again, the reference concrete stands out, achieving the filling of the capillary network at levels close to 16 mg/mm2. In contrast, only 6.65 mg/mm2 of water is needed to fill the capillary network in concretes with 50% GP (considering the worst-case scenario, G150). This behavior may indicate the existence of a less interconnected and/or smaller-sized porous network in the concretes with 50% GP compared to the reference concrete.
By measuring the capillary absorption coefficient using the time intervals proposed by Browne [74], it is possible to qualitatively classify the concrete, as presented in Figure 21. The results obtained demonstrate that “S” (capillary absorption coefficients) for all mixtures containing glass powder is within the range relative to low absorption (under 0.1 mg/mm2 × min0.5), better than the reference concrete, which falls within the medium class of absorption.
The combined analysis of the results obtained from the water absorption by immersion (Figure 17) and capillary water absorption tests (Figure 19 and Figure 20) allows us to outline a macrostructural profile of the porous network behavior in the studied concretes. In general, the reference concrete exhibits higher open porosity (interconnected pores) compared to the concretes with 50% GP. However, the most significant difference seems to lie in the pore distribution. By observing the absorption profiles in Figure 19, a distinct behavior can be noticed between the reference concrete and the concretes with 50% GP. The quantity of accessible larger-sized pores is significantly higher in the reference concrete compared to the concretes with 50% GP. This results in a notable difference in the capillary absorption rate (Figure 21). Considering the slow pozzolanic reaction provided by an SCM, it is probable that this difference increases at 90 days.
5.2.3. Diffusion Coefficient of Chlorides
Figure 22 shows the diffusion coefficient of chlorides results from the concrete studied (0% and 50% GP). The results correspond to the medium value of the three specimens tested.
According to Figure 22, the influence of using GP on the chloride diffusion coefficient is evident. There is a clear trend towards a reduction in the chloride diffusion coefficient for concretes with 50% GP. This reduction is greater with a higher amount of binder used. The G250 concrete shows a reduction of 58% compared to the reference concrete. It is important to note that this concrete has only 250 kg/m3 of cement (50 kg/m3 less than the reference concrete). Comparing concretes with the same total amount of binder (cement plus GP), C300 and G150, the reduction in the diffusion coefficient is slight at 12%.
Those results corroborate with the results of the previous research [15,34,70]. For a cement replacement ratio of 40% glass-powder-modified concrete, Deep Paul et al. [70] obtained a 37.5% reduction in chloride permeability at 28 days. Du et al. [34] achieved a reduction of 90% for chloride ion migration that occurred for concrete with 60% glass powder as a cement replacement compared to reference specimens without glass powder.
Although, in general, the coefficient values appear high, there is a tendency for an increase in resistance to chloride penetration with the use of GP as a partial replacement for cement. It is expected that the values of the chloride diffusion coefficient will be significantly lower at 90 days for concretes with 50% GP.
The resistance to chloride ion penetration for glass powder concrete was provided by the filling effect due to micron-sized GPs with a different PSD and thus granular packing optimization, and pozzolanic activity, which provides extra C-S-H and further decreases the size and connectivity of the pores.
In an attempt to relate the resistance to chloride penetration with the characteristics of concrete, Figure 23 presents the diffusion coefficient of concretes with 50% GP as a function of their compressive strength and open porosity.
Figure 23 shows that the concretes with higher chloride diffusion coefficients (lower resistance to chloride penetration) are those with high porosity and low compressive strength. Comparing the diffusion coefficient of the reference concrete, C300, with the worst result for concretes with 50% GP, G150, it is observed that porosity has a greater influence. In this aspect, the incorporation of GP is advantageous because the filler effect provided by its use reduces porosity, regardless of the activity index.
When comparing only the data of concretes with 50% GP incorporation, the following relationship is observed: a high binder content (cement plus GP), high compressive strength, low porosity, and low chloride diffusion coefficient. As the binder content is reduced, the opposite relationship is observed: a low binder content, low compressive strength, high porosity, and high chloride diffusion coefficient.
6. Conclusions
The utilization of ground glass waste (GP) to produce high-performance sustainable concrete was experimentally studied, considering a high incorporation of GP. Concrete was produced by replacing 50% of cement with GP with the aim of reaching a compressive strength of about 35 MPa (viable for most usual applications) with a satisfactory durability performance.
Considering the GP with a D50 equal to 26 μm, the results show satisfactory results concerning compressive strength and durability indicators (porosity and chloride diffusion coefficient). In addition to the granulometry of the GP, other factors are fundamental and must be considered: the reduction in the w/b ratio, the perfect curing of the specimens, and the mixing methods. Pozzolanic reactions combined with low porosity allow acceptable results to be obtained, even with significant reductions in cement content.
Although in this study it is clear that compositions with higher dosages of binder have better results, this does not always imply that weaker dosages are useless or even bad. To avoid waste, determining the dosage must take into account the needs or the requirements of the concrete application. This study sought to demonstrate that even at the (supposedly) weakest dosage, it is possible to obtain quality concrete that can be useful for a multitude of demands.
The lowest cement content studied, 150 kg/m3 cement plus 124.26 kg/m3 GP (G150), reached 32.09 MPa at 28 days. Concretes with smaller reductions in cement consumption, G250 and G200, showed encouraging results as they allowed strengths of 54.74 and 43.47 MPa, respectively, to be obtained. These strengths make these concretes suitable for use in most current construction projects. It is important to note that compressive strength is expected to increase at 90 days because when glass powder is used, pozzolanic reactions occur more slowly, suggesting that even better results will be obtained at later ages.
The porosity results indicate a decrease in porosity for concretes containing 50% of GP in comparison with the reference concrete (C300, with 0% GP). Concretes with GP obtained reductions of 21% (G150), 39% (G200), and 42% (G250). The introduction of glass particles allows for better packing in the mixture, reducing void content. In addition to the pozzolanic activity verified for the GP studied, the porosity results can help to explain the very good results obtained in the compressive strength tests.
The capillary water absorption rate of concrete with 50% GP is significantly lower than the rate of the reference concrete. The values obtained were 0.149 (C300), 0.082 (G150), 0.059 (G200), and 0.05 (G250). That is, reductions between 45% and 66%.
Furthermore, there is a clear trend towards a reduction in the chloride diffusion coefficient for concretes with 50% GP. This reduction is greater with a greater quantity of binder used. At 28 days, the mixture with the smallest difference to the reference concrete was G150, which still allowed a reduction of 13.9% (26.08 to 22.90).
The results indicate that the high replacement of cementum by GP can be a viable alternative. However, it is vital to expand this study for advanced ages (90, 180, and 365 days). In addition to the advantages at a technical level, the use of concrete with a low cement content promotes the reduction in CO2 emissions and energy consumption related to the production of cement and helps to minimize the impact of depositing glass in landfills.
Author Contributions
Conceptualisation, O.M., A.C. and R.M.; data curation, O.M., A.C. and R.M.; methodology, O.M., A.C., C.J. and R.M.; validation, R.M.; formal analysis, A.C.; investigation, O.M. and C.J.; writing—original draft preparation, O.M. and R.M.; writing—review and editing, O.M., A.C. and R.M.; visualisation, O.M., A.C., C.J. and R.M.; supervision, A.C.; project administration, R.M.; resources, O.M.; funding acquisition, R.M.. All authors have read and agreed to the published version of the manuscript.
Funding
The authors would like to acknowledge the support by national funds through FCT (the Foundation for Science and Technology) within the project scope with the reference 2022.03197.PTDC (https://doi.org/10.54499/2022.03197.PTDC, accessed 16 October 2023), GlassCON.
Institutional Review Board Statement
Not applicable.
Informed Consent Statement
Not applicable.
Data Availability Statement
The data are contained within this article.
Conflicts of Interest
The authors declare no conflict of interest.
References
- Global Cement and Concrete Association (GCCA). 2022. Available online: http://gccassociation.org (accessed on 15 August 2022).
- IEA—International Energy Agency. Cement Roadmaps 2009. Available online: www.iea.org/roadmaps (accessed on 15 August 2022).
- Jiang, X.; Xiao, R.; Bai, Y.; Huang, B.; Ma, Y. Influence of waste glass powder as a supplementary cementitious material (SCM) on physical and mechanical properties of cement paste under high temperatures. J. Clean. Prod. 2022, 340, 130778. [Google Scholar] [CrossRef]
- Rodier, L.; Savastano, H. Use of glass powder residue for the elaboration of eco-efficient cementitious materials. J. Clean. Prod. 2018, 184, 333–341. [Google Scholar] [CrossRef]
- Esmaeili, J.; Al-Mwanes, A.O. A review: Properties of eco-friendly ultra-high-performance concrete incorporated with waste glass as a partial replacement for cement. Mater. Today Proc. 2021, 42, 1958–1965. [Google Scholar] [CrossRef]
- Patel, D.; Tiwari, R.P.; Shrivastava, R.; Yadav, R.K. Effective utilization of waste glass powder as the substitution of cement in making paste and mortar. Constr. Build. Mater. 2019, 199, 406–415. [Google Scholar] [CrossRef]
- Tamanna, N.; Tuladhar, R. Sustainable Use of Recycled Glass Powder as Cement Replacement in Concrete. Open Waste Manag. J. 2020, 13, 1–13. [Google Scholar] [CrossRef]
- He, Z.-H.; Zhan, P.-M.; Du, S.-G.; Liu, B.-J.; Yuan, W.-B. Creep behavior of concrete containing glass powder. Compos. Part B Eng. 2018, 166, 13–20. [Google Scholar] [CrossRef]
- Qaidi, S.; Najm, H.M.; Abed, S.M.; Özkılıç, Y.O.; Al Dughaishi, H.; Alosta, M.; Sabri, M.M.S.; Alkhatib, F.; Milad, A. Concrete Containing Waste Glass as an Environmentally Friendly Aggregate: A Review on Fresh and Mechanical Characteristics. Materials 2022, 15, 6222. [Google Scholar] [CrossRef]
- Çelik, A.I.; Özkılıç, Y.O.; Zeybek, Ö.; Karalar, M.; Qaidi, S.; Ahmad, J.; Burduhos-Nergis, D.D.; Bejinariu, C. Mechanical Behavior of Crushed Waste Glass as Replacement of Aggregates. Materials 2022, 15, 8093. [Google Scholar] [CrossRef] [PubMed]
- Al Saffar, D.M.A.R. Experimental investigation of using ultra-fine glass powder in concrete. Int. J. Eng. Res. Appl. 2017, 7, 33–39. [Google Scholar]
- Hooton, R.; Thomas, M.; Shehata, M.; Shashiprakash, S. The Use of Fly Ash in Concrete: Classification by Composition. Cem. Concr. Aggregates 1999, 21, 105. [Google Scholar] [CrossRef]
- Çelik, A.I.; Tunç, U.; Bahrami, A.; Karalar, M.; Mydin, A.O.; Alomayri, T.; Özkılıç, Y.O. Use of waste glass powder toward more sustainable geopolymer concrete. J. Mater. Res. Technol. 2023, 24, 8533–8546. [Google Scholar] [CrossRef]
- Özkılıç, Y.O.; Çelik, A.I.; Tunç, U.; Karalar, M.; Deifalla, A.; Alomayri, T.; Althoey, F. The use of crushed recycled glass for alkali activated fly ash based geopolymer concrete and prediction of its capacity. J. Mater. Res. Technol. 2023, 24, 8267–8281. [Google Scholar] [CrossRef]
- Sujjavanich, S.; Sida, V.; Suwanvitaya, P. Chloride permeability and corrosion risk of high-volume fly ash concrete with mid-range water reducer. ACI Mater. J. 2005, 102, 177. [Google Scholar]
- Reis, R.J.A.d.C. Influência da Adição de Cal Hidratada na Carbonatação de Betões de Elevado Volume de Cinzas Volantes. Ph.D. Thesis, Universidade do Minho, Braga, Portugal, 2022. Available online: https://hdl.handle.net/1822/81153 (accessed on 10 June 2023).
- Herath, C.; Gunasekara, C.; Law, D.W.; Setunge, S. Performance of high volume fly ash concrete incorporating additives: A systematic literature review. Constr. Build. Mater. 2020, 258, 120606. [Google Scholar] [CrossRef]
- Soliman, N.; Tagnit-Hamou, A. Development of ultra-high-performance concrete using glass powder—Towards ecofriendly concrete. Constr. Build. Mater. 2016, 125, 600–612. [Google Scholar] [CrossRef]
- Saraya, M.E.-S.I. Study physico-chemical properties of blended cements containing fixed amount of silica fume, blast furnace slag, basalt and limestone, a comparative study. Constr. Build. Mater. 2014, 72, 104–112. [Google Scholar] [CrossRef]
- Rêgo, J.H.S. As Cinzas de Casca de Arroz (CCAs) Amorfa e Cristalina como Adição Mineral ao Cimento—Aspectos de Microestrutura das Pastas. Ph.D. Thesis, UNB, Brasília, Brazil, 2004. Available online: https://repositorio.unb.br/handle/10482/42047 (accessed on 10 September 2022).
- Moreira, O.; Malheiro, R.; Jesus, C.; Camões, A.; Ribeiro, M.J. Incorporation of sludge from the cutting of ornamental rocks in cementitious materials. In Proceedings of the Construction Congress, Portugal, 5–7 December 2022; Universidade do Minho: Braga, Portugal. [Google Scholar]
- Karalar, M.; Özkılıç, Y.O.; Aksoylu, C.; Sabri, M.M.S.; Beskopylny, A.N.; Stel’makh, S.A.; Shcherban’, E.M. Flexural behavior of reinforced concrete beams using waste marble powder towards application of sustainable concrete. Front. Mater. 2022, 9, 1068791. [Google Scholar] [CrossRef]
- Başaran, B.; Aksoylu, C.; Özkılıç, Y.O.; Karalar, M.; Hakamy, A. Shear behaviour of reinforced concrete beams utilizing waste marble powder. Structures 2023, 54, 1090–1100. [Google Scholar] [CrossRef]
- Karalar, M.; Bilir, T.; Çavuşlu, M.; Özkiliç, Y.O.; Sabri, M.M.S. Use of recycled coal bottom ash in reinforced concrete beams as replacement for aggregate. Front. Mater. 2022, 9, 1064604. [Google Scholar] [CrossRef]
- Chang, Q.; Liu, L.; Farooqi, M.U.; Thomas, B.; Özkılıç, Y.O. Data-driven based estimation of waste-derived ceramic concrete from experimental results with its environmental assessment. J. Mater. Res. Technol. 2023, 24, 6348–6368. [Google Scholar] [CrossRef]
- Manoel, J.A.H.M.C. Análise de Processos Fabris na BA Vidro. Master’s Thesis, Faculdade de Engenharia da Universidade do Porto, Porto, Portugal, 2010. Available online: http://hdl.handle.net/10216/59746 (accessed on 10 September 2022).
- FEVE—European Glass Container Glass Federation. Available online: www.feve.org (accessed on 10 September 2022).
- The Eurostat Data Set: Recycling Rates of Packaging Waste for Monitoring Compliance with Policy Targets, by Type of Packaging. Online data code: ENV_WASPACR, 2021. Available online: https://ec.europa.eu/eurostat (accessed on 20 November 2022).
- Shao, Y.; Lefort, T.; Moras, S.; Rodriguez, D. Studies on concrete containing ground waste glass. Cem. Concr. Res. 2000, 30, 91–100. [Google Scholar] [CrossRef]
- Tagnit-Hamou, A.; Zidol, A.; Deschamps, N.S.J.; Omran, A. Ground Glass Pozzolan in Conventional, High, and Ultra-High-Performance Concrete. MATEC Web Conf. 2018, 149, 01005. [Google Scholar] [CrossRef]
- Islam, G.M.S.; Rahman, M.; Kazi, N. Waste glass powder as partial replacement of cement for sustainable concrete practice. Int. J. Sustain. Built Environ. 2017, 6, 37–44. [Google Scholar] [CrossRef]
- Shayan, A.; Xu, A. Performance of glass powder as a pozzolanic material in concrete: A field trial on concrete slabs. Cem. Concr. Res. 2006, 36, 457–468. [Google Scholar] [CrossRef]
- Du, H.; Tan, K.H. Waste Glass Powder as Cement Replacement in Concrete. J. Adv. Concr. Technol. 2014, 12, 468–477. [Google Scholar] [CrossRef]
- Du, H.; Tan, K.H. Transport Properties of Concrete with Glass Powder as Supplementary Cementitious Material. ACI Mater. J. 2015, 112, 429–438. [Google Scholar] [CrossRef]
- Zeybek, Ö.; Özkılıç, Y.O.; Karalar, M.; Çelik, A.I.; Qaidi, S.; Ahmad, J.; Burduhos-Nergis, D.D.; Burduhos-Nergis, D.P. Influence of Replacing Cement with Waste Glass on Mechanical Properties of Concrete. Materials 2022, 15, 7513. [Google Scholar] [CrossRef]
- Patil, D.M.; Sangle, K.K. Experimental investigation of waste glass powder as partial replacement of cement in concrete. Int. J. Adv. Technol. Civ. Eng. 2013, 2, 2231–5721. [Google Scholar] [CrossRef]
- Rahman, S.; Uddin, M. Experimental Investigation of Concrete with Glass Powder as Partial Replacement of Cement. Civ. Eng. Arch. 2018, 6, 149–154. [Google Scholar] [CrossRef]
- Najad, A.A.A.-J.; Kareem, J.H.; Azline, N.; Ostovar, N. Waste glass as partial replacement in cement—A review. IOP Conf. Ser. Earth Environ. Sci. 2019, 357, 012023. [Google Scholar] [CrossRef]
- Zhang, Y.; Xiao, R.; Jiang, X.; Li, W.; Zhu, X.; Huang, B. Effect of particle size and curing temperature on mechanical and microstructural properties of waste glass-slag-based and waste glass-fly ash-based geopolymers. J. Clean. Prod. 2020, 273, 122970. [Google Scholar] [CrossRef]
- Malheiro, R.; Moreira, B.; Pontes, K.; Jesus, C.; Camões, A. Utilização do pó de Vidro como Substituto Parcial do Cimento: Uma Abordagem Experimental Acerca da Resistência Mecânica; CLBMCS: Salvador, Brazil, 2022; Available online: https://hdl.handle.net/1822/81939 (accessed on 10 June 2023).
- Matos, A.M. Estudo de Argamassas com Substituição Parcial de Cimento por Resíduos de Vidro Moídos. Master’s Thesis, FEUP, Porto, Portugal, 2010. Available online: http://hdl.handle.net/10216/59733 (accessed on 15 August 2022).
- Zheng, K. Pozzolanic reaction of glass powder and its role in controlling alkali–silica reaction. Cem. Concr. Compos. 2016, 67, 30–38. [Google Scholar] [CrossRef]
- Jiang, Y.; Ling, T.-C.; Mo, K.H.; Shi, C. A critical review of waste glass powder—Multiple roles of utilization in cement-based materials and construction products. J. Environ. Manag. 2019, 242, 440–449. [Google Scholar] [CrossRef] [PubMed]
- Liu, S.; Xie, G.; Wang, S. Effect of glass powder on microstructure of cement pastes. Adv. Cem. Res. 2015, 27, 259–267. [Google Scholar] [CrossRef]
- Aliabdo, A.A.; Abd Elmoaty, A.E.M.; Aboshama, A.Y. Utilization of waste glass powder in the production of cement and concrete. Constr. Build. Mater. 2016, 124, 866–877. [Google Scholar] [CrossRef]
- Lu, J.X.; Shen, P.; Zhang, Y.; Zheng, H.; Sun, Y.; Poon, C.S. Early-age and microstructural properties of glass powder blended cement paste: Improvement by seawater. Cem. Concr. Compos. 2021, 122, 104165. [Google Scholar] [CrossRef]
- ASTM C1866; Standard Specification for Ground-Glass Pozzolan for Use in Concrete. ASTM International: West Conshohocken, PA, USA, 2020.
- Du, H.; Tan, K.H. Properties of high volume glass powder concrete. Cem. Concr. Compos. 2017, 75, 22–29. [Google Scholar] [CrossRef]
- Kalakada, Z.; Doh, J.-H.; Chowdhury, S. Glass powder as replacement of cement for concrete—An investigative study. Eur. J. Environ. Civ. Eng. 2019, 26, 1046–1063. [Google Scholar] [CrossRef]
- Abdulazeez, A.S.; Idi, M.A.; Kolawole, M.A.; Hamza, B. Effect of Waste Glass Powder as A Pozzolanic Material in Concrete Production. Int. J. Eng. Res. 2020, 9, 589–594. [Google Scholar] [CrossRef]
- Amin, M.; Agwa, I.S.; Mashaan, N.; Mahmood, S.; Abd-Elrahman, M.H. Investigation of the Physical Mechanical Properties and Durability of Sustainable Ultra-High Performance Concrete with Recycled Waste Glass. Sustainability 2023, 15, 3085. [Google Scholar] [CrossRef]
- Guo, P.; Meng, W.; Nassif, H.; Gou, H.; Bao, Y. New perspectives on recycling waste glass in manufacturing concrete for sustainable civil infrastructure. Constr. Build. Mater. 2020, 257, 119579. [Google Scholar] [CrossRef]
- Kamali, M.; Ghahremaninezhad, A. Effect of glass powders on the mechanical and durability properties of cementitious materials. Constr. Build. Mater. 2015, 98, 407–416. [Google Scholar] [CrossRef]
- Neithalath, N.; Weiss, J.; Olek, J. Characterizing Enhanced Porosity Concrete using electrical impedance to predict acoustic and hydraulic performance. Cem. Concr. Res. 2006, 36, 2074–2085. [Google Scholar] [CrossRef]
- Matos, A.M.; Sousa-Coutinho, J. Durability of mortar using waste glass powder as cement replacement. Constr. Build. Mater. 2012, 36, 205–215. [Google Scholar] [CrossRef]
- Nassar, R.-U.; Soroushian, P. Strength and durability of recycled aggregate concrete containing milled glass as partial replacement for cement. Constr. Build. Mater. 2012, 29, 368–377. [Google Scholar] [CrossRef]
- Omran, A.; Tagnit-Hamou, A. Performance of glass-powder concrete in field applications. Constr. Build. Mater. 2016, 109, 84–95. [Google Scholar] [CrossRef]
- Ramakrishnan, K.; Pugazhmani, G.; Sripragadeesh, R.; Muthu, D.; Venkatasubramanian, C. Experimental study on the mechanical and durability properties of concrete with waste glass powder and ground granulated blast furnace slag as supplementary cementitious materials. Constr. Build. Mater. 2017, 156, 739–749. [Google Scholar] [CrossRef]
- ERCMO—European Ready Mixed Concrete Organization. Ready Mixed Industry Statistics 2019. Available online: https://ermco.eu/statistics-previous-years/ (accessed on 15 August 2022).
- Taha, B.; Nounu, G. Utilizing Waste Recycled Glass as Sand/Cement Replacement in Concrete. J. Mater. Civ. Eng. 2009, 21, 709–721. [Google Scholar] [CrossRef]
- Pontes, K. Incorporação de resíduos de vidro moído em betões: Uma alternativa às cinzas volantes? Mestrado em Construção e Reabilitação Sustentáveis. Master’s Thesis, Universidade do Minho, Braga, Portugal, 2023. Available online: https://hdl.handle.net/1822/85024 (accessed on 10 October 2023).
- NP EN 196-6; Métodos de Ensaio de Cimentos—Parte 6: Determinação da Finura. Instituto Português da Qualidade: Lisboa, Portugal, 2019.
- NP EN 1097-6; Ensaios das Propriedades Mecânicas e Físicas dos Agregados—Parte 6: Determinação da Massa Volúmica e da Absorção de Água. Instituto Português da Qualidade: Lisboa, Portugal, 2004.
- NP EN 450-1; Cinzas Volantes para Betão; Parte 1: Definição, Especificações e Critérios de Conformidade. IPQ: Lisbon, Portugal, 2012; p. 35.
- Moreira, B.A.d.S. Incorporação de Resíduo de Vidro Moído em Argamassas como Substituto Parcial do Cimento. Master’s Thesis, Universidade do Minho, Braga, Portugal, 2022. Available online: https://hdl.handle.net/1822/85022 (accessed on 10 July 2023).
- EN 12390-3; Testing Hardened Concrete—Part 3 Compressive Strength of Test Specimens. iTEH Standards: Etobicoke, ON, Canada, 2009.
- LNEC E394; Determinação da Absorção de Água por Imersão. LNEC: Lisbon, Portugal, 1993.
- LNEC E393; Determinação da Absorção de Água por Capilaridade. LNEC: Lisbon, Portugal, 1993.
- LNEC E463; Determinação do Coeficiente de Difusão de Cloretos por Ensaio de Migração em Regime Não Estacionário. LNEC: Lisbon, Portugal, 2004.
- Paul, D.; Bindhu, K.; Matos, A.M.; Delgado, J. Eco-friendly concrete with waste glass powder: A sustainable and circular solution. Constr. Build. Mater. 2022, 355, 129217. [Google Scholar] [CrossRef]
- French Association of Civil Engineering. Conception des Bétons pour Une Durée de Vie Donnée des Ouvrages—Indicateurs de Durabilité; French Association of Civil Engineering: Paris, France, 2004; p. 90. [Google Scholar]
- Elaqra, H.A.; Haloub, M.A.A.; Rustom, R.N. Effect of new mixing method of glass powder as cement replacement on mechanical behavior of concrete. Constr. Build. Mater. 2019, 203, 75–82. [Google Scholar] [CrossRef]
- Coutinho, M.J.A.R.S. Melhoria da Durabilidade dos Betões por Tratamento da Cofragem. Ph.D. Thesis, Faculdade de Engenharia da Universidade do Porto, Porto, Portugal, 1998. Available online: http://hdl.handle.net/10216/11906 (accessed on 20 June 2022).
- Browne, R.D. Field Investigations: Site & Laboratory Tests: Maintenance Repair and Rehabilitation of Concrete Structures; CEEC: Lisbon, Portugal, 1998. [Google Scholar]
Figure 1.
Process of obtaining glass powder.
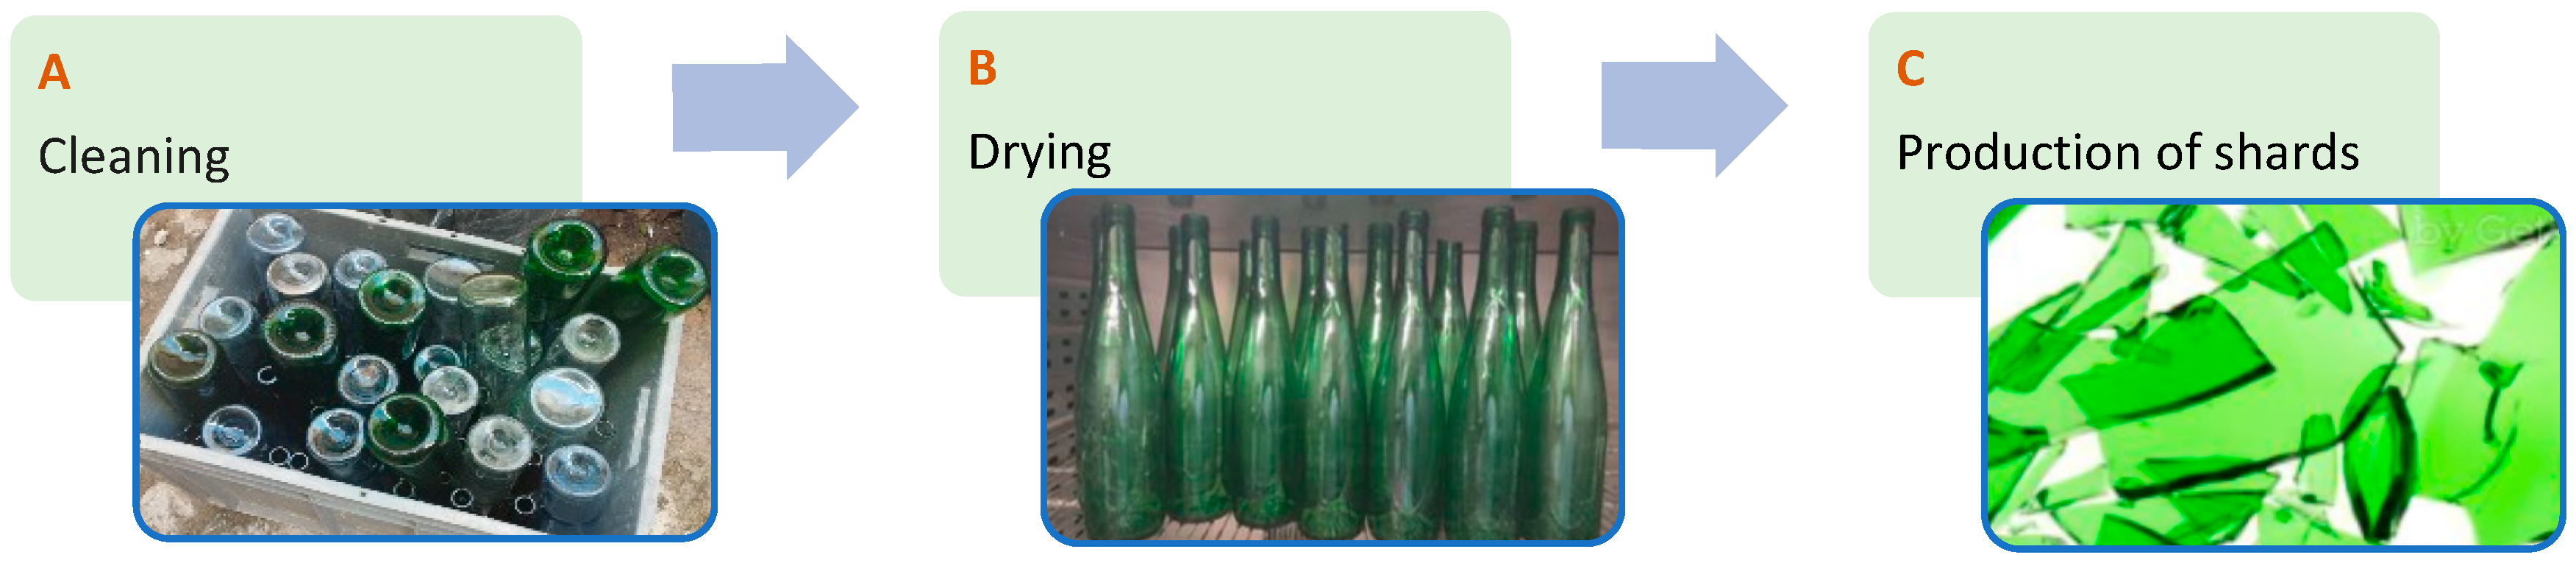
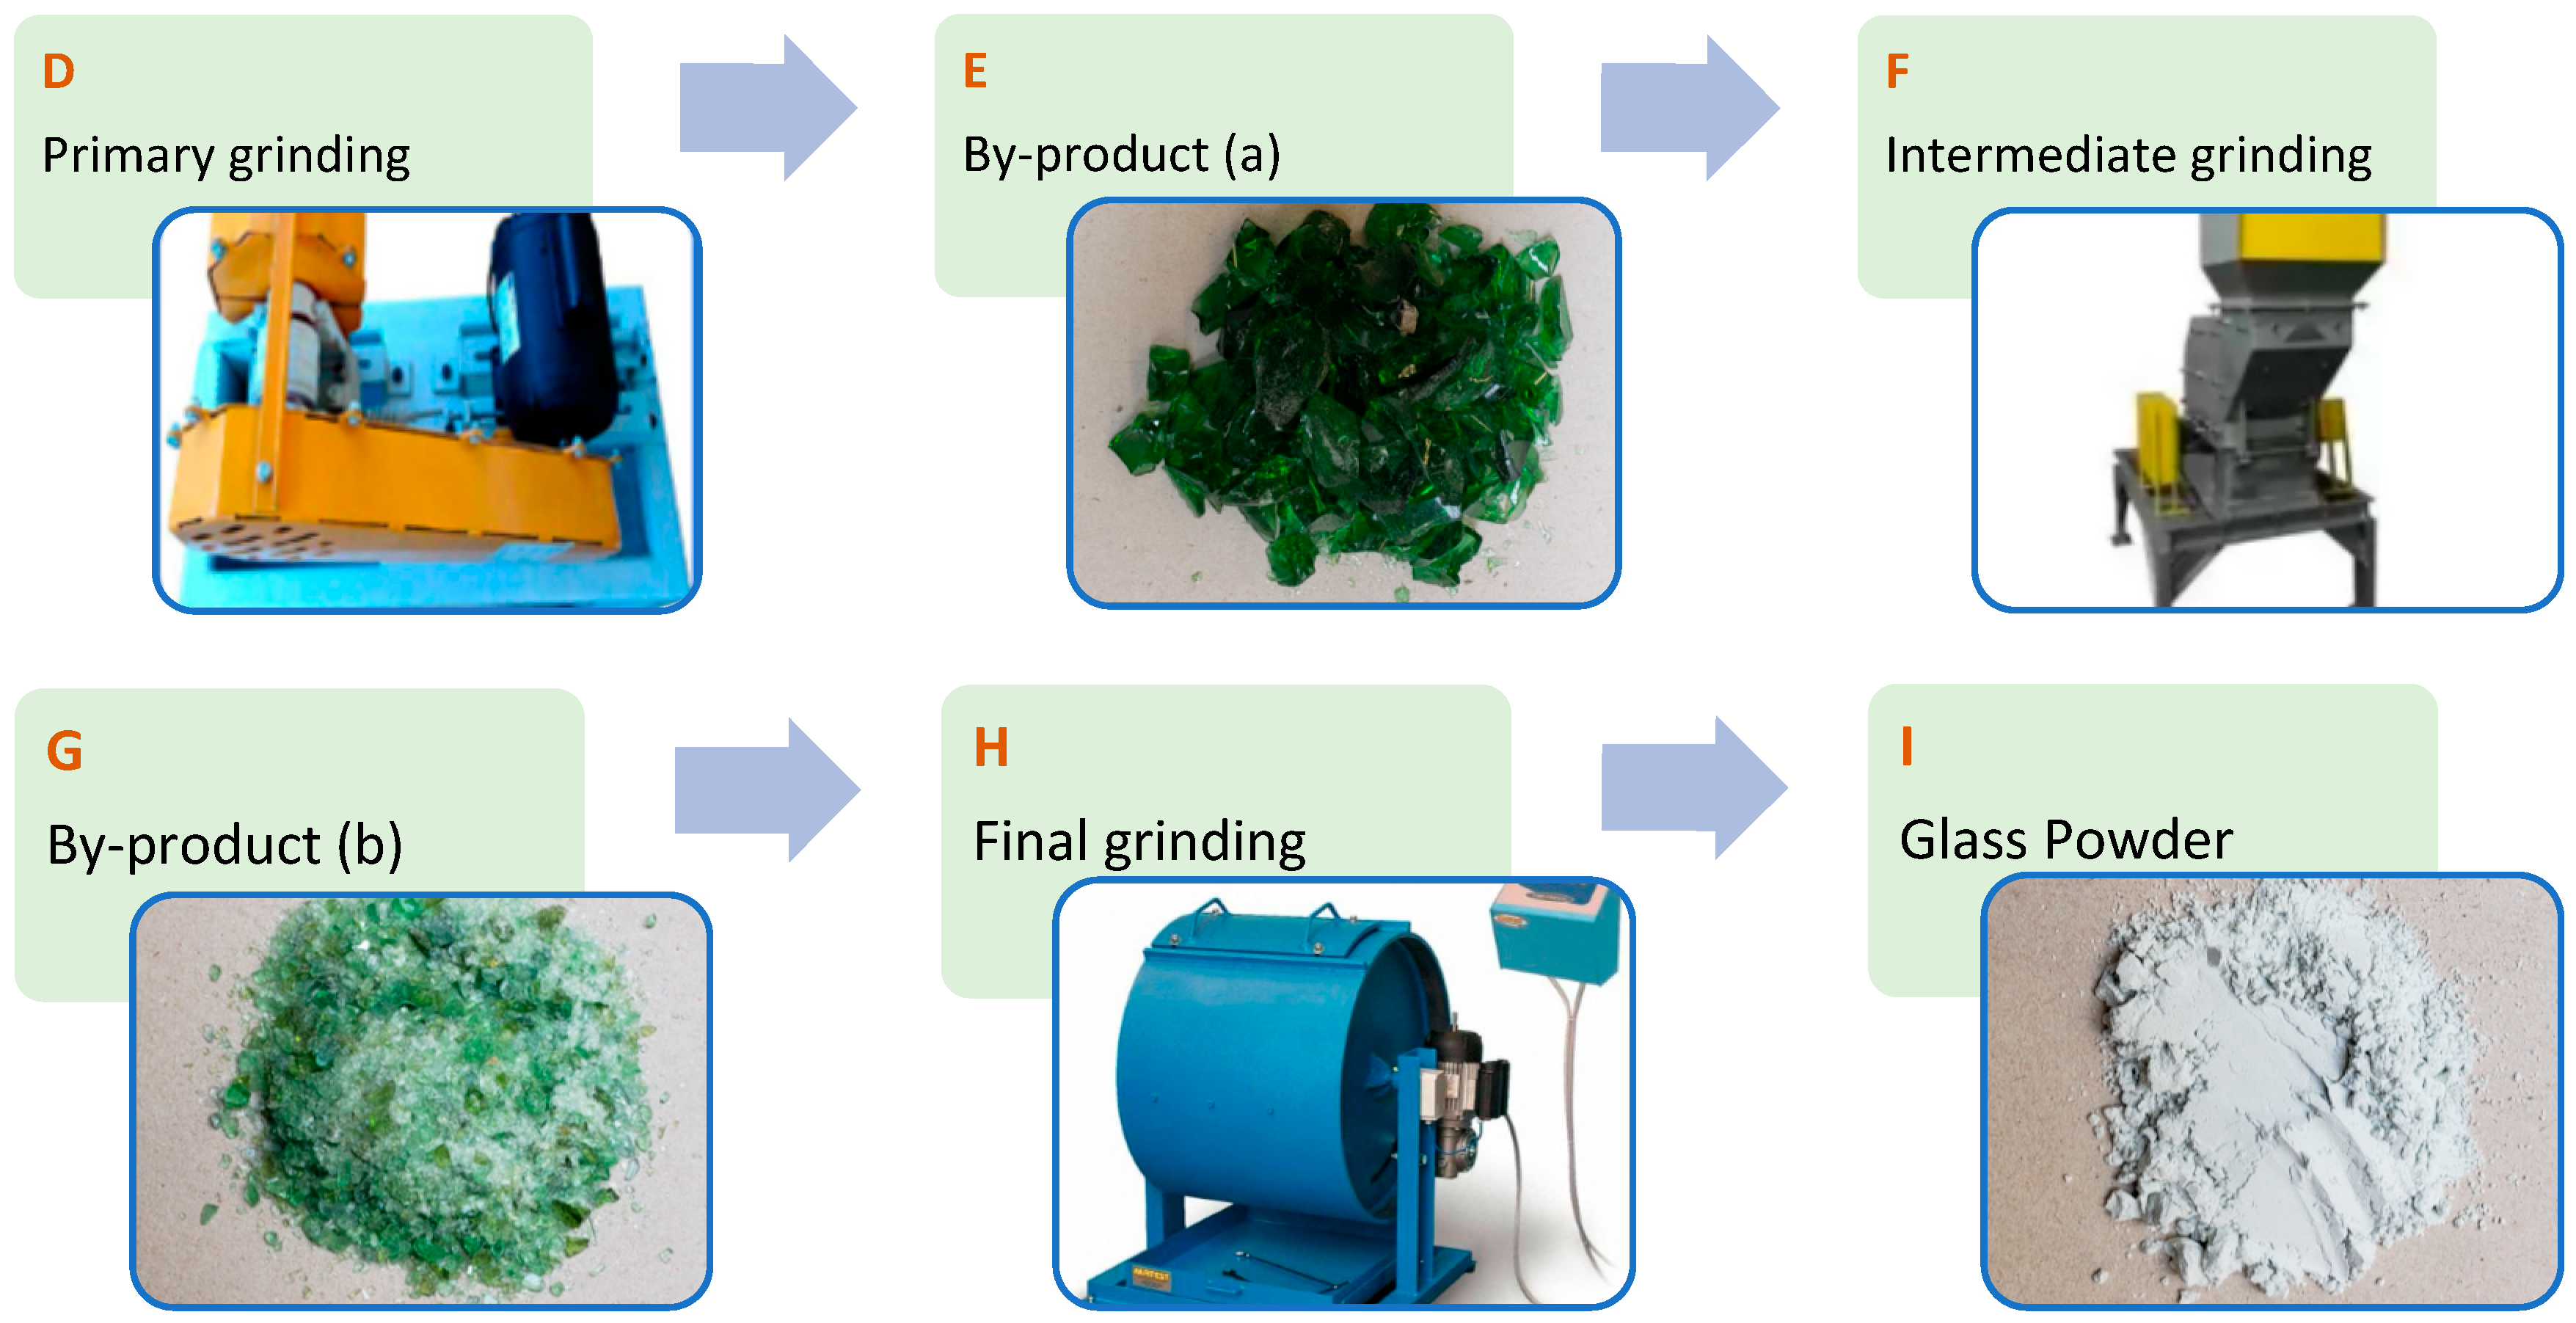
Figure 2.
Fine aggregate used (natural sand).

Figure 3.
Coarse aggregate used (crushed stone—gravel).

Figure 4.
Sieve set (a) and laser equipment (b)—granulometry setup.
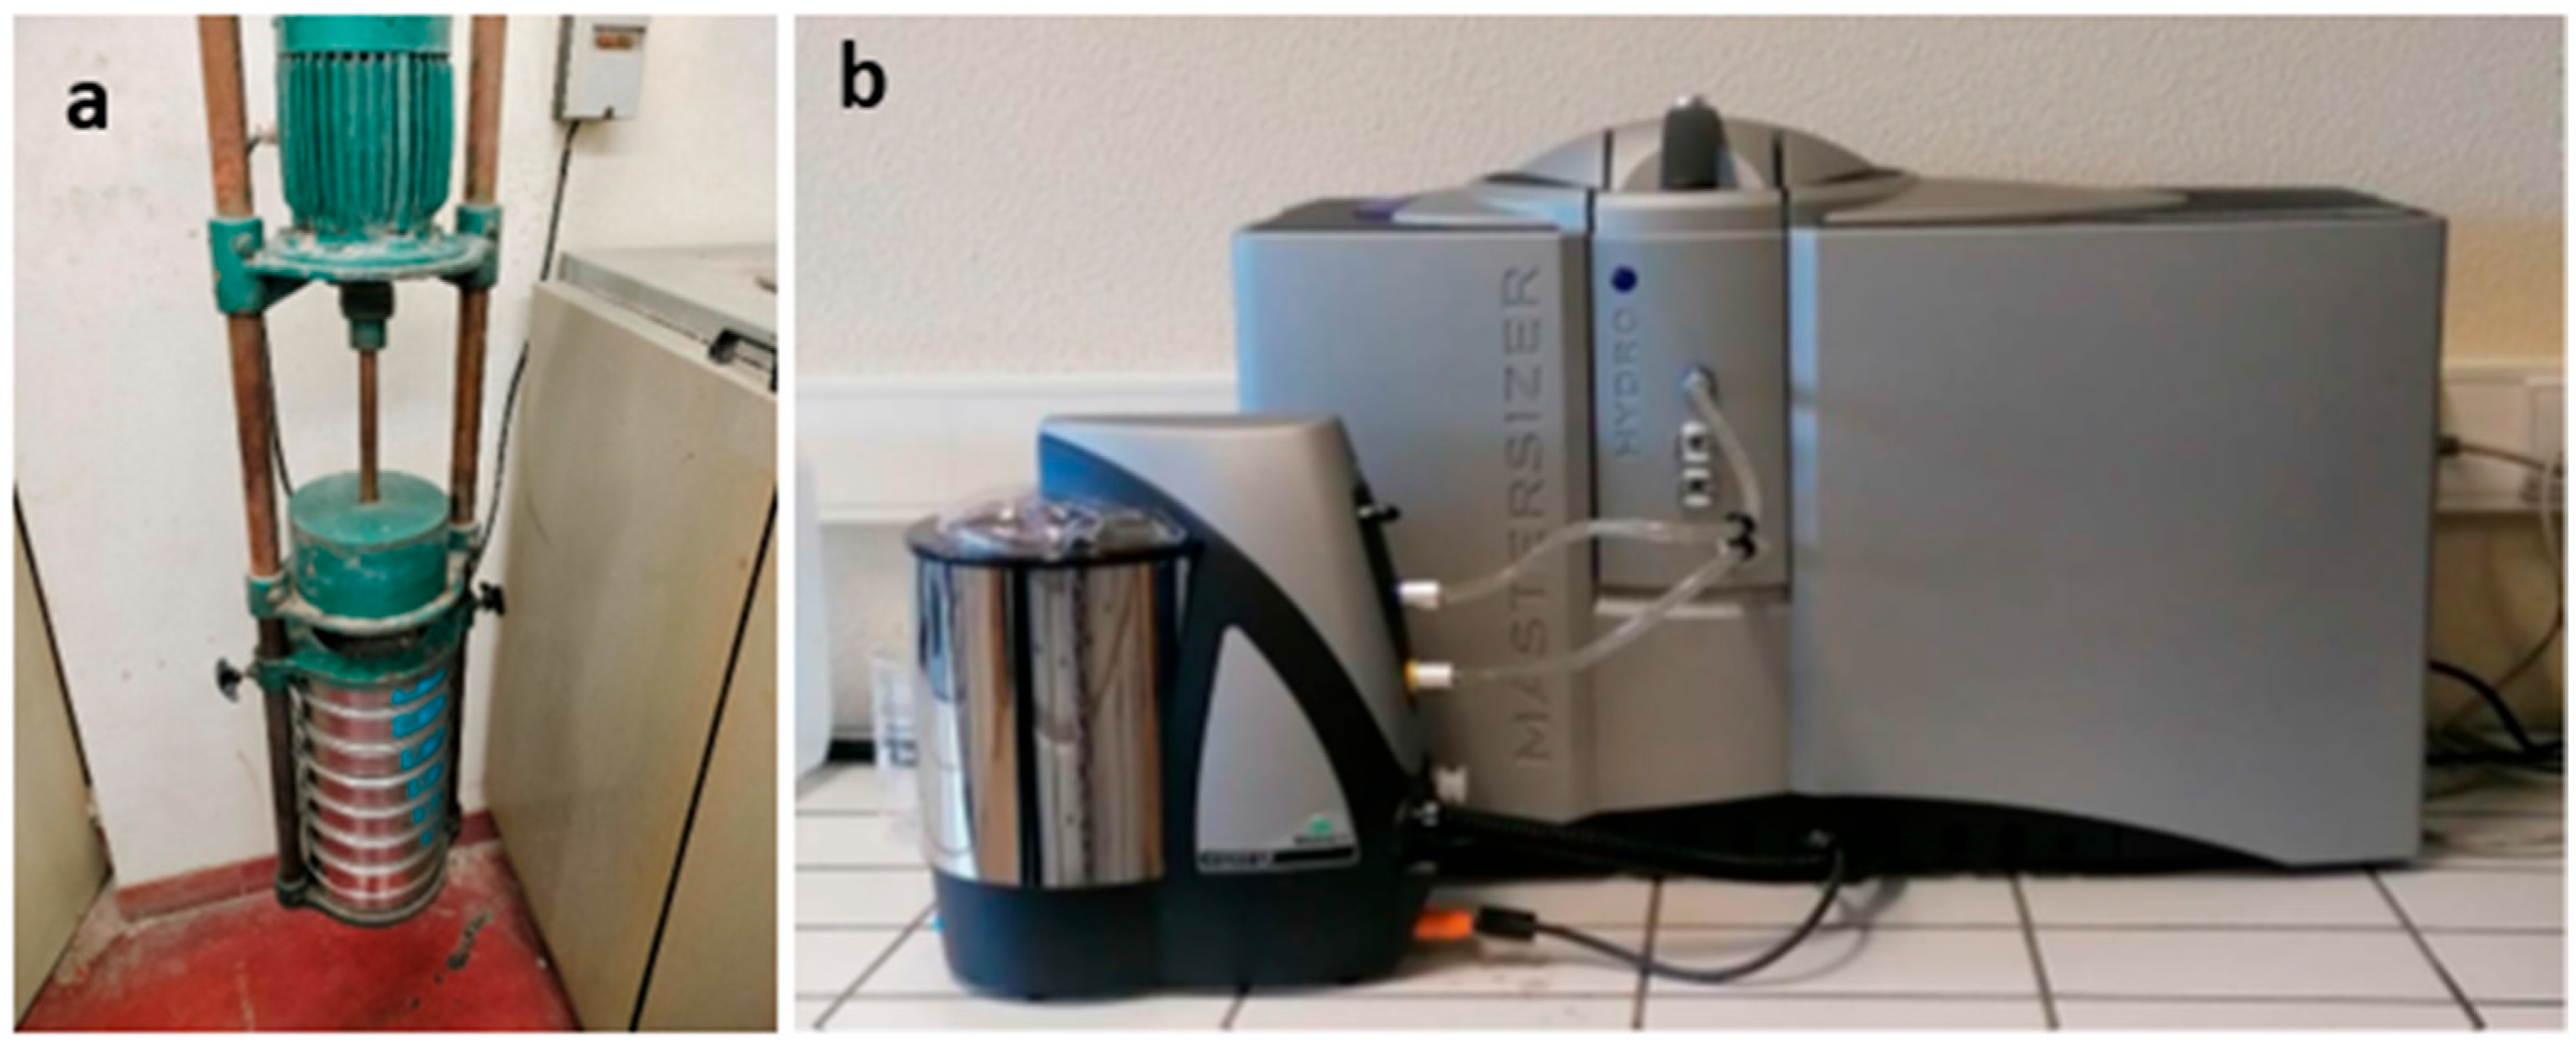
Figure 5.
Particle size distribution of solid materials.
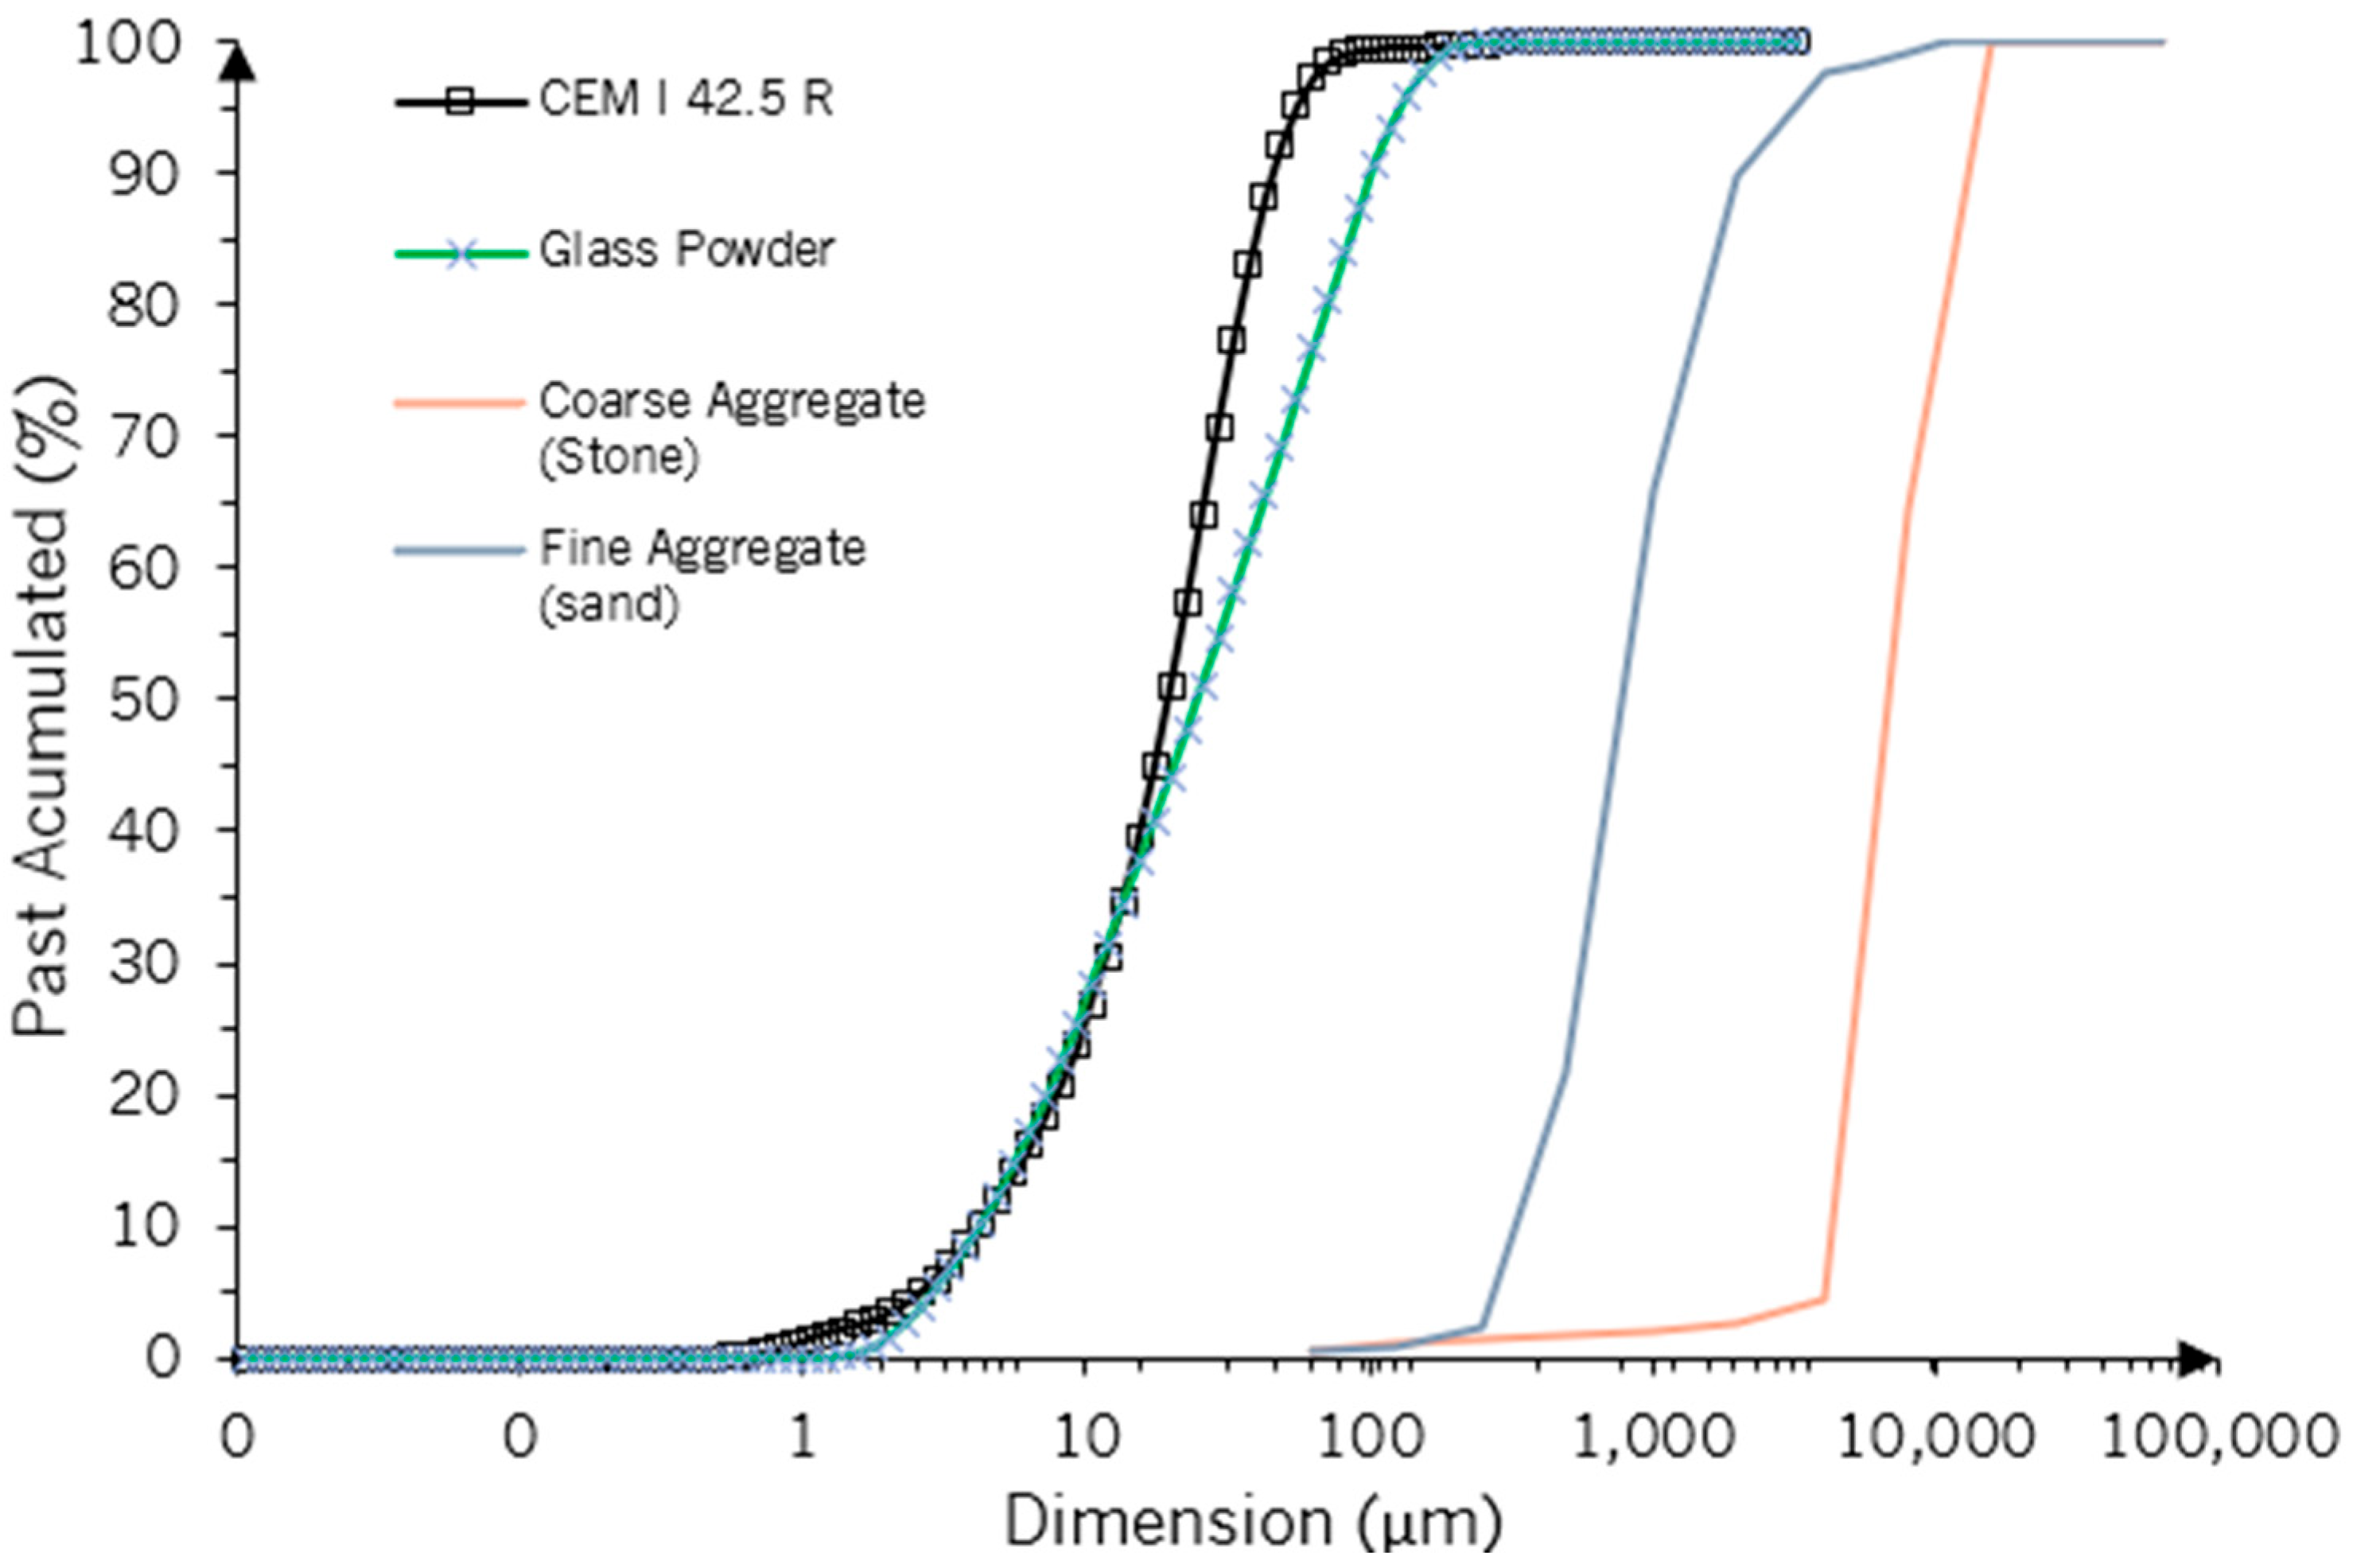
Figure 6.
Scanning electron microscopy (a) (×500) and (b) (×1000) of GP.

Figure 7.
XRD of GP.
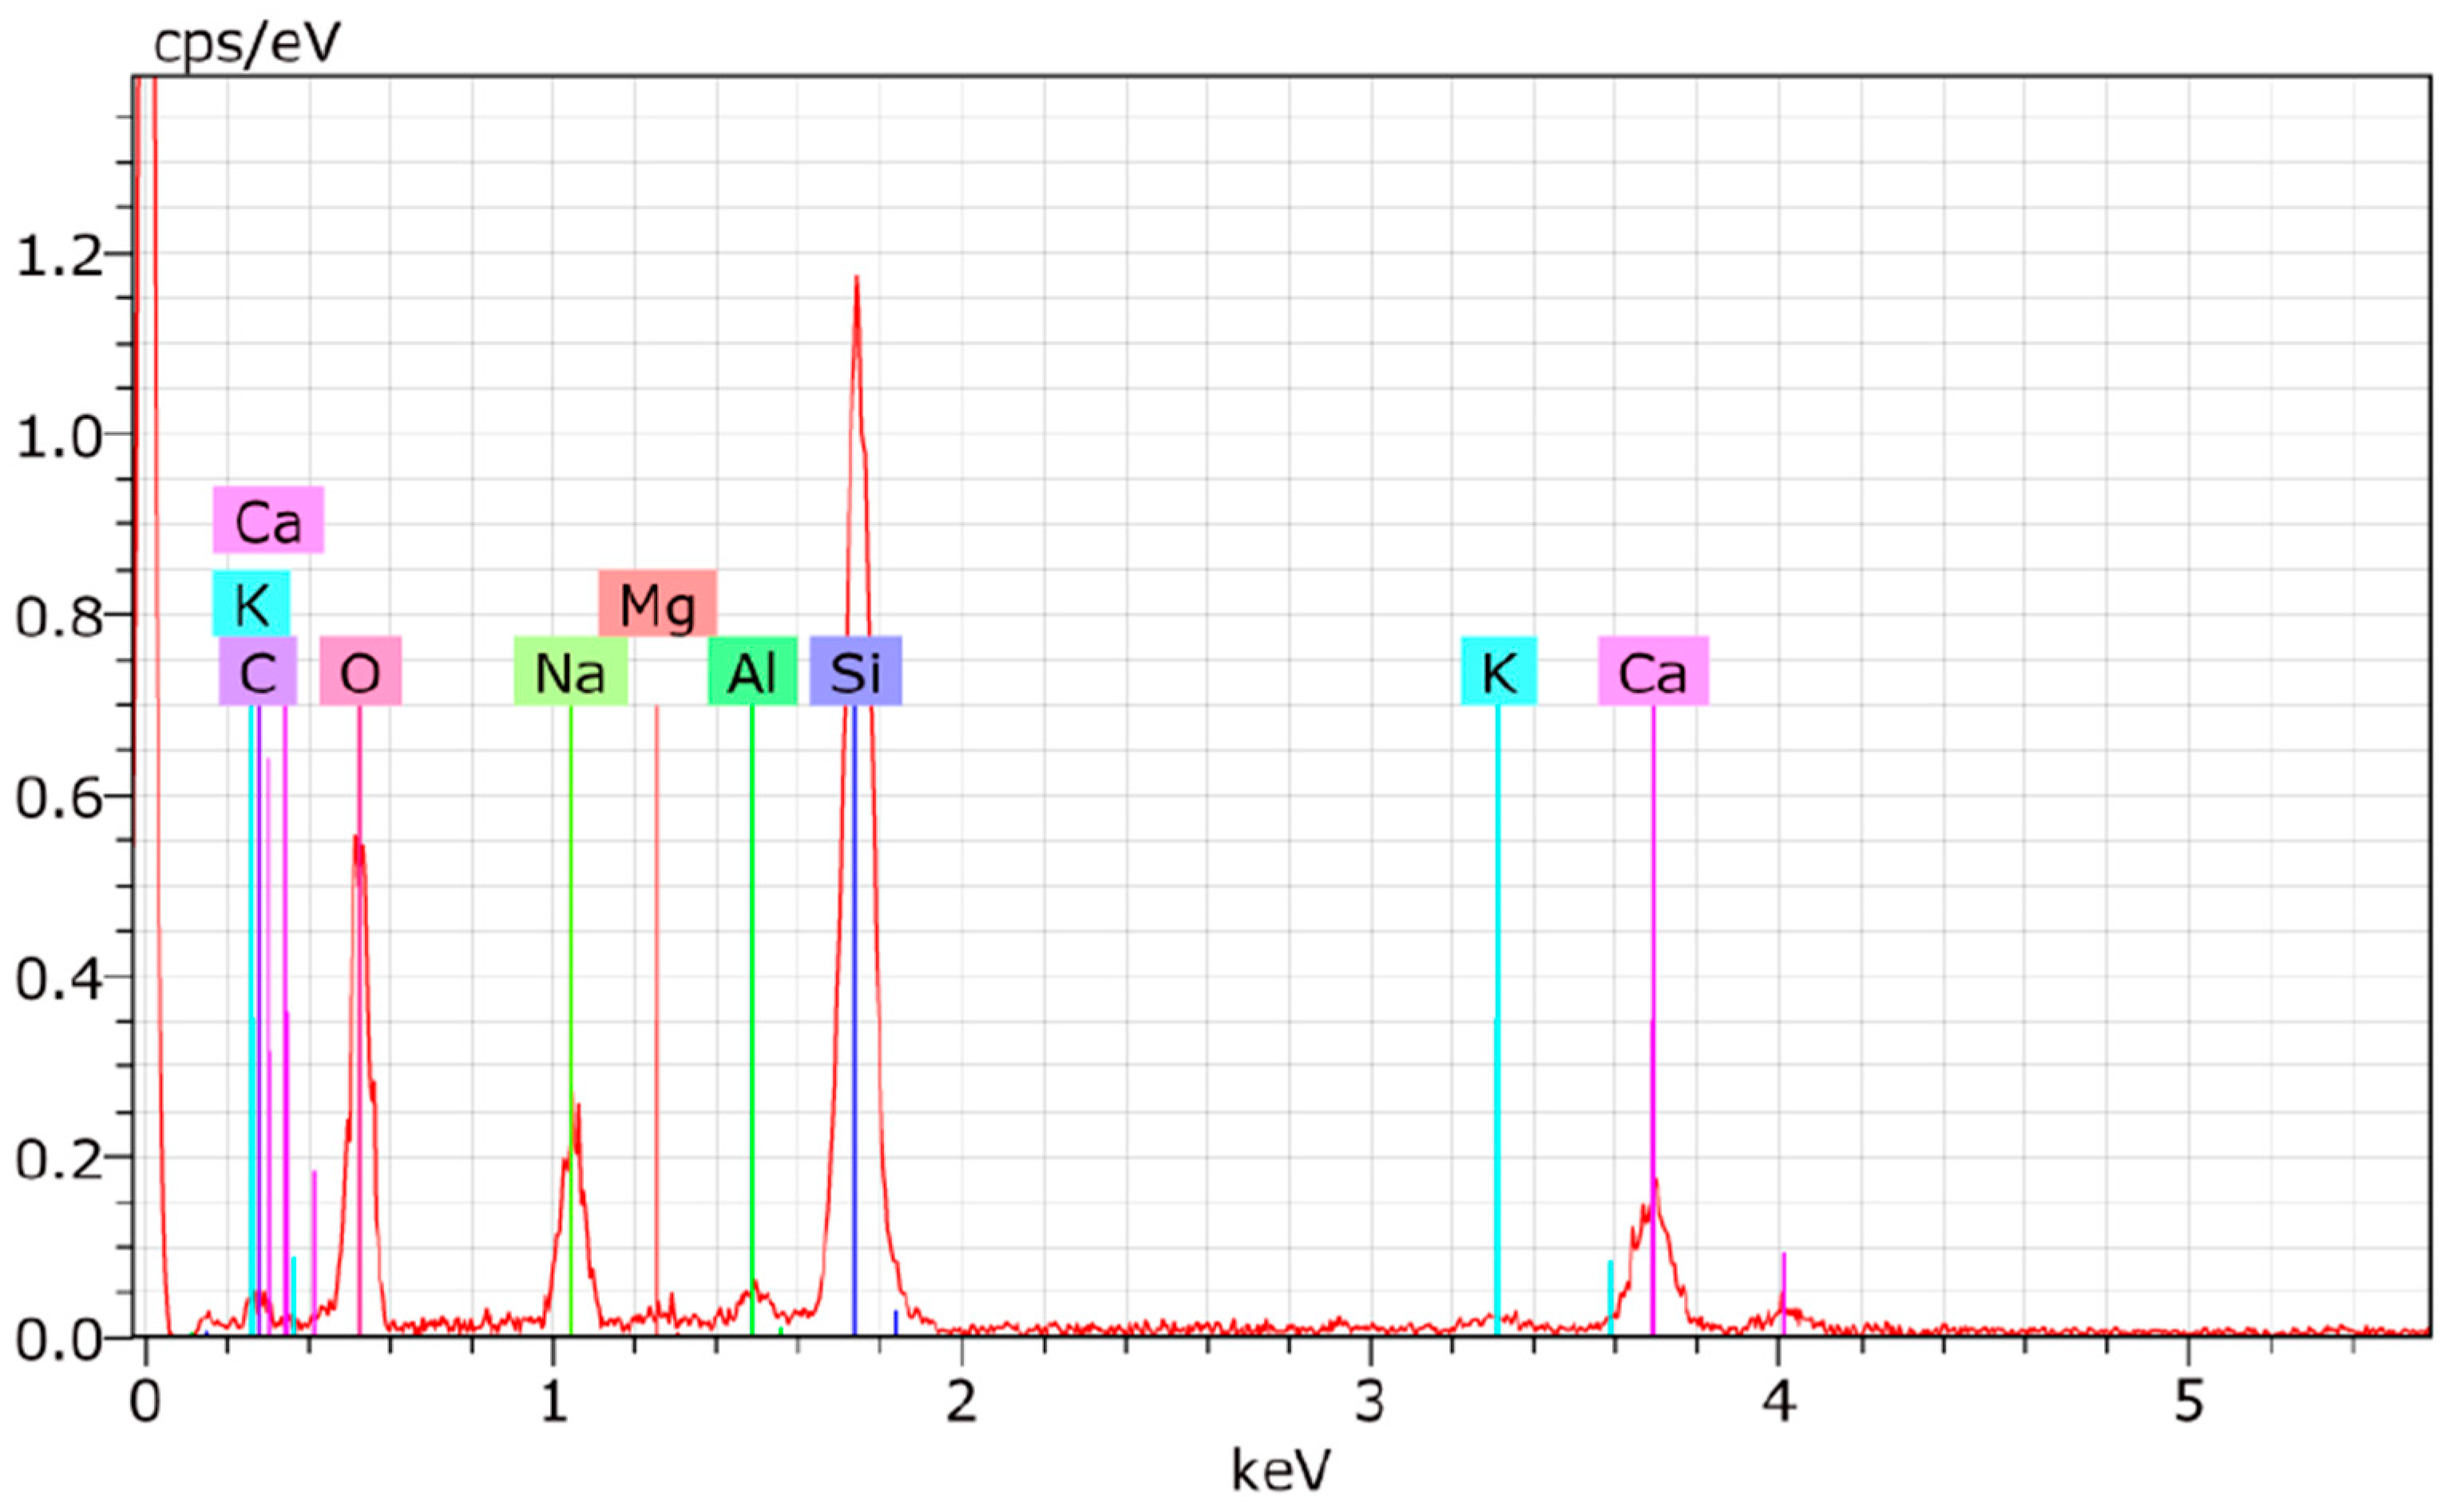
Figure 8.
Concrete GP procedure (a) scale, (b) aggregate mix, (c) cement mix, (d) GP mix.

Figure 9.
Molding (a), compaction (b), and curing (c).

Figure 10.
Flowchart of experimental campaign.
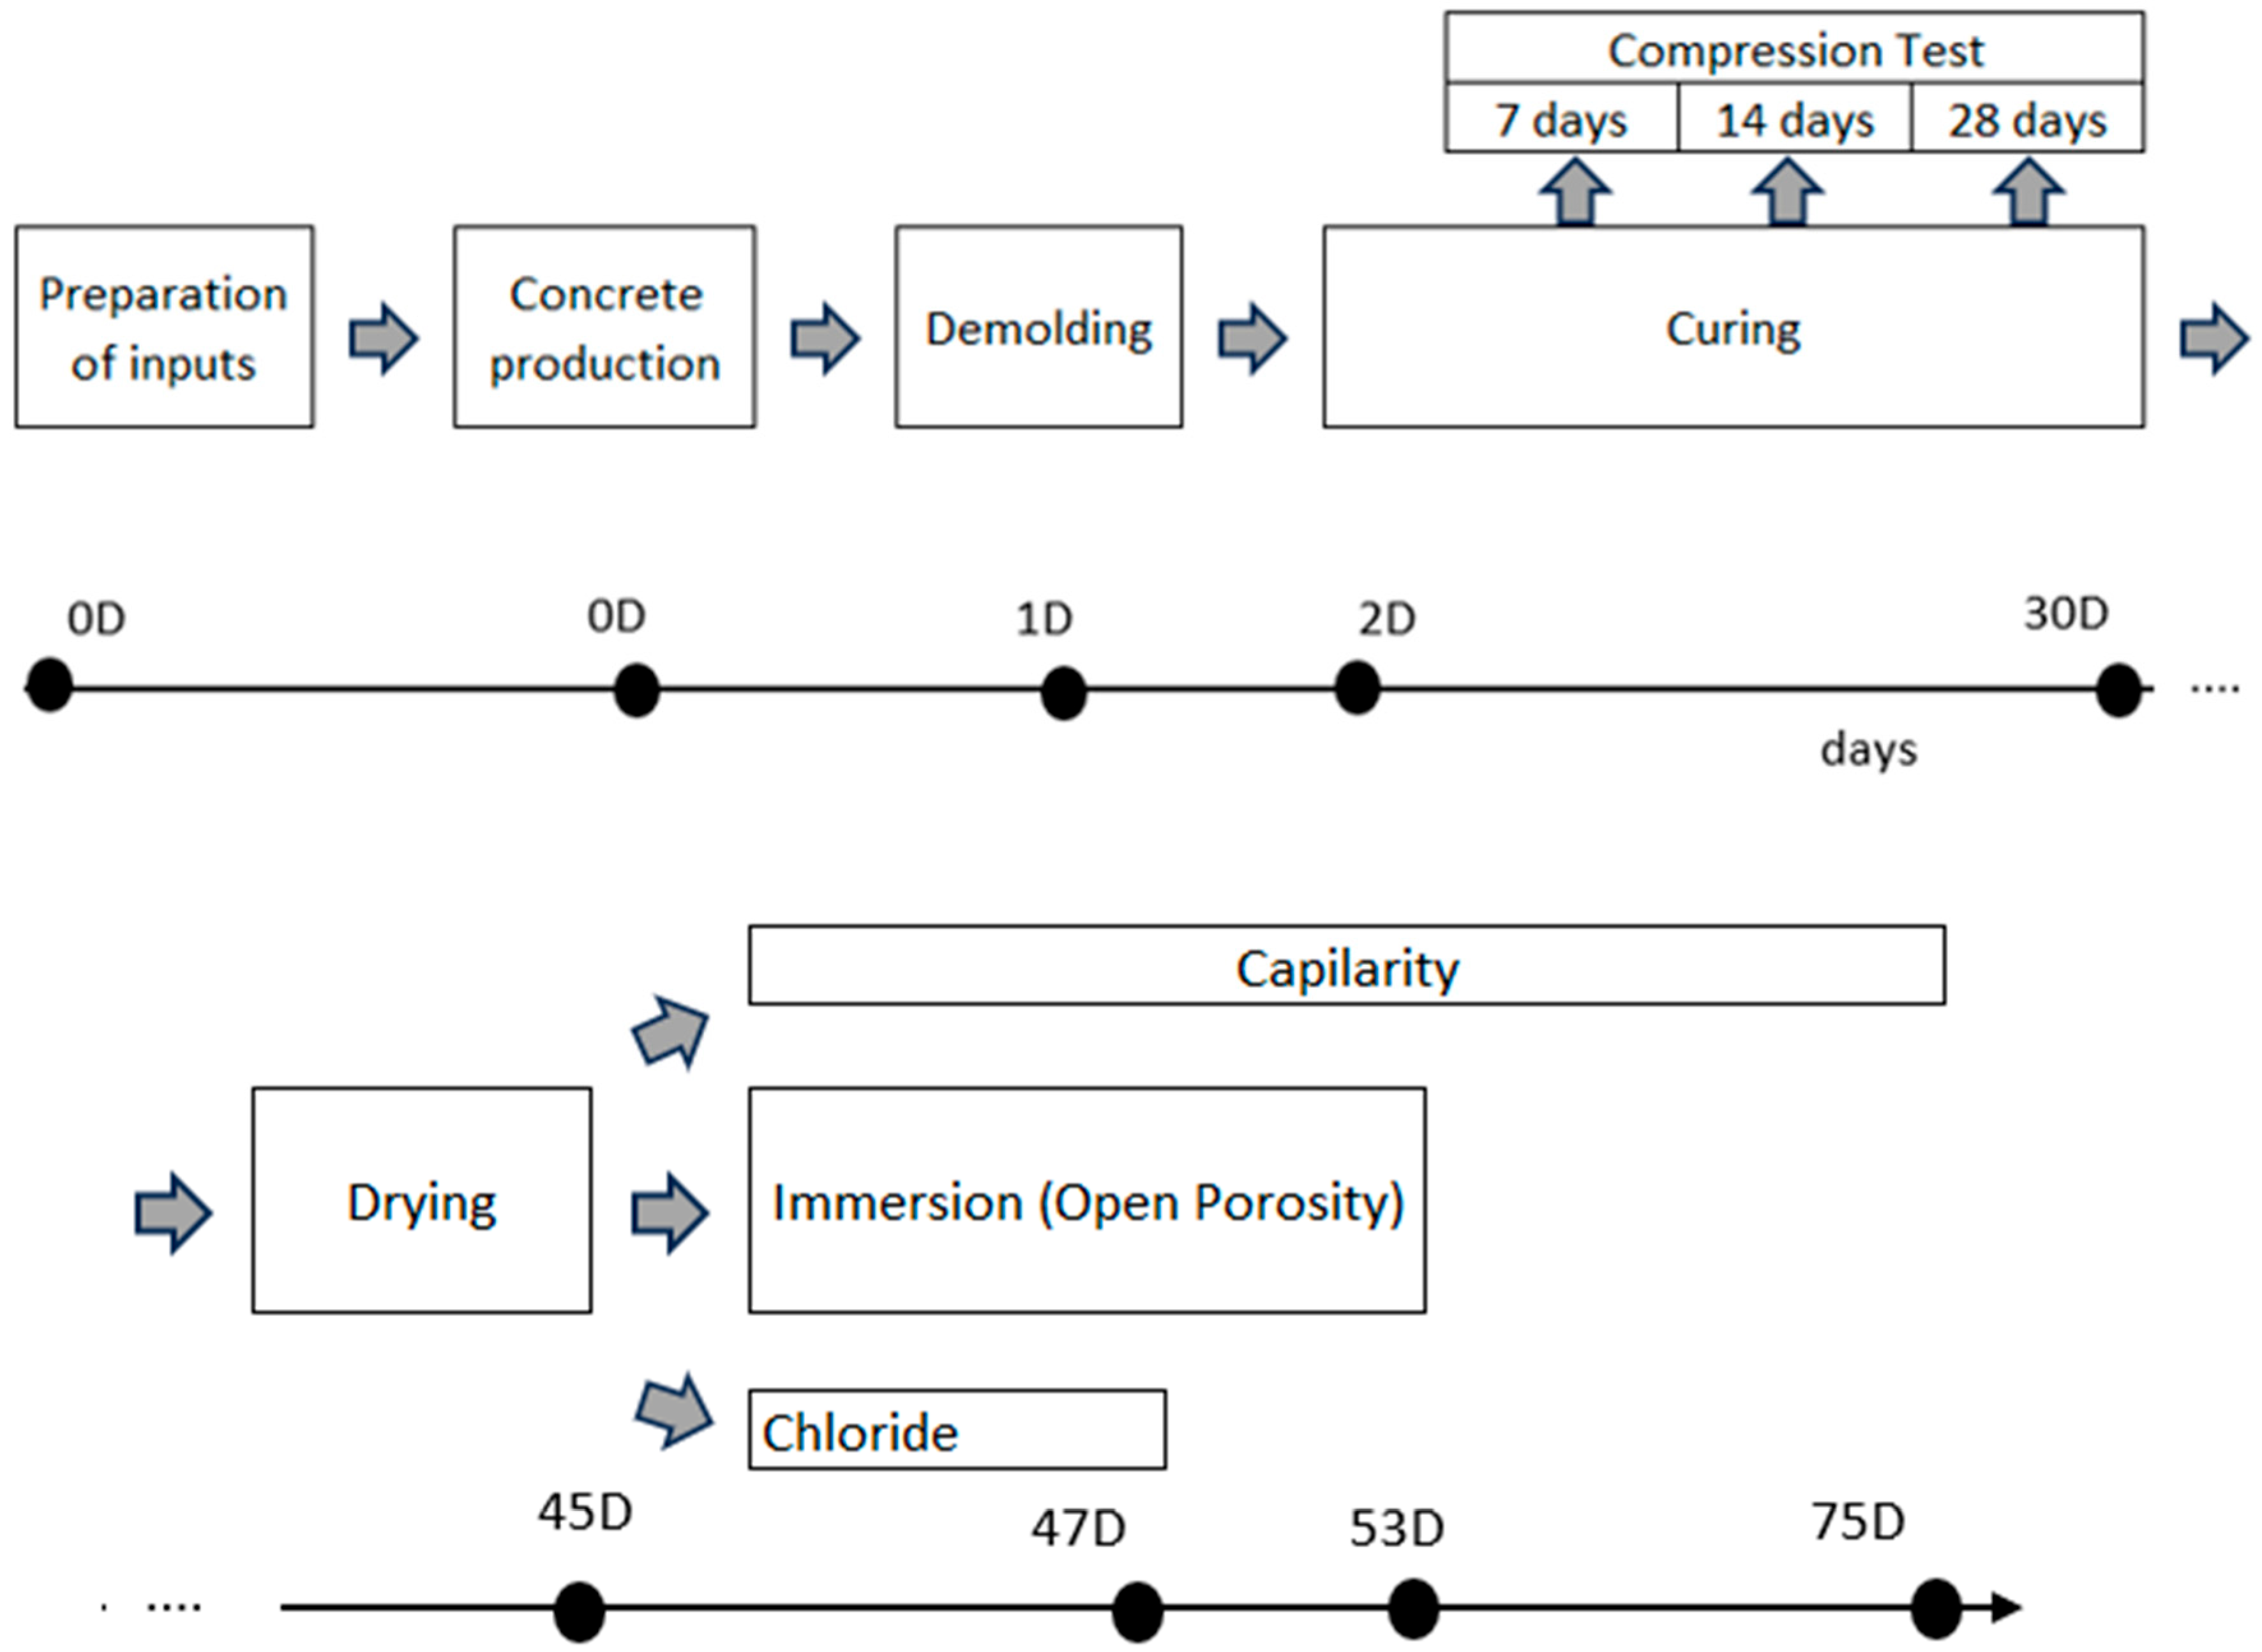
Figure 11.
Compressive strength testing setup.
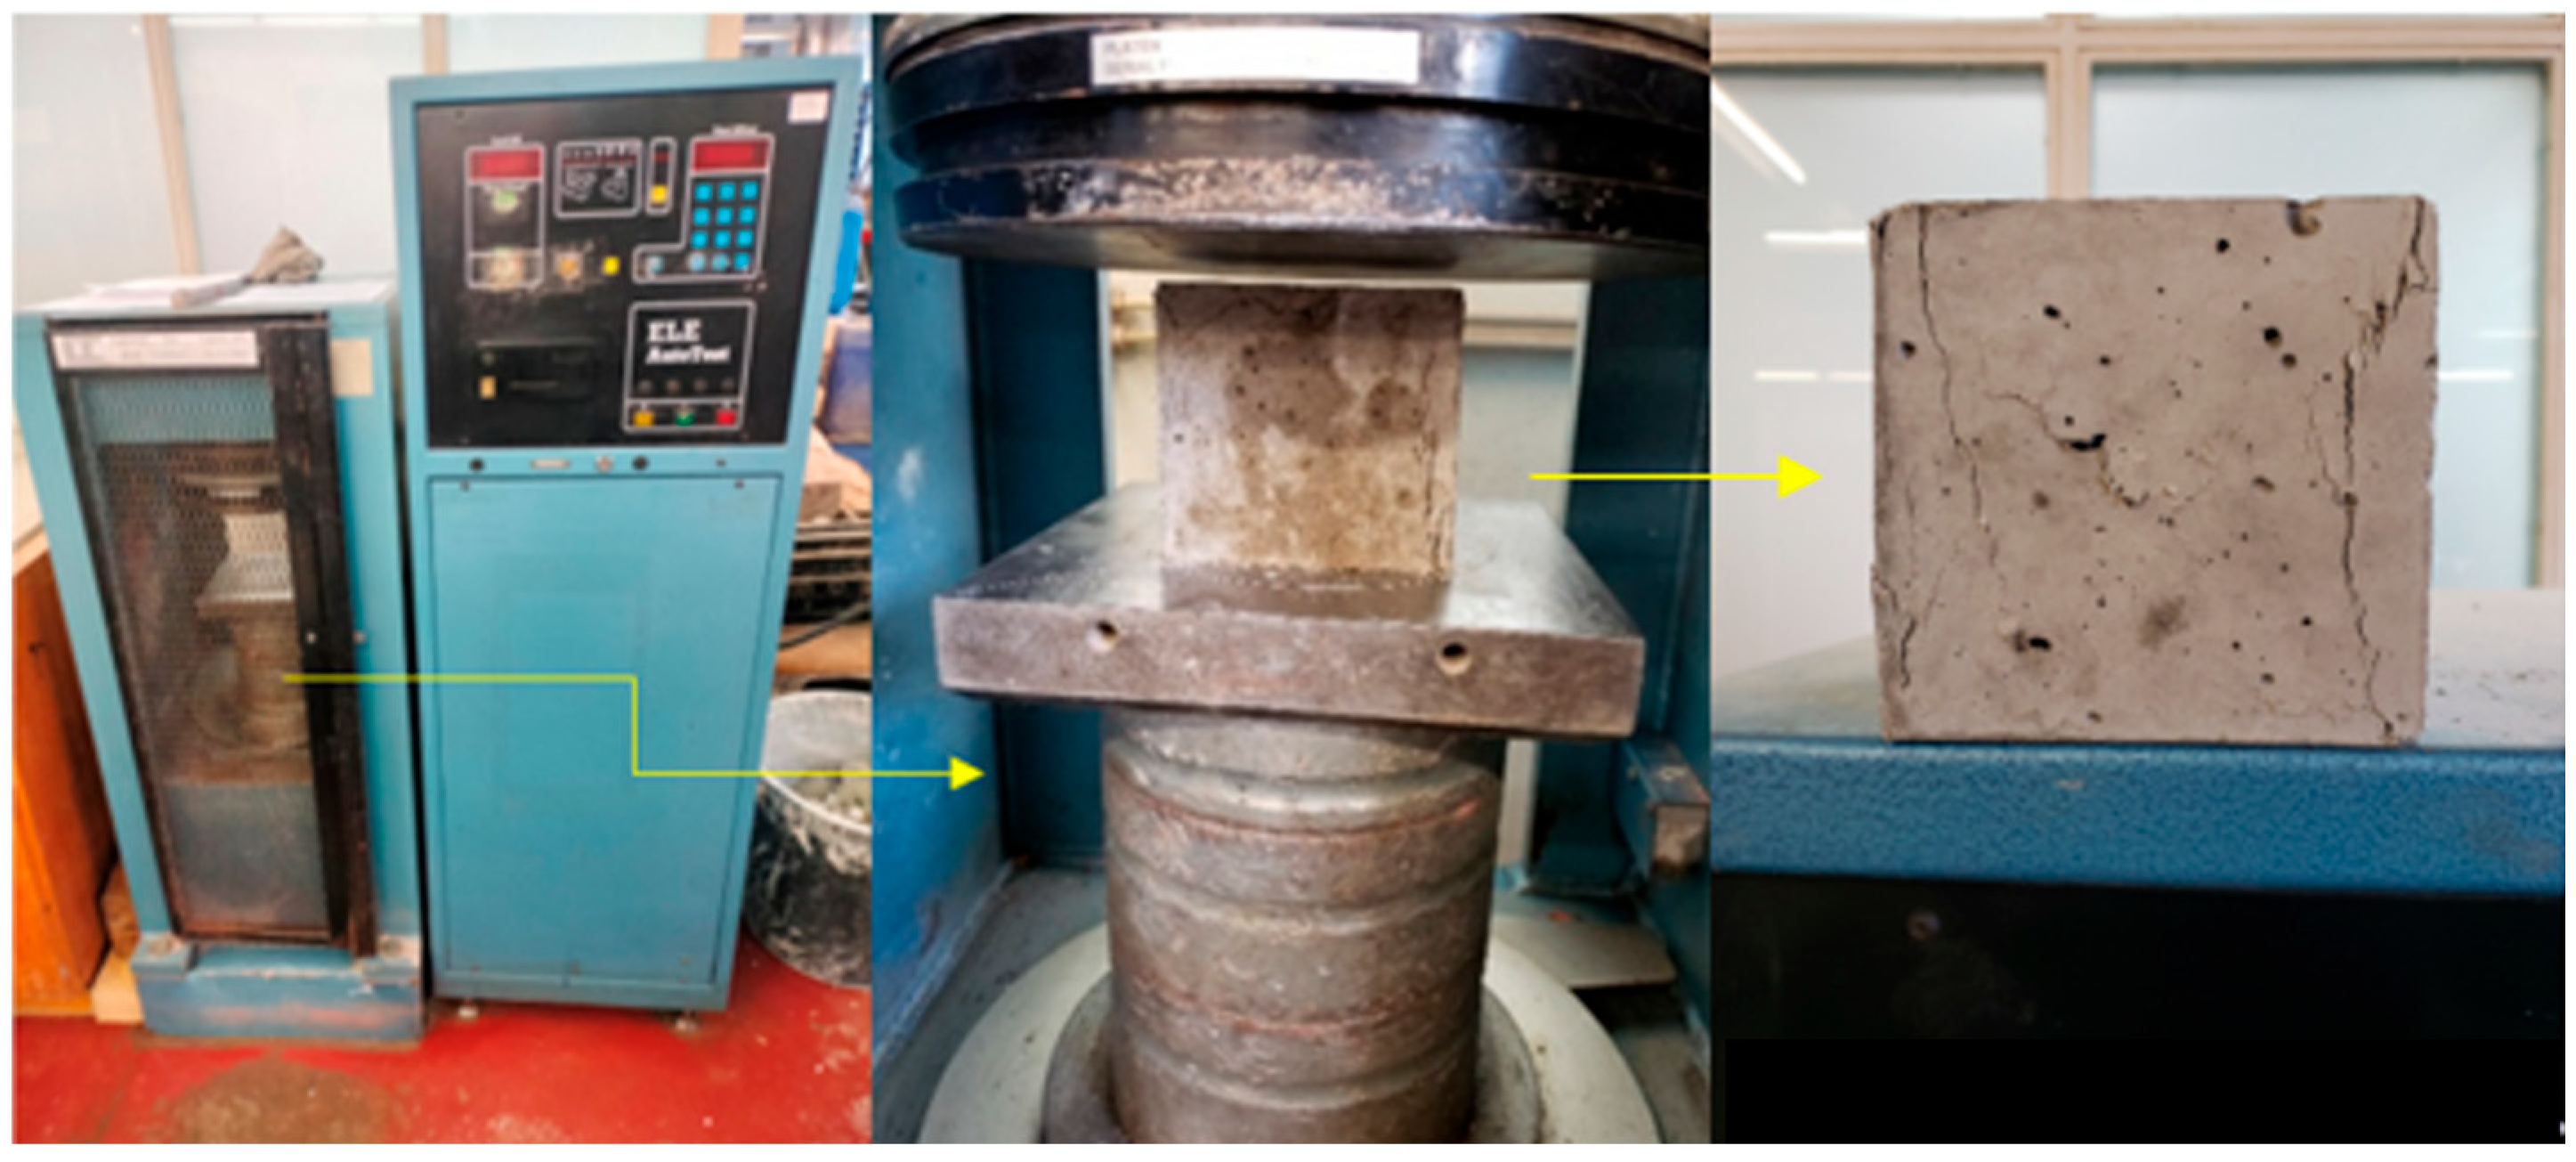
Figure 12.
Water absorption by immersion test setup: (a) drying, (b) immersion container.

Figure 13.
Capillary absorption—(a) drying oven, (b) specimens’ preparation and (c) container test setup.
Figure 13.
Capillary absorption—(a) drying oven, (b) specimens’ preparation and (c) container test setup.
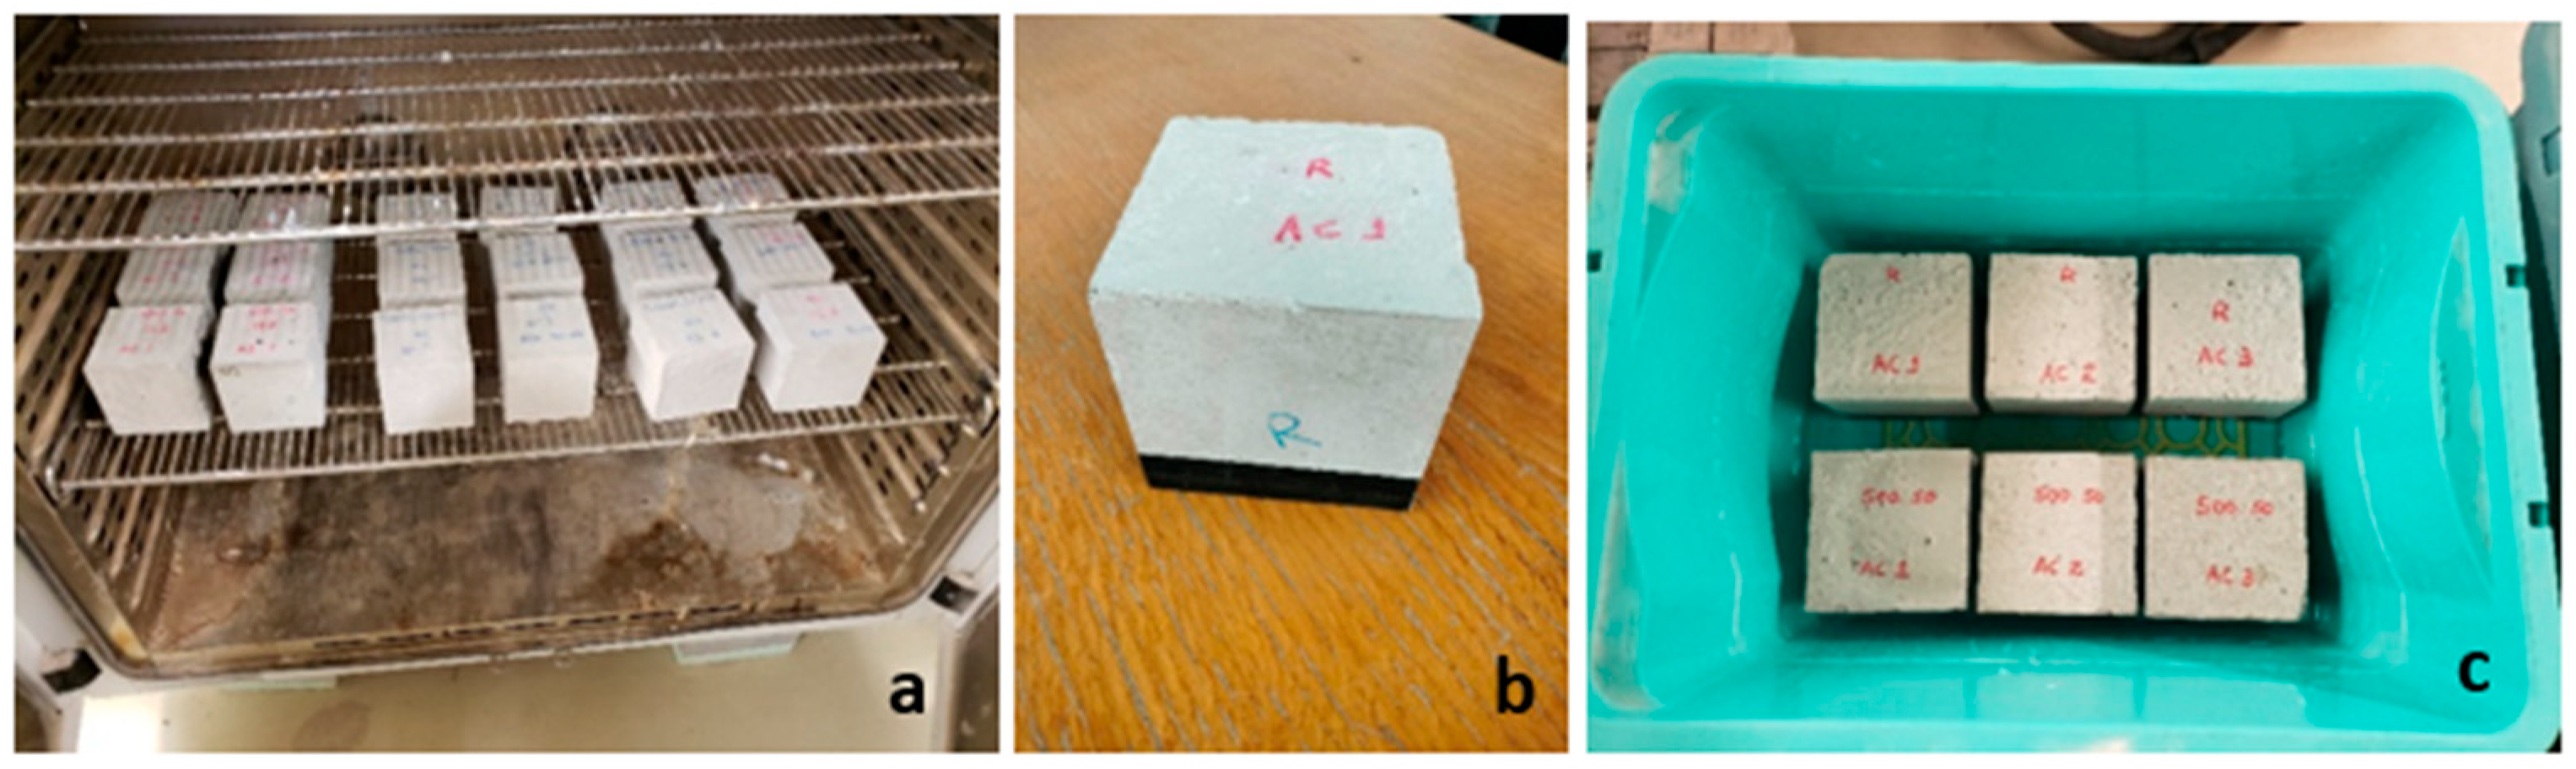
Figure 15.
Typical rupture in GP concretes—compression test.

Figure 16.
Compressive strength from 7 to 28 days of specimens.
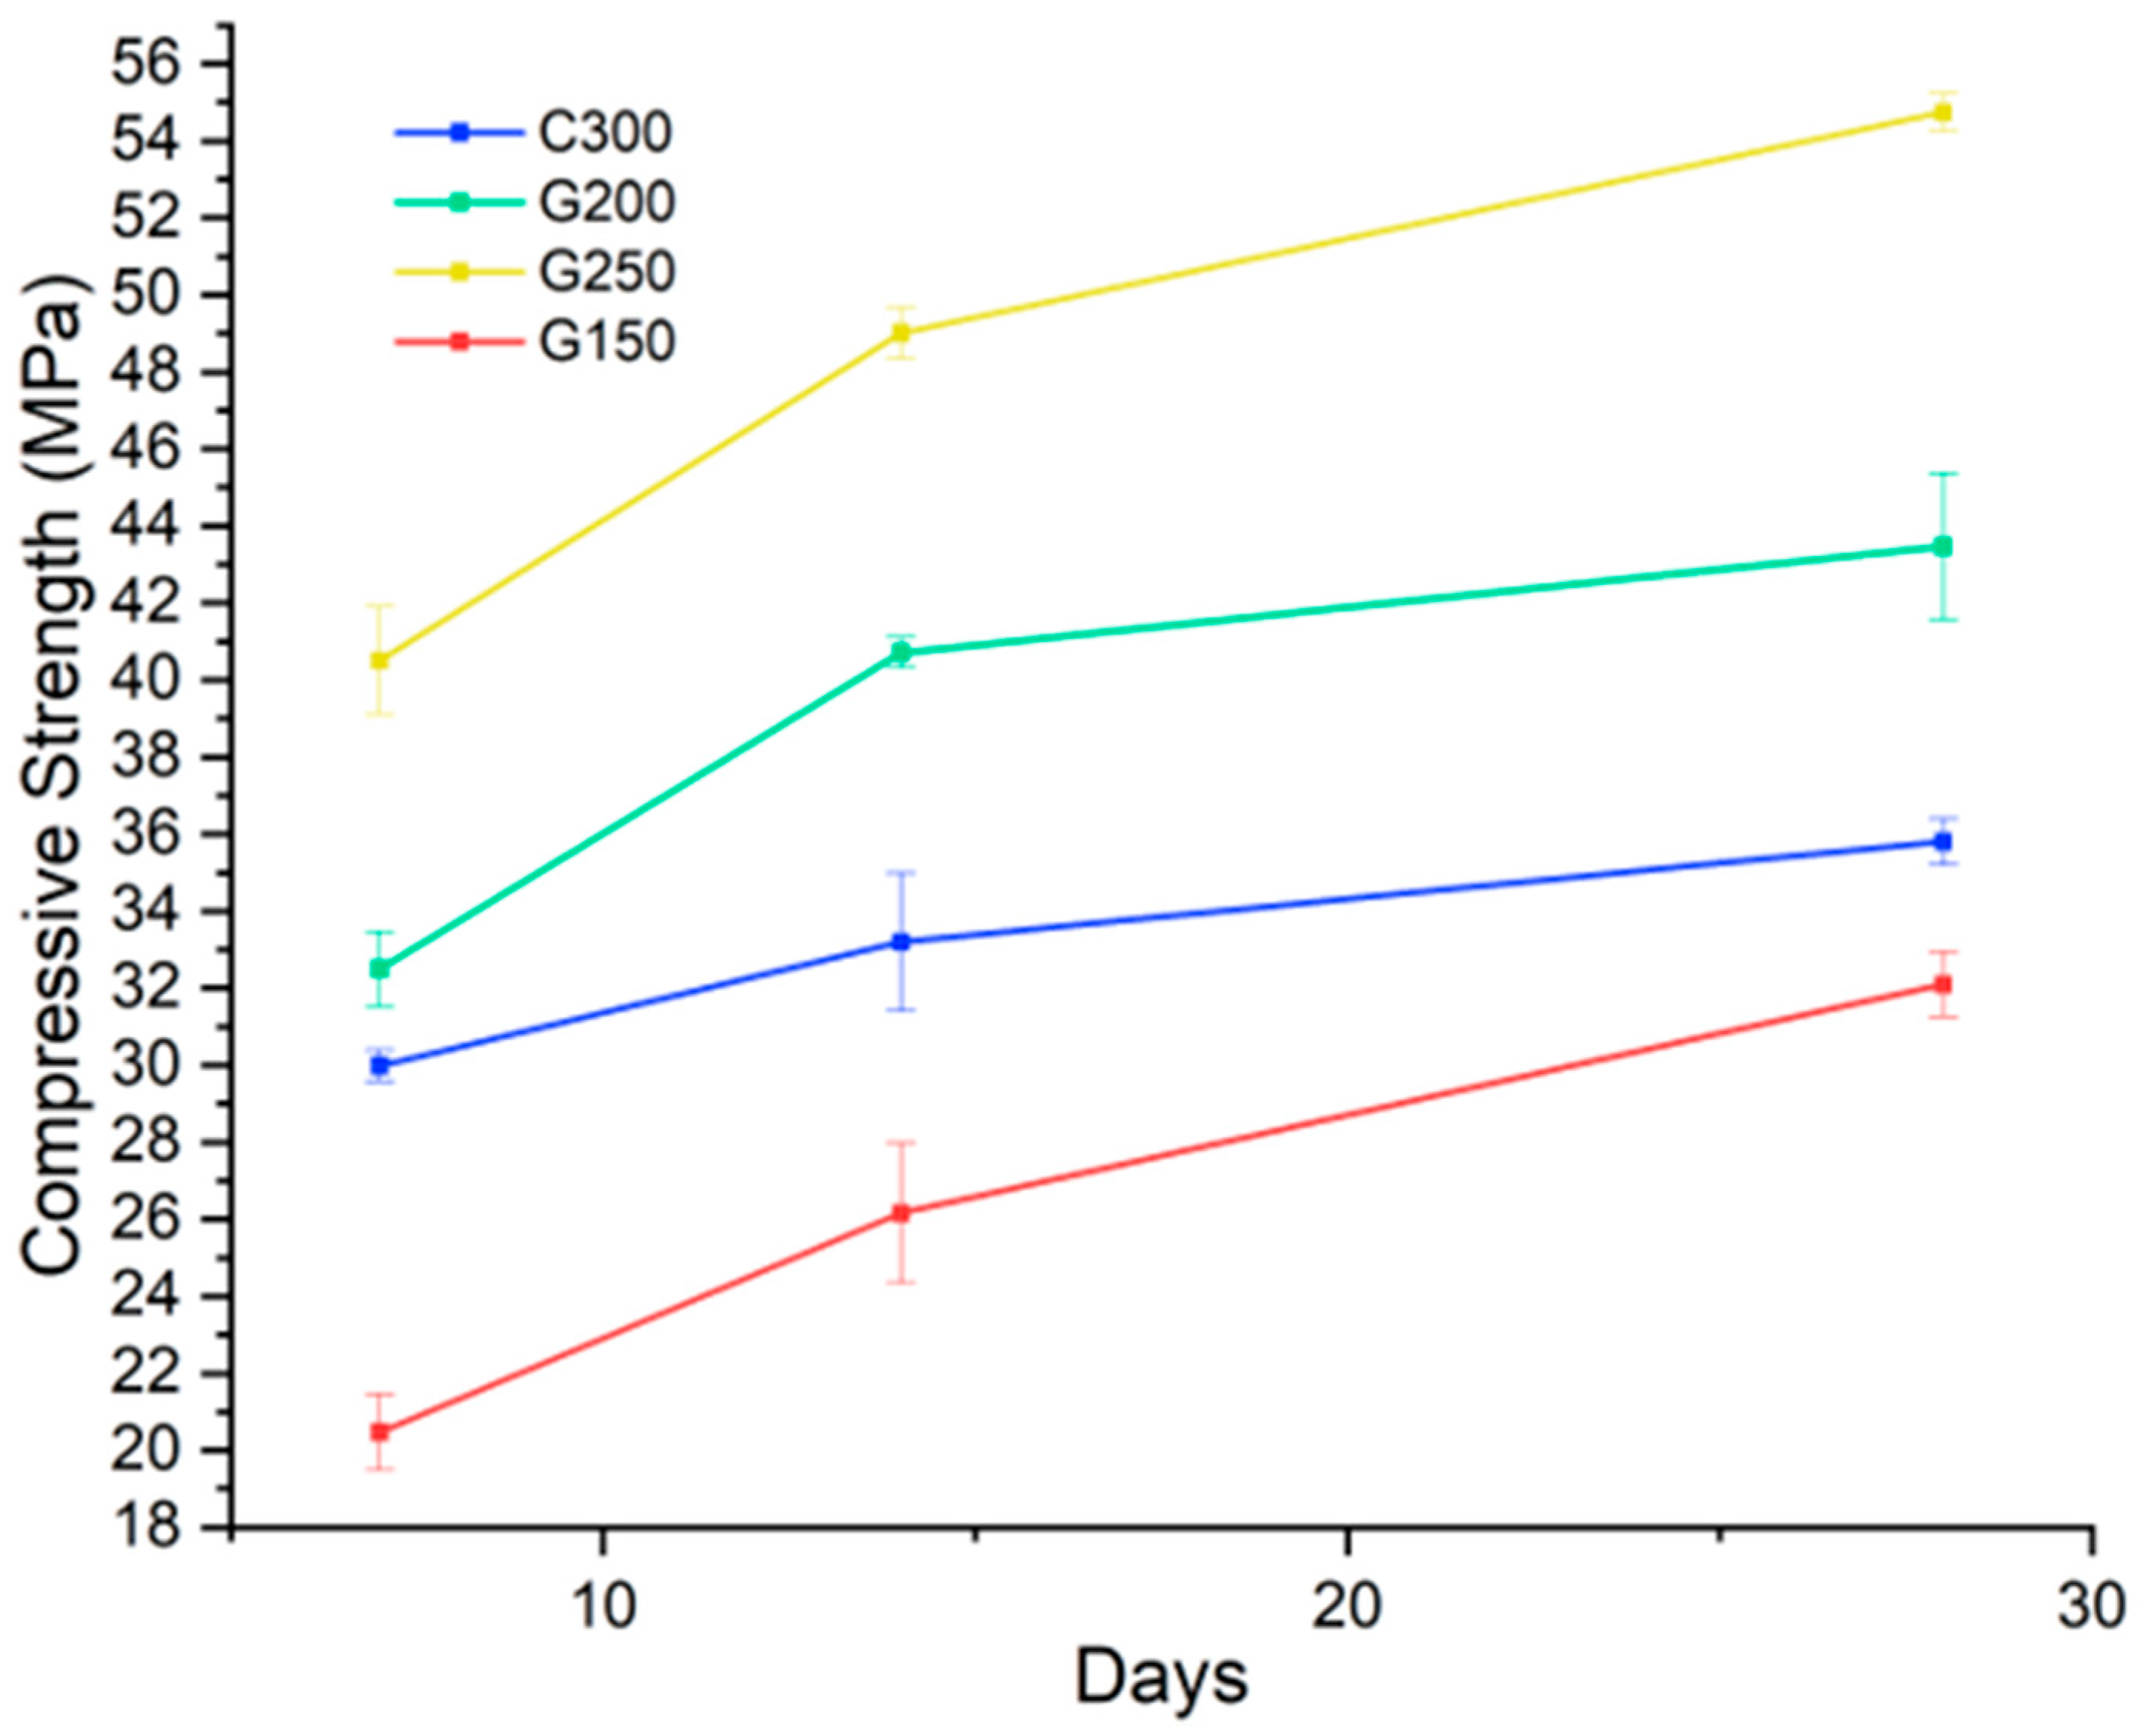
Figure 17.
Water absorption by immersion of tested specimens.
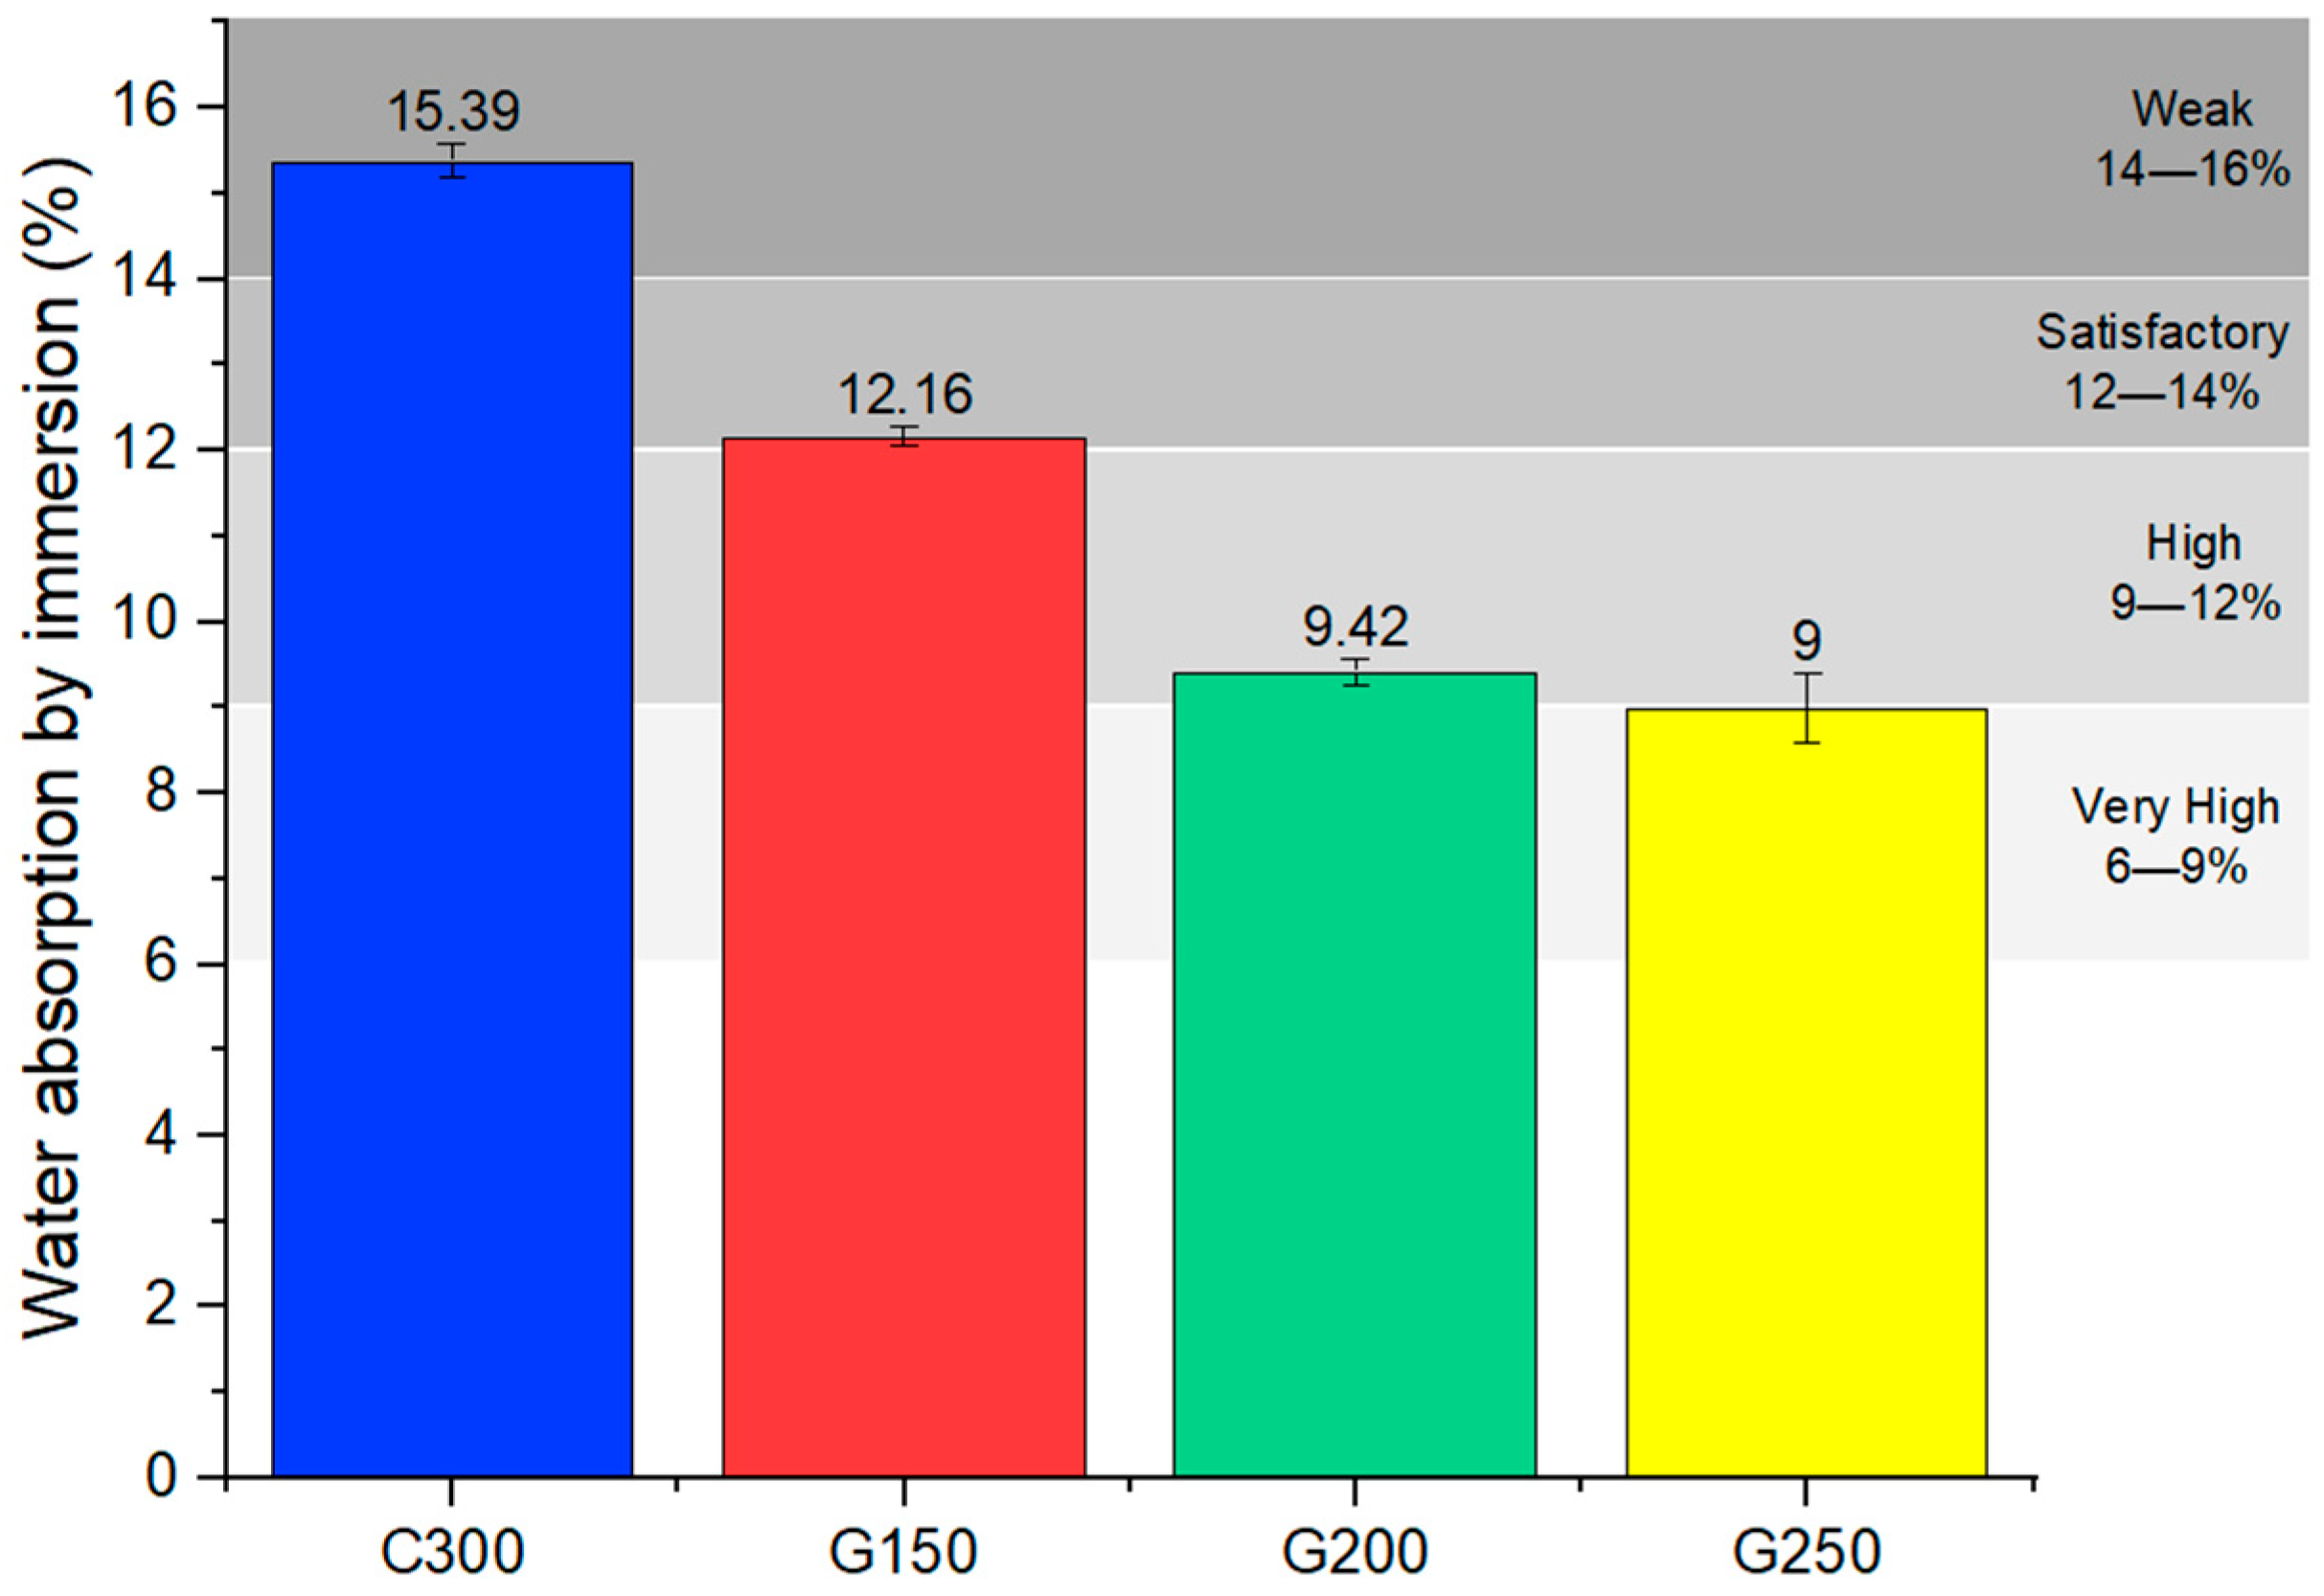
Figure 18.
Relationship between compressive strength and open porosity of specimens studied.

Figure 19.
Kinetics of capillary absorption of specimens (over 22 days).
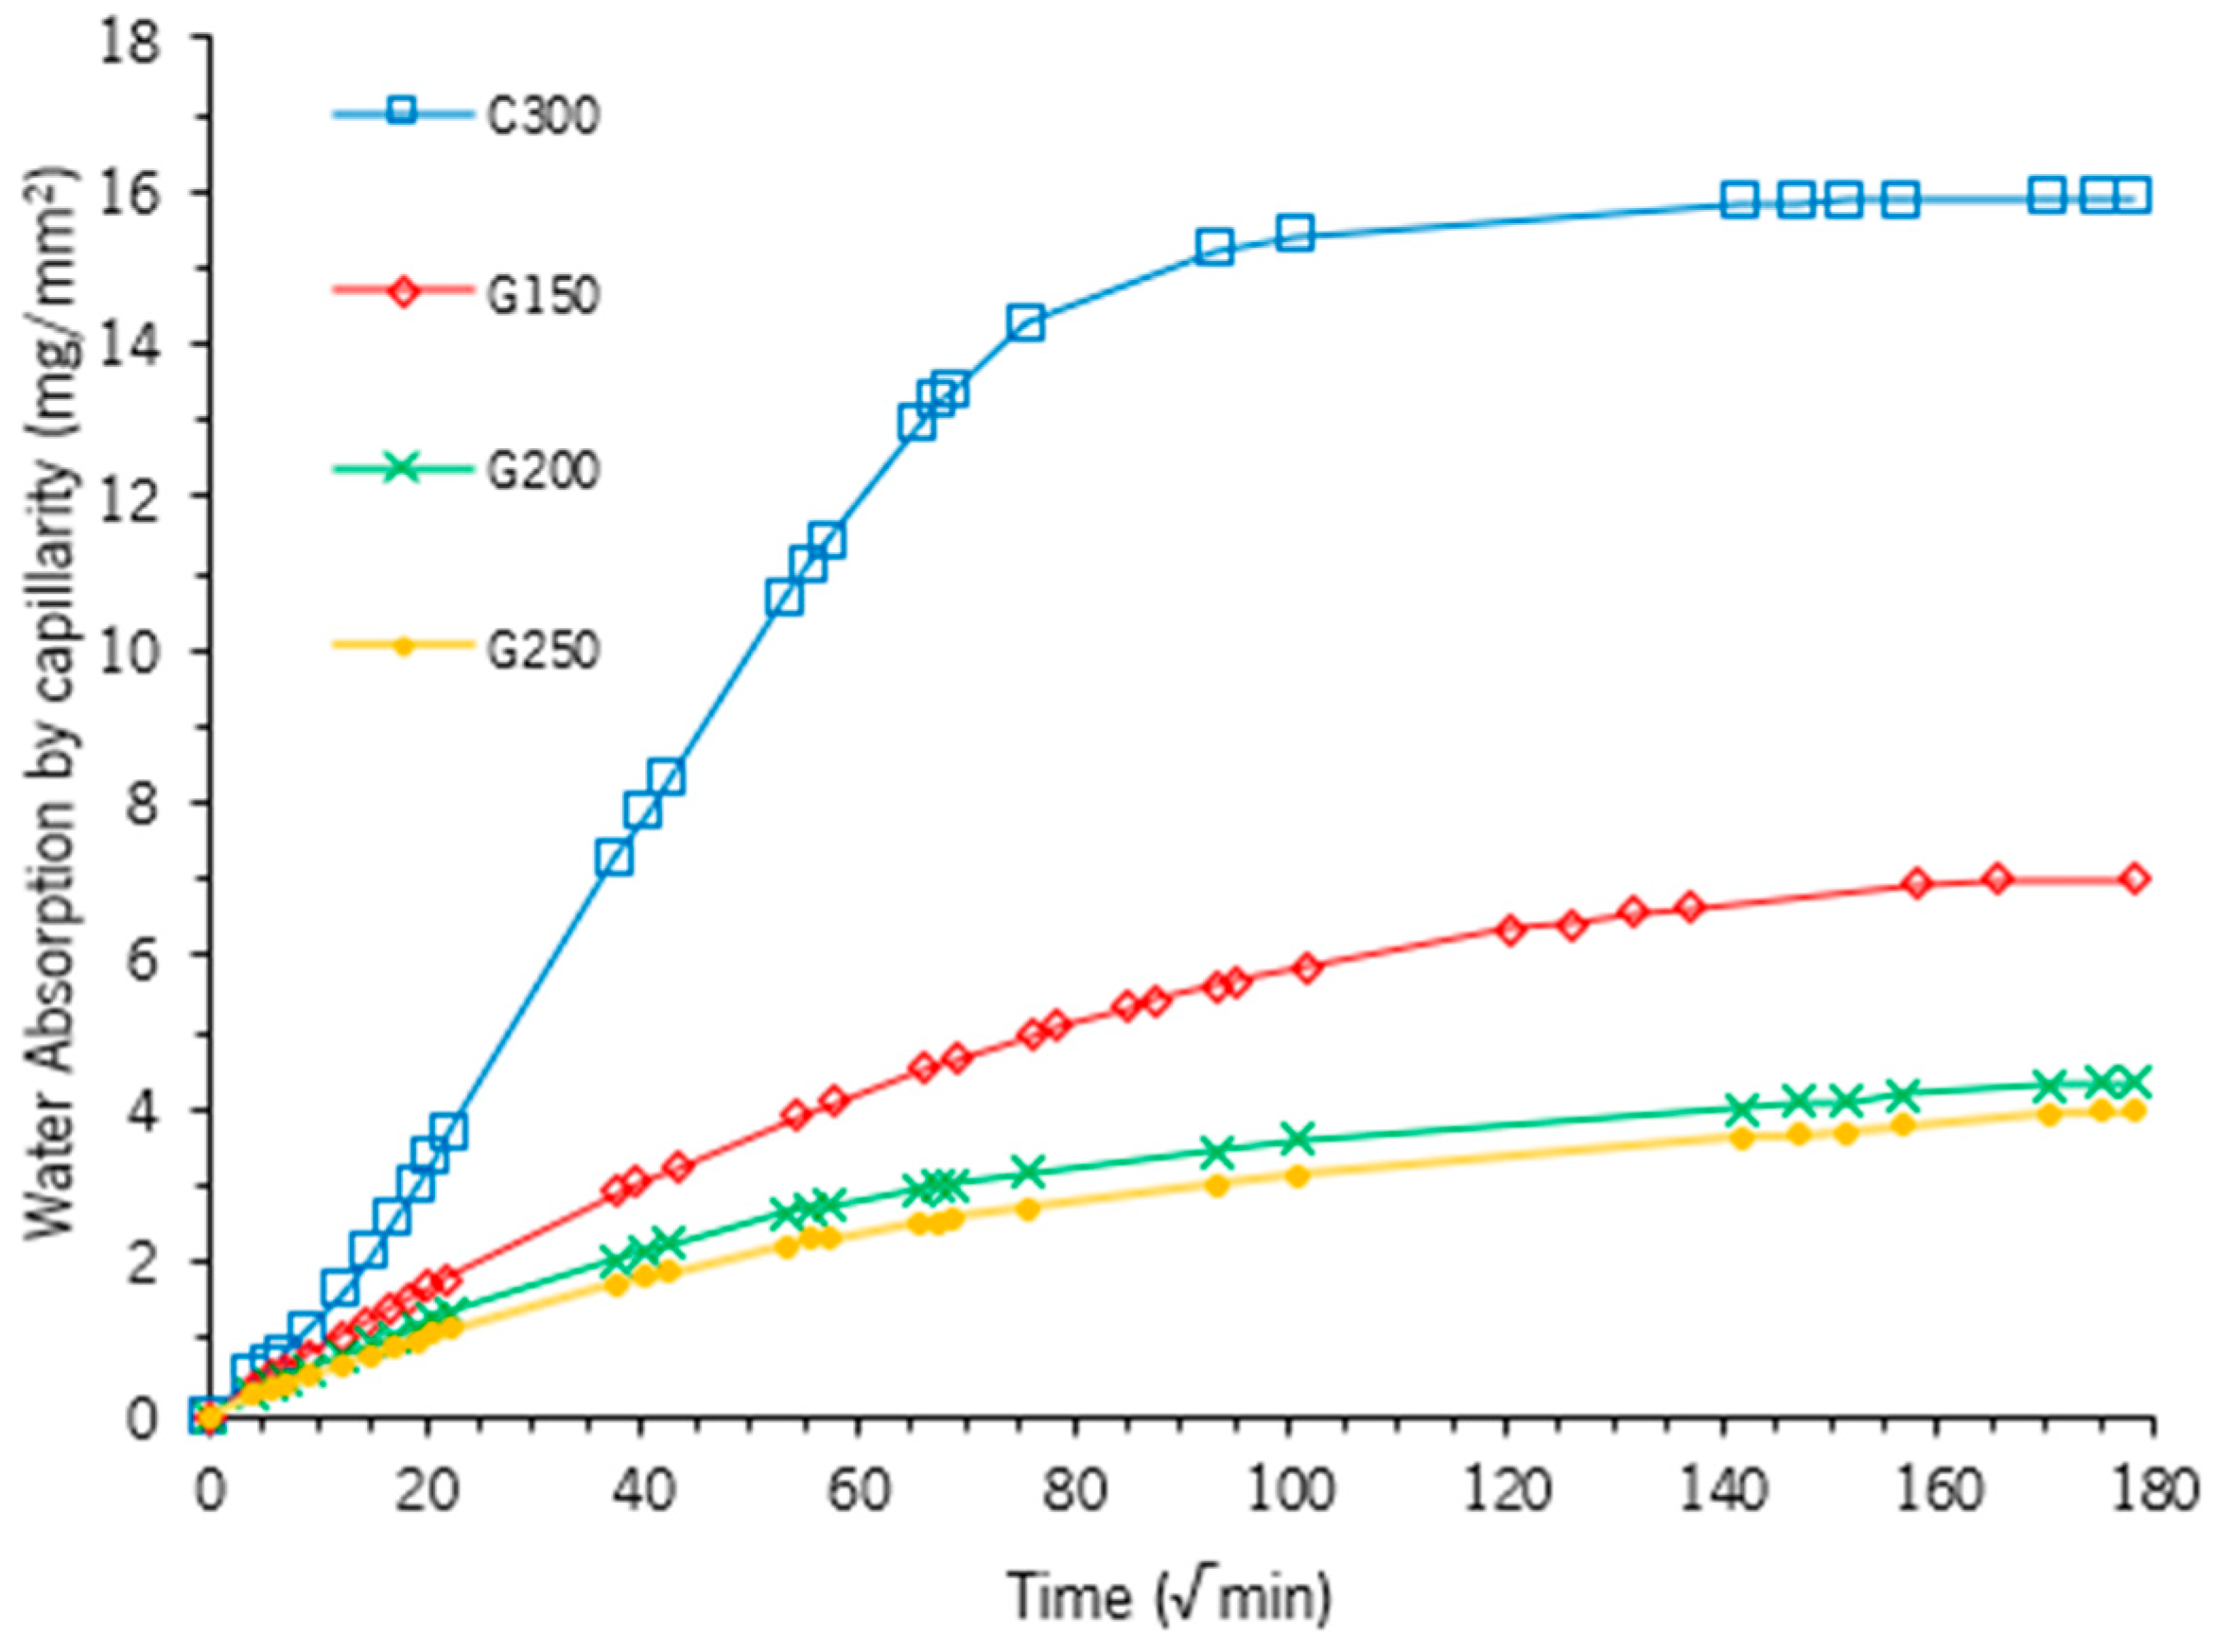
Figure 20.
Kinetics of capillary absorption of specimens (over 4 h).

Figure 21.
Capillary absorption coefficients of specimens (over 4 h).

Figure 22.
Chlorides of specimens studied.
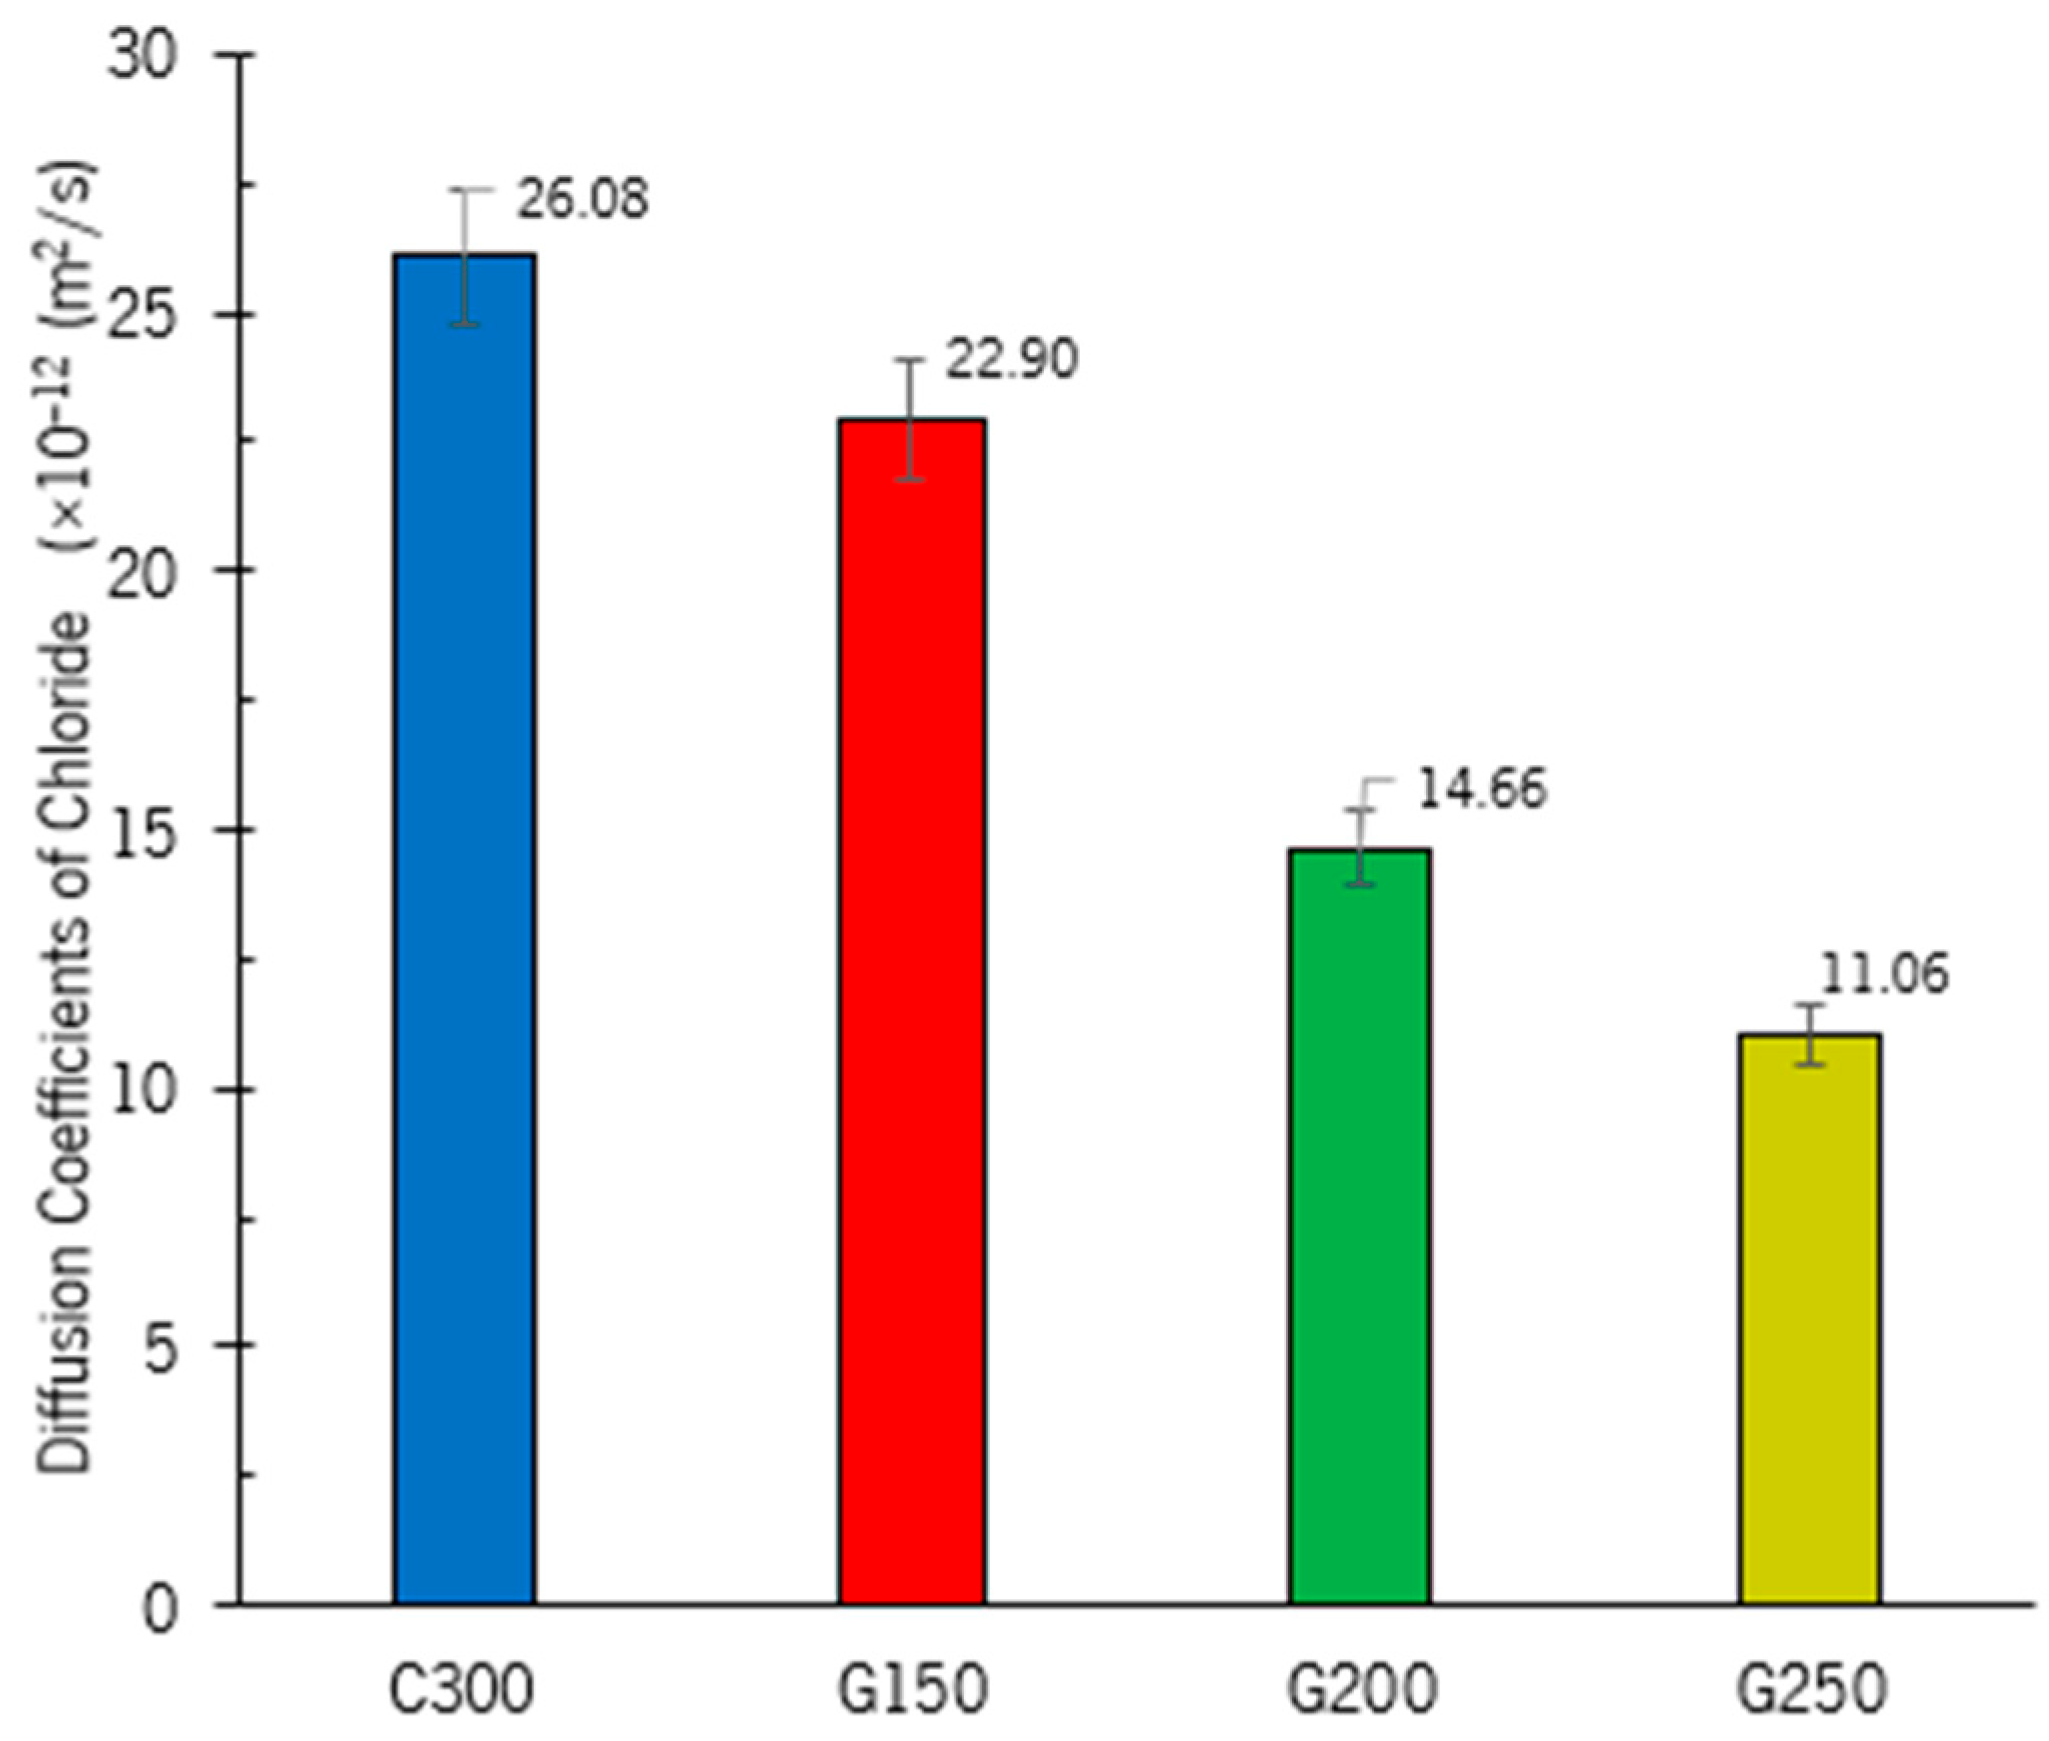
Figure 23.
Relationship between diffusion chloride coefficient, compressive strength, and open porosity of specimens studied.
Figure 23.
Relationship between diffusion chloride coefficient, compressive strength, and open porosity of specimens studied.


Table 1.
Chemical composition of cement and GP.
| Material | CEM I 42.5 R | GP |
|---|---|---|
| CaO | 62.77 | 11.80 |
| Fe2O3 | 3.06 | 1.30 |
| SiO2 | 20.25 | 69.20 |
| Al2O3 | 4.43 | 2.30 |
| MnO | - | 0.10 |
| MgO | 2.01 | 1.00 |
| SO3 | 3.11 | - |
| TiO2 | - | |
| K2O | 0.76 | 0.90 |
| Na2O | 0.25 | 13.40 |
| Balance to 100% (Others) | 3.36 | - |
| LOI | 2.74 | - |
| RI | 1.23 | - |
Table 2.
Specific surface and density of binder and aggregates.
| Material | Blaine Specific Surface Se (m2/kg) | Density ρ (kg/m3) |
|---|---|---|
| CEM I 42.5 R | 599s | 3.142 |
| GP | 493 | 2.604 |
| Fine aggregate (sand) | - | 2620 |
| Coarse aggregate (gravel) | - | 2.197 |
Table 3.
Diameter characteristics of cement and GP (μm).
| Material | D10 | D50 | D90 |
|---|---|---|---|
| CEM I 42.5R | 4.68 | 21.90 | 54.60 |
| GP | 4.57 | 26.00 | 106.00 |
Table 4.
Mix proportion of concrete (kg/m3).
| Specimens | Binder | Cement | % * | GP | Fine Aggregate | Coarse Aggregate | SP | Water | w/b Ratio |
|---|---|---|---|---|---|---|---|---|---|
| C300 | 300 | 300.00 | 0% | 0.00 | 511.06 | 1087.66 | 0.00 | 206.38 | 0.65 |
| G150 | 300 | 150.00 | 50% | 124.26 | 580.21 | 1158.51 | 5.53 | 145.32 | 0.50 |
| G200 | 400 | 200.00 | 50% | 165.74 | 466.60 | 1134.68 | 7.23 | 151.70 | 0.40 |
| G250 | 500 | 250.00 | 50% | 207.23 | 371.70 | 1125.11 | 9.15 | 162.77 | 0.35 |
* % substitution of cement by GP.
Table 5.
Tests’ summary.
| Property | Test Standard | Samples’ Geometry (mm) | Unit per Age | Testing Ages (Days) |
|---|---|---|---|---|
| Compressive strength | EN 12390-3 [37] | Cube—100 × 100 × 100 | 3 | 7,14, and 28 |
| Water absorption by immersion | LNEC E394 [38] | Cube—100 × 100 × 100 | 3 | 28 |
| Capillary absorption | LNEC E393 [39] | Cube—100 × 100 × 100 | 3 | 28 |
| Chloride diffusion | LNEC E463 [40] | Cylinder—H200D100 | 2 | 28 |
Disclaimer/Publisher’s Note: The statements, opinions and data contained in all publications are solely those of the individual author(s) and contributor(s) and not of MDPI and/or the editor(s). MDPI and/or the editor(s) disclaim responsibility for any injury to people or property resulting from any ideas, methods, instructions or products referred to in the content. |
© 2024 by the authors. Licensee MDPI, Basel, Switzerland. This article is an open access article distributed under the terms and conditions of the Creative Commons Attribution (CC BY) license (https://creativecommons.org/licenses/by/4.0/).
Share and Cite
MDPI and ACS Style
Moreira, O.; Camões, A.; Malheiro, R.; Jesus, C. High Glass Waste Incorporation towards Sustainable High-Performance Concrete. CivilEng 2024, 5, 41-64. https://doi.org/10.3390/civileng5010003
AMA Style
Moreira O, Camões A, Malheiro R, Jesus C. High Glass Waste Incorporation towards Sustainable High-Performance Concrete. CivilEng. 2024; 5(1):41-64. https://doi.org/10.3390/civileng5010003
Chicago/Turabian StyleMoreira, Othon, Aires Camões, Raphaele Malheiro, and Carlos Jesus. 2024. "High Glass Waste Incorporation towards Sustainable High-Performance Concrete" CivilEng 5, no. 1: 41-64. https://doi.org/10.3390/civileng5010003