
Development of Electric Power Generator by Using Hydrogen †


1
Shizuoka Institute of Science and Technology, Fukuroi 437-0032, Japan
2
Daytona Corporation, Morimachi 437-0226, Japan
*
Author to whom correspondence should be addressed.
†
Presented at the IEEE 5th Eurasia Conference on Biomedical Engineering, Healthcare and Sustainability, Tainan, Taiwan, 2–4 June 2023.
Eng. Proc. 2023, 55(1), 22; https://doi.org/10.3390/engproc2023055022
Published: 29 November 2023
(This article belongs to the Proceedings of 2023 IEEE 5th Eurasia Conference on Biomedical Engineering, Healthcare and Sustainability)
Abstract
:In this research, we developed a hydrogen (H2) electric generator in an H2 generation system based on chemical reactions. In the experiment, we tested the performance of the H2 electric generator and measured the amount of H2 generated. The maximum output was 700 W and the thermal efficiency was 18.2%. The theoretical value and measured value were almost the same, and the maximum error was 4%.
1. Introduction
Recently, the impact of global warming has become serious due to an increase in greenhouse gases emitted from industrial activities [1]. The decarbonization of mobility and power generation systems is considered as a countermeasure. One of the representative technologies is the use of internal combustion engines (ICEs) using H2 as fuel [2]. H2 is attracting much attention as an alternative fuel for automobiles. However, there are few practical examples of electric generators that use H2 as fuel. The purpose of this research was to develop a small H2 electric generator that operates stably with a maximum output of 1 kW by improving the fuel supply part of the conventional gasoline electric generator, and establishing an H2 generation system using chemical reactions. In the previous research [3], a surge tank was introduced to homogenize the mixture of H2 and air. As a result of measuring the maximum output of the electric generator, power was supplied stably at 800 W. In this research, the effect of the shape of the intake manifold on electric generator performance was confirmed. In addition, the H2 generation system using a chemical reaction between an aqueous solution of sodium borohydride (NaBH4aq) and aqueous solution of citric acid (C6H8O7aq) was adopted as an on-site H2 generation method, and theoretical and actual values were compared.
2. Hydrogen Engine Generator Performance Test
2.1. Combustion Characteristics of Hydrogen
The combustion reaction of H2 is shown in Equation (1). H2 combines with oxygen (O2) at a high temperature to produce water and thermal energy. H2 is environmentally friendly because it does not emit carbon dioxide (CO2). However, it also has the disadvantage of producing harmful nitrogen oxides (NOxs) at high temperatures.
2H2 + O2 = 2H2O + 248 kJ/mol
The main combustion characteristics of H2 are early ignition and lean burn. Table 1 shows a comparison of the fuel properties of methane (CH4) and H2 [4]. The minimum ignition energy of H2 is about 1/10 that of CH4, indicating that even a small spark burns it. In addition, the flammability range of H2 is 4 to 75, which indicates lean burn. In terms of flame propagation, H2 has a six times faster speed than CH4. H2 is a material with excellent ignition and combustion properties. It is also susceptible to abnormal combustion such as backfire requiring a preventative measure. The basic experimental conditions are listed in Table 1.
2.2. Experimental Method and Conditions
Figure 1 shows the H2 electric generator test equipment. The electric generator in the experiment adopted a forced air-cooled 4-cycle gasoline overhead valve inverter with a total displacement of 79 cm3, a rated output of 1.9 kW, and a compression ratio of 9.4. In the fuel supply system, a supply port injection was used. The H2 supply port was attached to the bottom of the intake so that it could be mixed with the inflowing air. The surge tank was a box-type one with a capacity of 1670 cm3 to temporarily store air and make the flow rate uniform.
Table 2 shows the experimental conditions. We designed and manufactured three types of intake manifolds to confirm the effect of intake air volume and air–fuel ratio (AFR). Figure 2 shows its appearance. In the experiment, the output was changed from 100 W to 1 kW using a converter. The engine speed was constant at each output, and partial load operation was performed. Then, we measured the intake air volume of H2 at each output to evaluate the performance.
3. Hydrogen Generation
3.1. Principle of Hydrogen Generation
H2 can be produced from various resources, such as the reforming method, which extracts H2 from generated gas by burning fossil fuels, and the electrolysis method, which extracts H2 by splitting water with electricity. H2 is classified into three types, gray H2, green H2, and blue H2, depending on the manufacturing method [5]. Gray and blue H2 are produced using fossil fuels, and green H2 is produced using renewable energy. Considering the global environment, the latter method is considered ideal. H2 is known to be a clean energy that does not emit CO2. However, there are issues with using it as fuel. One of the typical physical properties of hydrogen is its low density per volume. A common solution to these issues is pressurized gas and liquefied storage. These methods are not widely used due to high handling risks and costs.
We proposed an H2 onsite generation system using sodium borohydride (NaBH4) to solve the above problems. Table 3 shows the specifications of the samples and their appearances. NaBH4 is a powdery white solid crystal and is stable at normal temperature and pressure. The mass density of H2 is 10.6 wt.%, which is higher than high-pressure gas and liquified H2. NaBH4 reacts with water to generate H2 which is accelerated under certain temperature or acidic conditions. In this research, as shown in Figure 3, we used this property and adopted a production method by a chemical reaction with NaBH4 using a C6H8O7 [6]. The chemical reaction formula is shown in Equation (2).
3.2. Experimental Method and Conditions
Figure 4 shows the H2 generation system. In this system, NaBH4 and C6H8O7 were pumped up and reacted in a reactor to generate H2. This reaction produces boric acid and sodium citrate in addition to H2. These by-products were diverted in the flow path and sent to the waste tank. The H2 generated is at a high temperature due to the exothermic reaction and contains water vapor that must be removed. The H2 flow quantity was measured using a flow meter. Therefore, the temperature of H2 was lowered by cooling water and measured after being passed through a desiccant.
The concentration of the two aqueous solutions used in the experiment was an important factor, and precipitation and sticking occurred if the concentration was not appropriate. The results of previous research [7] indicated that the NaBH4aq was 33.3 wt.% and the C6H8O7aq was 27.0 wt.%. Also, the input ratio of the aqueous solution was 5:6, and the amount was derived from the following formula. Assuming a molecular weight of 37.83 for NaBH4 and standard conditions (0 °C, 1 atm, and 22.4 L), we calculated the amount of aqueous solution required to generate H2 (25 °C, 1 atm, and 10 L). Equation (2) shows that 4 mol of H2 is generated from 1 mol of NaBH4, and the amount of NaBH4 can be obtained from Equation (3).
From the results of Equation (3), the amount of NaBH4aq with a concentration of 33.3 wt.% is given by Equation (4).
Since the input ratio of NaBH4 and C6H8O7 is 5:6, the amount of C6H8O7 is given by Equation (5).
From the results of Equation (5), the amount of C6H8O7aq with a concentration of 27.0 wt.% is given by Equation (6).
4. Results and Discussion
4.1. Influence of Intake Manifold Shape on Intake Air Volume
Figure 5 shows a comparison of intake air volume. It increased for all types to produce 600 W. When the output reached 700 W, the intake air volume decreased, and the operation became unstable. ICE used in the experiment was naturally aspirated and the air could not be adjusted. Therefore, the required air volume was obtained during high output operation. The condition with the highest value was Type1, and the intake air volume increased by about 15% compared to Type2. As a result, the straight and short intake pipe was more susceptible to the pulsation effect. Therefore, the intake air volume increased.
4.2. Influence of Intake Manifold Shape on AFR
Figure 6 shows a comparison of the AFR that is derived from the H2 flow rate and intake air volume and is expressed in Equation (7).
(: AFR; : air density (kg/m3); : H2 density (kg/m3); : intake air volume (L/min); : H2 flow rate (L/min)).
The theoretical AFR of the H2 ICE was 34:1, so it tended to lean burn overall. As the power increased, the AFR gradually decreased, reaching approximately 70 at 700 W for Type1. The output did not increase as the intake air volume was greatly reduced in the high-output range. Therefore, the actual AFR fell below the theoretical AFR, and the operation became unstable.
4.3. Influence of Intake Manifold Shape on Thermal Efficiency
Figure 7 shows a comparison of thermal efficiency. It is derived from output and H2 consumption and is shown in Equation (8).
(: thermal efficiency (%); W: output (kW); B: H2 consumption (kg/h); H: low heating value (kg/kJ)).
The maximum thermal efficiency was 18.2% under Type3. Comparing the maximum thermal efficiency of each type, the difference was about 2%. Therefore, there was no significant correlation between the shape of the intake manifold and the thermal efficiency.
4.4. Measurement of Hydrogen Generation
The amount of aqueous solution required to generate 10 L/min of H2 was determined as 11.6 g (NaBH4aq) and 17.2 g (C6H8O7aq) (Equations (5) and (6)). Also, it must be mixed in a 5:6 ratio. The amount of aqueous solution varied with the voltage of the pump and had to be adjusted to achieve a 5:6 ratio. We explored the relationship between voltage and input amount prior to the performance of the pump. Table 4 shows the relationship between the aqueous solution and the pump voltage required to generate 10 to 20 L/min of H2.
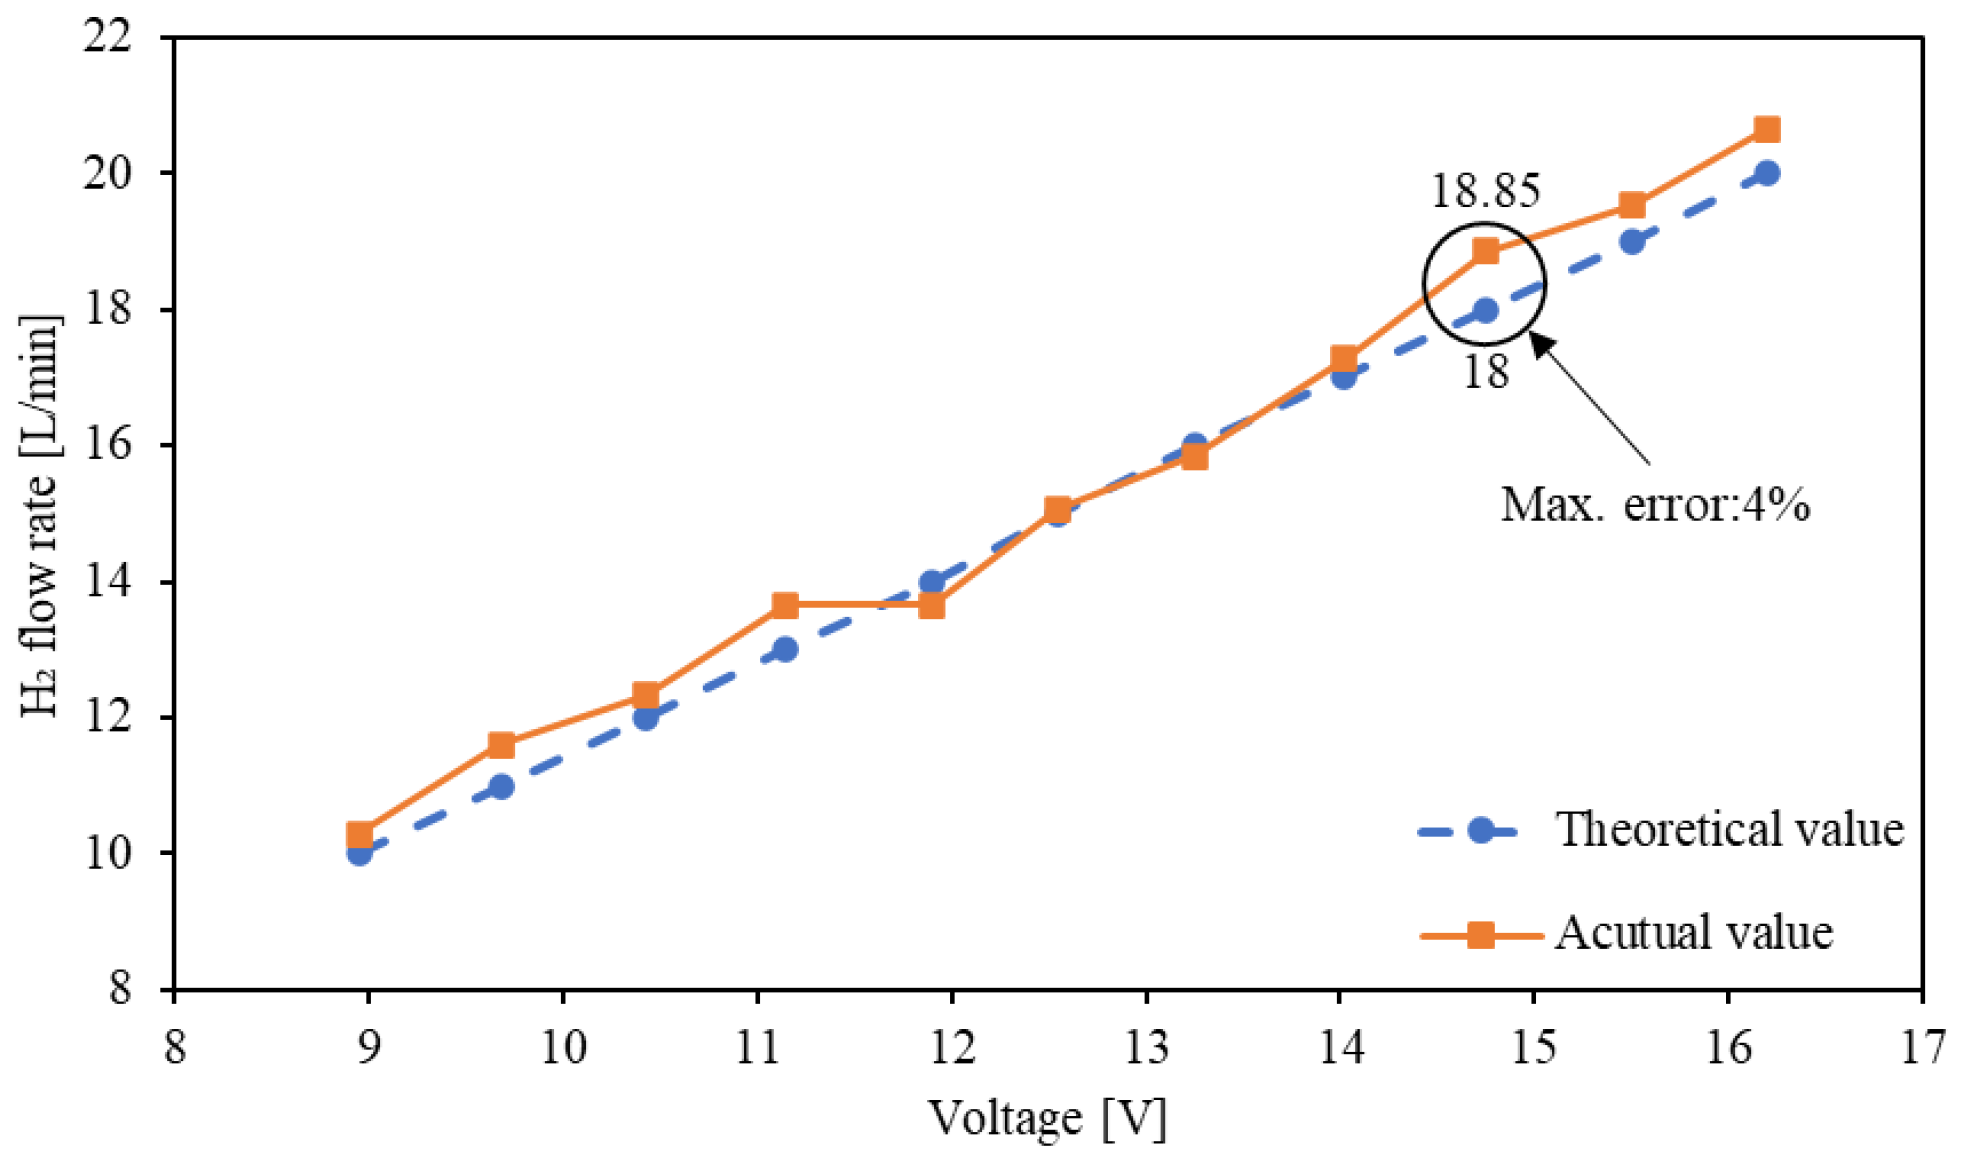
Figure 8 shows a comparison of theoretical and measured values of H2. The theoretical value and measured value were almost the same, and the maximum error was about 4%. This result indicated that on-site power generation by combining an H2 generator and an H2 engine was possible. In the future, we will experiment with the two devices.
5. Conclusions
In this research, the influence of the shape of the intake manifold on performance and the amount of H2 generated were researched. As a result, the following conclusions were obtained. The maximum output of the H2 electric generator was 700 W, which was less than half of the rating. It was found that the intake shape showed little effect on the thermal efficiency, and the maximum value was 18.2% for Type3. Type1 showed the highest intake air volume, improving by 15% compared to Type3. The amount of H2 generated was the almost same as the theoretical value, and the maximum error was 4%.
Author Contributions
Conceptualization, K.F.; methodology, K.A.; Experiment, Y.T.; data curation, Y.T.; writing, Y.T.; writing—review and editing, N.Z. All authors have read and agreed to the published version of the manuscript.
Funding
This research received funding from the funder of Daytona Corporation.
Institutional Review Board Statement
Not applicable.
Informed Consent Statement
Not applicable.
Data Availability Statement
Data are contained within the article.
Acknowledgments
The authors want to thank Chenyu Huang for his kind cooperation.
Conflicts of Interest
The authors declare no conflict of interest. The funding sponsors had no role in the design of the study; in the collection, analyses, or interpretation of data; in the writing of the manuscript, and in the decision to publish the results.
References
- Sixth Assessment Report. Available online: https://www.ipcc.ch/report/ar6/syr/(04302023) (accessed on 1 April 2023).
- Yamane, K. Technology and Future of Reciprocating Hydrogen Internal Combustion Engine. Hydrog. Energy Syst. 2006, 31, 15–19. [Google Scholar]
- Fang, J.S. Development of Small Hydrogen Engine Generator. Master’s Thesis, Shizuoka Institute of Science and Technology, Fukuroi, Japan, 15 February 2022. [Google Scholar]
- Sato, Y. Safety Engineering. J. Inst. Electr. Install. Eng. Jpn. 2005, 44, 1–30. [Google Scholar]
- How to Make Hydrogen. Available online: https://www.enecho.meti.go.jp/about/special/johoteikyo/suiso_tukurikata.html(05052023) (accessed on 1 April 2023).
- Hoshi, N. Verification of Sodium Borohydride as Fuel for Fuel Cell Vehicles. Trans. Inst. Electr. Eng. Jpn. D 2011, 132, 30–40. [Google Scholar]
- Ishizuka, K. Research on Small Reactor for Emergency Hydrogen Generator Using Sodium Borohydride and Citric Acid. Graduation Thesis of Master Course, Tokyo University of Science, Tokyo, Japan, 15 February 2022. [Google Scholar]
Figure 1.
H2 electric generator test equipment. ① H2 cylinder; ② H2 flowmeter; ③ backfire prevention valve; ④ regulator; ⑤ air flowmeter; ⑥ surge tank; ⑦ electric generator; ⑧ intake manifold; ⑨ converter; ⑩ light bulb.
Figure 1.
H2 electric generator test equipment. ① H2 cylinder; ② H2 flowmeter; ③ backfire prevention valve; ④ regulator; ⑤ air flowmeter; ⑥ surge tank; ⑦ electric generator; ⑧ intake manifold; ⑨ converter; ⑩ light bulb.
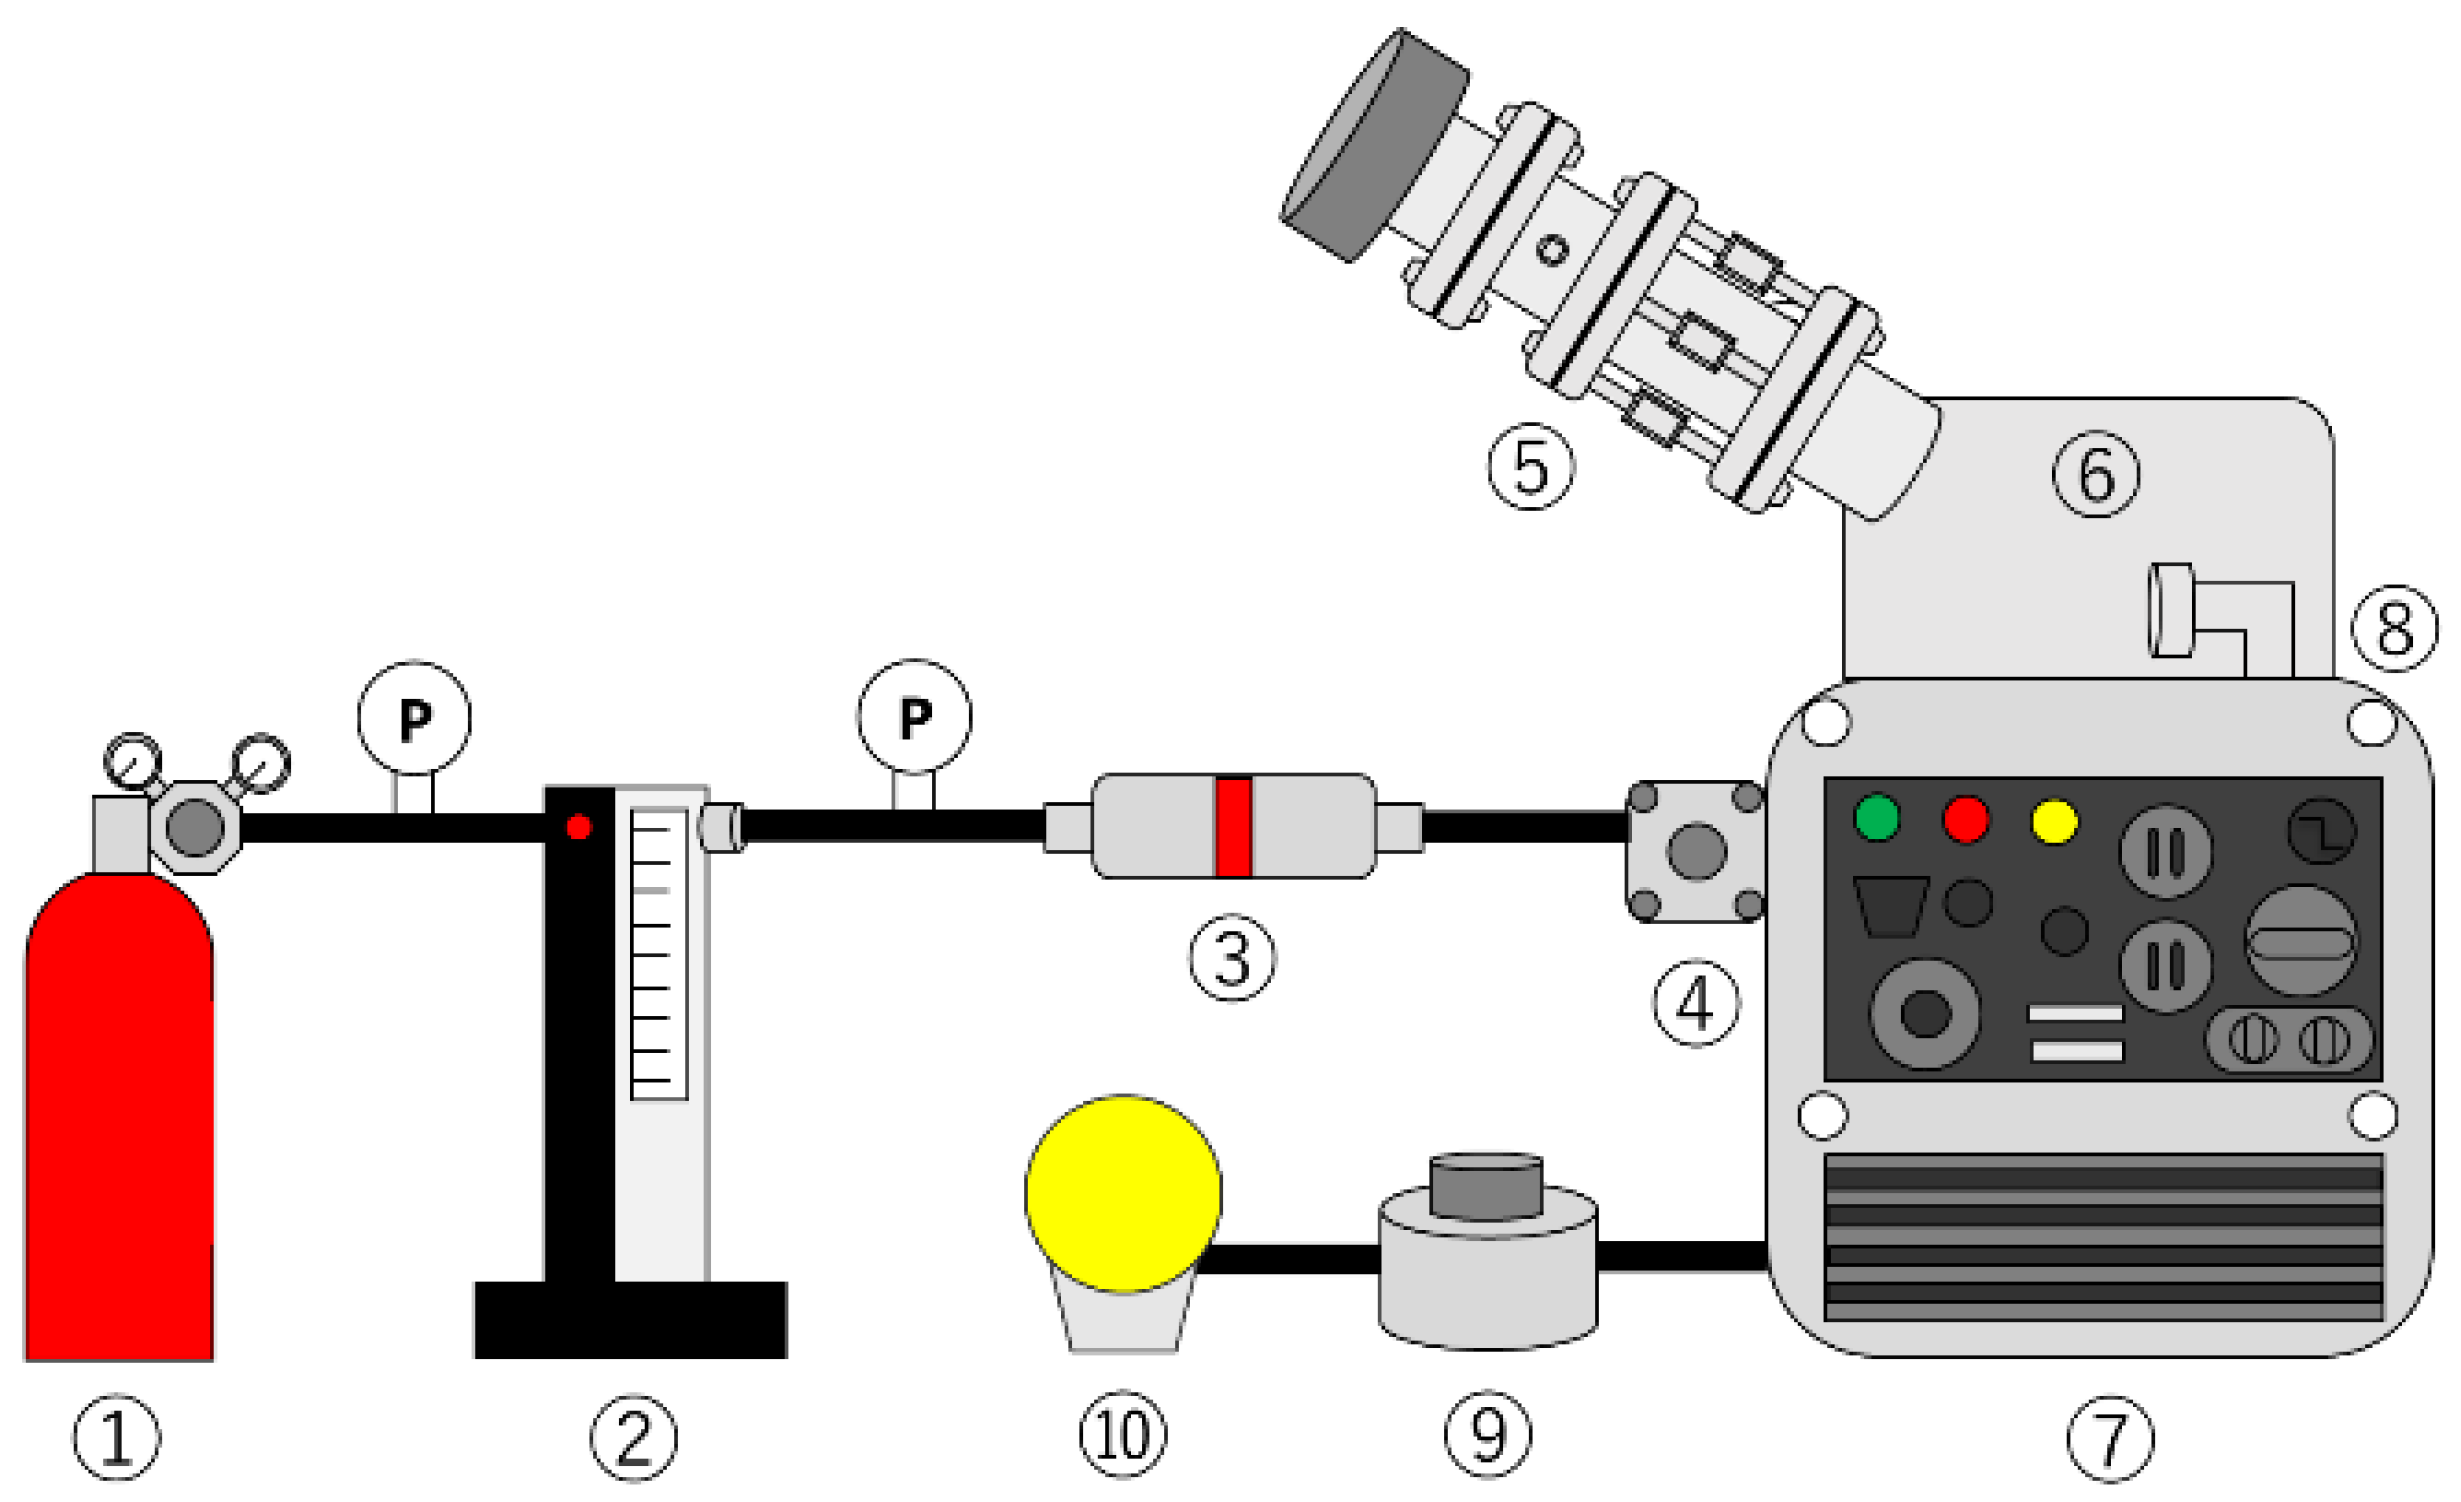
Figure 2.
Appearance of intake manifolds.
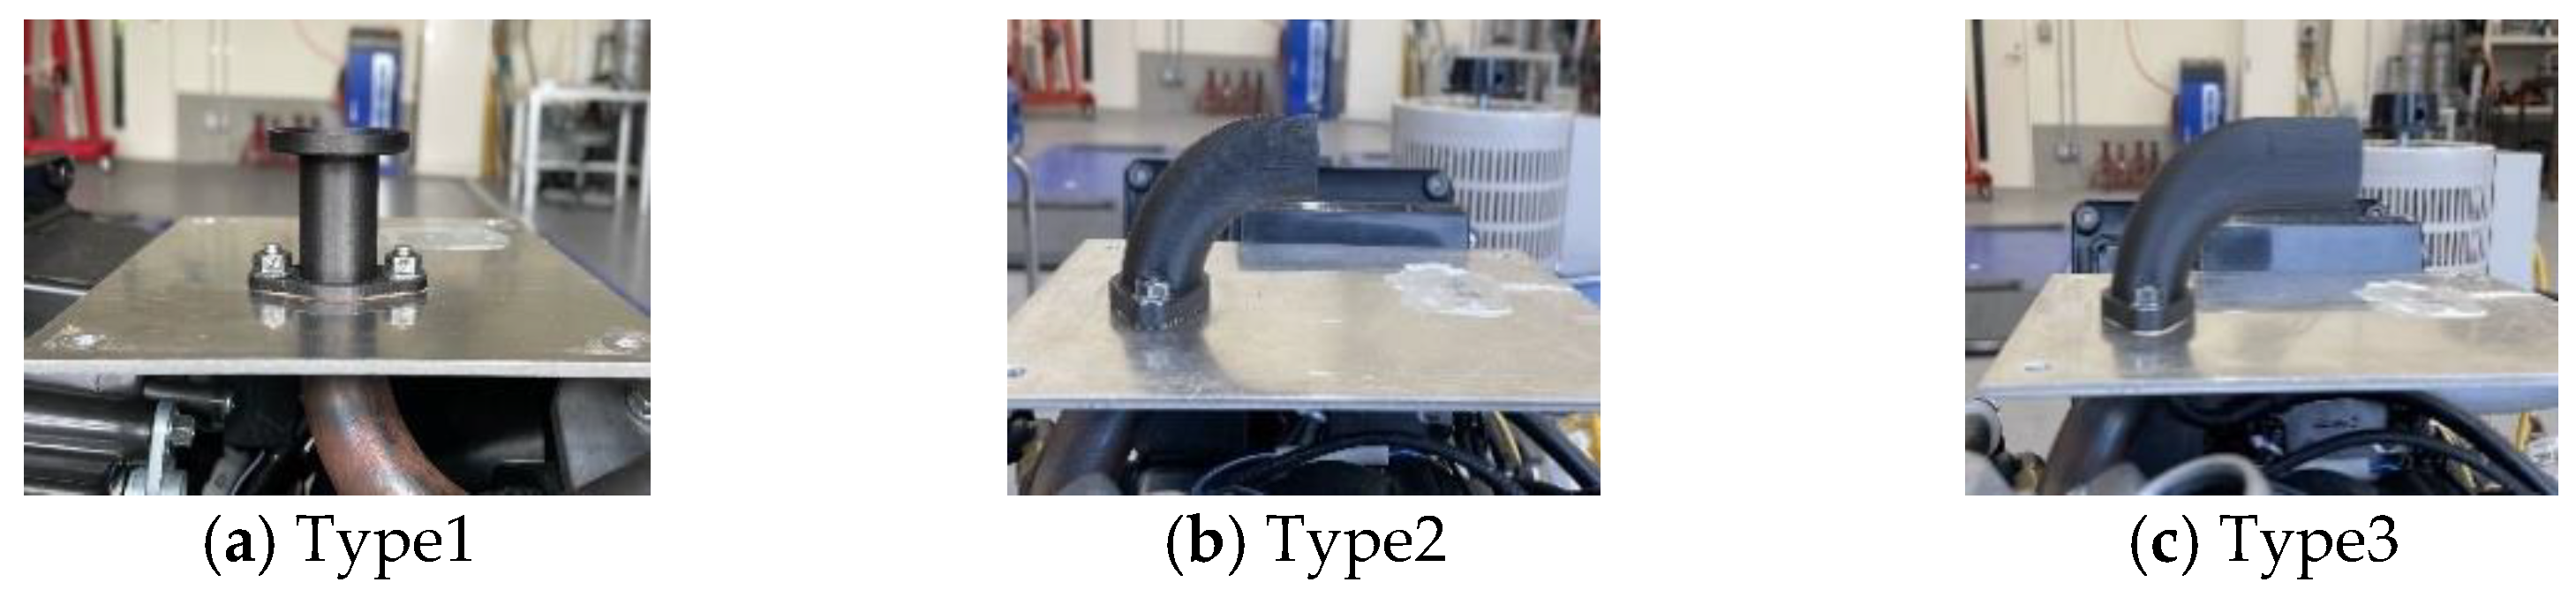
Figure 3.
Appearance of samples.
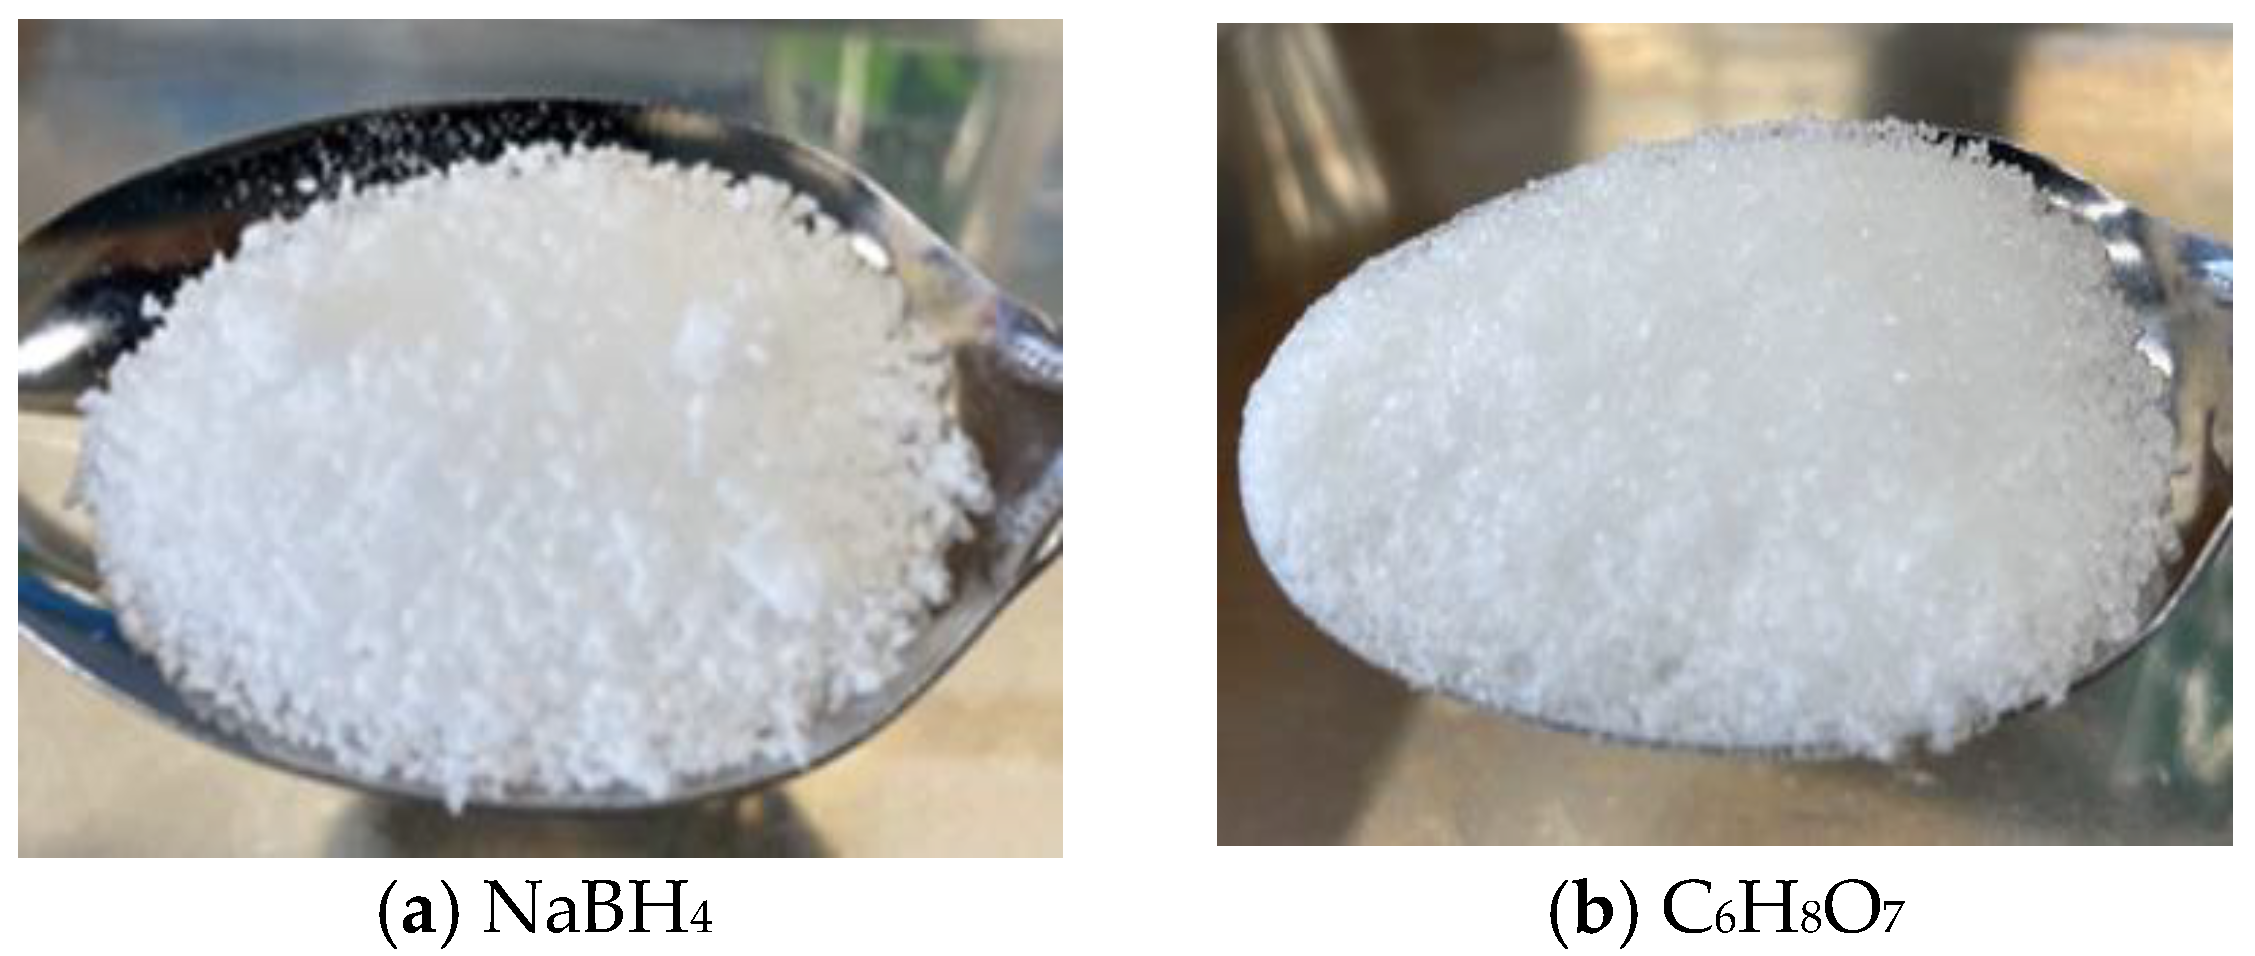
Figure 4.
H2 generation system. ① Power supply unit; ② pump; ③ C6H8O7aq; ④ NaBH4aq; ⑤ reactor; ⑥ waste tank; ⑦ cooling water; ⑧ separator; ⑨ desiccant; ⑩ flowmeter.
Figure 4.
H2 generation system. ① Power supply unit; ② pump; ③ C6H8O7aq; ④ NaBH4aq; ⑤ reactor; ⑥ waste tank; ⑦ cooling water; ⑧ separator; ⑨ desiccant; ⑩ flowmeter.
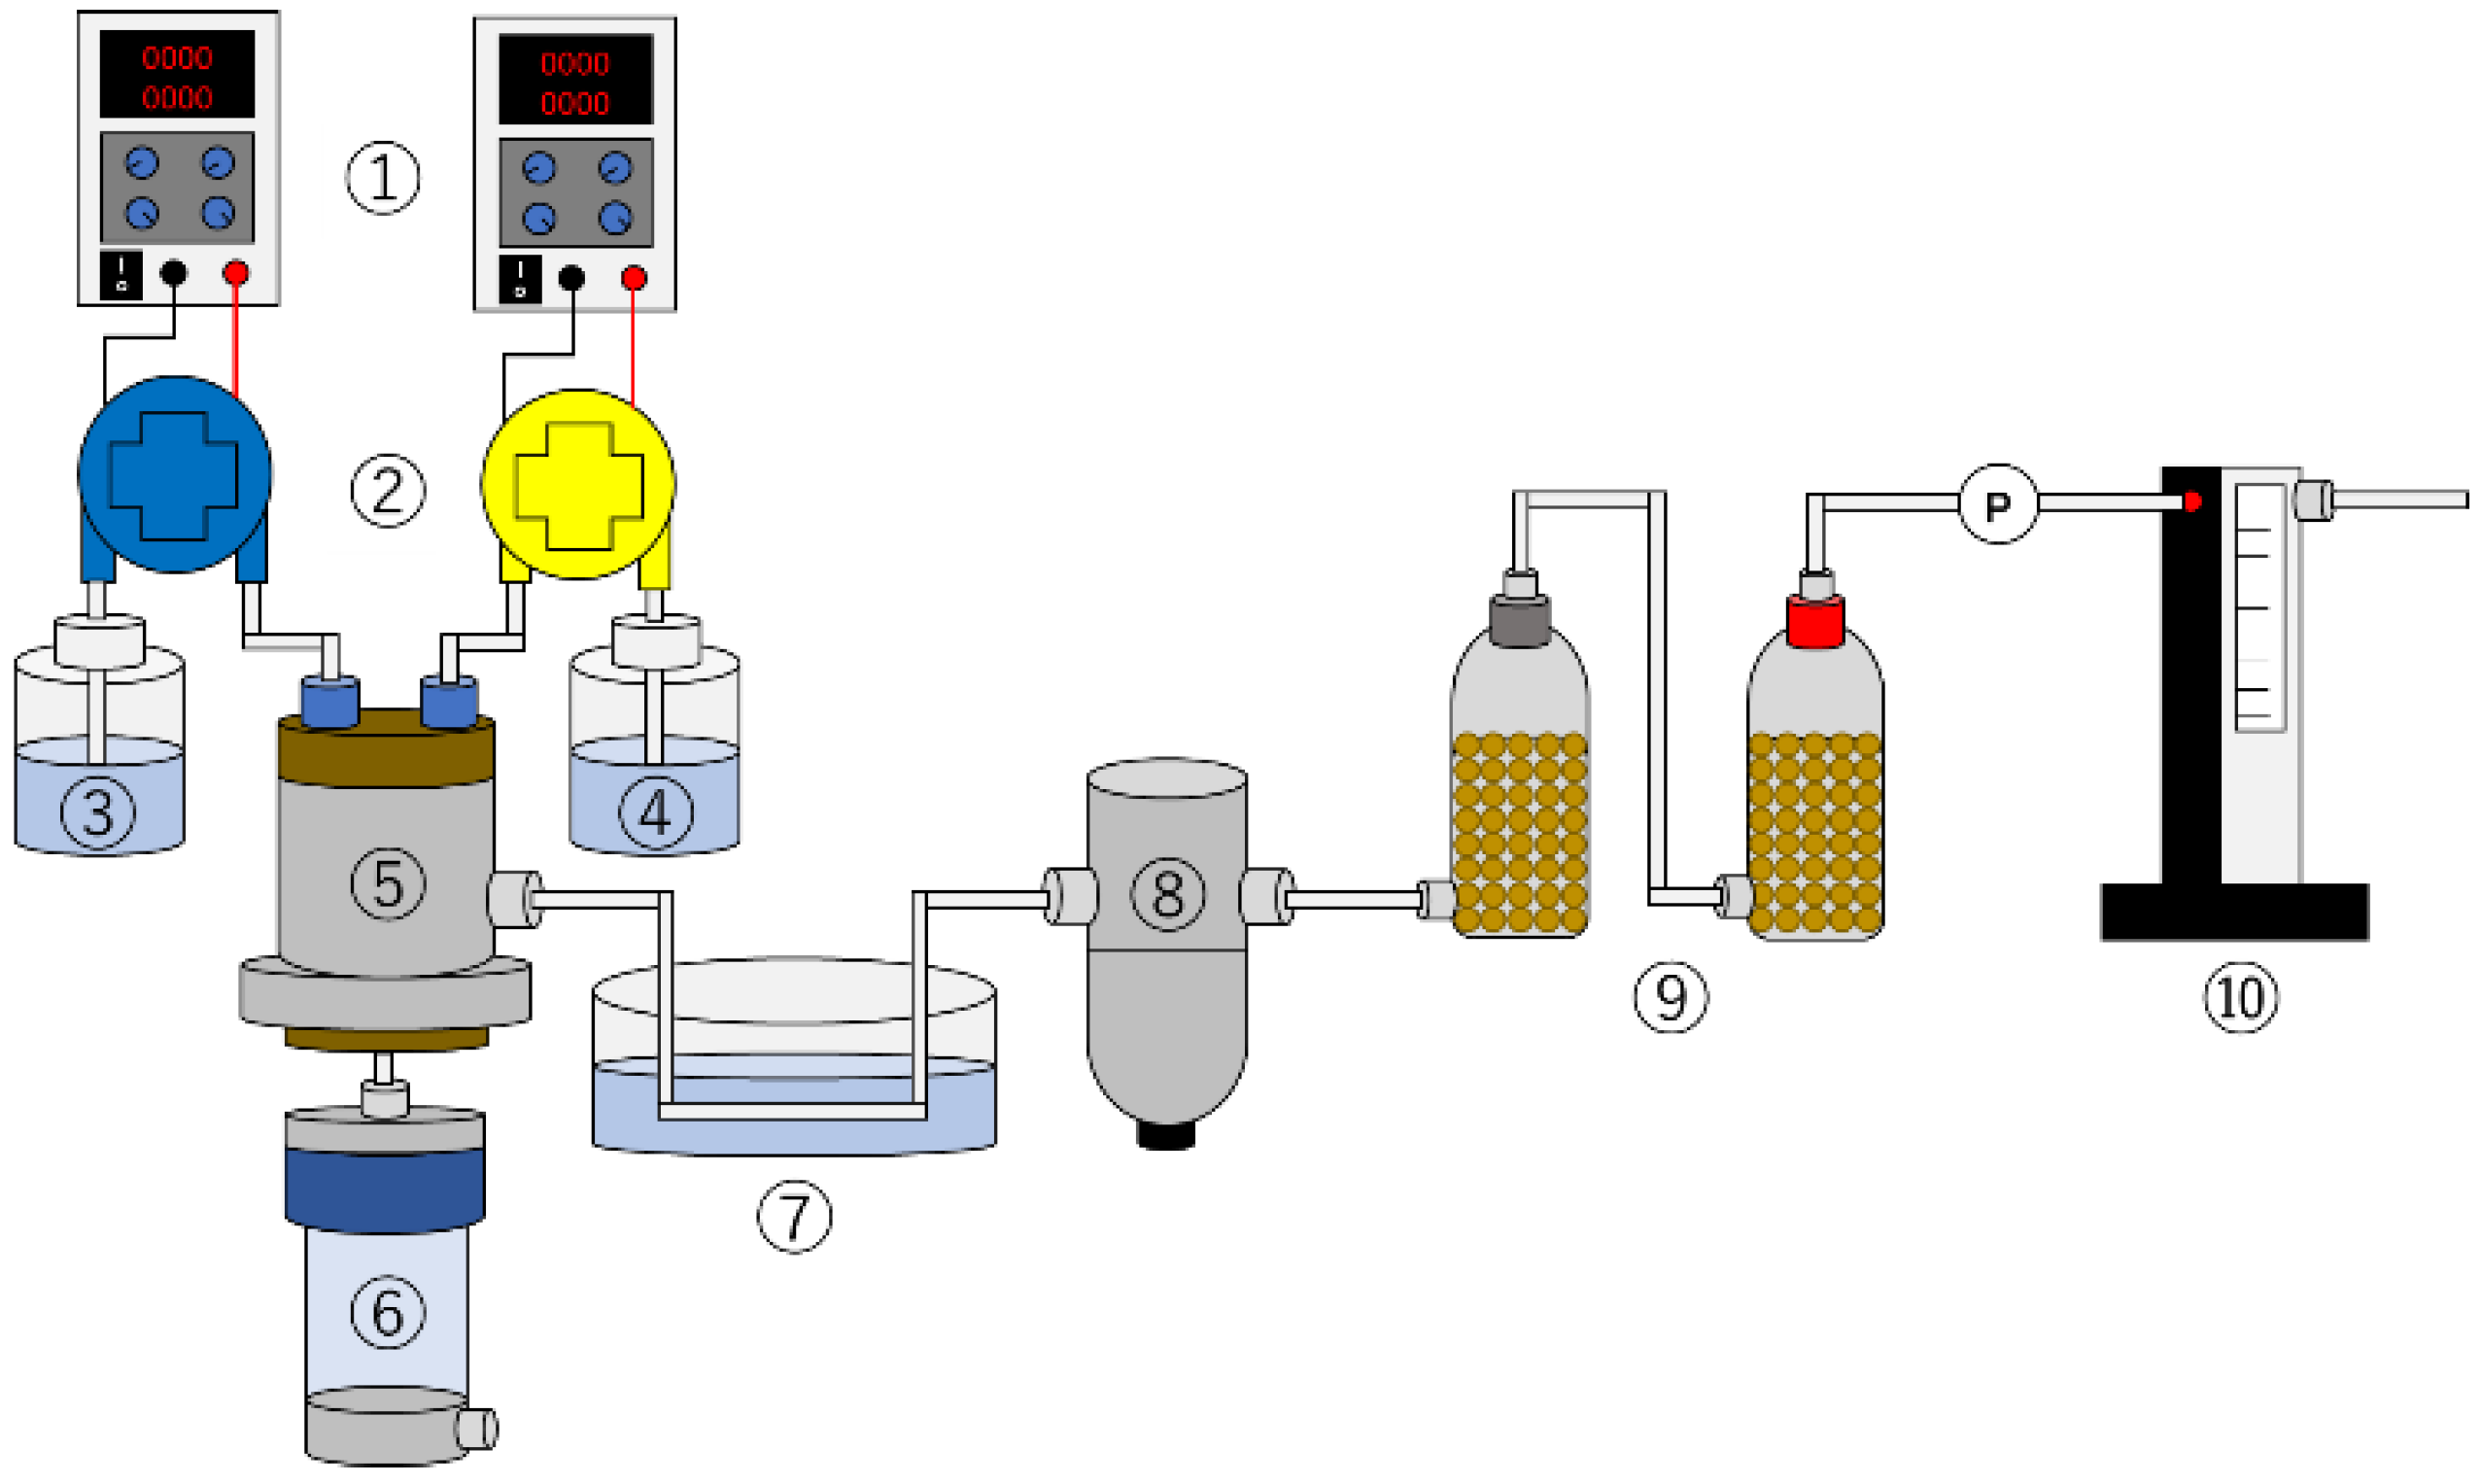
Figure 5.
Comparison of intake air volume.
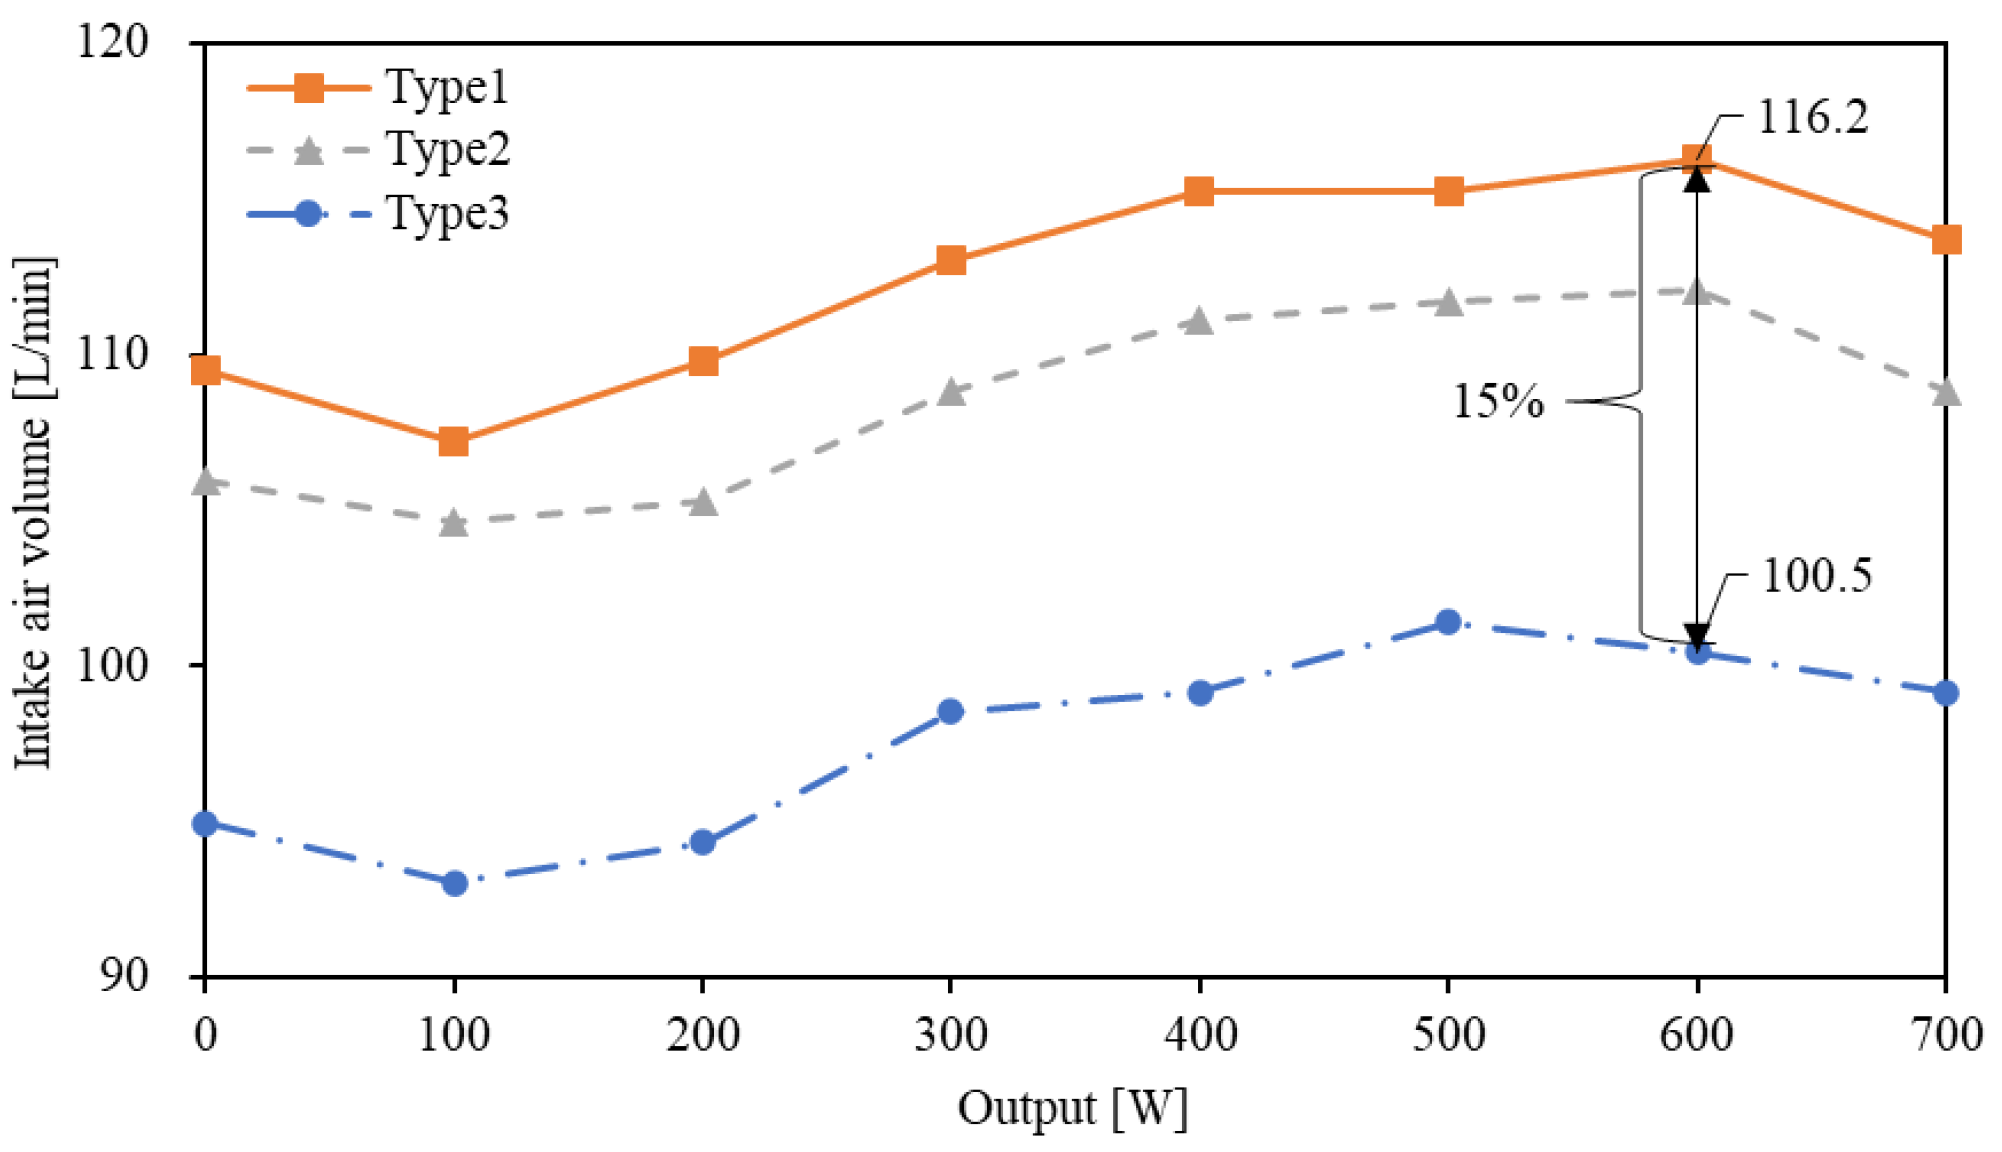
Figure 6.
Comparison of AFR.
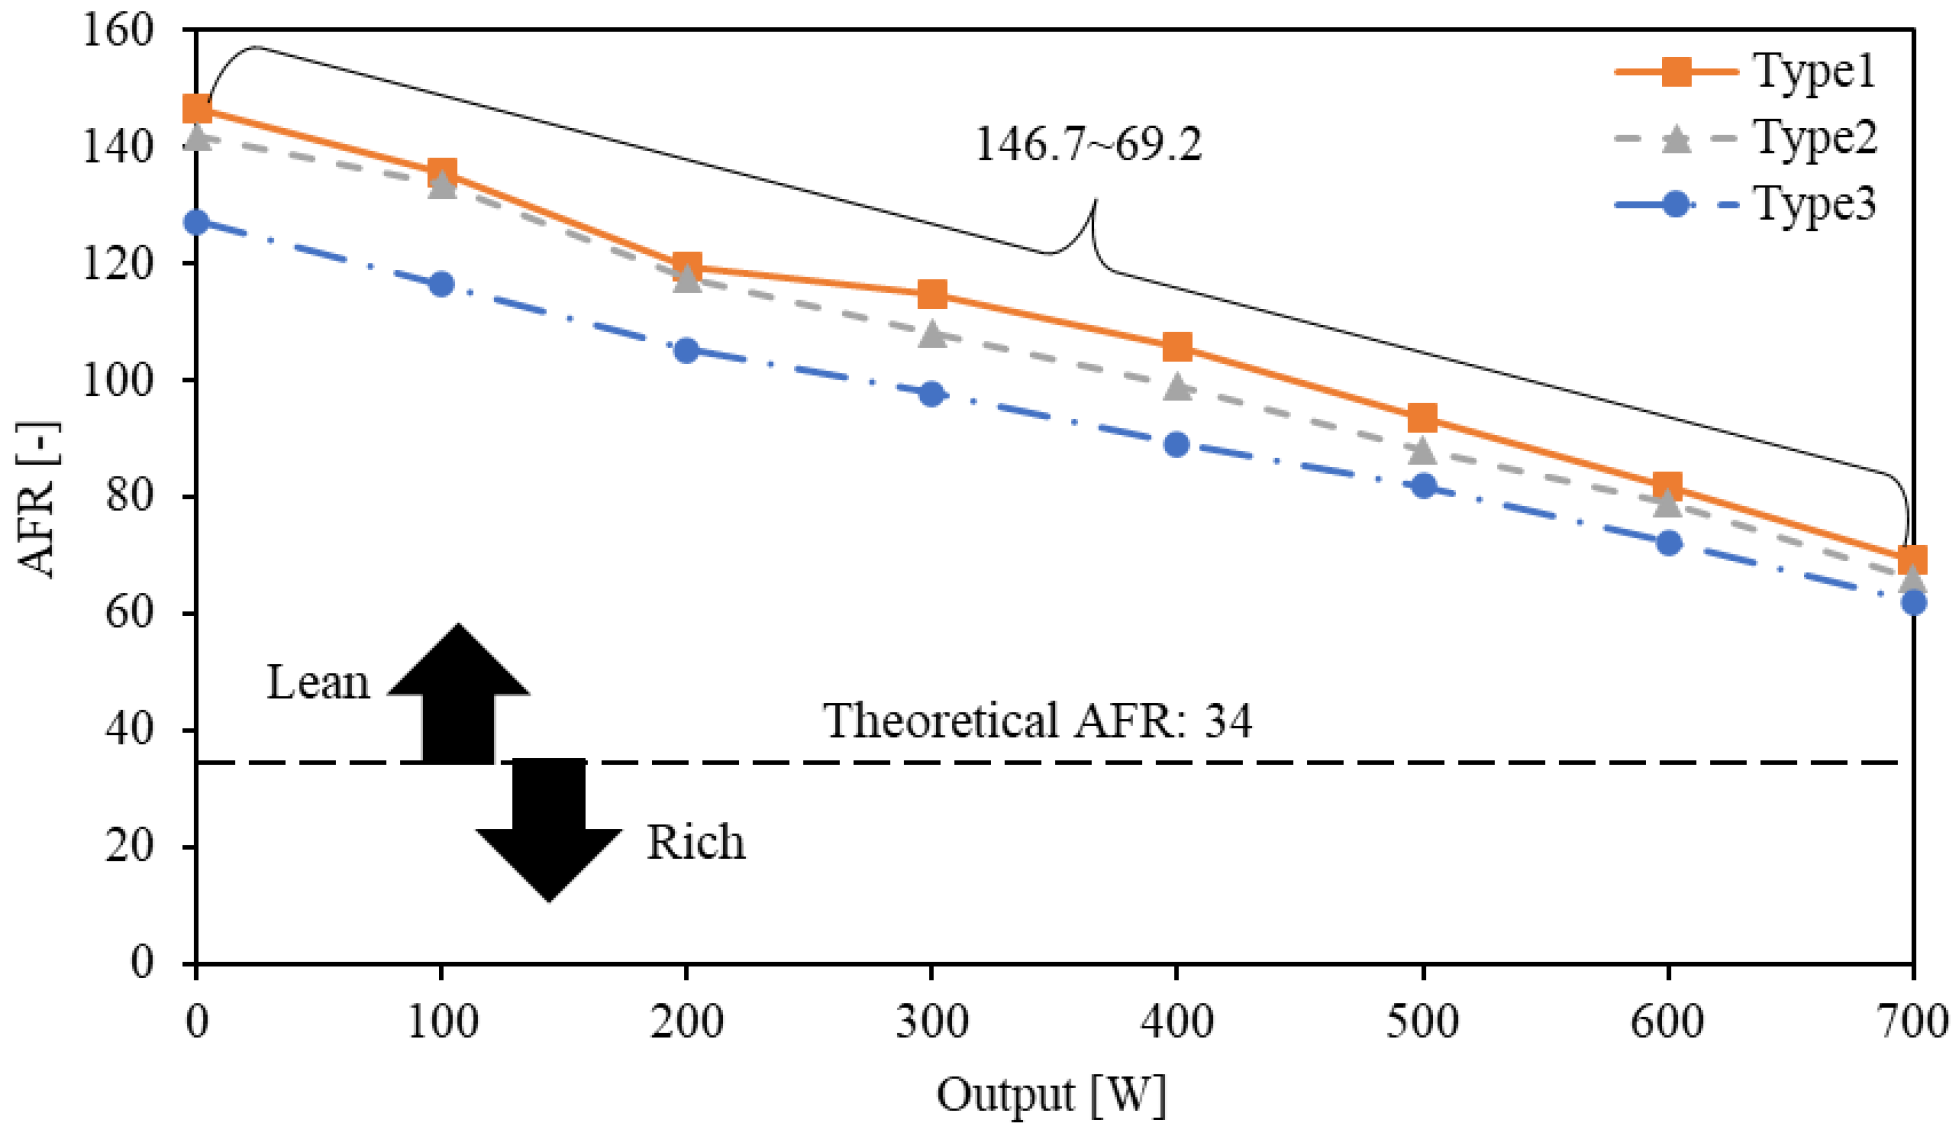
Figure 7.
Comparison of thermal efficiency.

Figure 8.
Comparison of theoretical and actual value.

Table 1.
Fuel properties of CH4 and H2 [4].
Table 1.
Fuel properties of CH4 and H2 [4].
| CH4 | H2 | |
| Molecular weight (g/mol) | 16 | 2 |
| Density (kg/m3) | 0.651 | 0.084 |
| Diffusion coefficient (m2/s) | 2.1 × 10⁻⁵ | 6.7 × 10⁻⁵ |
| Thermal conductivity (W/m·K) | 0.03 | 0.17 |
| Minimum ignition energy (mJ) | 0.28 | 0.02 |
| Flammable range (Vol.%) | 5~15 | 4~75 |
| Flame propagation speed (m/s) | 0.4 | 2.7 |
Table 2.
Dimensions of intake manifolds.
| Dimension | Type1 | Type2 | Type3 |
|---|---|---|---|
| Inner diameter (mm) | 21 | 23 | 23 |
| Outer diameter (mm) | 23 | 25 | 25 |
| Length (upper part) (mm) | 33 | 66 | 82 |
| Length (lower part) (mm) | 95 | 95 | 95 |
Table 3.
Specifications of samples.
| Chemical Formula | NaBH4 | C6H8O7 |
|---|---|---|
| Shape | White solid crystal | White solid crystal |
| Molecular weight | 37.83 | 192.12 |
| Density (g/cm3) | 1.074 | 1.665 |
| Melting point (deg.) | 400 | 153 |
| Boiling point (deg.) | 500 | 175 |
| Solubility (g) | 55/H2O 100 (25 °C) | 73/H2O 100 (20 °C) |
Table 4.
Relationship of aqueous solution and pump voltage.
| H2 Flow | Voltage (NaBH4) | NaBH4 | Voltage (C6H8O7) | C6H8O7 |
|---|---|---|---|---|
| L/min | V | L/min | V | L/min |
| 10 | 8.05 | 0.0116 | 8.95 | 0.0172 |
| 11 | 8.65 | 0.0128 | 9.68 | 0.0189 |
| 12 | 9.25 | 0.0139 | 10.42 | 0.0206 |
| 13 | 9.90 | 0.0151 | 11.15 | 0.0224 |
| 14 | 10.50 | 0.0162 | 11.90 | 0.0241 |
| 15 | 11.10 | 0.0174 | 12.55 | 0.0258 |
| 16 | 11.70 | 0.0186 | 13.25 | 0.0275 |
| 17 | 12.30 | 0.0197 | 14.02 | 0.0292 |
| 18 | 12.85 | 0.0209 | 14.75 | 0.0310 |
| 19 | 13.60 | 0.0220 | 15.50 | 0.0327 |
| 20 | 13.99 | 0.0232 | 16.20 | 0.0344 |
Disclaimer/Publisher’s Note: The statements, opinions and data contained in all publications are solely those of the individual author(s) and contributor(s) and not of MDPI and/or the editor(s). MDPI and/or the editor(s) disclaim responsibility for any injury to people or property resulting from any ideas, methods, instructions or products referred to in the content. |
© 2023 by the authors. Licensee MDPI, Basel, Switzerland. This article is an open access article distributed under the terms and conditions of the Creative Commons Attribution (CC BY) license (https://creativecommons.org/licenses/by/4.0/).
Share and Cite
MDPI and ACS Style
Zhu, N.; Takeuchi, Y.; Amano, K.; Fukuda, K. Development of Electric Power Generator by Using Hydrogen. Eng. Proc. 2023, 55, 22. https://doi.org/10.3390/engproc2023055022
AMA Style
Zhu N, Takeuchi Y, Amano K, Fukuda K. Development of Electric Power Generator by Using Hydrogen. Engineering Proceedings. 2023; 55(1):22. https://doi.org/10.3390/engproc2023055022
Chicago/Turabian StyleZhu, Ning, Yuta Takeuchi, Katsuhiro Amano, and Kazuhito Fukuda. 2023. "Development of Electric Power Generator by Using Hydrogen" Engineering Proceedings 55, no. 1: 22. https://doi.org/10.3390/engproc2023055022