
A Compartment Pharmacokinetics Model of THC and Its Metabolites after Smoking †

Department of Mathematics, Faculty of Science, King Mongkut’s University of Technology Thonburi, Bangkok 10140, Thailand
*
Author to whom correspondence should be addressed.
†
Presented at the IEEE 5th Eurasia Conference on Biomedical Engineering, Healthcare and Sustainability, Tainan, Taiwan, 2–4 June 2023.
Eng. Proc. 2023, 55(1), 4; https://doi.org/10.3390/engproc2023055004
Published: 22 November 2023
(This article belongs to the Proceedings of 2023 IEEE 5th Eurasia Conference on Biomedical Engineering, Healthcare and Sustainability)
Abstract
:This article presents the application of the compartment model to investigate the pharmacokinetics of delta9-tetrahydrocannabinol (THC), one of the cannabinoids found in cannabis, after smoking cannabis. The behavior of THC and its metabolite concentrations in the body following smoking were investigated, and the result offered a guideline for determining the appropriate duration between each smoking session to prevent intoxication and potential harm to the body. The compartment model was transformed into ordinary differential equations (ODEs) to describe the rate of change in the concentration of THC and its metabolites in each compartment, employing the law of mass action. For simulating the solution curve, the exact solutions of the ODE system and an actual data sample were processed using Microsoft Excel to obtain the optimal rate constants using curve fitting and generating a simulated curve that closely matched the actual data. The findings in this study indicated that the proposed model effectively described the concentration behavior of THC and its metabolites in plasma and other tissues. Therefore, the model will serve as a valuable tool for the determination of the appropriate duration between each smoking session to prevent harm to the body.
1. Introduction
Currently, many countries around the world have legalized or adopted a liberal approach to the use of cannabis for medical, consumption, cosmetic, and recreational purposes. Cannabis consists of approximately 500 chemical components, with at least 100 of them being unique to the cannabis plant and known as “cannabinoids” [1]. Among these cannabinoids, delta9-tetrahydrocannabinol (THC) is the most well-known, possessing psychoactive properties and the potential to become addictive. Nevertheless, THC exhibits several clinically beneficial pharmacological effects, such as for chronic pain, nausea, vomiting, and stimulating appetite [1]. Due to its psychoactive and addictive nature, inappropriate doses and durations of THC consumption, particularly through smoking without medical supervision, can lead to psychoactive effects and harm the body. Therefore, studying the pharmacokinetics of THC allows for a greater understanding of the behavior of THC and its metabolites in the body and a determination of the appropriate dosage and duration for each administration of THC.
Pharmacokinetics, which encompasses the processes of drug absorption, metabolism, distribution, and excretion [2], plays a crucial role in understanding drug behavior and establishing the relationship between drug absorption, distribution, and elimination rates within the body. It assists in developing appropriate therapeutic responses. Many different pharmacokinetics study approaches have been used so far. Compartmental modeling has been frequently employed in pharmacokinetics research since 1932 [3]. A compartment model serves as a mathematical representation of either the entire body or a specific portion, dividing it into compartments, and is useful for investigating the kinetics of physiological or pharmacological processes [4]. This modeling technique aids in comprehending the underlying biological processes that dictate the kinetic behavior of drugs or chemicals administered to the body.
In pharmacokinetics, THC rapidly enters the lungs and subsequently enters the bloodstream or systemic circulation, from where it is distributed to various tissues, including the effect site [1]. Additionally, THC undergoes metabolism in the liver by enzymes, resulting in the formation of two major metabolites, namely THC-OH and THCCOOH. THC-OH is the primary active metabolite, while THC-COOH is the secondary inactive metabolite. THC is predominantly eliminated from the body through metabolic processes, with THC and its metabolites being excreted in the feces and urine as well. There are few current studies on the pharmacokinetics of THC using the compartment model because medical cannabis is still in its early stages of research in various fields [5,6].
In this study, we examined the pharmacokinetics of THC and its metabolites after smoking, using the compartment model. The objectives of this research are to investigate the concentration–time relationship and to provide a guideline for determining the optimal dosage and duration of each smoking session. The result is expected to help mitigate intoxication and potential harm to the body. The proposed compartment model was accurate and found to be a valuable tool for understanding the pharmacokinetics of THC and its metabolites after smoking it. Moreover, a guideline to determine the optimal quantity and duration of each smoking session can be used to minimize potential harm to the body.
2. Methods
2.1. Compartmental Model
We constructed a compartment model to describe the pharmacokinetics of THC and its metabolites after smoking. The model was created in three phases: the pharmacokinetics of THC, THC-OH, and THCCOOH.
For the pharmacokinetics of THC and THC-OH, we divided the body into three physiologically significant compartments. The first compartment was the central compartment, representing plasma or systemic circulation. The second compartment was a rapidly equilibrating tissue compartment, including organs such as the heart, liver, lungs, and kidneys. The third compartment was a slowly equilibrating tissue compartment, encompassing tissues like muscle and bone. Additionally, we defined effective compartments for THC and THC-OH to describe their concentrations in target sites. As for the inactive metabolite THCCOOH, we considered and included only the central compartment. This compartmental model is illustrated in Figure 1.
Using the compartment model in Figure 1, we investigated the case in which the redistribution rates of THC and THC-OH from the rapidly equilibrating tissue compartment and slowly equilibrating tissue compartment to the central compartment were equal or and By applying the law of mass action, we derived the following ordinary differential equations (ODEs).
where is the initial concentration of THC.
2.2. Data
We determined the concentration of THC and its metabolites, THC-OH and THCCOOH, in the plasma after smoking cigarettes containing 150 µg THC/kg body weight in 10 male volunteers [7]. These concentrations were quantified by using a gas chromatography/mass spectrometer (GC/MS), and the results are presented in Table 1.
3. Results
The exact solutions of the system (Equations (1)–(5)) demonstrated the simulation results of the concentration–time relationship of THC and its metabolites after smoking cigarettes that contain 150 µg THC/kg body weight.
3.1. Exact Solutions
From Equations (1)–(5), we obtained the exact solutions as follows.
3.2. Simulation Results
3.2.1. THC Concentration
For the simulation results of the THC concentration in plasma after smoking cigarettes containing 150 µg THC/kg body weight, we used the solution of Equation (6) and the optimal parameters of the rate constants shown in Table 2, which were obtained by curve fitting the exact solution and the actual data of the THC concentration. Consequently, the simulation results are displayed in Table 3.
3.2.2. THC-OH and THCCOOH Concentration
For the simulation results of the THC-OH and THCCOOH concentrations in plasma after smoking cigarettes containing 150 µg THC/kg body weight, we used Equations (10) and (13), respectively, along with the optimal parameters of rate constants shown in Table 4. These parameters were obtained through curve fitting the exact solutions and the actual data of the THC-OH and THCCOOH concentrations. The simulation results are presented in Table 5.
4. Discussion and Conclusions
In this study, we created a compartment model for investigating the pharmacokinetics of THC and its metabolites after smoking. The compartment model transformed ordinary differential equations (ODEs) using the law of mass action (Equations (1)–(5)) to describe the change in the rate constants of THC and its metabolites’ concentration in each compartment. We obtained the solutions for the system as shown in Equations (6)–(14).
To find the simulation results, the exact solutions and a sample of actual data on the concentration of THC and its metabolites were processed using Microsoft Excel. The rate constants were fitted by curve fitting to closely match the actual data, and a simulation graph was drawn. First, we considered the THC concentration in plasma after smoking cigarettes that contained 150 µg THC/kg body weight. Using Equation (6) with the optimal rate constants (Table 2), a rapid decrease in the THC concentration in the plasma from the initial concentration of 85.08 ng/mL during the 0–180-min interval could be explained. The concentration gradually decreased during the 180–300-min interval, as depicted in Figure 2. When comparing the simulated model with the actual data, an error was identified between the two with a root mean squared error (RMSE) of 1.8434 and an R-squared value of 0.9962. In addition, we applied the obtained optimal rate constants (Table 2) to examine the concentration of THC in other compartments, namely, , and The simulation results are displayed in Figure 3.
We simulated the concentration of two metabolites of THC, namely THC-OH and THCCOOH, in plasma after smoking 150 µg of THC using Equation (10) for the THC-OH concentration and Equation (13) for the THCCOOH concentration with the optimal rate constants (Table 4). We observed a steady increase in the THC-OH concentration during the 0–30 min interval, reaching a maximum concentration of 16.77 ng/mL at 30 min. Subsequently, the concentration gradually decreased during the 30–300 min interval, as shown in Figure 4. When comparing the simulation results with the actual data, we found an error between the model simulation and the actual data, with an RMSE of 2.7022 and an R-squared value of 0.8295. For the THCCOOH concentration in plasma, we observed a rapid increase during the 0–30 min interval, with a maximum concentration of 28.56 ng/mL at 30 min. Afterwards, the concentration gradually decreased during the 30–300 min interval. Comparing the simulation results with the actual data, we found an error between the model simulation and the actual data, with an RMSE of 6.1314 and an R-squared value of 0.6062. Moreover, we applied the obtained optimal rate constants (Table 4) to examine the concentration of THC-OH in other compartments, namely, , and The simulation results are displayed in Figure 5.
The proposed compartment model accurately captured the pharmacokinetics of THC and its metabolites in plasma after smoking, matching the actual data. In addition, it predicted the pharmacokinetics of THC and its metabolites in other tissues. Therefore, the model was a useful tool in determining the optimal dosage and timing for each smoking session of THC-containing products, avoiding intoxication, and reducing potential harm. In this study, we used an initial dosage of 150 µg THC/kg body weight. The result of this study suggested that smokers should wait for a minimum of 300 min between smoking sessions to prevent the excessive accumulation of THC and its metabolite in plasma and other tissues.
Author Contributions
Conceptualization, T.M. and T.S.; methodology, T.M. and T.S.; software, T.M.; validation, T.M. and T.S.; formal analysis, T.M. and T.S.; investigation, T.M. and T.S.; resources, T.M.; data curation, T.M. and T.S.; writing—original draft preparation, T.M.; writing—review and editing, T.M. and T.S.; supervision; T.S. All authors have read and agreed to the published version of the manuscript.
Funding
This research received no external funding.
Institutional Review Board Statement
Not applicable.
Informed Consent Statement
Not applicable.
Data Availability Statement
Data is contained within the proceeding paper.
Acknowledgments
The authors would like to sincerely thank the Science Achievement Scholarship of Thailand and the Department of Mathematics, Faculty of Science, King Mongkut’s University of Technology Thonburi for their support.
Conflicts of Interest
The authors declare no conflict of interest.
References
- Martin, W.A. Primer to Medicinal Cannabis: An Introductory Text to the Therapeutic Use of Cannabis; Bedrocan International: Veendam, The Netherlands, 2018; pp. 1–57. [Google Scholar]
- William, J.S.; William, E.W.; Joseph, T.D.; Robert, A.B.; Jane, M.P. Introduction to Pharmacokinetics and Pharmacodynamics. In Concepts in Clinical Pharmacokinetics, 6th ed.; American Society of Health-System Pharmacists: Bethesda, MD, USA, 2014; p. 2. [Google Scholar]
- Widmark, E.M.P. Principles and Applications of Medico Legal Alcohol Determination; Biomedical Publications in English; Biomedical Publications: Seal Beach, CA, USA, 1981. [Google Scholar]
- Khanday, M.A.; Rafiq, A.; Nazir, K. Mathematical models for drug diffusion through the compartments of blood and tissue medium. Alex. J. Med. 2017, 53, 245–249. [Google Scholar] [CrossRef]
- Rakesh, A. Application of Modeling-Based Approaches to Study the Pharmacokinetics and Pharmacodynamics of Delta-9-Tetrahydrocannabinol (THC) and Its Active Metabolite; The University of Iowa: Iowa City, IA, USA, 2017. [Google Scholar]
- Sempio, C.; Huestis, M.A.; Mikulich-Gilbertson, S.K.; Klawitter, J.; Christians, U.; Henthorn, T.K. Population pharmacokinetic modeling of plasma Delta9-tetrahydrocannabinol and an active and inactive metabolite following controlled smoked cannabis administration. Br. J. Clin. Pharmacol. 2020, 86, 611–619. [Google Scholar] [CrossRef] [PubMed]
- McBurney, L.J.; Bobbie, B.A.; Sepp, L.A. GC/MS and EMIT Analyses for Delta9-Tetrahydrocannabinol Metabolites in Plasma and Urine of Human Subjects. J. Anal. Toxicol. 1986, 10, 56–64. [Google Scholar] [CrossRef] [PubMed]
Figure 1.
A compartment pharmacokinetics model of THC and its metabolites after smoking cannabis. : concentration of THC in the central compartment. : concentration of THC in the rapidly equilibrating tissue compartment. : concentration of THC in the slowly equilibrating tissue compartment. : concentration of THC in the effect compartment. : concentration of THC-OH in the central compartment. : concentration of THC-OH in the rapidly equilibrating tissue compartment. : concentration of THC-OH in the slowly equilibrating tissue compartment. : concentration of THC-OH in the effect compartment. : concentration of THCCOOH in the central compartment. , and : distribution rate constants of THC in each compartment. , and: distribution rate constants of THC-OH in each compartment. and : elimination rate constants of THC-OH and THCCOOH from the central compartment. and : elimination rate constants of THC and THC-OH from the effect compartment.

Figure 2.
Graph of actual and simulated THC concentration in plasma after smoking cigarettes that contain 150 µg THC/kg body weight.
Figure 2.
Graph of actual and simulated THC concentration in plasma after smoking cigarettes that contain 150 µg THC/kg body weight.

Figure 3.
Graph of simulated THC concentration after smoking cigarettes which contain 150 µg THC/kg body weight in each compartment.
Figure 3.
Graph of simulated THC concentration after smoking cigarettes which contain 150 µg THC/kg body weight in each compartment.
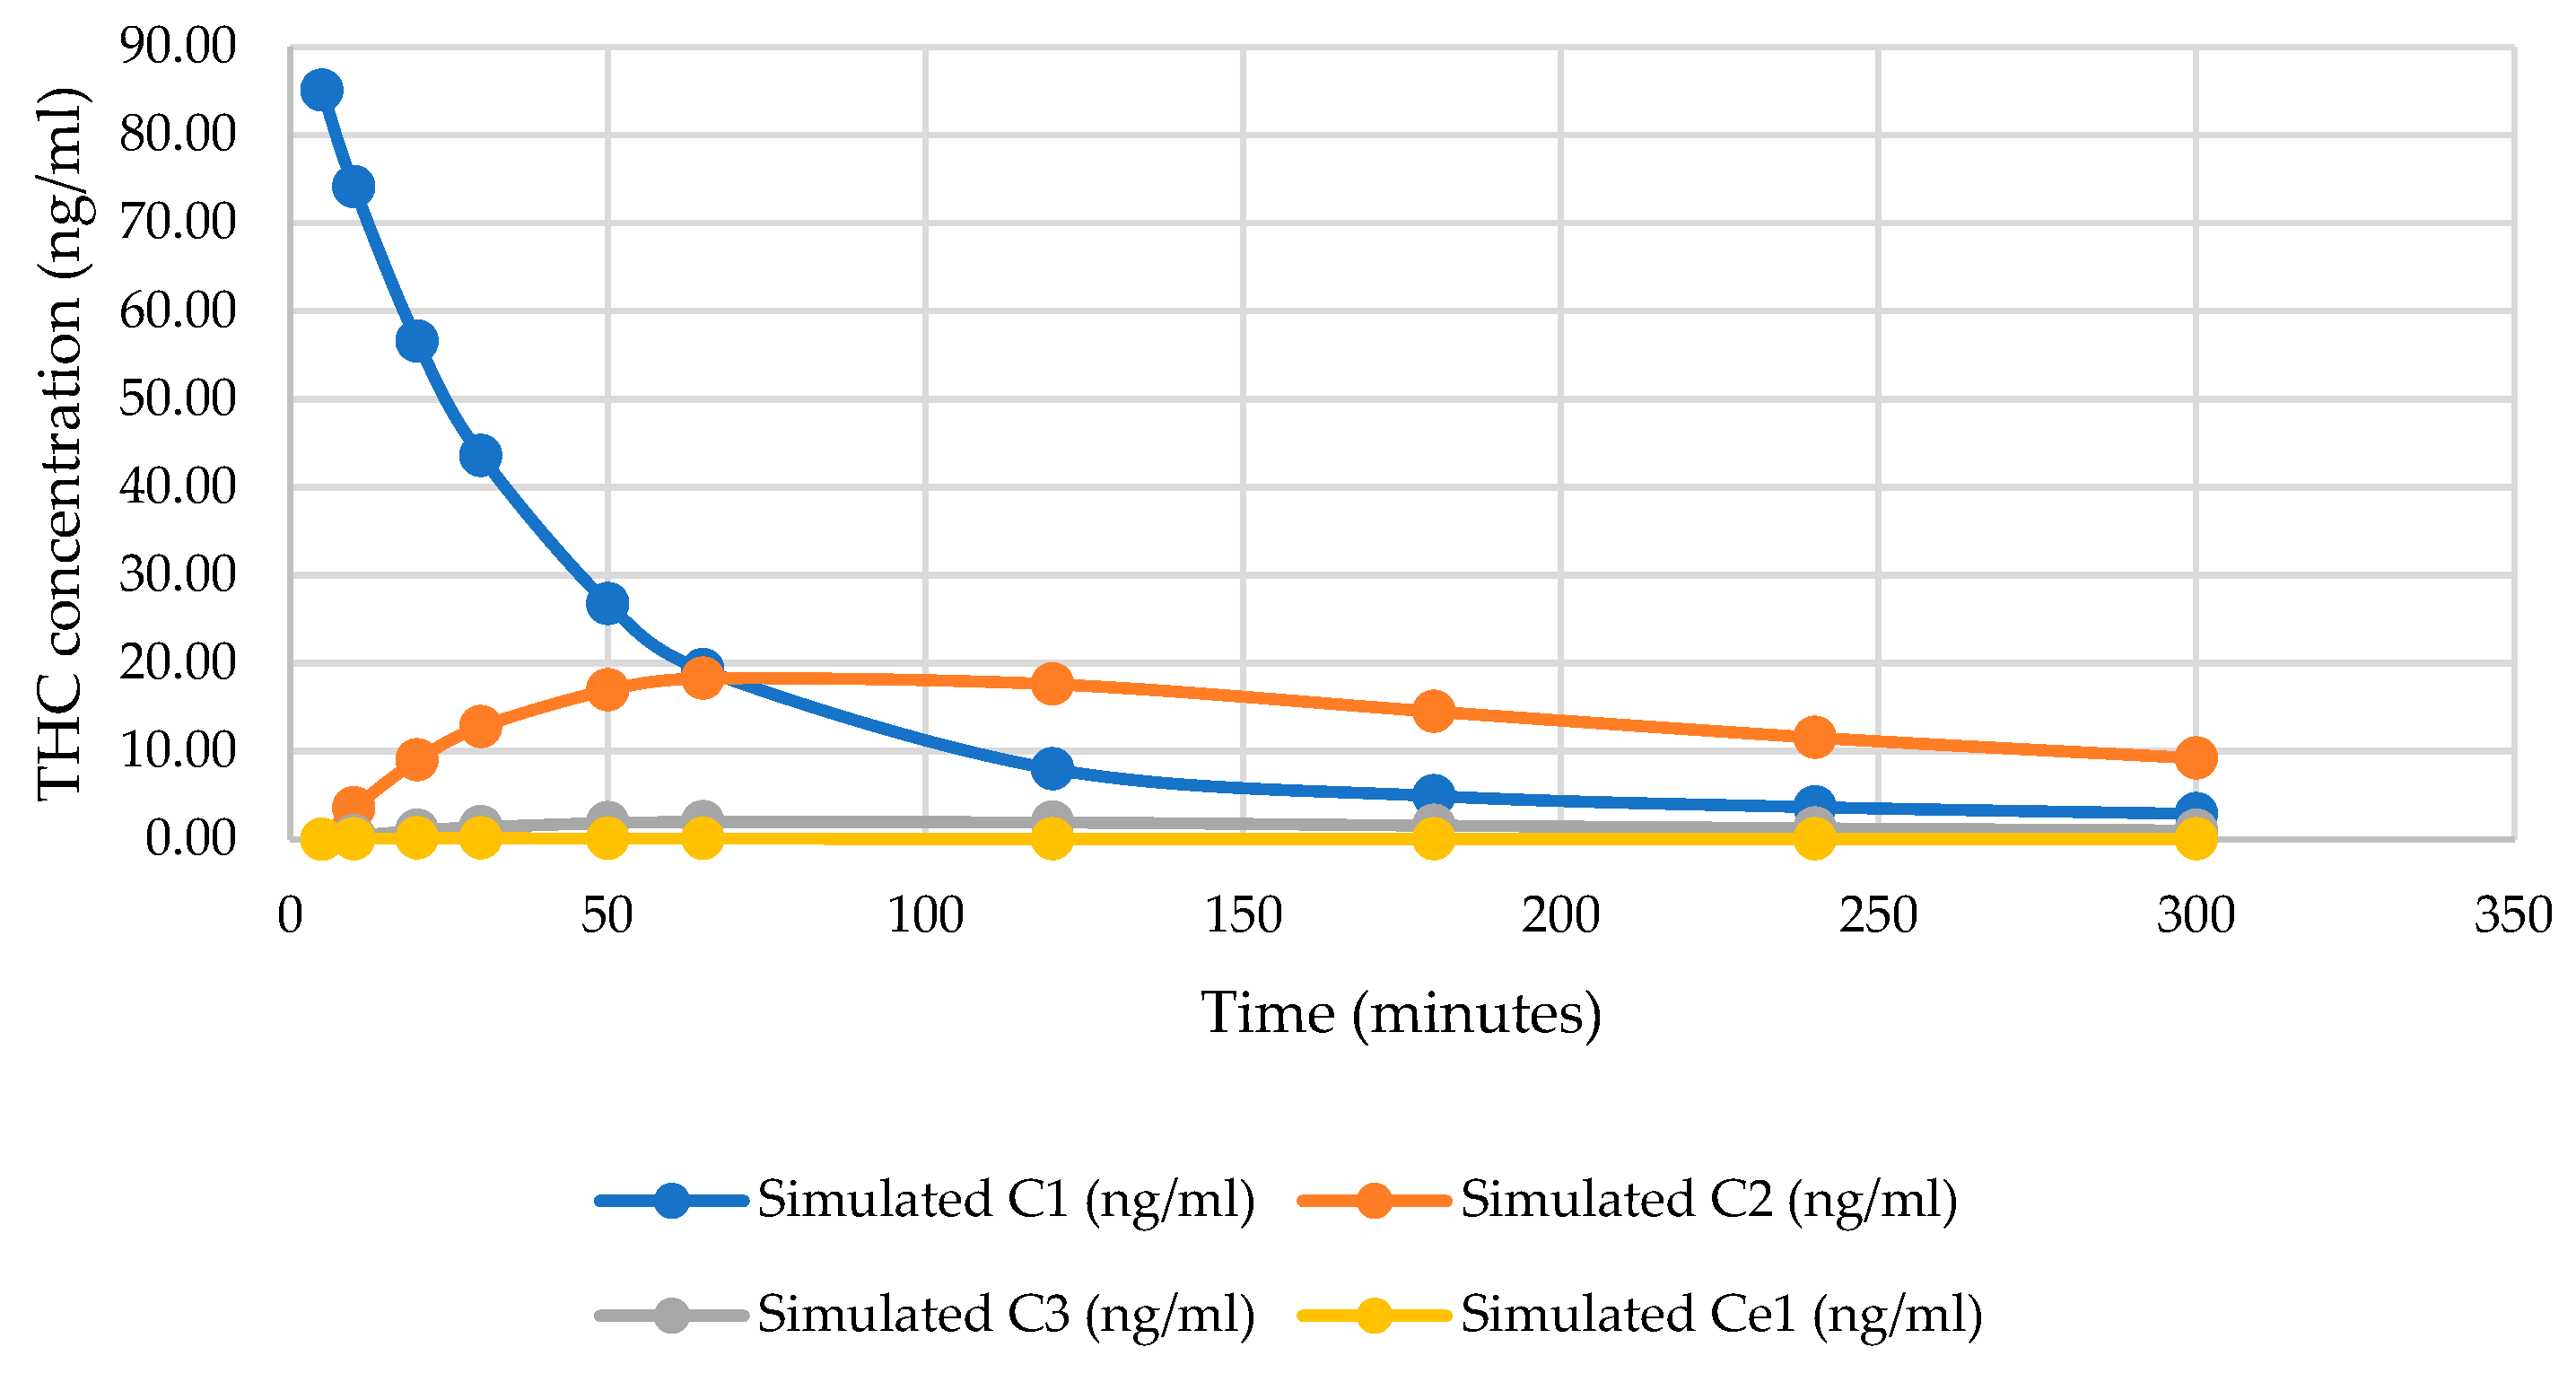
Figure 4.
Graph of actual and simulated THC-OH concentration in plasma after smoking cigarettes that contain 150 µg THC/kg body weight.
Figure 4.
Graph of actual and simulated THC-OH concentration in plasma after smoking cigarettes that contain 150 µg THC/kg body weight.

Figure 5.
Graph of simulated THC-OH and THCCOOH concentration after smoking cigarettes that contain 150 µg THC/kg body weight.
Figure 5.
Graph of simulated THC-OH and THCCOOH concentration after smoking cigarettes that contain 150 µg THC/kg body weight.


Table 1.
Mean plasma concentration of THC and its metabolites after smoking.
| Time after Smoking (min) | THC Concentration (ng/mL) | THC-OH Concentration (ng/mL) | THCCOOH Concentration (ng/mL) |
|---|---|---|---|
| 5 | 85.08 | 5.89 | 6.98 |
| 10 | 78.43 | 18.74 | 11.40 |
| 20 | 57.83 | 18.94 | 18.25 |
| 30 | 41.40 | 18.54 | 28.69 |
| 50 | 27.29 | 12.73 | 35.60 |
| 65 | 16.97 | 9.58 | 24.49 |
| 120 | 9.76 | 6.65 | 15.14 |
| 180 | 4.96 | 3.33 | 12.48 |
| 240 | 3.66 | 2.76 | 7.23 |
| 300 | 2.22 | 1.85 | 4.10 |
Table 2.
Optimal values of rate constants for pharmacokinetics of THC after smoking cigarettes that contain 150 µg THC/kg body weight.
Table 2.
Optimal values of rate constants for pharmacokinetics of THC after smoking cigarettes that contain 150 µg THC/kg body weight.
| Parameters | Values | Parameters | Values |
|---|---|---|---|
| 85.08 ng/mL | 0.0174 min−1 | ||
| 0.0091 min−1 | 0.0000 min−1 | ||
| 0.0067 min−1 | 0.0657 min−1 | ||
| 0.0010 min−1 | −0.0039 min−1 | ||
| 0.0003 min−1 | −0.0306 min−1 |
Table 3.
Actual and simulated THC concentration in plasma after smoking cigarettes that contain 150 µg THC/kg body weight.
Table 3.
Actual and simulated THC concentration in plasma after smoking cigarettes that contain 150 µg THC/kg body weight.
| Time after Smoking (min) | Actual THC Concentration (ng/mL) | Simulated THC Concentration (ng/mL) |
|---|---|---|
| 5 | 85.08 | 85.05 |
| 10 | 78.43 | 74.12 |
| 20 | 57.83 | 56.57 |
| 30 | 41.40 | 43.58 |
| 50 | 27.29 | 26.76 |
| 65 | 16.97 | 19.26 |
| 120 | 9.76 | 8.01 |
| 180 | 4.96 | 4.91 |
| 240 | 3.66 | 3.67 |
| 300 | 2.22 | 2.87 |
Table 4.
Optimal values of rate constants for pharmacokinetics of THC-OH and THCCOOH after smoking cigarettes that contain 150 µg THC/kg body weight.
Table 4.
Optimal values of rate constants for pharmacokinetics of THC-OH and THCCOOH after smoking cigarettes that contain 150 µg THC/kg body weight.
| Parameters | Values | Parameters | Values |
|---|---|---|---|
| 0.0144 min−1 | 0.0048 min−1 | ||
| 0.0013 min−1 | 0.0028 min−1 | ||
| 0.0112 min−1 | 0.0010 min−1 | ||
| 0.0009 min−1 | −0.0092 min−1 | ||
| 0.0004 min−1 | −0.0237 min−1 |
Table 5.
Actual and simulated THC-OH and THCCOOH concentration in plasma after smoking cigarettes that contain 150 µg THC/kg body weight.
Table 5.
Actual and simulated THC-OH and THCCOOH concentration in plasma after smoking cigarettes that contain 150 µg THC/kg body weight.
| Time after Smoking (min) |
Actual THC-OH (ng/mL) |
Simulated THC-OH (ng/mL) |
Actual THCCOOH (ng/mL) |
Simulated THCCOOH (ng/mL) |
|---|---|---|---|---|
| 5 | 5.89 | 7.02 | 6.98 | 11.95 |
| 10 | 18.74 | 11.60 | 11.40 | 19.76 |
| 20 | 18.94 | 16.00 | 18.25 | 27.24 |
| 30 | 18.54 | 16.77 | 28.69 | 28.56 |
| 50 | 12.73 | 14.32 | 35.60 | 24.38 |
| 65 | 9.58 | 11.83 | 24.49 | 20.13 |
| 120 | 6.65 | 6.15 | 15.14 | 10.48 |
| 180 | 3.33 | 4.09 | 12.48 | 6.96 |
| 240 | 2.76 | 3.15 | 7.23 | 5.36 |
| 300 | 1.85 | 2.50 | 4.10 | 4.26 |
Disclaimer/Publisher’s Note: The statements, opinions and data contained in all publications are solely those of the individual author(s) and contributor(s) and not of MDPI and/or the editor(s). MDPI and/or the editor(s) disclaim responsibility for any injury to people or property resulting from any ideas, methods, instructions or products referred to in the content. |
© 2023 by the authors. Licensee MDPI, Basel, Switzerland. This article is an open access article distributed under the terms and conditions of the Creative Commons Attribution (CC BY) license (https://creativecommons.org/licenses/by/4.0/).
Share and Cite
MDPI and ACS Style
Mahahong, T.; Saleewong, T. A Compartment Pharmacokinetics Model of THC and Its Metabolites after Smoking. Eng. Proc. 2023, 55, 4. https://doi.org/10.3390/engproc2023055004
AMA Style
Mahahong T, Saleewong T. A Compartment Pharmacokinetics Model of THC and Its Metabolites after Smoking. Engineering Proceedings. 2023; 55(1):4. https://doi.org/10.3390/engproc2023055004
Chicago/Turabian StyleMahahong, Thanachok, and Teerapol Saleewong. 2023. "A Compartment Pharmacokinetics Model of THC and Its Metabolites after Smoking" Engineering Proceedings 55, no. 1: 4. https://doi.org/10.3390/engproc2023055004