
Computer-Aided Simulation on the Impact of the Combination of High-Rise Building Wall and Roof Green Coverage Ratio on Urban Microclimate †


Department of Architecture, National Taipei University of Technology, Taipei 106, Taiwan
*
Author to whom correspondence should be addressed.
†
Presented at the IEEE 5th Eurasia Conference on Biomedical Engineering, Healthcare and Sustainability, Tainan, Taiwan, 2–4 June 2023.
Eng. Proc. 2023, 55(1), 83; https://doi.org/10.3390/engproc2023055083
Published: 27 December 2023
(This article belongs to the Proceedings of 2023 IEEE 5th Eurasia Conference on Biomedical Engineering, Healthcare and Sustainability)
Abstract
:Environmental issues related to global warming and urbanization are becoming more serious. Many studies have shown that urban vertical planting can effectively reduce ambient temperature. However, the impact of different vertical planting combinations on urban microclimate has rarely been studied in Taiwan. Thus, in this study, the impact of different proportions of green walls and green roofs on the environment is explored. Referring to 6 times 6 high-rise buildings of 90 m in the ideal city. FLUENT was used to simulate the average climatic conditions of the Taipei Station in the past ten years’ summer. Since the actual building has openings that cannot reach 100% vertical plant coverage, the coverage is calculated based on the proportion of the green coverage area to the area of bare walls and roof decks. We had four options, including case 1 without greening, case 2 (green wall 25% + green roof 75%), case 3 (50% green wall + 50% green roof), and case 4 (75% green wall + 25% green roof). The research results show that at the height of the pedestrian layer (1.5 m), the wind speed of urban streets is reduced due to the obstruction of surrounding buildings. The installation of wall greening slows down the wind speed and reduces the ambient temperature, which is better than roof greening. In the urban canopy (90.5 m), as the Z-axis height increases, the higher the green roof ratio, the higher the wind speed. To improve the overall urban wind below 100% of the total greening balance of walls and roofs, it is recommended that wall greening be 50–75% and roof greening be 25–50%.
1. Introduction
As environmental issues related to global warming and urbanization become more serious, high-density and high-rise buildings cause the temperature in urban areas to be higher than those in rural areas, resulting in the urban heat island effect. Summarized the factors that affect the heat island effect at home and abroad. The urban scale includes the total population, topography, green coverage, and use intensity, as well as factors such as the number of plants, the aspect ratio of the street, the reflectivity of the pavement material, and the sky visibility. Gromke et al. [1] pointed out that the global average temperature will increase by 1.5 to 4.5 °C by 2100. Improving the urban green cover rate and achieving a natural ventilation environment can be adjusting targets to slow down the urban heat island effect. Urban air corridors generate different wind directions and speeds due to urban density, building height, and street canyon width. To actively shape an excellent urban environment and microclimate, many countries have vigorously promoted and rewarded policies with the primary goal of developing three-dimensional greening of buildings Yeh [2]. On 24 February 2011, the Taipei City Government announced the revision of the “Taipei City Urban Renewal Building Volume Incentive Measures”, adding the “Building Roof Platform and Vertical Greening of Buildings” volume reward project [Appendix A]. Moreover, the Taichung Government promulgated in 2019, “Taichung City Encourages Migrants”. Building Facilities Setup and Feedback Measures [Appendix B].
The three-dimensional greening of the building increases ventilation and reduces the ambient temperature via the shading and evapotranspiration capacity of the plants. Due to the different types of plants, the porosity, canopy size, and thickness are different. Various studies have pointed out that façade greening methods ranging from single to street-level buildings benefit environmental cooling and improve comfort. Urban greening is considered the most suitable and effective strategy for mitigating climate change. Perini et al. [3], Lu [4], and Huang [5] explored the differences between planting types, greening methods, and air wall thicknesses on building surface temperature or air temperature at a certain distance via actual measurement. Numerical simulations also reveal the influence of different three-dimensional greening factors: wall, street tree, shelterbelt, a combination of green coverage, green coverage, and height.
The above literature discussed the design of building wall green coverage rate or simulating the relationship between greening and wind and heat environment in the natural base configuration but lacks discussion of the three-dimensional (wall and roof) green coverage combination of buildings at the street scale. Therefore, we simulated a high-rise and high-density ideal city to explore the combination of greening ratios on building walls and roofs using computational fluid dynamics (CFD). Four schemes, including no greening and greening (25% of the wall + 75% of the roof; 50% of the wall + 50% of the roof; and 75% of the wall + 25% of the roof), are configured for changes in the urban environment at pedestrian height (1.5 m).
2. Literature Review
2.1. Urban Heat Island Effect and Warm Environments
Due to the lack of green space, over-concentration of the population, sizeable artificial heat dissipation, and the influence of building materials, the urban environment makes the city a hot island. Liu [6] made three cases of adjusting the urban form and the width of the street profile and analyzed them with ACH and PET. The research results showed that the airflow can be increased when the street profile configuration is parallel to the wind direction. The ventilation effect can be improved. In addition to the lateral airflow, the longitudinal airflow also increases the airflow, and ACH is proportional to the volume flow of the inflow space. The high-rise building area has a considerable distance between buildings, which is conducive to air circulation, and the heat island effect tends to weaken. Wen [7] studied the factors that affect the thermal environment due to the high-temperature phenomenon of the walking environment in the campus open space via field measurement, a questionnaire survey, thermal environmental factor investigation, and CFD software simulation. The research results showed that the sky visibility rate (SVF) in the campus open space walking environment during the hot season is the ratio of the degree of shading affecting the walking environment to the direct sunlight walking environment. It is necessary to reduce the visibility of the walking environment, such as green plants, pavement materials, water bodies, artificial heat dissipation, wind environment, sky visibility factors, and urban density and height. Ting [8] used the computational fluid dynamics of FLUENT to make different road widths, building setback scales, and building setback heights. The research showed that the type of building setback volume with large and small building setback height scales was helpful for urban ventilation and ventilation efficiency. To improve the overall urban environment, the mass design of the building must have a large scale back toward the building. Zhang et al. [9] analyzed the frontal density of building arrays in terms of thermal comfort and air quality for pedestrian layers above four floors, considering realistic solar radiation (north, south, east, and west). They showed that the local solar position (0800LST) and (1400LST) wind speed and air change were different from (1200LST) as the frontal density increased.
2.2. Urban Canopy and Pedestrian Wind Field
The urban microclimate of Hong Kong. They believed that high-density buildings affected the air convection and exchange in the inner city, increasing the heat load in summer. Mei et al. [10] proposed that lower building density improves ventilation efficiency. Better ventilation performance can be obtained in compact urban development by reducing frontal area density or building number. yang et al. [11] set up experimental models with an average height of 30 m and a staggering degree of 0, 5, 10, 15, 20, 40, and 60 m. The results showed that the staggering buildings were beneficial in guiding the airflow from the upper floor to the ground and promoting the air on the leeward side. Lin [12] discussed the actual measurement and simulation of the wind environment in different areas of the city by adjusting the building type and the width of the street profile. For ventilation efficiency and area ventilation, Luis [13] analyzed the influence of different urban types on the thermal effect. He proposed that the building group coverage rate of 30 and 40% provided a good balance between the environmental impact in the city and the external trade-off. As the height of the building increased, the air velocity on the outer surface of the building gradually increased. Ku [14] showed that the urban form indicators related to building height significantly correlated with other types of urban form indicators, indicating that building height played a vital role in the construction of the urban environment. Lin [15] used the removal flow rate (PFR) and air exchange rate (ACH) to evaluate the impact of different building heights, building coverage, and ambient wind direction on urban canopy ventilation. Studies have shown that changes in building height increase airflow around high-rise buildings but reduce ventilation in low-rise buildings.
After summarizing the relevant literature, the factors affecting urban microclimate include building types (building coverage, average height, and plot ratio), and it was found that the average building height significantly impacts the wind environment.
2.3. Urban Vertical Planting and Warm Environments
The effect of plant cutting to improve the urban microclimate depends on the climatic environment (season, temperature, speed, and wind direction), silk planting wind, and plant cutting type (roof greening, three-dimensional, and street greening). Hsieh [16] studied that when the green coverage rate of the balcony was 50 or 100%, the average temperature on the leeward side significantly reduced. As the green coverage rate of the balcony increases, the overall average temperature is lower. Xi et al. [17] showed that the average temperature of green roofs dropped by 1 °C in summer and winter, the average temperature of street trees dropped by 2 °C, and the average temperature of shelter forests dropped by less than 1 °C. The three greening combinations have better cooling benefits than single greening Ziaul et al. [18]. The most effective strategy is to reduce the temperature by 2.6 °C when the roof and wall greening cover 100% of the open mid-rise configuration. Herath et al. [19] showed that a 100% green roof reduced the temperature slightly more than 50%, and the combination of the street tree with a 50% green roof and 50% green wall reduced the temperature by up to 1.9 °C compared with the solid base. The building facade in all directions. The results showed that the average temperature of the wall surface decreased by 0.7 °C, the maximum cooling in the east was about 12.6 °C, the air temperature was decreased on average by about 0.8 to 2.1 °C, and the relative humidity was higher than that around the bare wall. Aflaki et al. [20] Compared with the glass building surface, the three-dimensional greening system with 100% coverage can reduce the ambient temperature by about 1 °C. Ouyang et al. [21] experimented with green coverage in different urban densities, ranging from 2 to 30%, and whole area greening (56% greening outside buildings). Setting tree height (9 m), trunk height (3 m), and crown width (7 m), the study found that a low density of 20–30% of planting coverage is the most effective cooling value. Peng et al. [22] simulated the typical urban form of Nanjing with a green coverage rate of 35–100%. The results showed that high-density greening of 61–81% achieved 3% energy savings during the day. Morakinyo et al. [23] used ENVI-met to study the effect of three-dimensional green coverage and orientation on cooling in a typical high-density urban configuration in Hong Kong. The wind direction was set with the southwesterly wind in summer. A reduction of 12 to 14 °C, followed by a reduction of 7 to 1 °C in the south direction, produced better thermal benefits when the same green coverage was used in the east–west and north–south directions. Zhao [24] found the influence of the most popular human height wind field related to the high and warm trend. Kong et al. [25] measured the impact of different tree species on the high-density spatial microclimate. They found that trees with large, short trunks and dense canopies had the best effect on reducing the mean radiant temperature. Djedjig et al. [26] used a scale model to conduct actual measurements. Compared to the differences between green roofs and facade greening, both greening types improved environmental comfort via evapotranspiration, but the facade greening effect was better.
3. Parameter Setting
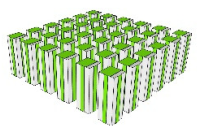
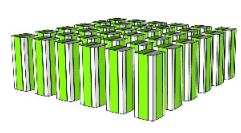
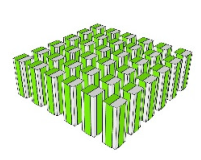
A 6 times 6 conceptual city model with a total of 36 buildings Yang et al. [9] was used in this study. The dimensions of a single building are 30 m long (A) times 30 m wide (A), the X-axis channel and Y-axis channel width (W) is 20 m (B), and the configuration range of the research area is 280 times 280 m. As shown in Figure 1 and Figure 2, the urban wind and temperature field distribution was analyzed via CFD numerical simulation, and the combination of greening ratios on building walls and roofs was discussed. The green coverage area accounted for 100% of the area of bare walls and roof platforms. Table 1 shows the different cases in this study.
ANSYS FLUENT V18, the numerical simulation software, was used to carry out a three-dimensional simulation analysis of high-speed end flow and incompressible flow, steady state, thermal conductivity, and heat transfer. According to Yang et al. [9], the boundary model must be set for an outlet, inlet, lateral, and top. The air inlet was 5 H. The 5 H high, exit boundary and model were kept at 15 H (H is the length of the long side of the overall building model). The height of the highest building model from the upper boundary was 6 B (B is the height of the highest building) to achieve a complete wake, as shown in Figure 3.
Material conditions and the building wall were set to concrete; the ground was set to asphalt; and the planting material and parameters were set based on Buccolieri et al. [27], Baxevanou et al. [28], and Koch et al. [29] It is a porous material with uniform filling and distribution and inelasticity. The planting porosity is 0.9, the thickness of the green wall is 1 M, and the thickness of the green roof is 0.5 M, as shown in Table 1 and Table 2.
Eleven measuring points were set in the Y-axis (parallel wind direction channel) as 1 m away from the outer wall of the building, which were P1–P11. In order to analyze the changes in different street valleys, the Z-axis was for the pedestrian height of 1.5 m, the middle height of 45 m, and the urban canopy of 90.5 m to monitor the changes in wind speed and temperature thoroughly, as the changes in wind speed and temperature thoroughly as shown in Table 2.
The meteorological parameters were set based on the average wind speed, wind direction, and the average temperature at the Taipei Station (466920) from 2012 to 2021 essential reference meteorological data. The inflow wind direction was set as the east wind, the average wind speed was 1.92 m/s, and the average temperature was 29.67 °C, as shown in Table 3.
4. Simulation Analysis
4.1. Wind Field Simulation Analysis
Table 4 shows the changes in the wind flow field caused by the pedestrian height of 1.5 m due to the four three-dimensional green coverage ratio combinations. The analysis results show that the average wind speed in the upwind area of case 1 is 1.3 m/s, case 2 is 0.69 m/s, and case 3 is 0.85 m/s, case 4 is 0.79 m/s. Compared with case 1 without the greening configuration, the wind speed of other schemes is slightly lower due to the influence of planting porosity and surface friction, while among the three greening configurations, the upper wind of case 2 has the largest average. The average wind speeds of each scheme in the middle area are 0.89, 0.47, 0.67, and 0.55 m/s. The downwind area is the lowest average wind speed, which is 0.83, 0.21, 0.45, and 0.27 m/s in sequence. The overall average wind speed of cases 1 to 4 is 1.01, 0.41, 0.6, and 0.48 m/s. In the greening configuration scheme, the average wind speed of case 3 is 0.24 m/s. It is higher than the average wind speed of case 2, which increases the ambient wind speed by 31%. The average wind speed of case 3 is 0.12 m/s higher than the average wind speed of case 4. M. The ambient wind speed is increased by 20%.
In case 2, the average wind speed is lower than in other schemes. It is inferred that the proportion of the bare surface area of the building is too large compared to the green wall area, affecting the wind speed performance in each area. In the greening scheme, case 3 achieves better wind field performance.
Table 5 shows the effects of pedestrian height (1.5), middle layer (45), and urban canopy (90.5) on different flow fields and wind speeds for the four schemes. The building height of each scheme is 1.5 to 90 m, and the upwind place is between 1.3 and 2.1 m/s, 0.69 and 1.46 m/s, and 0.85 and 1.39 m/s. The result shows that the average wind speed at the lower part of the greening scheme (1.5 m) becomes weaker in the order of case 1 > case 3 > case 4 > case 2, and the average wind speed at the upper part (90.5 m) becomes weaker in the order of case 1 > case 2 > case 3 > case 4. The greening design parallel to the wind direction increases the wind speed compared with the vertical design.
4.2. Temperature Field Simulation Analysis
Table 5 shows that the four three-dimensional green coverage rate combination schemes result in the temperature performance of the pedestrian height of 1.5 m. With greening, the temperature of each scheme gradually increases between the windward area and the downwind area. Compared with case 1 without the greening scheme, the average temperature of the greening scheme dropped slightly. The average temperature of each scheme in the upwind area is 35 °C for case 1, 34.1 °C for case 2, 32.8 °C for case 3, and 33.7 °C for case 4. Compared with the average temperature of case 1, the average temperature of each greening scheme decreases by 2 to 6%. Case 3 has the best temperature and the highest wind speed. Cases 3 and 4 have the most apparent temperature increase from the middle area to the downwind. In the middle zone, the average temperature of cases 1 to 4 is 36.6, 36.2, 34.8, and 35.2 °C, which are 1, 4, and 3% lower than case 1. The overall average temperature of each scheme is 36.5, 35.9, 34.6, and 35.3 °C, which are 1, 5, and 3% lower than case 1.
In the greening scheme, the wind flow upwind of Case 3 is more complicated, so the overall average wind speed is faster, and the average temperature is also lower. In pedestrian height (1.5 m), middle layer (45 m), and urban canopy (90.5 m) to different thermal fields in the four schemes. The average temperature of each scheme is slightly lower. The overall average temperature of each scheme ranges from 36.5 to 30.9 °C, 35.9 to 30.9 °C, 34.6 to 31.1 °C, and 35.3 to 31.3 °C. The ambient temperature decreases by 15% for case 1, 13% for case 2, 10% for case 3, and 11% for case 4. The greening scheme shows a decreasing optimal temperature in case 2. At the pedestrian height, the wind speed of urban streets is reduced due to obstruction of the surrounding buildings, so the temperature is higher, and the greening scheme of the wall is set to reduce the ambient temperature by 1, 5, and 3%, respectively. Since there is no greening scheme at the urban canopy’s height, the wind flow is unobstructed, and the average temperature is also lower. The configuration of roof greening increases the ambient temperature by 1, 0.3, and 1%. The results show that urban wall greening has a better reduction effect than roof greening. Herath et al. (2018) [10] showed that green walls reduce ambient temperature better than green roofs.
5. Conclusions
The simulation results of the environmental wind field and thermal field of the four different schemes are summarized as follows.
- At the height of the pedestrian layer (1.5 m), the greening scheme slows down the wind speed and reduces the ambient temperature due to the influence of plant porosity and surface friction. The wind speed of the greening scheme from large to small is “case 3 (0.6 m/s) > case 4 (0.41 m/s) > case 2 (0.53 m/s). Case 3 has the best wind performance. In the urban canopy (90.5 m), the average wind speed of the greening scheme shows case 2 (1.46 m/s) > case 3 (1.39 m/s) > case 4 (1.22 m/s). As the Z-axis height increases, the higher the green roof ratio, the higher the wind speed.
- The results show that urban wall greening has a better cooling effect than roof greening. Compared with the urban canopy, at the pedestrian height, the wind speed of the urban street is reduced due to the obstruction of the surrounding buildings, and the temperature is higher. The greening on the wall has a more significant cooling effect. The setting of the greening scheme reduces the ambient temperature by 1% (case 2), 5% (case 3), and 3% (case 4). At the height of the urban canopy, the no-greening scheme has a lower average temperature due to unobstructed wind flow, while the greening scheme increases the ambient temperature by 0.1% (case 2), 0.3% (case 3), and 1% (case 4), respectively.
- From the pedestrian height (1.5 m) to the urban canopy (90.5 m), case 1 reduces the ambient temperature by 12%, case 2 by 13%, case 3 by 11%, and case 4 by 11%. Case 2 decreases the optimal temperature. The average temperature of each scheme decreases from low to high.
- Based on the above analysis, if the total green area of walls and roofs is less than 100%, it is recommended to improve the overall urban wind farm by 50−75% on the walls and 25−50% on the roofs.
- The green coverage ratio combination of a single building height with different three-dimensional greening is discussed. In the future, more urban factors can be added to compare variables, such as different building heights and street widths and green coverage ratio ratios, and to find the possibility of lowering the ambient temperature.
Author Contributions
Writing—original draft, Y.-T.H. Validation, Y.-T.H.; Writing—review & editing, Y.-M.S.; Supervision, Y.-M.S. All authors have read and agreed to the published version of the manuscript.
Funding
This research received no external funding.
Institutional Review Board Statement
Not applicable.
Informed Consent Statement
Not applicable.
Data Availability Statement
Data are contained within the article.
Acknowledgments
Thanks to the Ministry of Science and Technology Program (Program Code 110-2221-E-027-013-MY2) for the sponsorship of this research, but this research received no external funding.
Conflicts of Interest
The authors declare no conflict of interest.
Appendix A
On 24 February 2011, the Taipei City Government announced amendments to the “Taipei City Urban Renewal Building Volume Rewards Measures”, adding the volume reward program of “Building Roof Platforms and Vertical Greening of Facades”. Unless otherwise stipulated by urban planning or other laws and regulations, the greening area of the roof deck of a new building shall be 50% of the roof deck area, and the greening area shall be calculated based on the actual covered area.
Appendix B
In 2019, the Taichung government promulgated the “Taichung City’s Measures for the Installation and Feedback of Building Facilities to Encourage Migrants”. Among them, paragraph 2 of Article 5 stipulates that the exterior wall of the building shall be set with a planted wall and shall not protrude from the exterior wall by more than 2 m.
References
- Gromke, C.; Blocken, B.; Janssen, W.; Merema, B.; van Hooff, T.; Timmermans, H. CFD analysis of transpirational cooling by vegetation: Case study for specific meteorological conditions during a heat wave in Arnhem, Netherlands. Build. Environ. 2015, 83, 11–26. [Google Scholar] [CrossRef]
- Yeh, T.-Y. The Evaluation and Promotion Strategies of Building Greenery. Master’s Thesis, National Taipei University of Technology, Taipei, Taiwan, 2018. [Google Scholar]
- Perini, K.; Ottelé, M.; Fraaij AL, A.; Haas, E.M.; Raiteri, R. Vertical greening systems and the effect on air flow and temperature on the building envelope. Build. Environ. 2011, 46, 2287–2294. [Google Scholar] [CrossRef]
- Lu, Y.-H. Influences of Plants on Wall Cooling Effect. Master’s Thesis, Feng Chia University, Taichung, Taiwan, 2012. [Google Scholar]
- Huang, S.-S. Influences of Different Airspace Depth of Green Wall on Building Cooling Effect. Master’s Thesis, National Cheng Kung University, Tainan, Taiwan, 2013. [Google Scholar]
- Liu, P.-J. CFD Analysis of Outdoor Ventilation with Different Urban Geometry and Unequal Block Width in Taiwan. Master’s Thesis, National Taipei University of Technology, Taipei, Taiwan, 2016. [Google Scholar]
- Wen, C.-J. The Thermal Comfort of Walking Environment in Campus Open Space—A Case Study of National ChengChi University. Master’s Thesis, National ChengChi University, Taipei, Taiwan, 2018. [Google Scholar]
- Ting, T.-Y. The Influence of High-Rise Building Setback Type of Wind Environment. Master’s Thesis, National Taipei University of Technology, Taipei, Taiwan, 2017. [Google Scholar]
- Li, Z.; Zhang, H.; Wen, C.Y.; Yang, A.S.; Juan, Y.H. Effects of frontal area density on outdoor thermal comfort and air quality. Build. Environ. 2020, 180, 107028. [Google Scholar] [CrossRef]
- Mei, S.J.; Hu, J.T.; Liu, D.; Zhao, F.Y.; Li, Y.; Wang, Y.; Wang, H.Q. Wind driven natural ventilation in the idealized building block arrays with multiple urban morphologies and unique package building density. Energy Build. 2017, 155, 324–338. [Google Scholar] [CrossRef]
- Yang, J.; Zhang, T.; Tan, Y. Technological evolution, and evaluation system integration of urban wind environment research. South. Archit. 2014, 3, 31–38. [Google Scholar]
- Lin, C.-Y. The Study of the Impact on Environment Comfort of Mass Layout in Waterfront Building. Master’s Thesis, National Taipei University of Technology, Taipei, Taiwan, 2017. [Google Scholar]
- Santos, L.G.; Nevat, I.; Pignatta, G.; Norford, L.K. Climate-informed decision-making for urban design: Assessing the impact of urban morphology on urban heat island. Urban Clim. 2021, 36, 100776. [Google Scholar] [CrossRef]
- Ku, C.-A.; Liu, J.-T. Spatial Relationship between Land Use and Flood Potential-A Case Study of Taichung City. Urban Plan. 2020, 47, 27–52. [Google Scholar]
- Lin, M.; Hang, J.; Li, Y.; Luo, Z.; Sandberg, M. Quantitative ventilation assessments of idealized urban canopy layers with various urban layouts and the same building packing density. Build. Environ. 2014, 79, 152–167. [Google Scholar] [CrossRef]
- Hsieh, C.-J. A Study on the Influence of Balcony Greening in High-Rise Buildings on Urban Microclimate. Master’s Thesis, National Taipei University of Technology, Taipei, Taiwan, 2019. [Google Scholar]
- Xi, C.; Ding, J.; Wang, J.; Feng, Z.; Cao, S.J. Nature-based solution of greenery configuration design by comprehensive benefit evaluation of microclimate environment and carbon sequestration. Energy Build. 2022, 270, 112264. [Google Scholar] [CrossRef]
- Ziaul, S.; Pal, S. Modeling the effects of green alternative on heat island mitigation of a meso level town, West Bengal, India. Adv. Space Res. 2020, 65, 1789–1802. [Google Scholar] [CrossRef]
- Herath, H.M.P.I.K.; Halwatura, R.U.; Jayasinghe, G.Y. Evaluation of green infrastructure effects on tropical Sri Lankan urban context as an urban heat island adaptation strategy. Urban For. Urban Green. 2018, 29, 212–222. [Google Scholar] [CrossRef]
- Aflaki, A.; Mirnezhad, M.; Ghaffarianhoseini, A.; Ghaffarianhoseini, A.; Omrany, H.; Wang, Z.H.; Akbari, H. Urban heat island mitigation strategies: A state-of-the-art review on Kuala Lumpur, Singapore, and Hong Kong. Cities 2017, 62, 131–145. [Google Scholar] [CrossRef]
- Ouyang, W.; Morakinyo, T.E.; Ren, C.; Ng, E. The cooling efficiency of variable greenery coverage ratios in different urban densities: A study in a subtropical climate. Build. Environ. 2020, 174, 106772. [Google Scholar] [CrossRef]
- Peng, L.L.; Jiang, Z.; Yang, X.; Wang, Q.; He, Y.; Chen, S.S. Energy savings of block-scale facade greening for different urban forms. Appl. Energy 2020, 279, 115844. [Google Scholar] [CrossRef]
- Morakinyo, T.E.; Lai, A.; Lau, K.K.L.; Ng, E. Thermal benefits of vertical greening in a high-density city: Case study of Hong Kong. Urban For. Urban Green. 2019, 37, 42–55. [Google Scholar] [CrossRef]
- Zhao, X.; Li, G.; Gao, T. The adjustment mechanism of thermal comfort effect and morphological characteristics of typical street trees in Harbin in summer. Landsc. Archit. 2016, 12, 74–80. [Google Scholar]
- Morakinyo, T.E.; Kong, L.; Lau KK, L.; Yuan, C.; Ng, E. A study on the impact of shadow-cast and tree species on in-canyon and neighborhood’s thermal comfort. Build. Environ. 2017, 115, 1–17. [Google Scholar] [CrossRef]
- Djedjig, R.; Bozonnet, E.; Belarbi, R. Experimental study of the urban microclimate mitigation potential of green roofs and green walls in street canyons. Int. J. Low Carbon Technol. 2015, 10, 34–44. [Google Scholar] [CrossRef]
- Buccolieri, R.; Gromke, C.; Di Sabatino, S.; Ruck, B. Aerodynamic effects of trees on pollutant concentration in street canyons. Sci. Total Environ. 2009, 407, 5247–5256. [Google Scholar] [CrossRef]
- Baxevanou, C.; Fidaros, D.; Bartzanas, T.; Kittas, C. Numerical simulation of solar radiation, air flow and temperature distribution in a naturally ventilated tunnel greenhouse. Agric. Eng. Int. CIGR J. 2010, 12, 48–67. [Google Scholar]
- Koch, K.; Samson, R.; Denys, S. Aerodynamic characterisation of green wall vegetation based on plant morphology: An experimental and computational fluid dynamics approach. Biosyst. Eng. 2019, 178, 34–51. [Google Scholar] [CrossRef]
Figure 1.
Architectural model and planting layer settings.
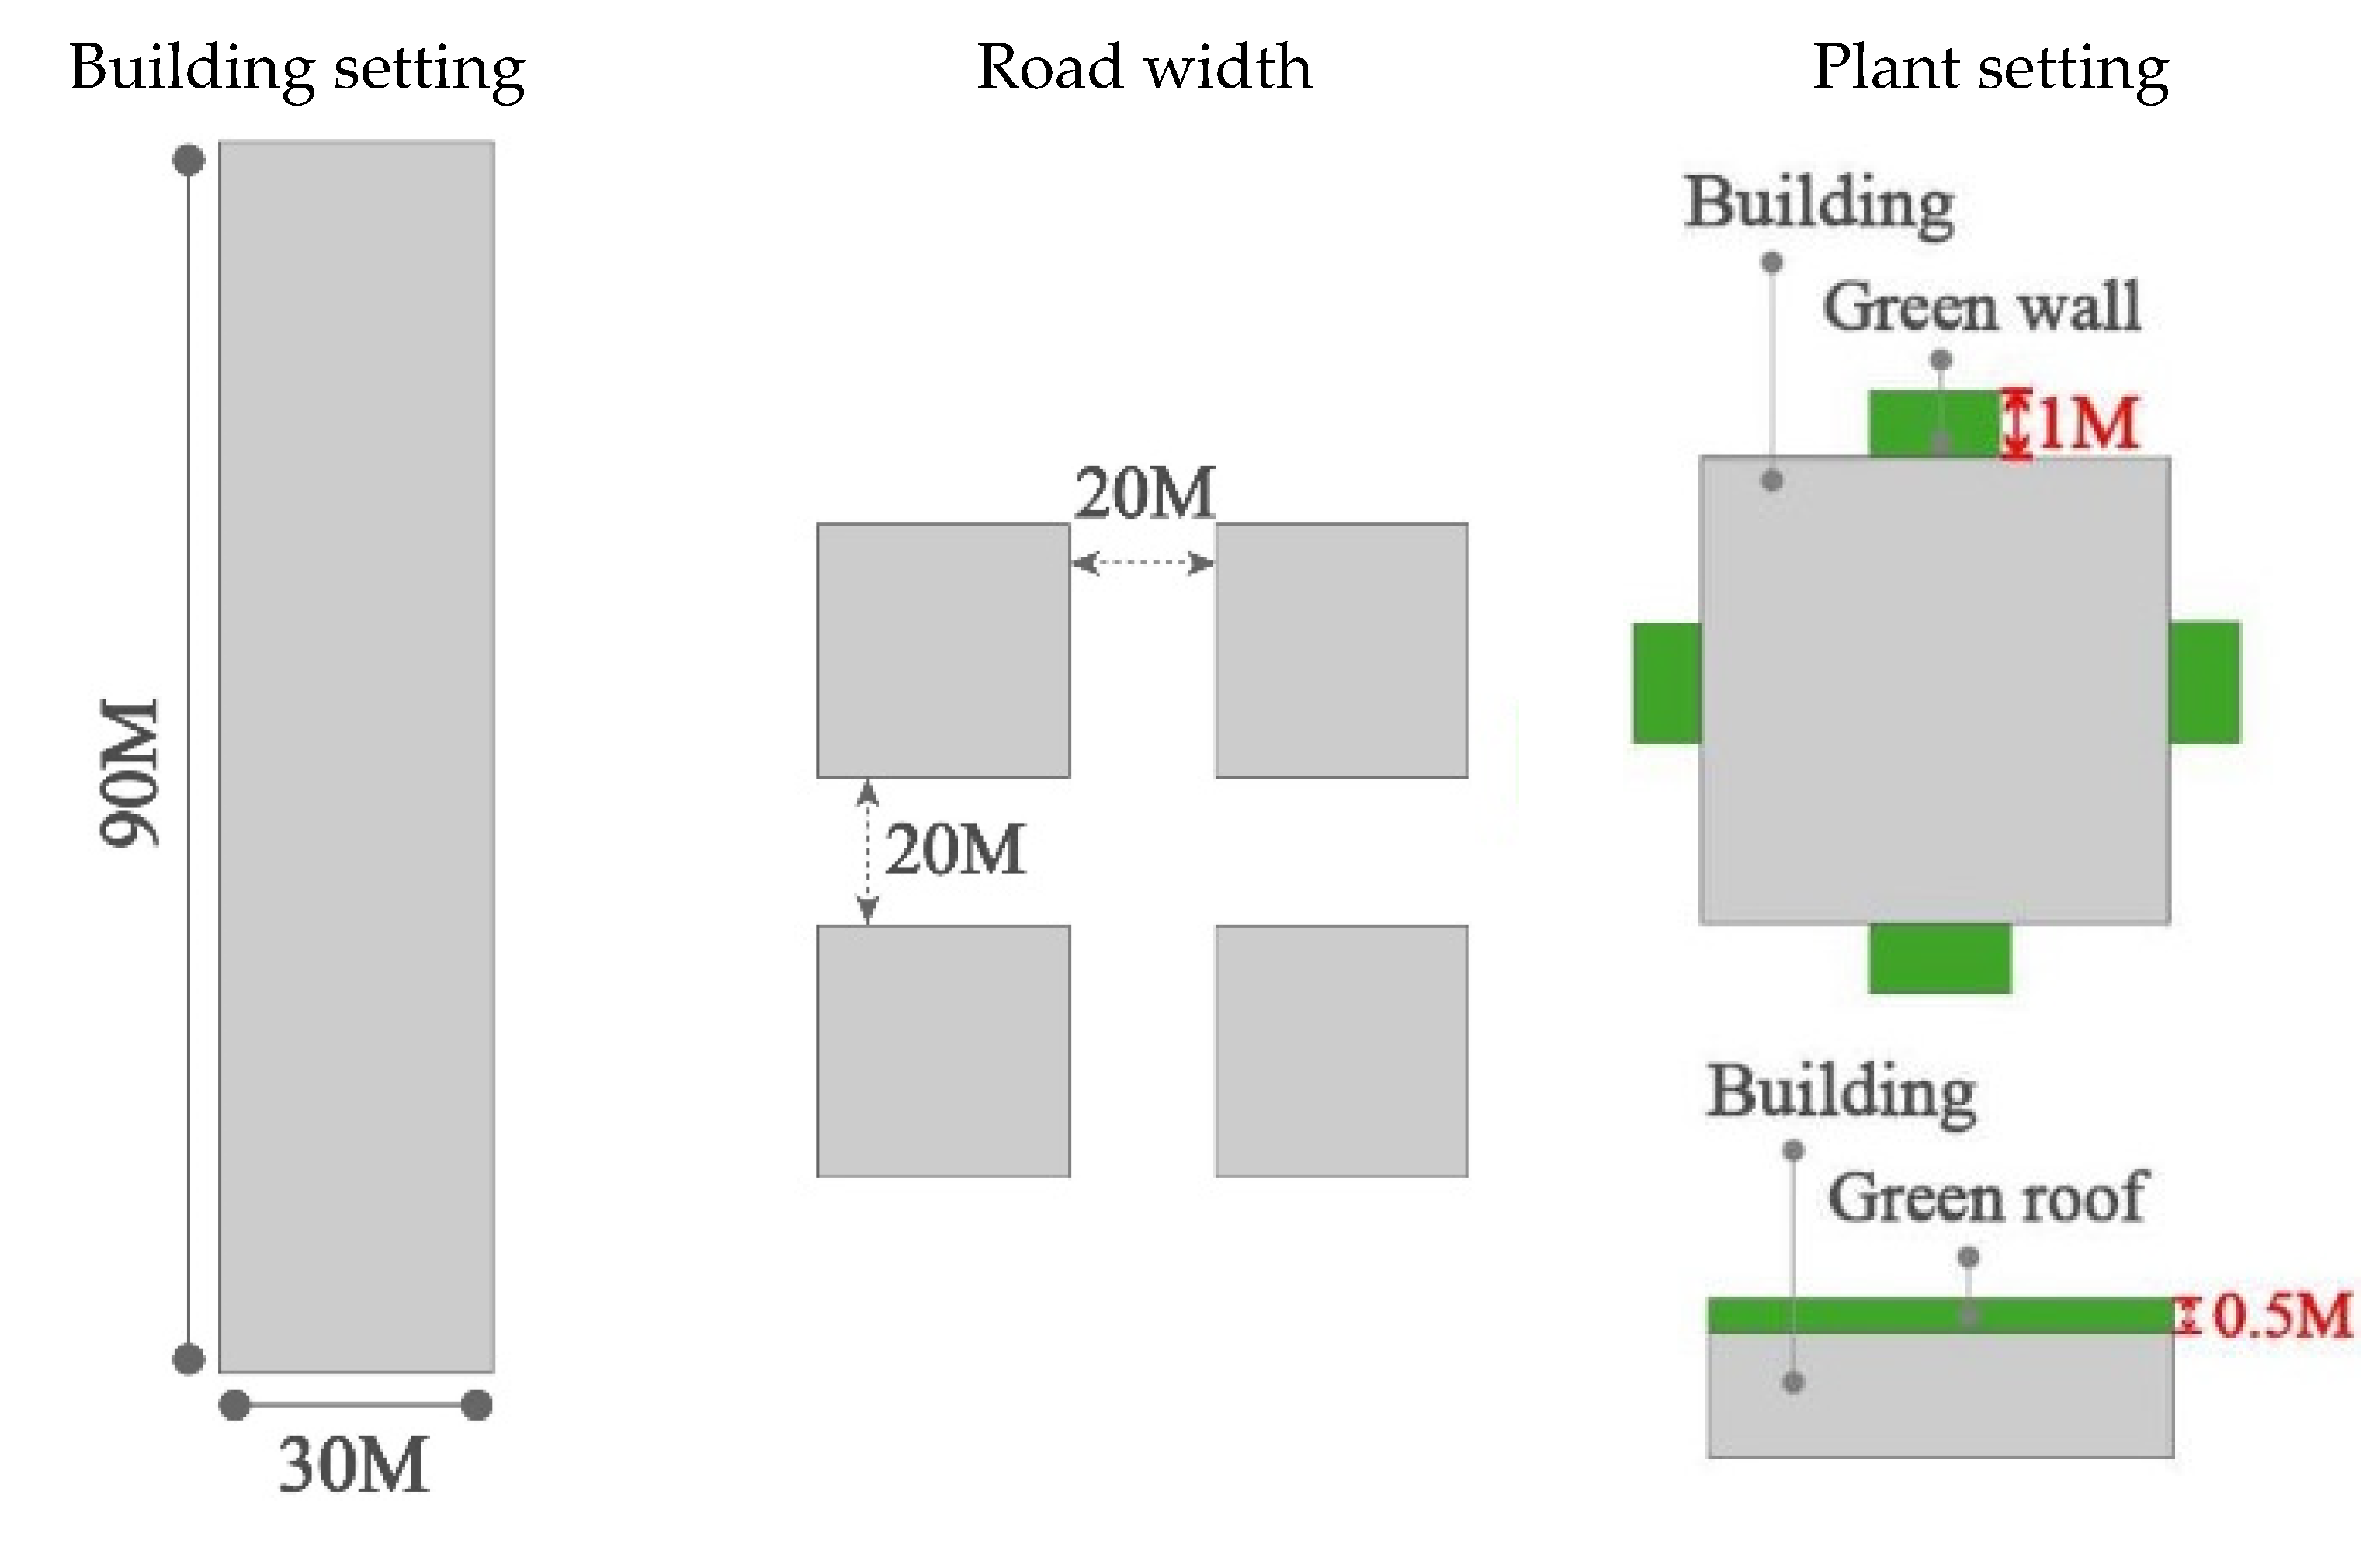
Figure 2.
Area setting and measurement points.
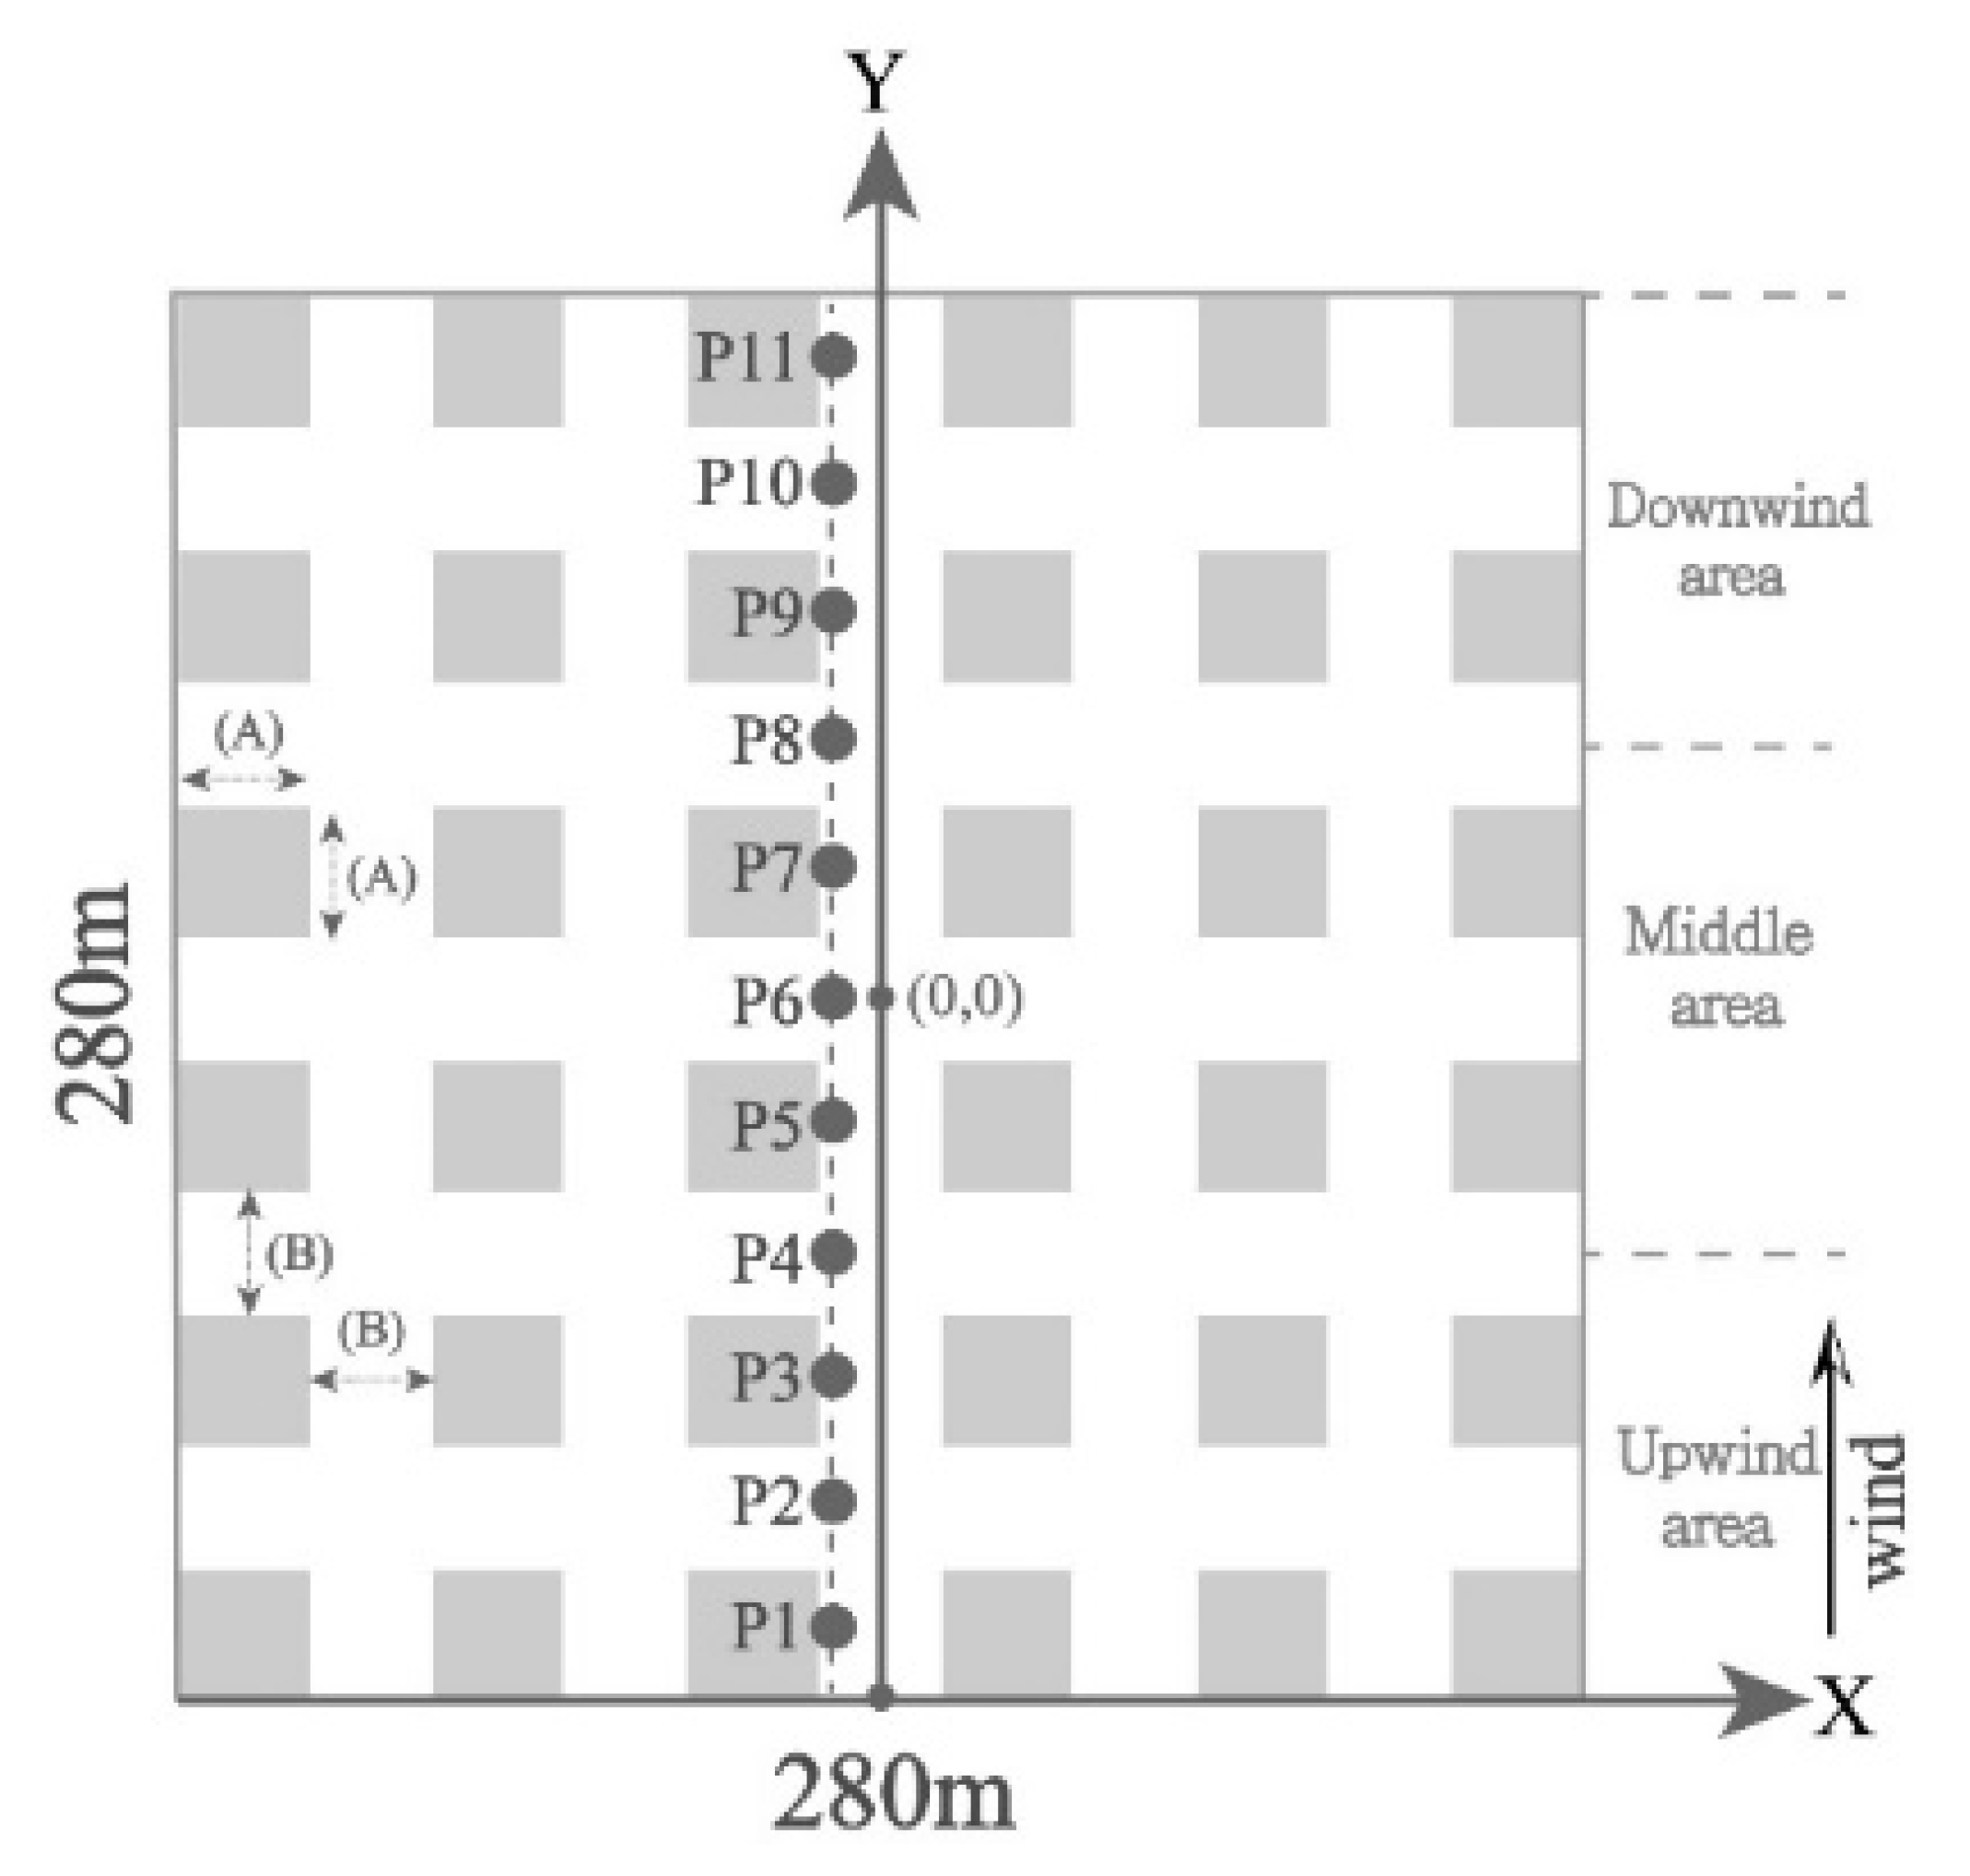
Figure 3.
Boundary condition.


Table 1.
Different cases for simulation.
| Wind | Green Wall | Green Roof | |
|---|---|---|---|
| Case1 | ↗ | 0% | 0% |
 | 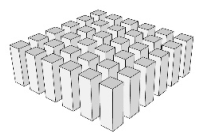 | ||
| Case2 | ↗ | 25% | 75% |
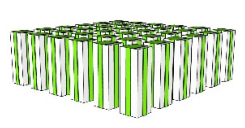 |  | ||
| Case3 | ↗ | 50% | 50% |
 |  | ||
| Case4 | ↗ | 75% | 25% |
 |  | ||
Table 2.
Planting parameter settings.
| Materials | Density (kg/m3) | Specific Heat (J/kg·k) | Thermal Conductivity |
| Porous Materials | 700 | 2310 | 0.173 |
| Porosity (ε) | Permeability (α) (m2) | Particle diameter (m) | Emissivity (ε) |
| 0.9 | 4.86 × 10⁻³ | 0.1 | 0.46 |
Table 3.
Meteorological data of Taipei Station in the summer of 2012–2021 (June–August).
| Station | Wind Speed | Wind Direction | Average Temperature |
|---|---|---|---|
| 466920_Taipei | 1.92 m/s | East wind | 29.67 ℃ |
| IMAGE | 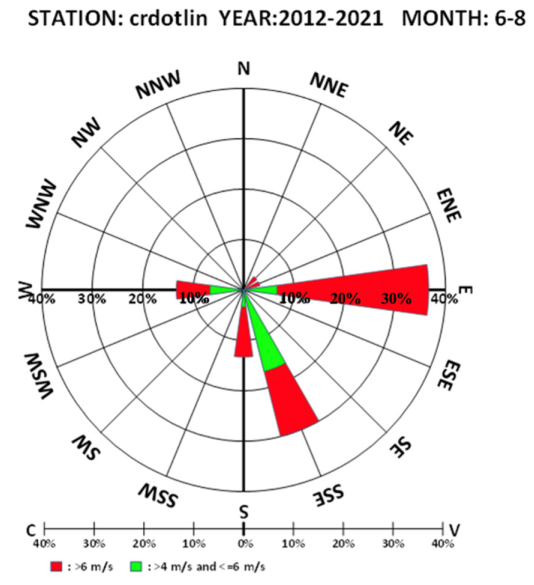 | ||
Table 4.
Z-axis plane (Z = 1.5, 45, 90.5) wind velocity simulation results.
| 1.5 m | 45 m | 90.5 m | |
|---|---|---|---|
Case 1 (No green)  | |||
| WIND ← | 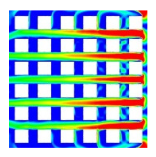 | 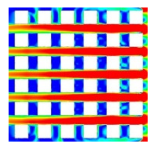 | 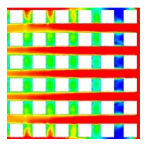 |
Case 2 (GW25% + GR75%)  | |||
| WIND ← | 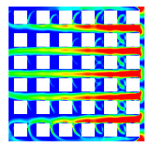 | 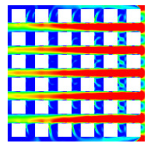 | 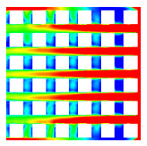 |
Case 3 (GW50% + GR50%)  | |||
| WIND ← | 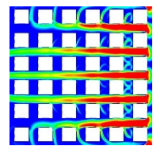 | 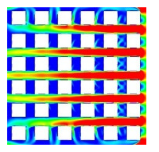 | 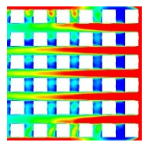 |
Case 4 (GW75% + GR25%)  | |||
| WIND ← |  | 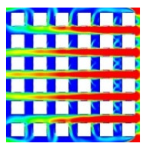 |  |
Table 5.
Z-axis plane (Z = 1.5, 45, 90.5) temperature simulation result.
| 1.5 m | 45 m | 90.5 m | |
|---|---|---|---|
Case 1 (No green) 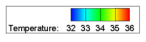 | |||
| WIND ↑ |  | 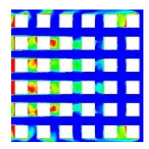 | 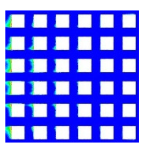 |
Case 2 (GW25% + GR75%) 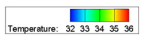 | |||
| WIND ↑ | 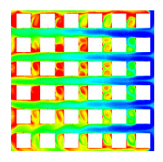 | 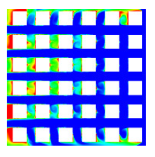 | 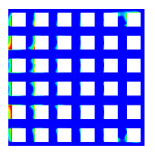 |
Case 3 (GW50% + GR50%) 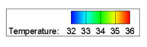 | |||
| WIND ↑ |  |  | 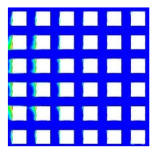 |
Case 4 (GW75% + GR25%)  | |||
| WIND ↑ |  | 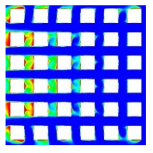 | 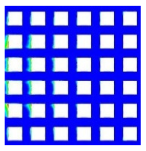 |
Disclaimer/Publisher’s Note: The statements, opinions and data contained in all publications are solely those of the individual author(s) and contributor(s) and not of MDPI and/or the editor(s). MDPI and/or the editor(s) disclaim responsibility for any injury to people or property resulting from any ideas, methods, instructions or products referred to in the content. |
© 2023 by the authors. Licensee MDPI, Basel, Switzerland. This article is an open access article distributed under the terms and conditions of the Creative Commons Attribution (CC BY) license (https://creativecommons.org/licenses/by/4.0/).
Share and Cite
MDPI and ACS Style
Su, Y.-M.; Hsu, Y.-T. Computer-Aided Simulation on the Impact of the Combination of High-Rise Building Wall and Roof Green Coverage Ratio on Urban Microclimate. Eng. Proc. 2023, 55, 83. https://doi.org/10.3390/engproc2023055083
AMA Style
Su Y-M, Hsu Y-T. Computer-Aided Simulation on the Impact of the Combination of High-Rise Building Wall and Roof Green Coverage Ratio on Urban Microclimate. Engineering Proceedings. 2023; 55(1):83. https://doi.org/10.3390/engproc2023055083
Chicago/Turabian StyleSu, Ying-Ming, and Yu-Ting Hsu. 2023. "Computer-Aided Simulation on the Impact of the Combination of High-Rise Building Wall and Roof Green Coverage Ratio on Urban Microclimate" Engineering Proceedings 55, no. 1: 83. https://doi.org/10.3390/engproc2023055083