Proceeding Paper

Assessment of the Sensitivity of Daily Maximum and Minimum Air Temperatures of Egypt to Soil Moisture Status and Land Surface Parameterization Using RegCM4 †

by
Samy Ashraf Anwar
* and
Sally Mahmoud Mostafa
Egyptian Meteorological Authority, Qobry EL-Kobba, Cairo P.O. Box 11784, Egypt
*
Author to whom correspondence should be addressed.
Presented at the 4th International Electronic Conference on Applied Sciences, 27 October–10 November 2023; Available online: https://asec2023.sciforum.net/.
Eng. Proc. 2023, 56(1), 115; https://doi.org/10.3390/ASEC2023-15353
Published: 26 October 2023
(This article belongs to the Proceedings of The 4th International Electronic Conference on Applied Sciences)

Abstract

:
Daily maximum air temperature (TMX) and daily minimum air temperature (TMN) are sensitive to the soil moisture status and land surface parameterization. However, this point has not been addressed in arid regions (e.g., Egypt). To address this issue, four 13-year simulations were conducted within the framework of the regional climate model (RegCM4). The first two considered the soil moisture status (bare soil versus global satellite soil moisture product; ESACCI). The other two considered the sensitivity to the two land surface schemes coupled to the RegCM4: Biosphere Atmosphere Transfer System (BATS) and version 4.5 of the community land model (CLM45). In all simulations, the RegCM4 was downscaled using the Era-Interim reanalysis with 25 km grid spacing. The simulated TMX and TMN were evaluated with respect to the Climate Research Unit (CRU) and station data. The results showed that switching from bare soil to ESACCI has a considerable influence on the simulated TMX and TMN. Compared to the CRU, the CLM45 outperforms the BATS on the coasts of the Mediterranean Sea and Red Sea (in terms of the TMX) and in the inland regions (in terms of the TMN). When compared with the station data, the behavior of the BATS/CLM45 varies with the location and month. Despite the noted biases, the RegCM4 can be recommended for future studies concerning the seasonal forecast or climate change of Egypt when it is configured with the CLM45 land surface model and initialized with the ESACCI satellite product.
Keywords:
BATS; CLM45; Egypt; ESACCI; RegCM4

1. Introduction

Soil moisture plays an important role in controlling the terrestrial hydrological cycle as well as the whole climate system [1,2]. Indeed, soil moisture controls the surface energy balance and climate through changes in the water vapor transferred to the atmosphere from soil evaporation and vegetation transpiration [3]. As a result, it determines the total evapotranspiration budget and eventually the degree of cooling/warming of the atmosphere. Additionally, soil moisture can affect the status of the vegetation cover (represented by the leaf area index) and the terrestrial carbon fluxes through changes in the photosynthesis rate and leaf carbon. In fact, the aforementioned effects of the soil moisture (either on the surface climate or the terrestrial carbon fluxes) have been documented using regional climate models.
For instance, the authors of [3] used the International Center of Theoretical Physics regional climate model (RegCM4 [4]) to investigate the possible effects of the soil moisture changes (represented by the runoff schemes of the version 4.5 of the community land model; CLM45 [5]) on the surface energy balance and climate with respect to various reanalysis products. They reported that soil moisture changes considerably affect the total evapotranspiration budget and therefore the surface climate (represented by the mean air temperature and the total surface precipitation). In fact, the influence of soil moisture on the daily air maximum and minimum air temperature has been investigated in various regions across the globe such as Australia [6].
The role of the land surface parameterization (in simulating the surface climate) has been investigated using regional climate models (e.g., RegCM4). Indeed, the land surface parameterization differs in representing the soil moisture dynamics as well as the initialized values of the soil moisture of each scheme. For instance, the authors of [7] reported that version 3.5 of the community land model (CLM35 [8]) is initially wetter than the Biosphere Atmosphere Transfer System (BATS [9]). Furthermore, the simple representation of the BATS (compared to the CLM35) leads to a higher soil moisture accumulated on the surface and therefore lower temperature and higher total surface precipitation than the one noted in the CLM35. Additionally, they reported that the CLM35 outperforms the BATS in the comparison made with reanalysis products. The same behavior has been noted in the comparison between the BATS and the CLM45 [10,11].
It should be noted that the aforementioned literature reviews investigated the possible influences of the soil moisture changes either by different land surface schemes or different runoff schemes of the same land surface model in wet regions (i.e., with a surplus of soil moisture). Concerning the possible influences in arid regions (e.g., Middle East and North Africa; MENA), the authors of [12] reported that the representation of the soil moisture changes (by adapting different land surface schemes) lead to a different response of the radiation budget or surface climate variables. They concluded that caution must be taken to ensure the appropriate selection of a suitable land surface scheme for the regional climate simulation.
However, the sensitivity of the surface climate to the status of the soil moisture initialization (i.e., bare soil versus satellite soil moisture product) in arid regions has not been examined till the present day. Additionally, the sensitivity of the surface climate to different land surface schemes (considering the satellite soil moisture product as an initial condition of the soil moisture) has not been addressed yet in arid regions (e.g., Egypt). Therefore, the present study aims to achieve the following:
  • Examine the sensitivity of the daily maximum air temperature (TMX) and daily minimum air temperature (TMN) of Egypt to the status of the soil moisture initialization (bare soil versus the ESACCI global satellite soil moisture product [13,14]) using the RegCM4.
  • Study the role of land surface parameterization (BATS versus CLM45) in simulating the daily TMX and TMN of Egypt with respect to the Climate Research Unit (CRU [15]) considering the ESACCI as an initial condition of the soil moisture.
  • Evaluate the climatological annual cycle of the TMX and TMN with respect to the station observations.
Section 2 describes the materials and methods used in this study. Section 3 presents the results of the study. Section 4 provides the discussion and conclusion.

2. Materials and Methods

2.1. Model Description and Experiment Design

In the present study, we used version 4.7 of the International Center of Theoretical Physics regional climate model (RegCM [4]). The authors of [4] reported that RegCM4 includes an improved version of the physical parameterization compared with its preceding version (RegCM3 [16]). The RegCM4 adopts its dynamical core from the fifth version of Pennsylvania State University Mesoscale Model (MM5 [17]). Recently, a new non-hydrostatic core has been implemented in the RegCM’s code (RegCM5 [18]). In addition, the RegCM4′s code has been modified to read the ESACCI global satellite soil moisture product as an initial condition of the soil moisture. Concerning the land surface parameterization, three land surface models have been coupled to the RegCM4 to control the lower initial condition of the atmosphere: 1—BATS [9]; 2—CLM35 [8]; and 3—CLM45 [5]. For the purpose of the present study, only the BATS and the CLM45 were selected.
The RegCM4′s domain was centered at latitude 27° and longitude 30° with 60 points in the zonal and meridional directions. Additionally, the RegCM4 was downscaled by the Era-Interim reanalysis of 1.5 degrees (EIN15) with 25 km horizontal grid spacing. The authors of [19] reported that the RegCM4 provides a similar result either if it is downscaled by the EIN15 or the NCEP/NCAR reanalysis version 2 of 2.5 degrees (NNRP2 [20]). Therefore, EIN15 was used in the present study to provide the lateral boundary condition and the sea surface temperature.
To address the purpose of the present study, four 13-year simulations (1998–2010) were conducted. The four simulations were divided into two groups. The first group considered the sensitivity of the TMX and TMN to the status of the initialized soil moisture either from the bare soil or from the ESACCI satellite soil moisture product. On the other hand, the second group discusses the sensitivity of the simulated TMX/TMN to the land surface parameterization (BATS and CLM45). It is important to mention that in the second group, the RegCM4 was initialized with the ESACCI for two reasons: (1) the performance of the CLM45 is similar to the BATS when the RegCM4 is initialized from bare soil (not shown) and (2) the performance of the BATS/CLM45 differs with the initialized values of the soil moisture as reported by [11].
In the four simulations, the first three years were considered as a spin-up; thus so the simulated soil moisture can approach an equilibrium state based on [19]. Figure 1 shows the interpolated ESACCI on the curvilinear grid of the RegCM4.

2.2. Observational Data

To evaluate the RegCM4 model performance, various sources of datasets have been utilized, and they are as follows:
  • Climate Research Unit (CRU [15]): It was used to evaluate the simulated TMX and TMN on a regional scale over the period of 2001–2010. Basically, CRU is based on upscaling of the meteorological observations across the globe and then interpolates the meteorological variables over the land units on a grid of 0.5 × 0.5 degrees grid spacing. CRU was considered in the present study because it is available over a long period starting from 1901 to 2022. Additionally, CRU has no missed values over the selected domain. For the purpose of the present study, CRU was bilinearly interpolated on the RegCM4 curvilinear grid based on [21]. In this study, the last version (4.07) of the CRU was used.
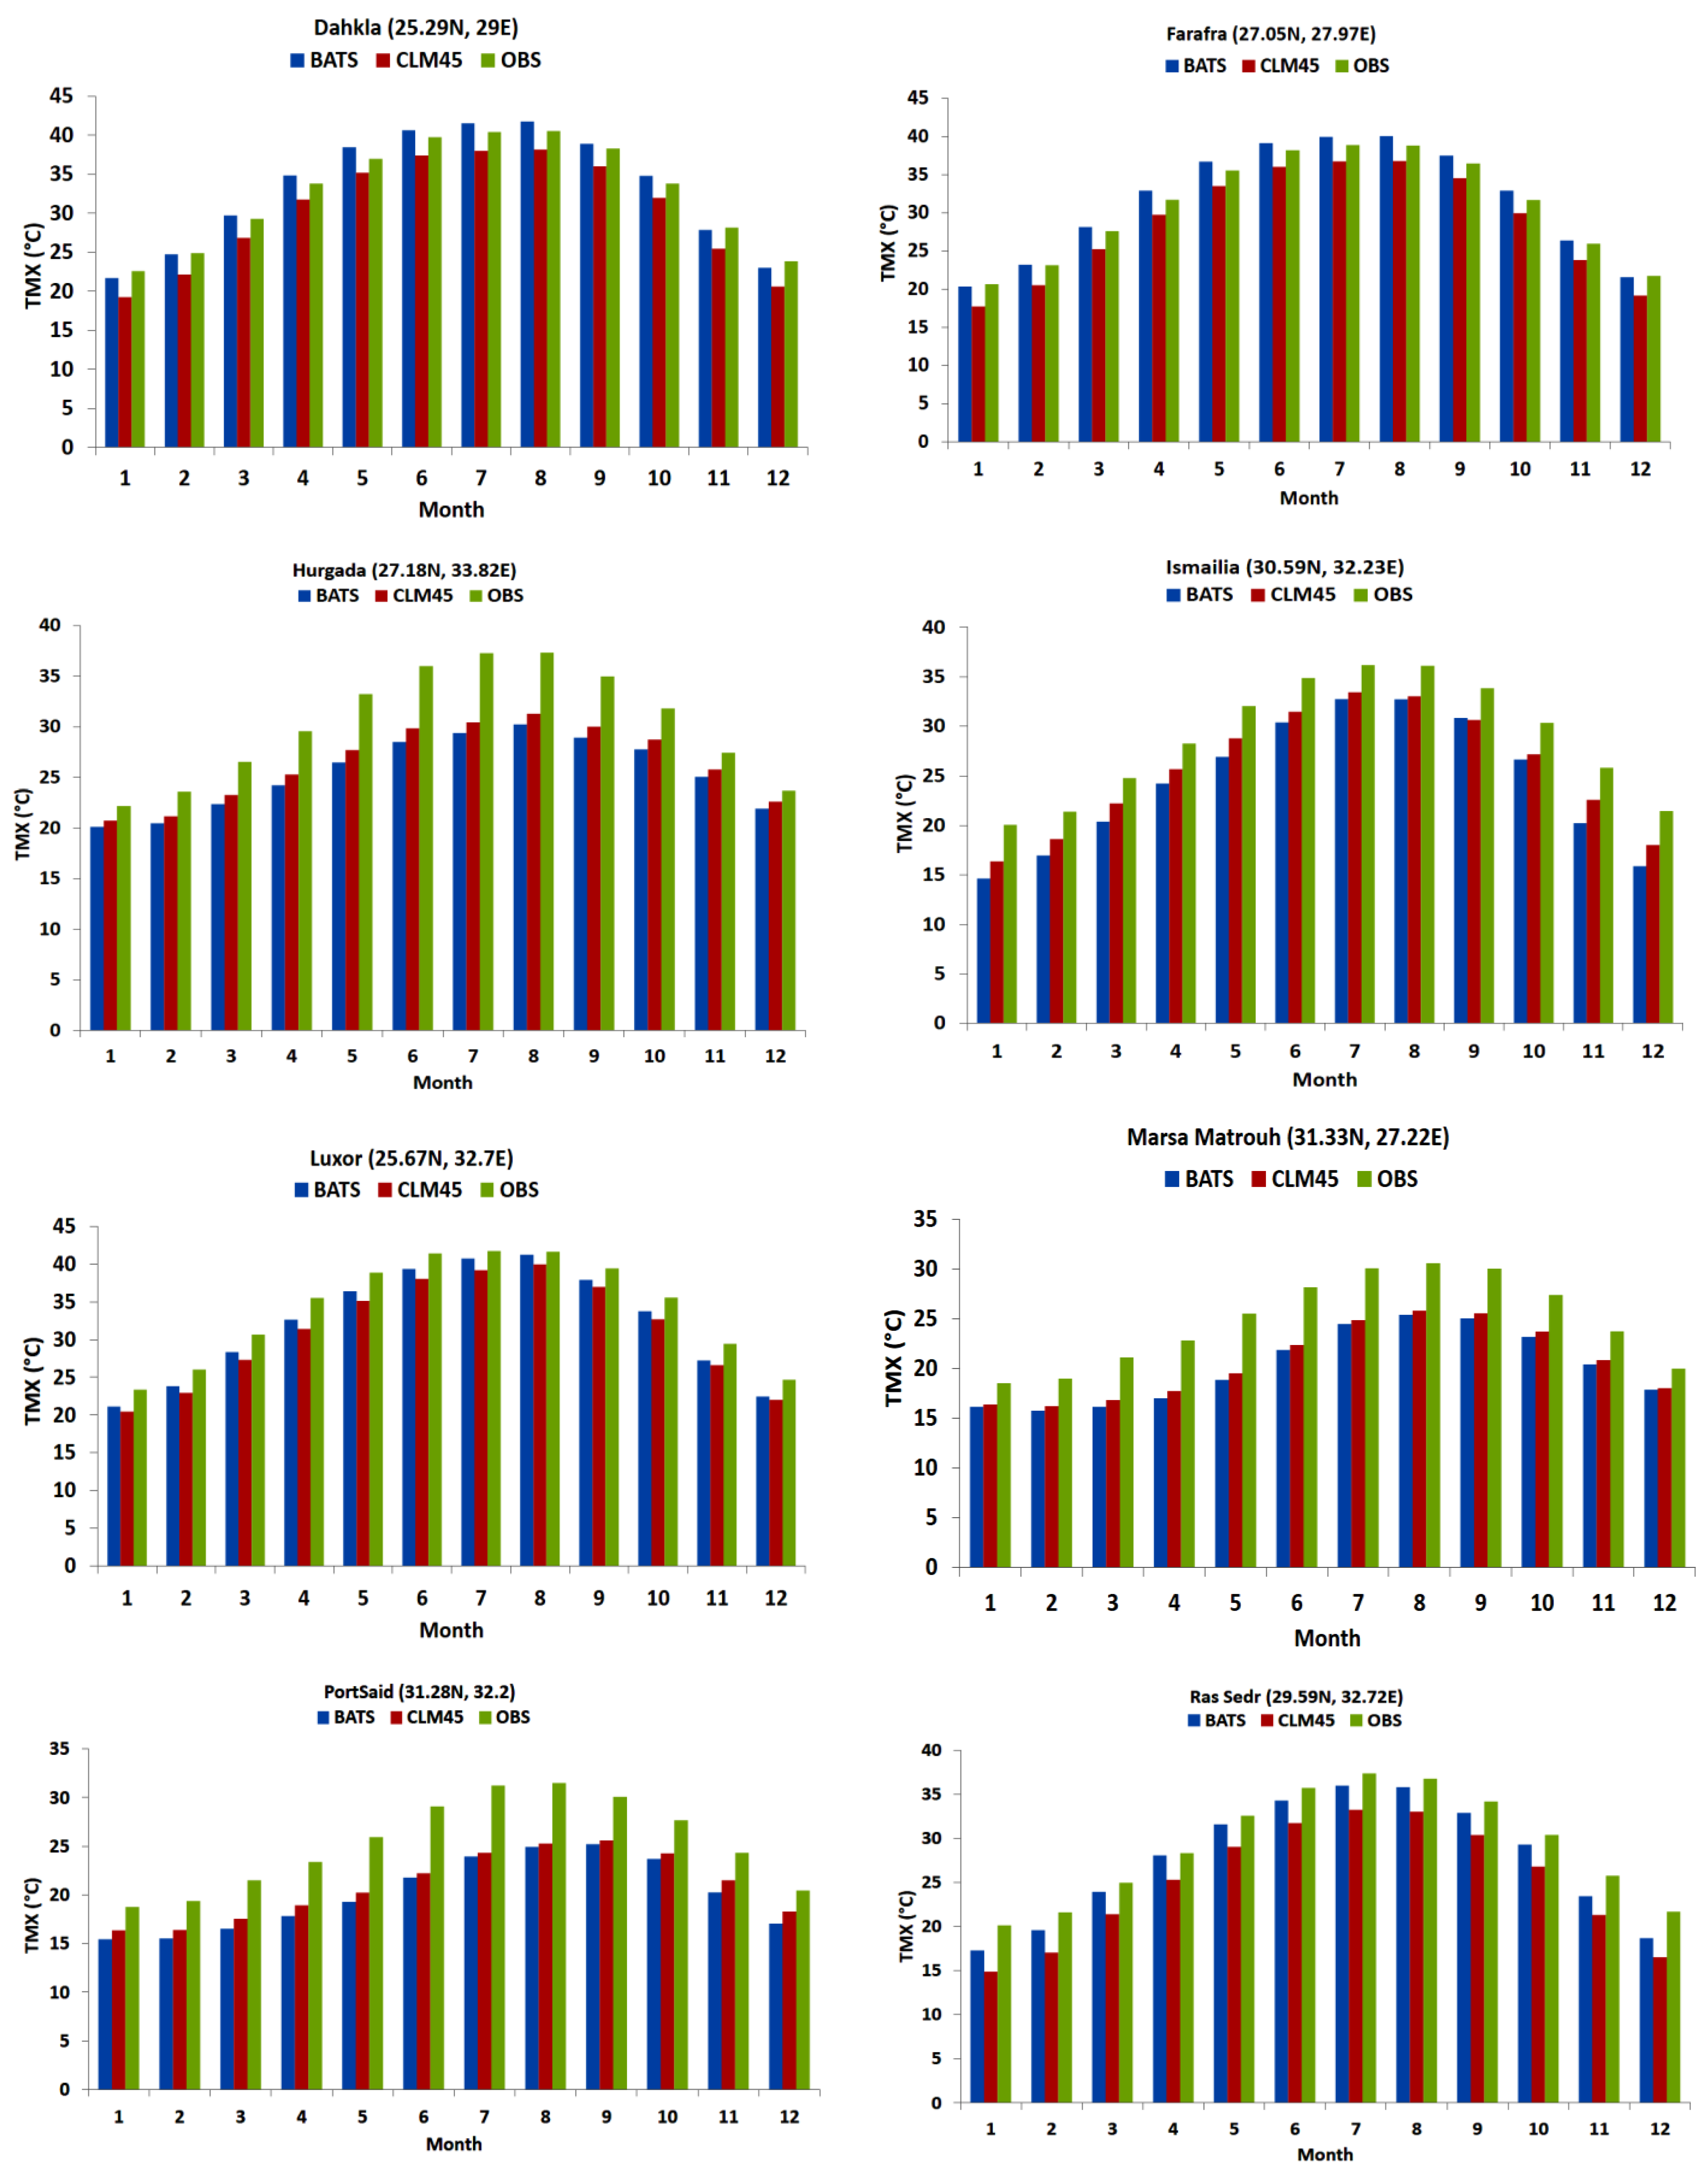
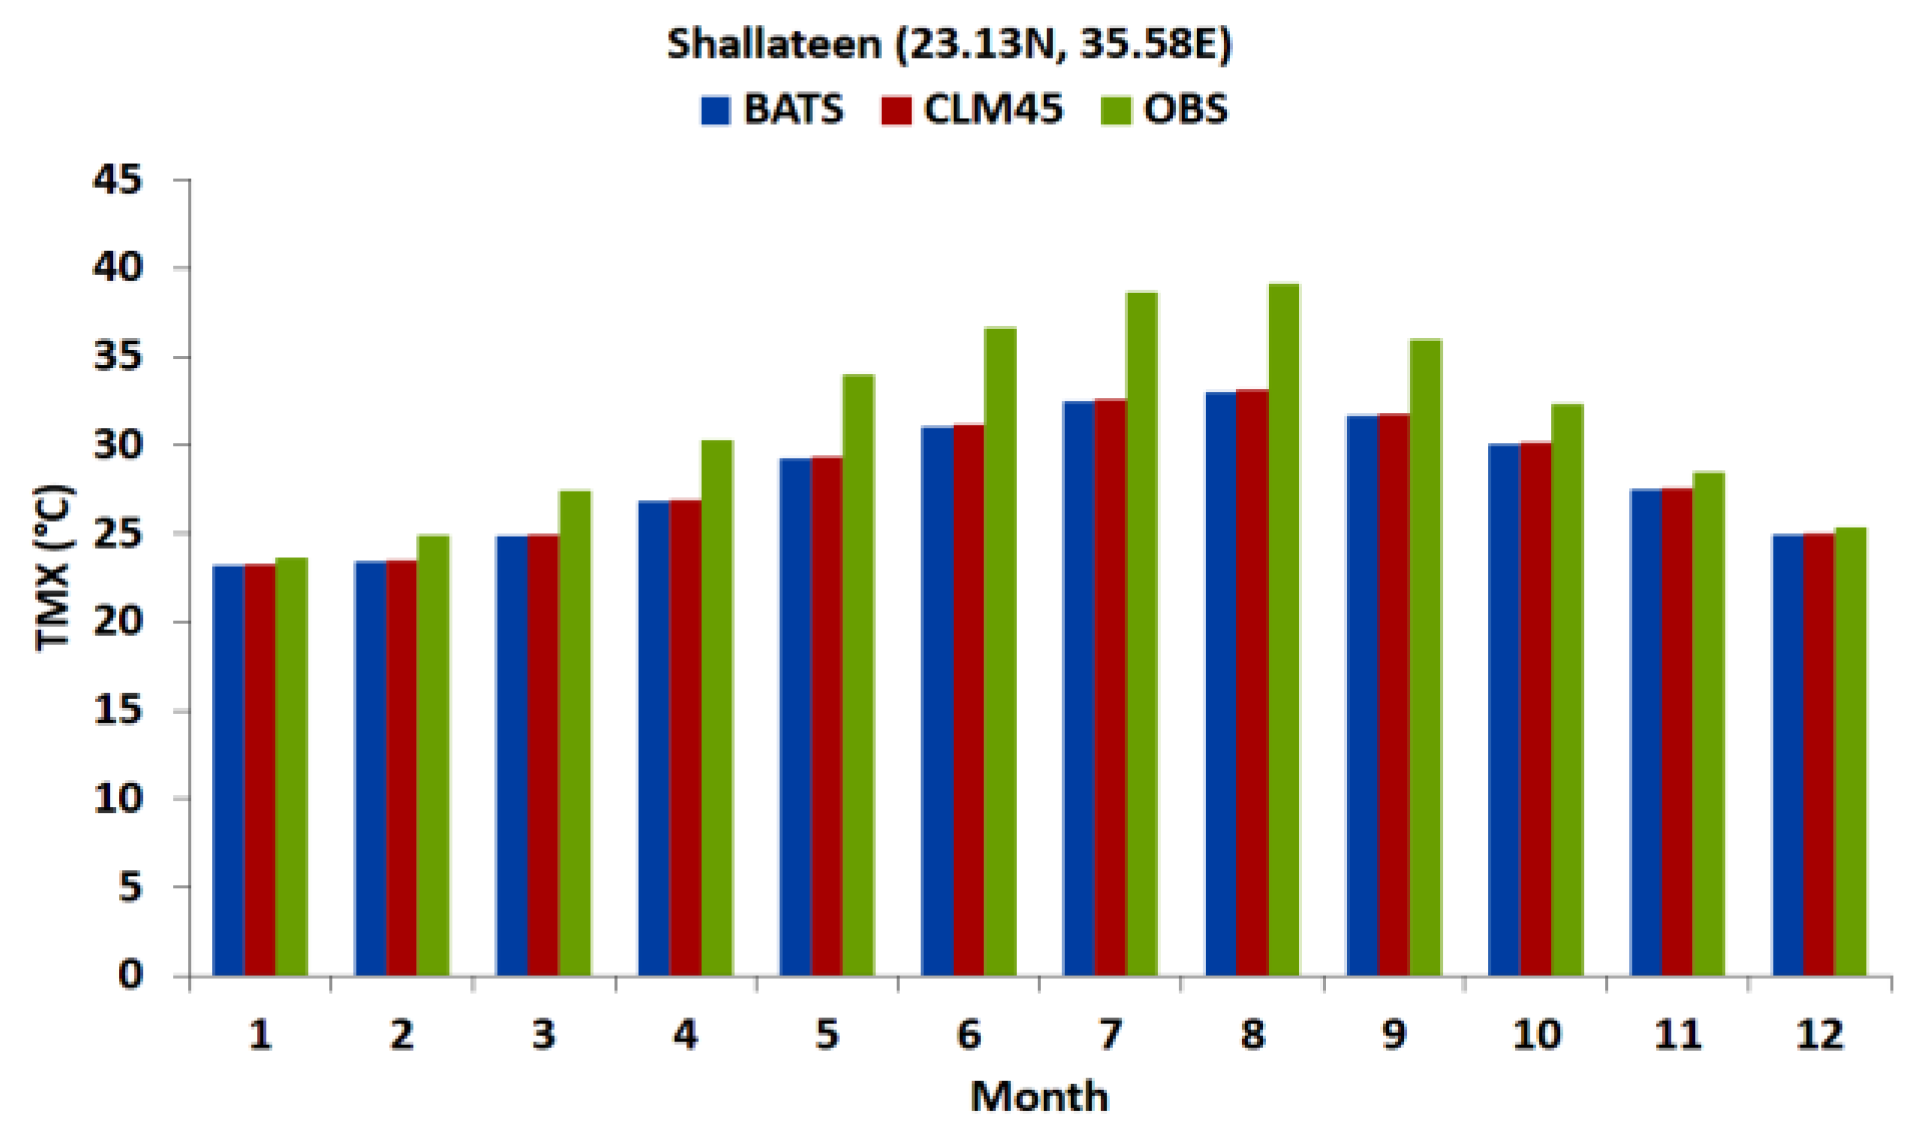
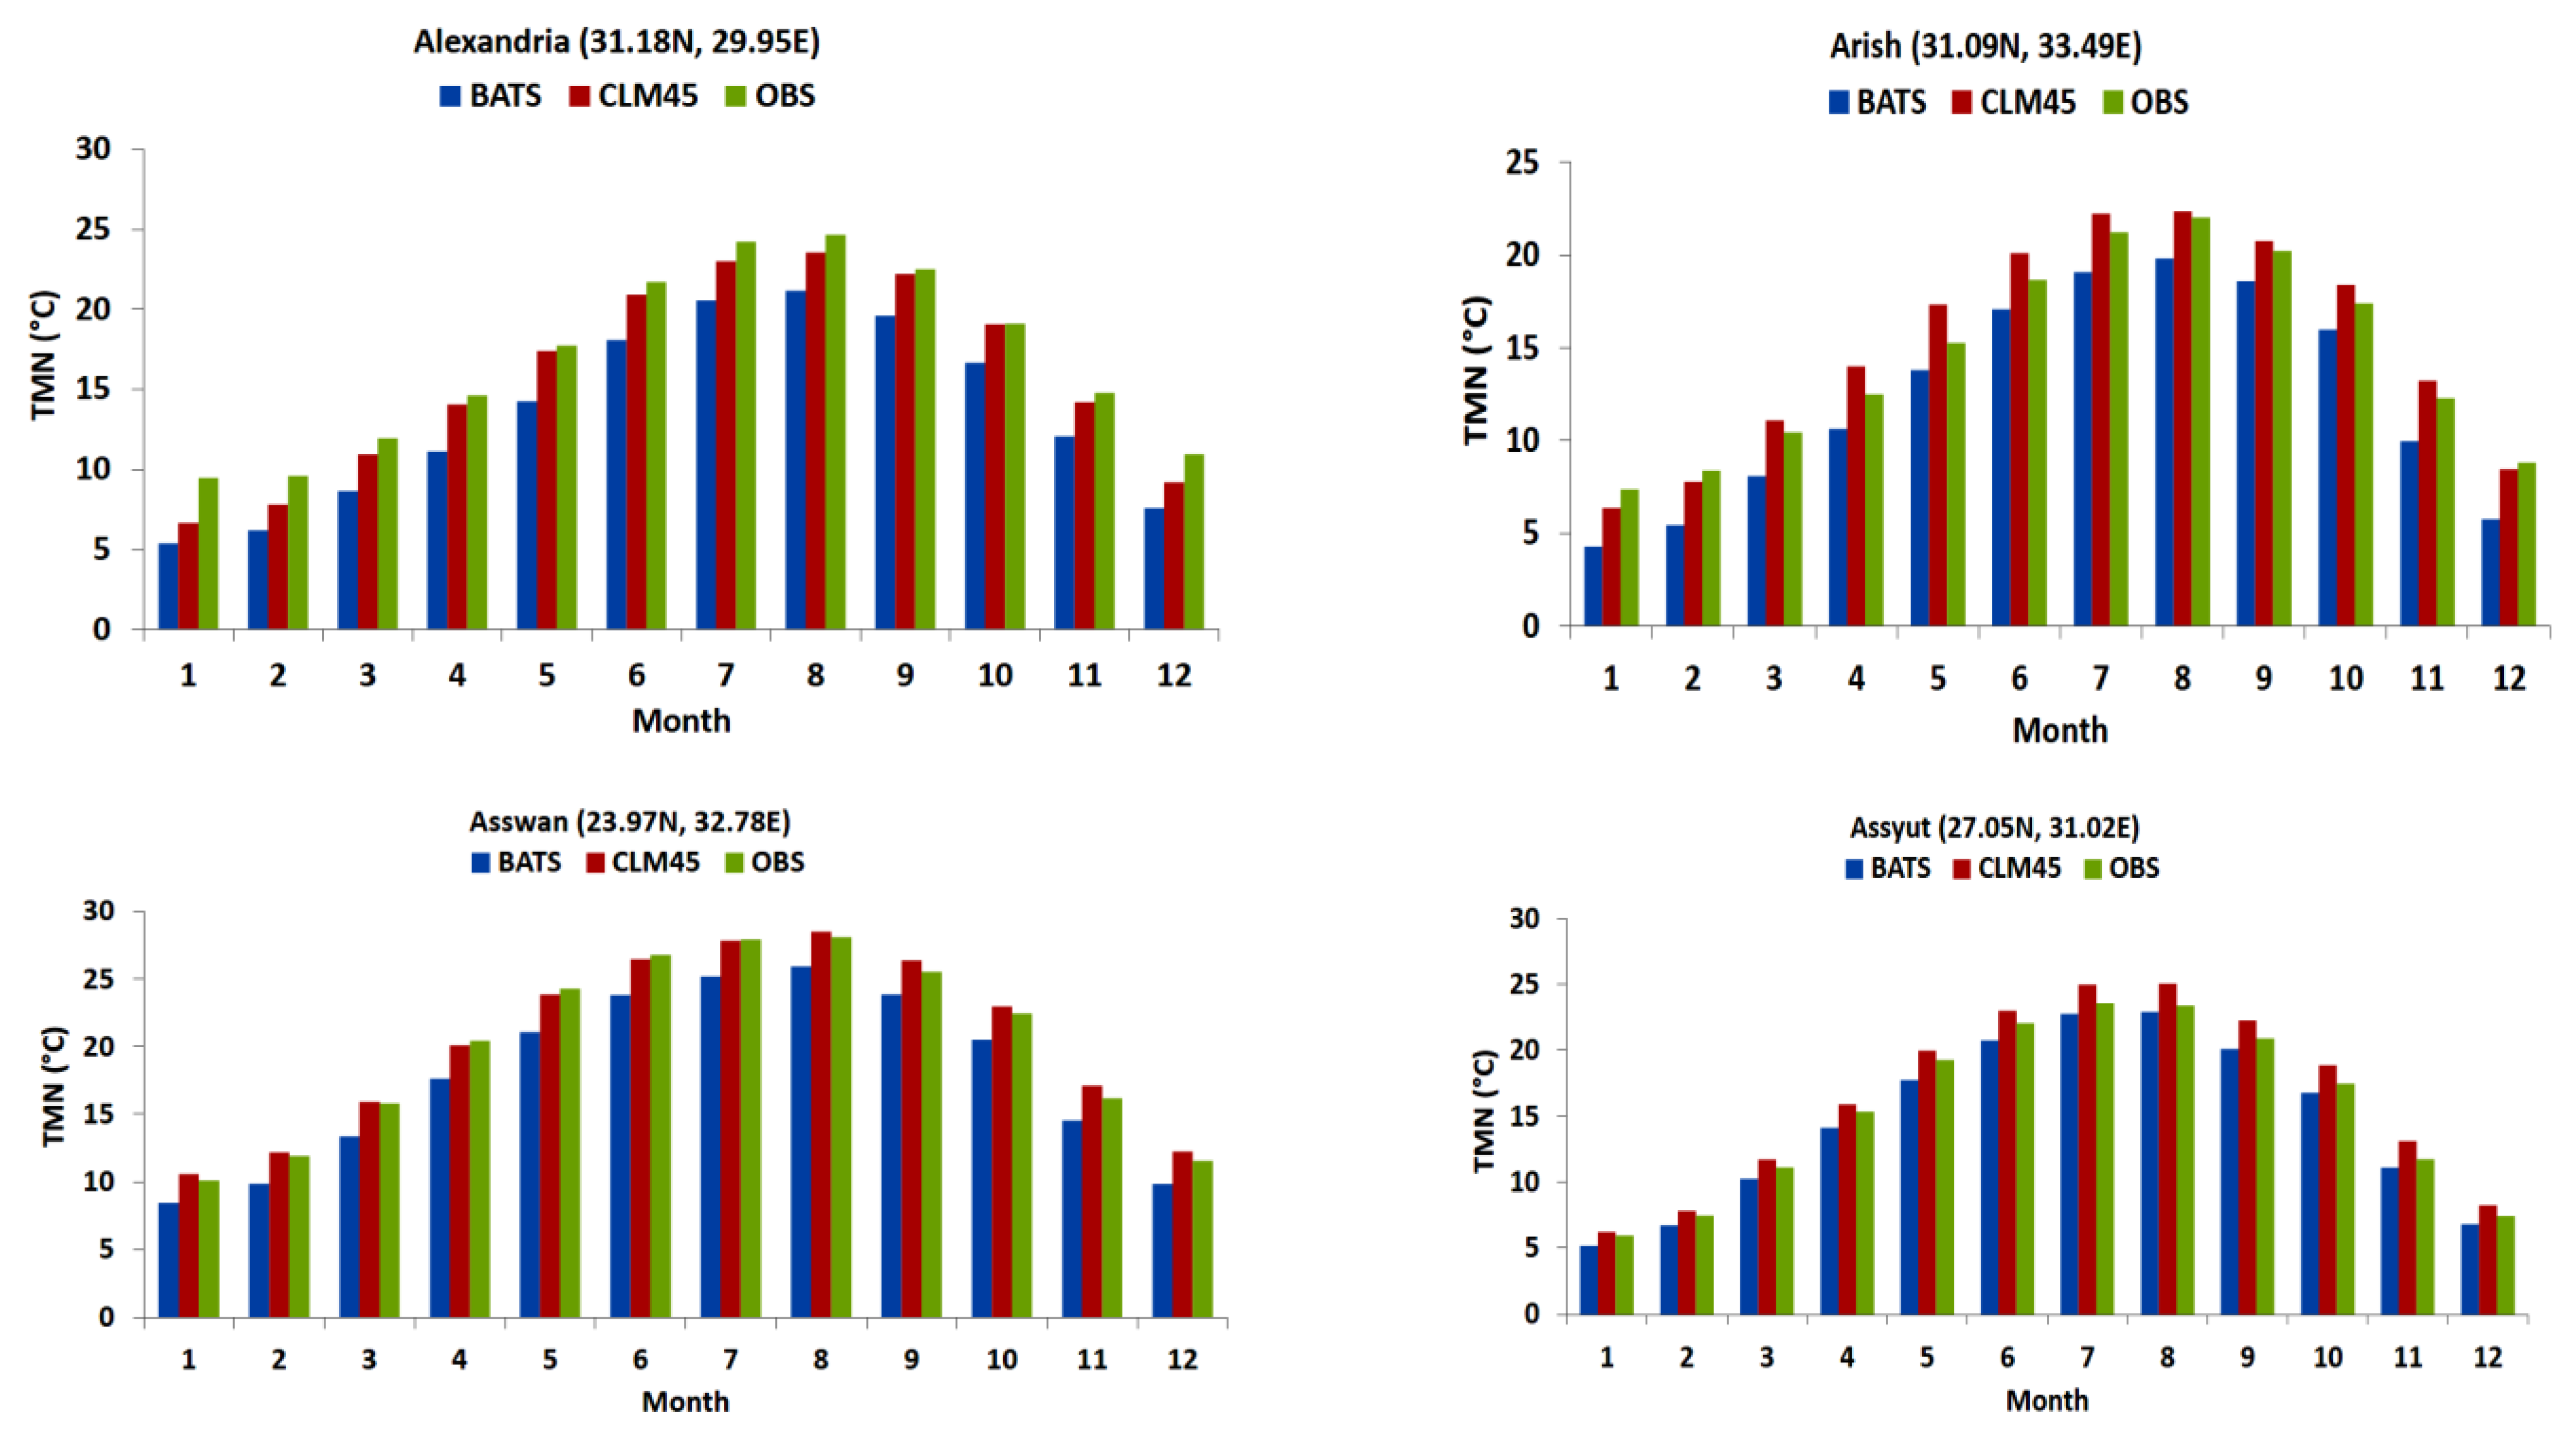
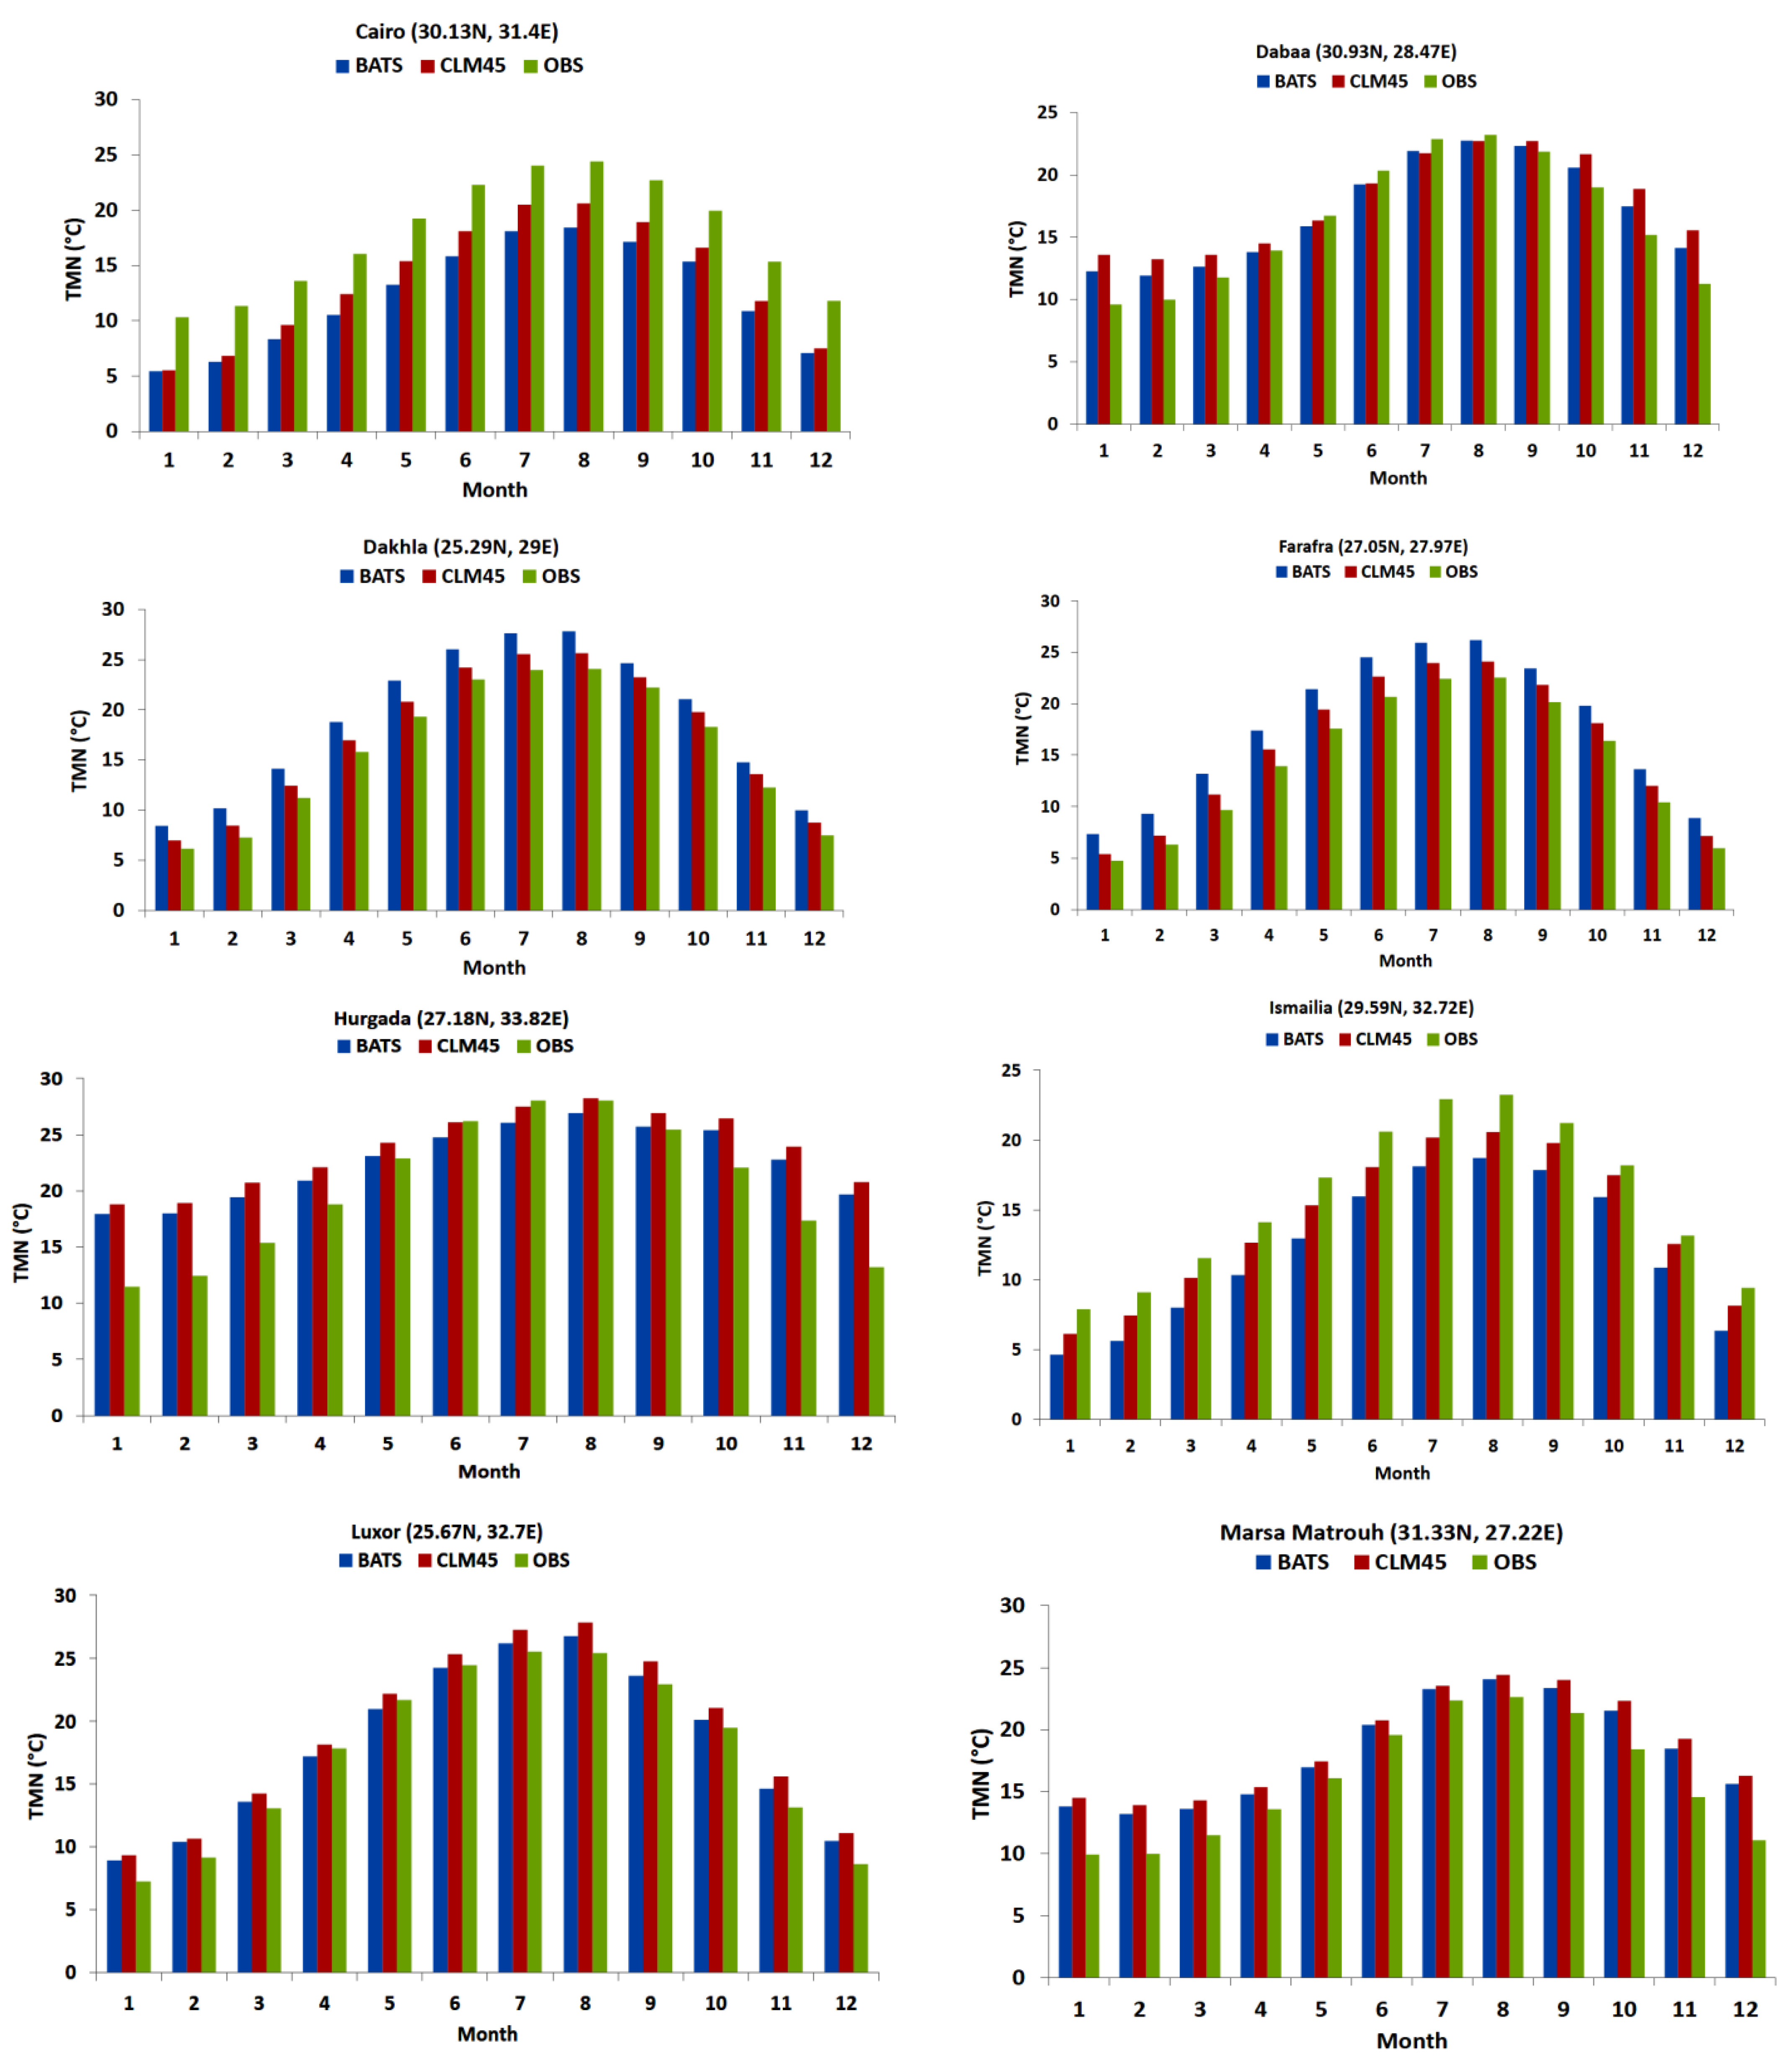
  • Station observation (OBS): The monthly average of the TMX and TMN were collected for fifteen stations, representing different climate zones of Egypt over the period of 2001–2010. Table 1 shows the station coordinates, world meteorological organization (WMO) ID and elevation above mean sea level (in meters). It should be noted that the climatology (of each month) was calculated to produce the climatological annual cycle of the TMX/TMN (to evaluate the RegCM4 performance at each location).

3. Results

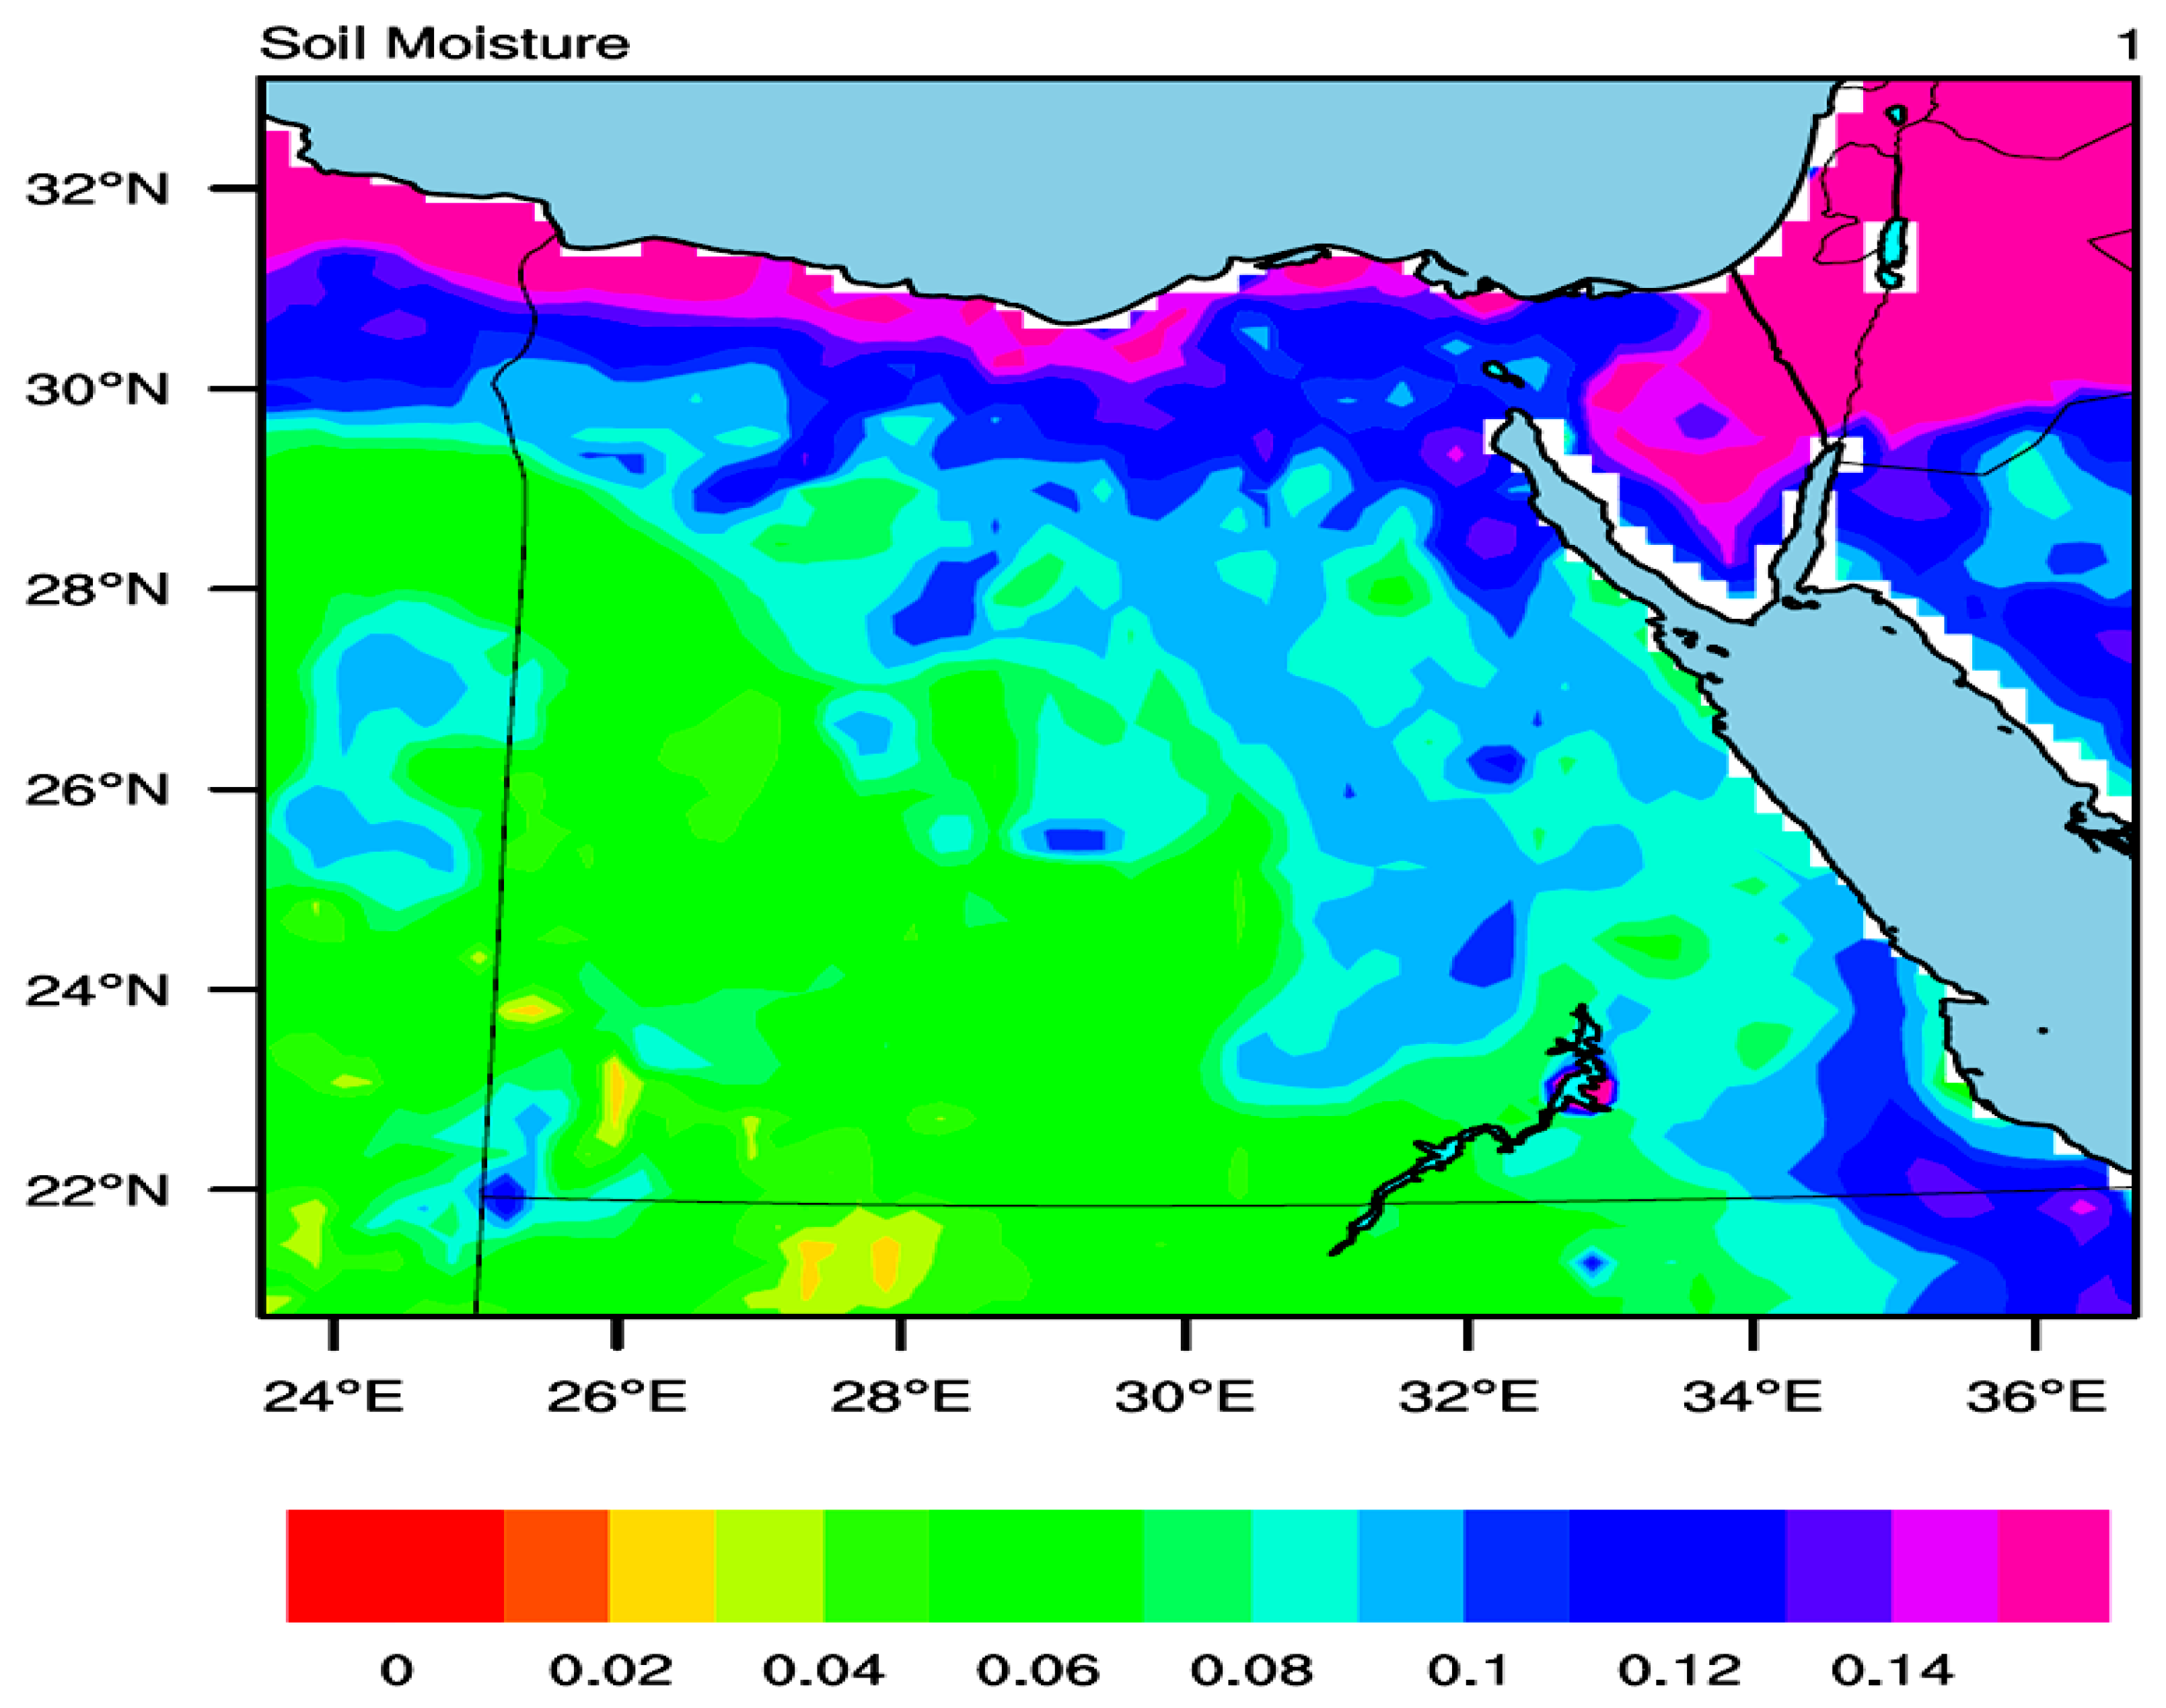
3.1. Soil Moisture Initialization

To understand how the simulated TMX/TMN is sensitive to the initialized soil moisture (ESACCI relative to bare soil), a diagnostic analysis was conducted between the bare soil (NoMois) and ESACCI (Mois). The significant difference between Mois and NoMois was calculated for each grid point using Student t-test with α equal to 5%. Figure 2 shows the simulated total albedo (AL), surface upward short−wave radiation (RSUS), surface net short−wave radiation (RSNS), and global incident solar radiation (RSDS). From Figure 2, it can be noted that switching between bare soil and ESACCI imposes a notable influence on the aforementioned variables. For instance, the Mois has a lower AL than the NoMois over the majority of the land units (by 10%) except for the Delta region and river Nile (where no change has been noticed; Figure 2a–c). As a result, the Mois has a lower RSUS (by 10–30 W m−2) than the NoMois (see Figure 2d–f).
Additionally, the Mois has a higher RSNS (by 10–30 W m−2) than the NoMois as indicated in Figure 2g–i. Therefore, it can be noted that switching between bare soil and ESACCI induces a warming effect (as will be investigated in the upcoming sections). This behavior was noted although the soil moisture in Egypt has values ranging between 0 and 0.15 (see Figure 1). This means that the inclusion of the ESACCI (as an initial condition of the soil moisture) has a considerable effect in the arid regions (as in this study). Finally, the Mois has a higher RSDS (by ~5 W m−2) than the NoMois (Figure 2j–l). This means that switching between NoMois and Mois has no considerable effect on the simulated RSDS and therefore the PET as reported by [21]. Besides the noted effect on the radiation variables, the influence of the soil moisture initialization extends to include the planetary boundary layer height (PBL) and the sensible heat flux (SHF).
From Figure 3, it can be observed that the Mois has a higher PBL (by 30–110 m) than the NoMois (see Figure 3a–c). Such behavior can be attributed to the fact that RSNS increases by switching from bare soil to initialization with the ESACCI satellite based product. As a result, the Mois caused an increase in the SHF (by 15–40 W m−2) relative to the NoMois. In Figure 4, the influence of the soil moisture initialization on the near surface relative humidity (RH), TMX, and TMN was discussed. From Figure 4, it can be noticed that the Mois decreases the RH (by 10–30%) compared to the NoMois (Figure 4a–c). Such behavior can be explained by the fact that the Mois shows a higher RSNS (see Figure 2g–i) than that of the NoMois. As a result, the Mois disperses water vapor more than the NoMois.
Concerning the TMX, the Mois is warmer than the NoMois (by 1–3 °C; Figure 4d–f) and can attributed to two reasons: (1) the Mois has a higher RSNS than the NoMois and (2) the Mois has a lower RH than the NoMois. For the TMN, the Mois is warmer than the NoMois, particularly in the region of 22–24° N (by 1–6 °C; Figure 4g–i). From Figure 4, it can be also noted that switching from bare soil to ESACCI satellite product induces a considerable effect on TMN more than TMX.

3.2. Land Surface Parameterization

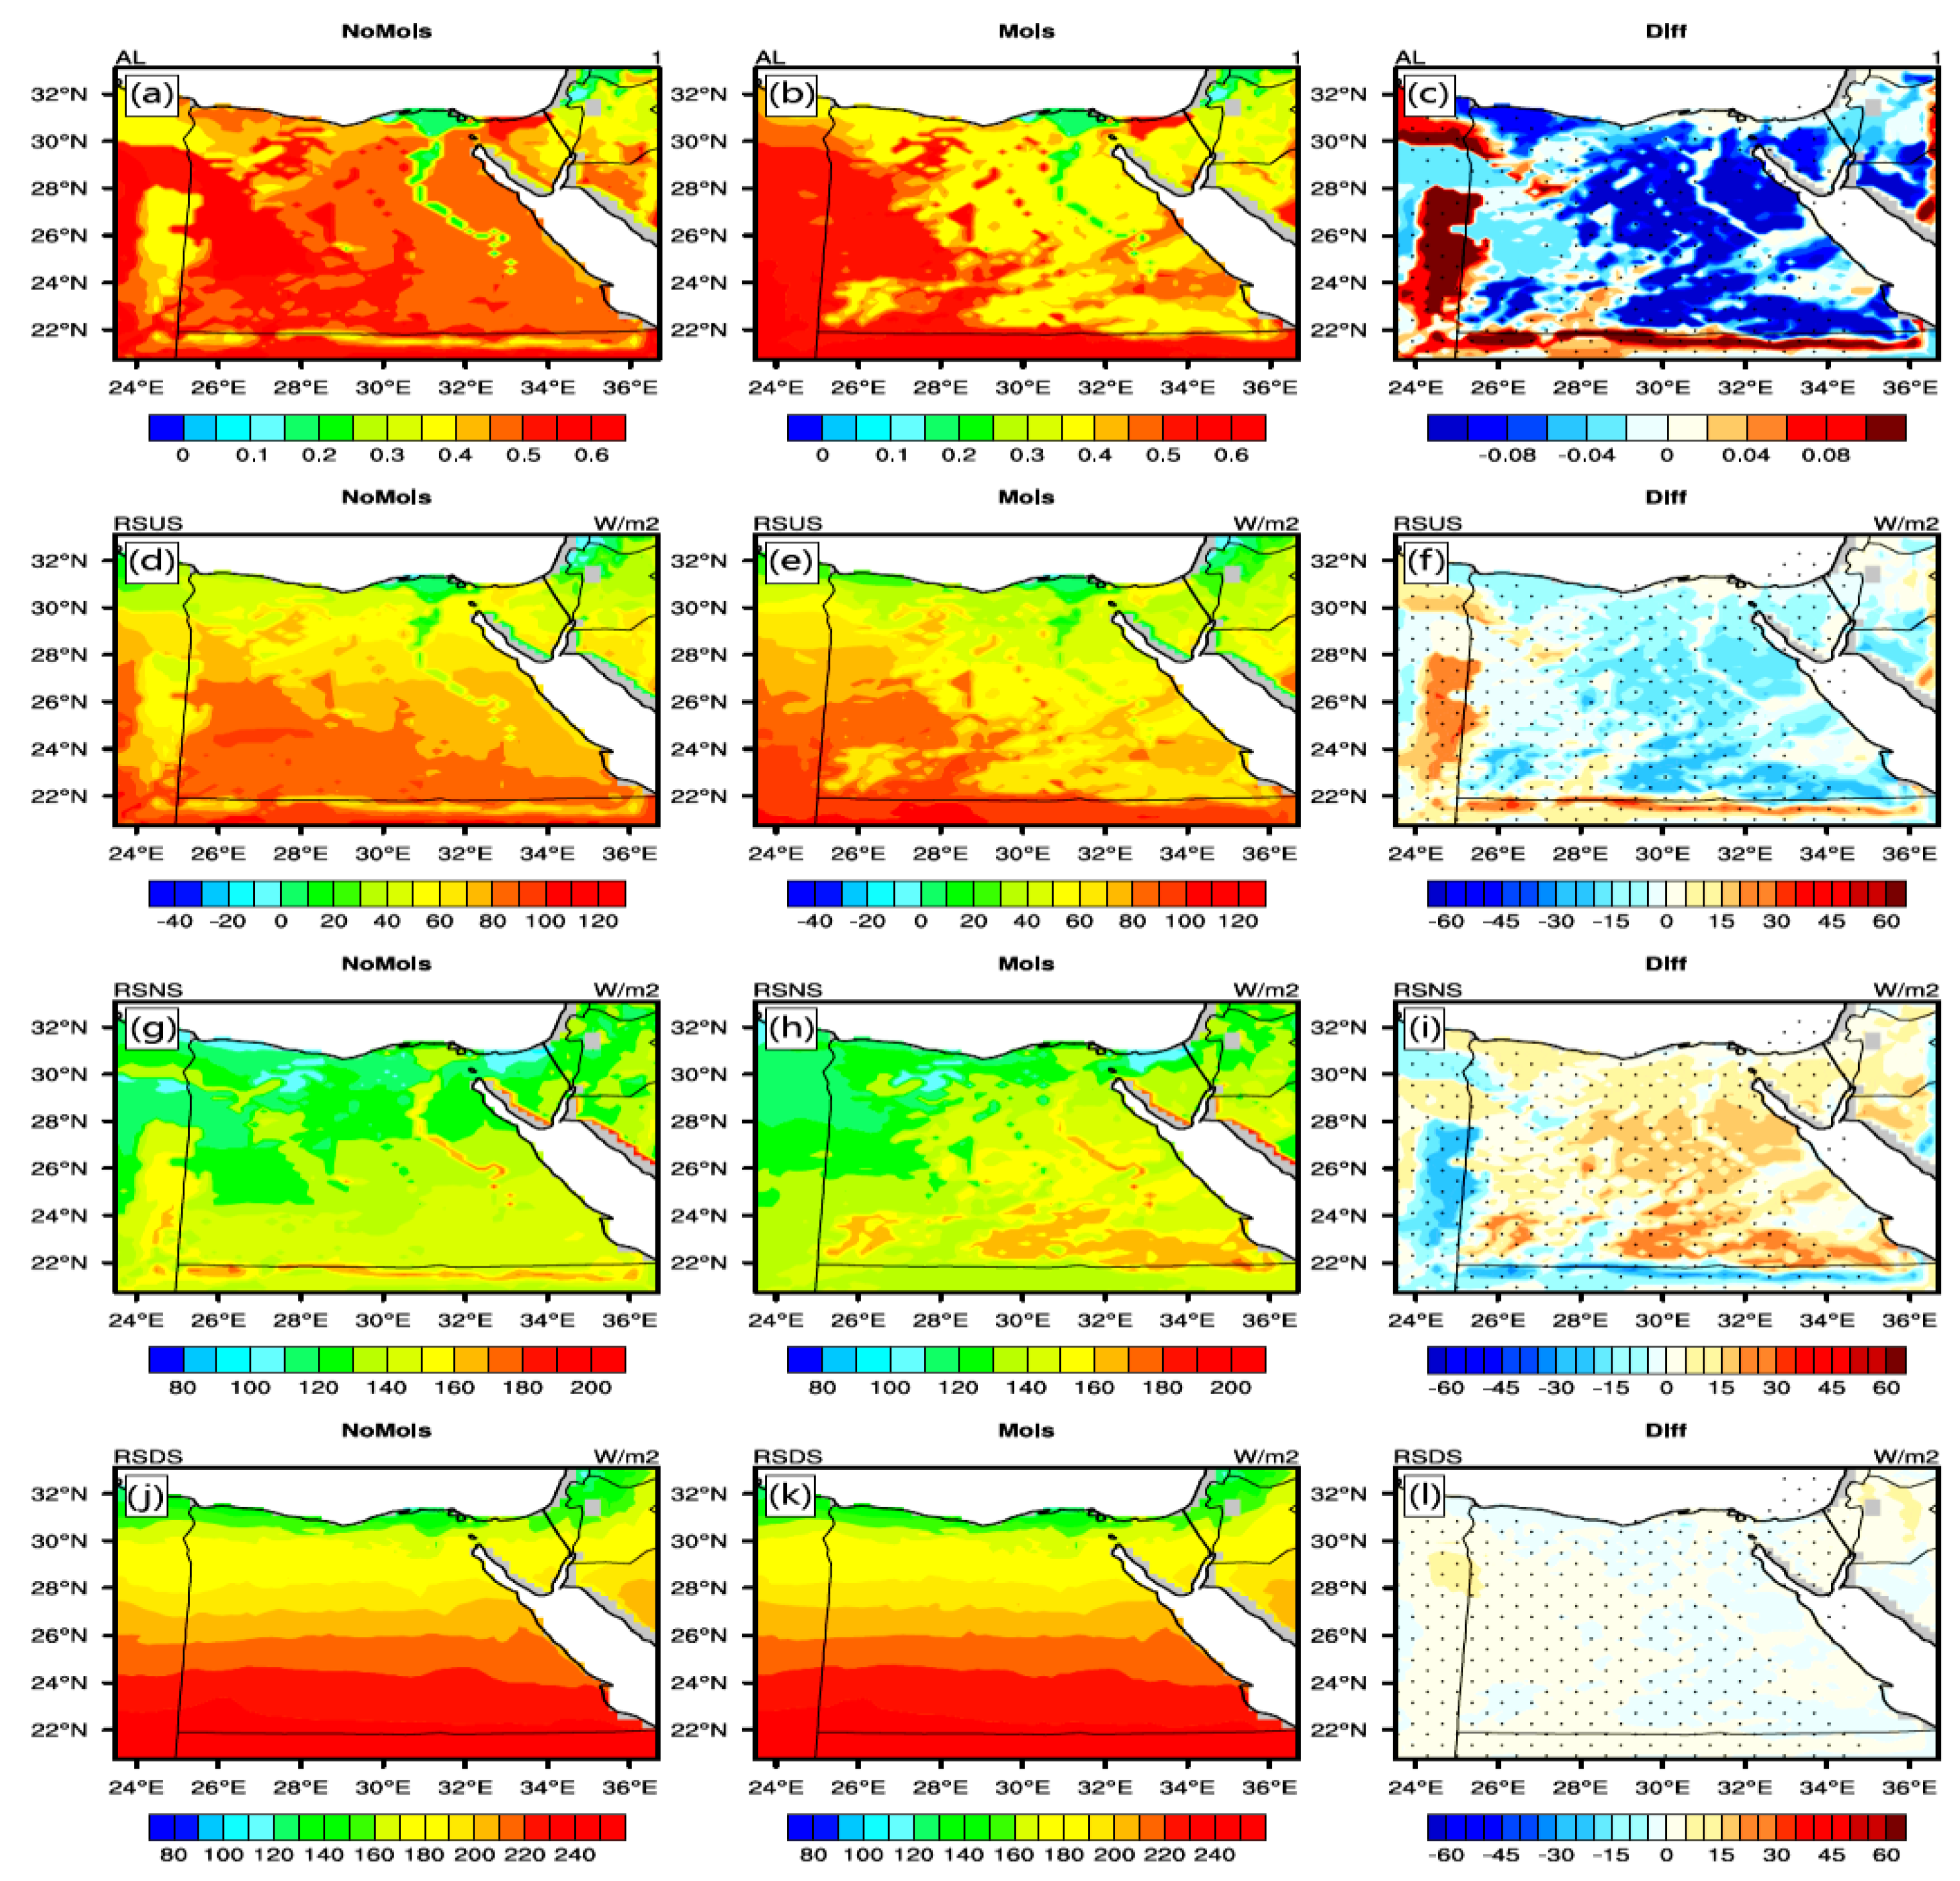
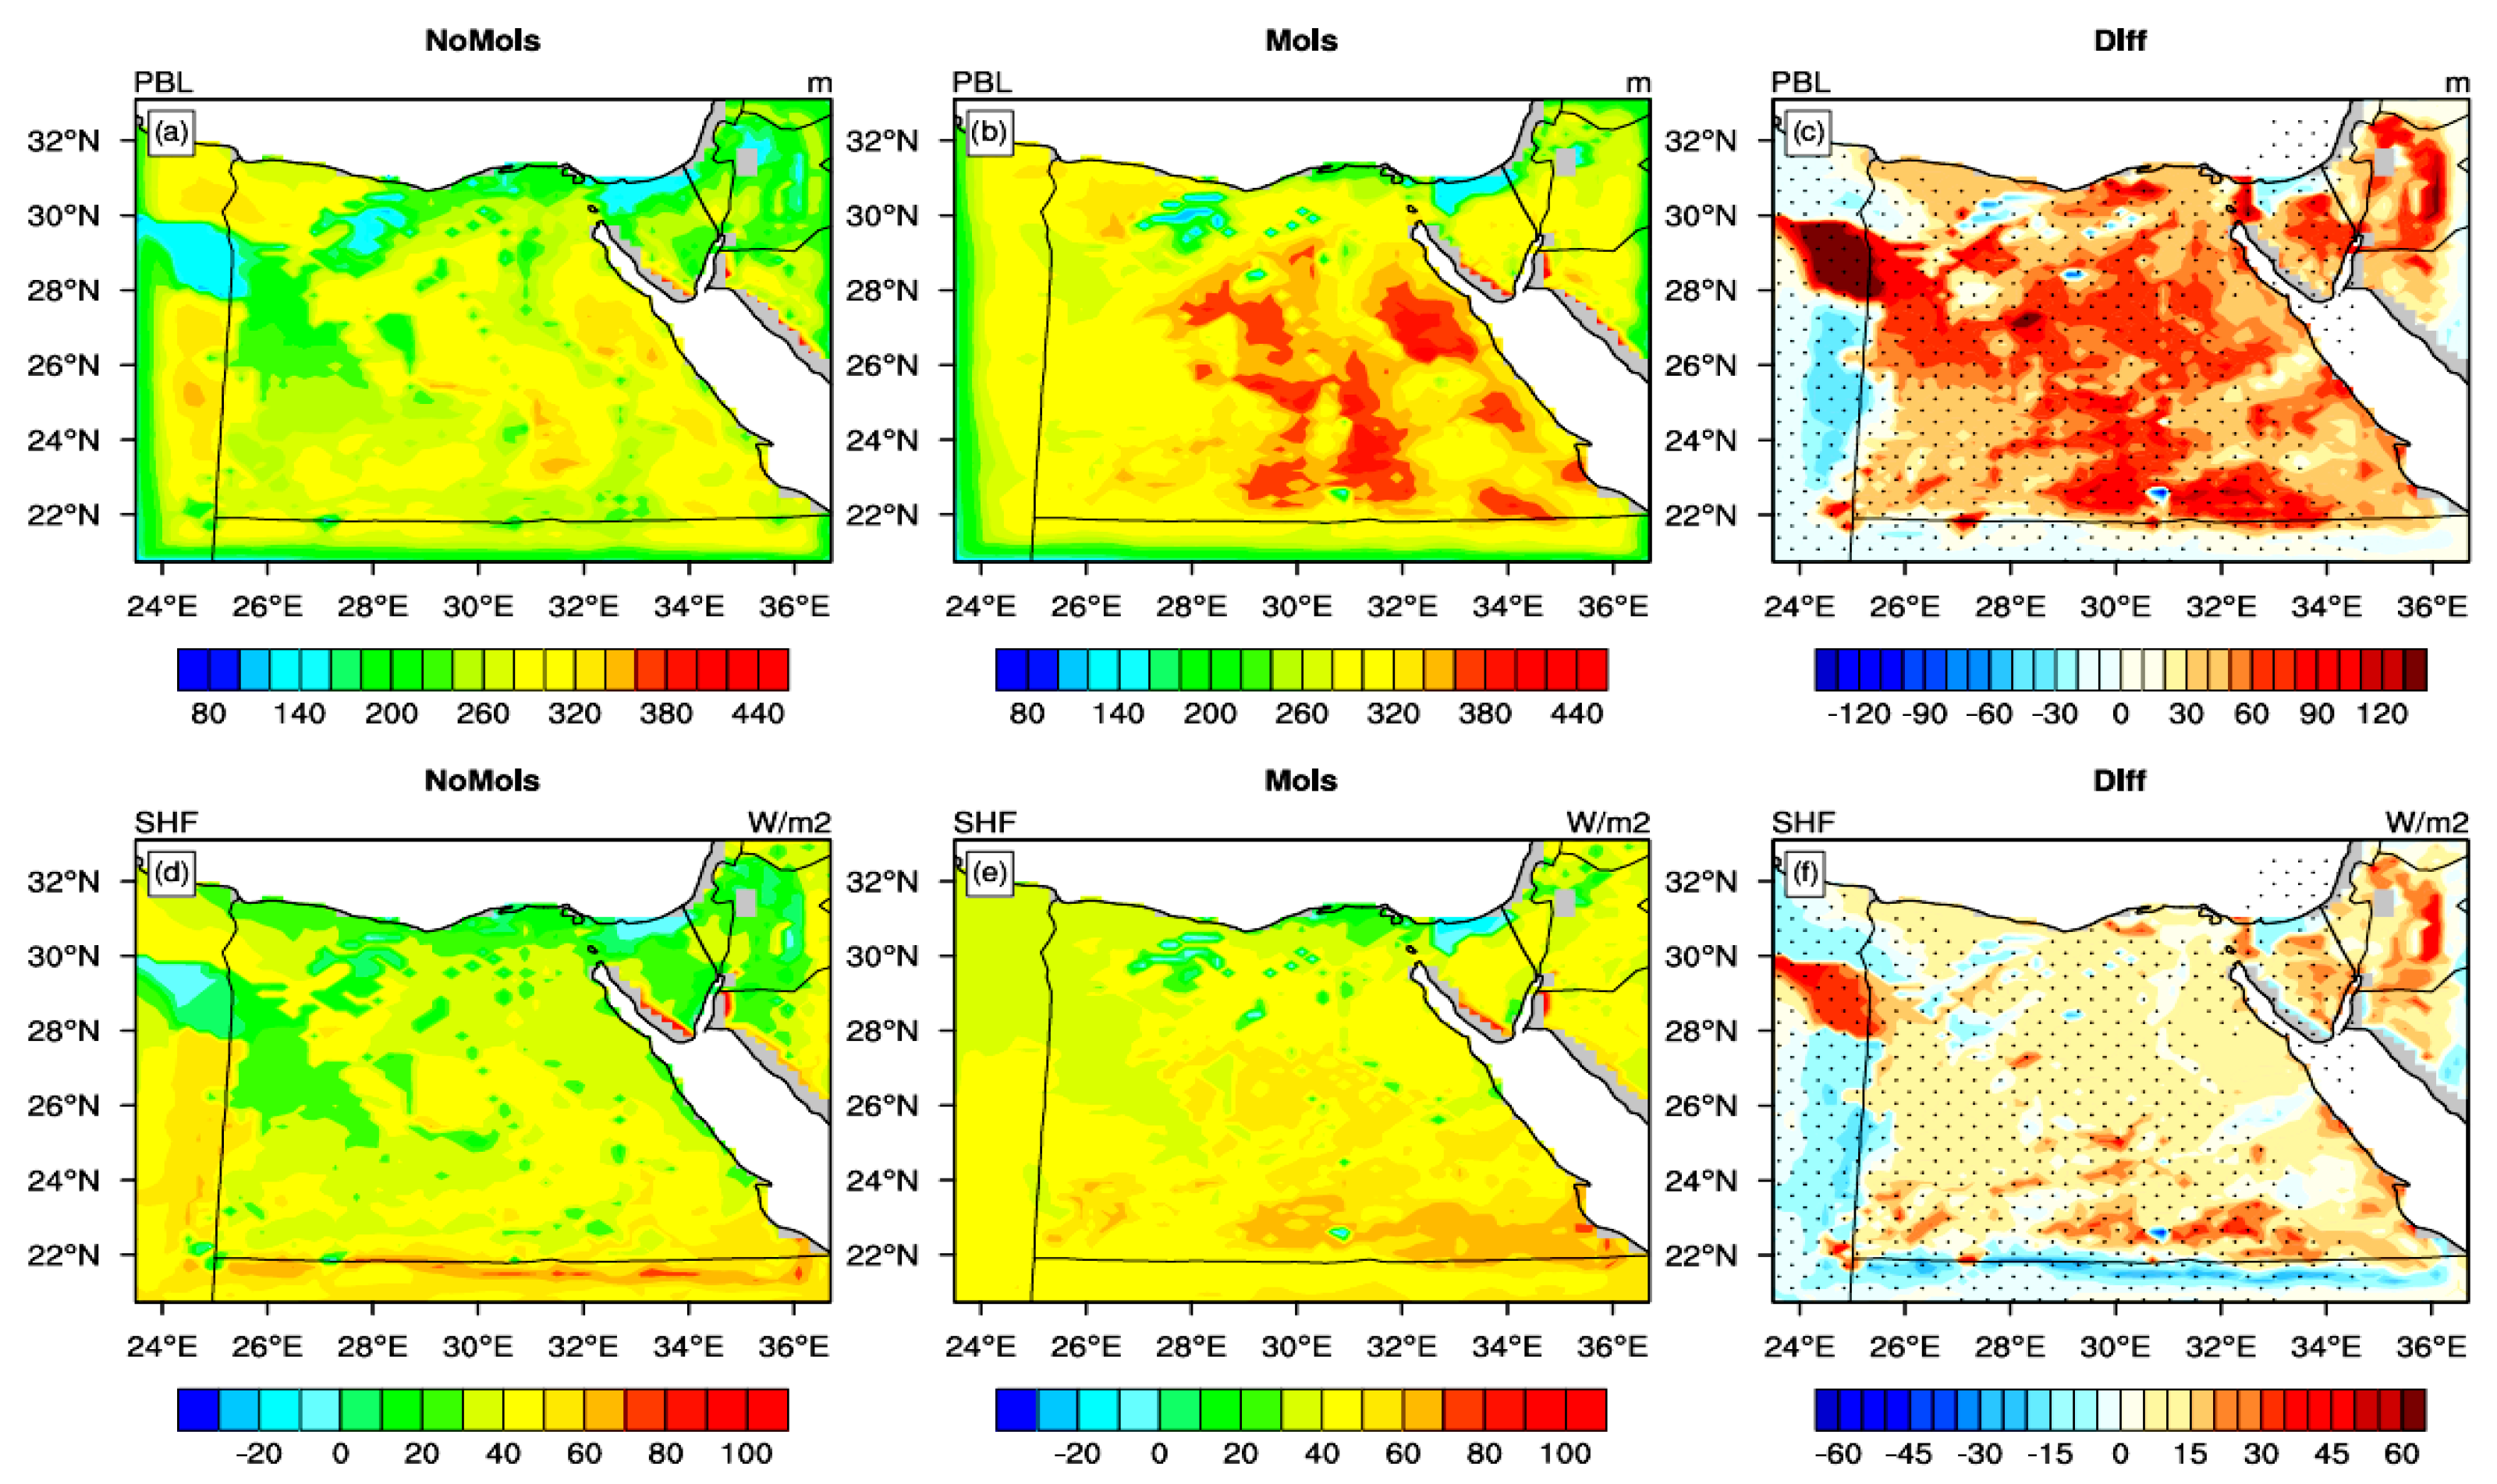
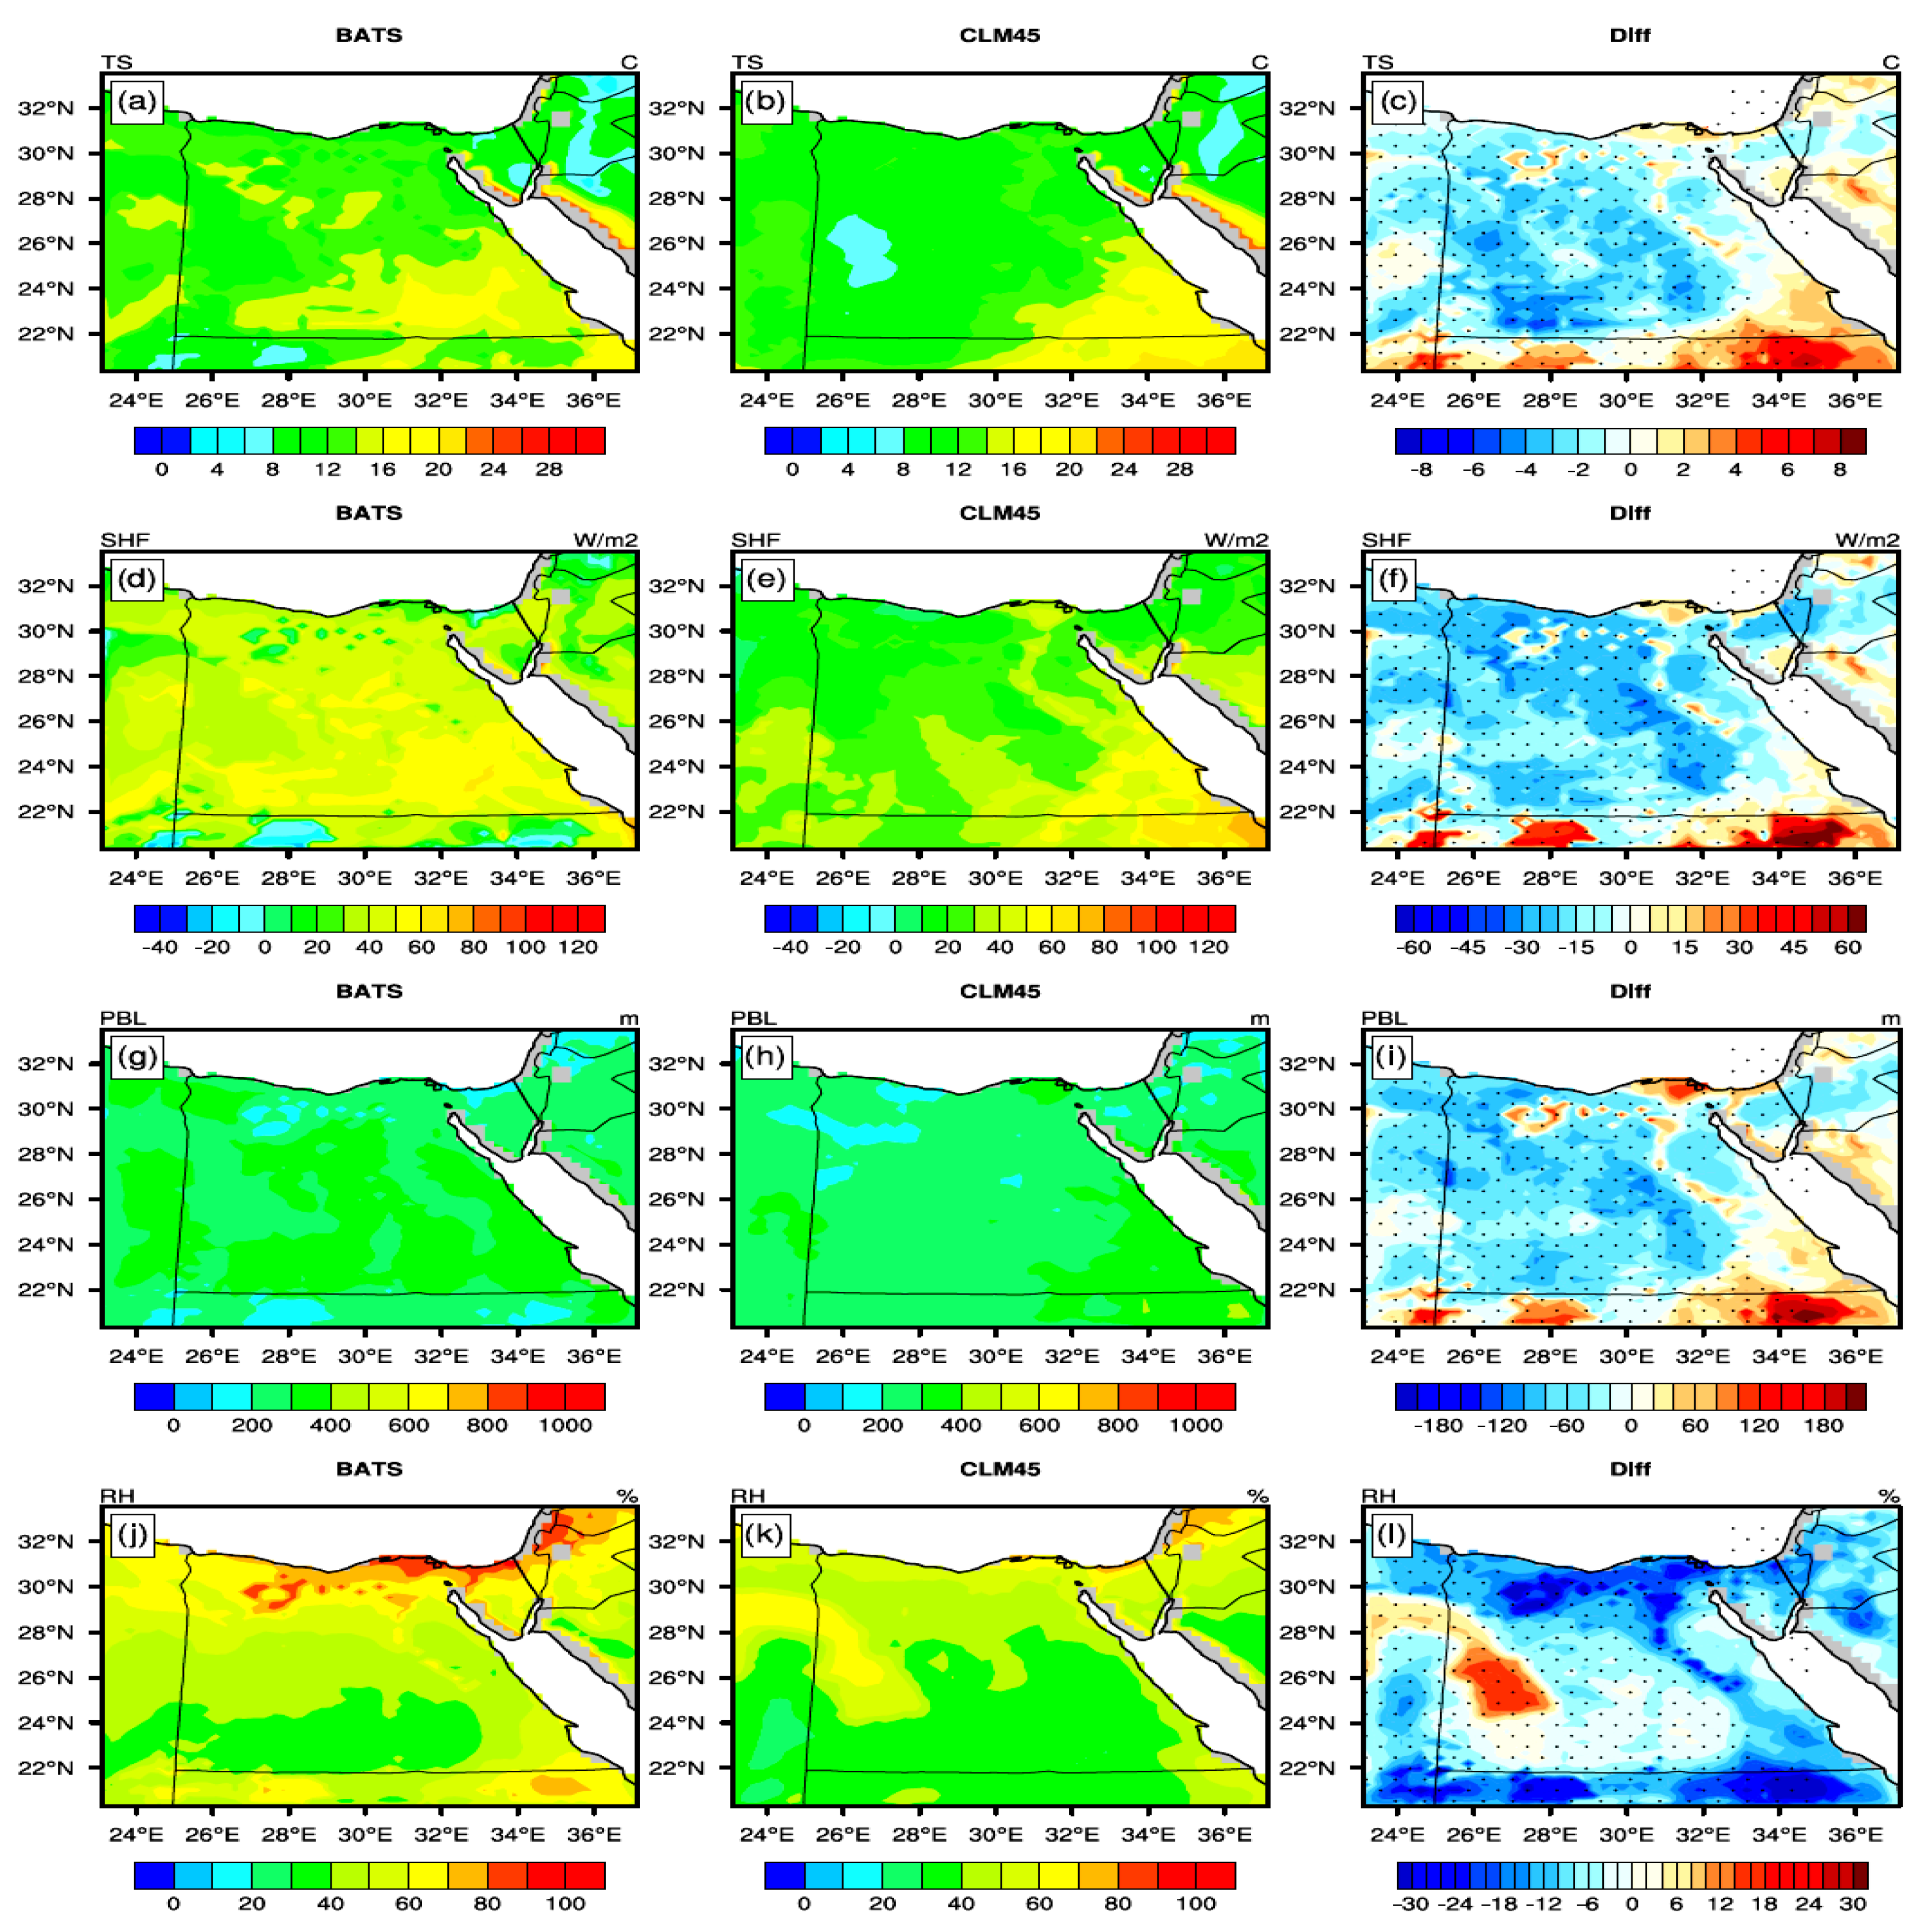
3.2.1. Diagnostic Analysis

To understand how the land surface parameterization (BATS/CLM45) can affect the simulated TMX/TMN, a diagnostic analysis was first performed for the following variables: ground temperature (TS), sensible heat flux (SHF), planetary boundary layer height (PBL), and near surface relative humidity (RH). Figure 5 shows the comparison between the BATS and the CLM45 concerning the aforementioned variables. The significant difference between the BATS and the CLM45 was calculated using Student t-test with α equals to 5%. From Figure 5, it can be noted that the CLM45 has a lower TS than the BATS (by 1–5 °C; see Figure 5a–c). Because TS controls the heat transferred from the ground to the adjacent layer of the atmosphere, the SHF is affected too. As a result, the CLM45 has a lower SHF (by 10–40 W m−2) than the BATS (Figure 5d–f).
Concerning the PBL, it can be observed that the CLM45 has a shallower PBL than the BATS (up to 120 m; Figure 5g–i). Finally, the CLM45 has a lower RH (up to 30%) than the BATS particularly in the region of 26–32° N. On the other hand, the CLM45 has a lower RH (by 5–10%) than the BATS in the region of 22–26° N (see Figure 5j–l). This noted behavior can be attributed to the fact that the CLM45 generates a lower soil moisture than the BATS, in agreement with the results reported by [14]. Additionally, the CLM45 has a higher albedo (by 10%) than the BATS, while there was no noted change in the total cloud cover (Figure S1). Regarding the solar radiation budget, there was no significant change in the global incident solar radiation (RSDS). On the other hand, the CLM45 has a lower (higher) upward short−wave radiation RSUS (RSNS) than the BATS (see Figure S2). Such behavior can explain the observed cold bias of TMX/TMN that will discussed in Section 3.2.2. In Section 3.1 and Section 3.2.1, it can be noted that the soil moisture initialization has opposite effects compared to the one induced by the land surface parameterization. For instance, switching between the bare soil and ESACCI induces an increase in the soil moisture. On the other hand, the CLM45 generates a lower soil moisture than the BATS.

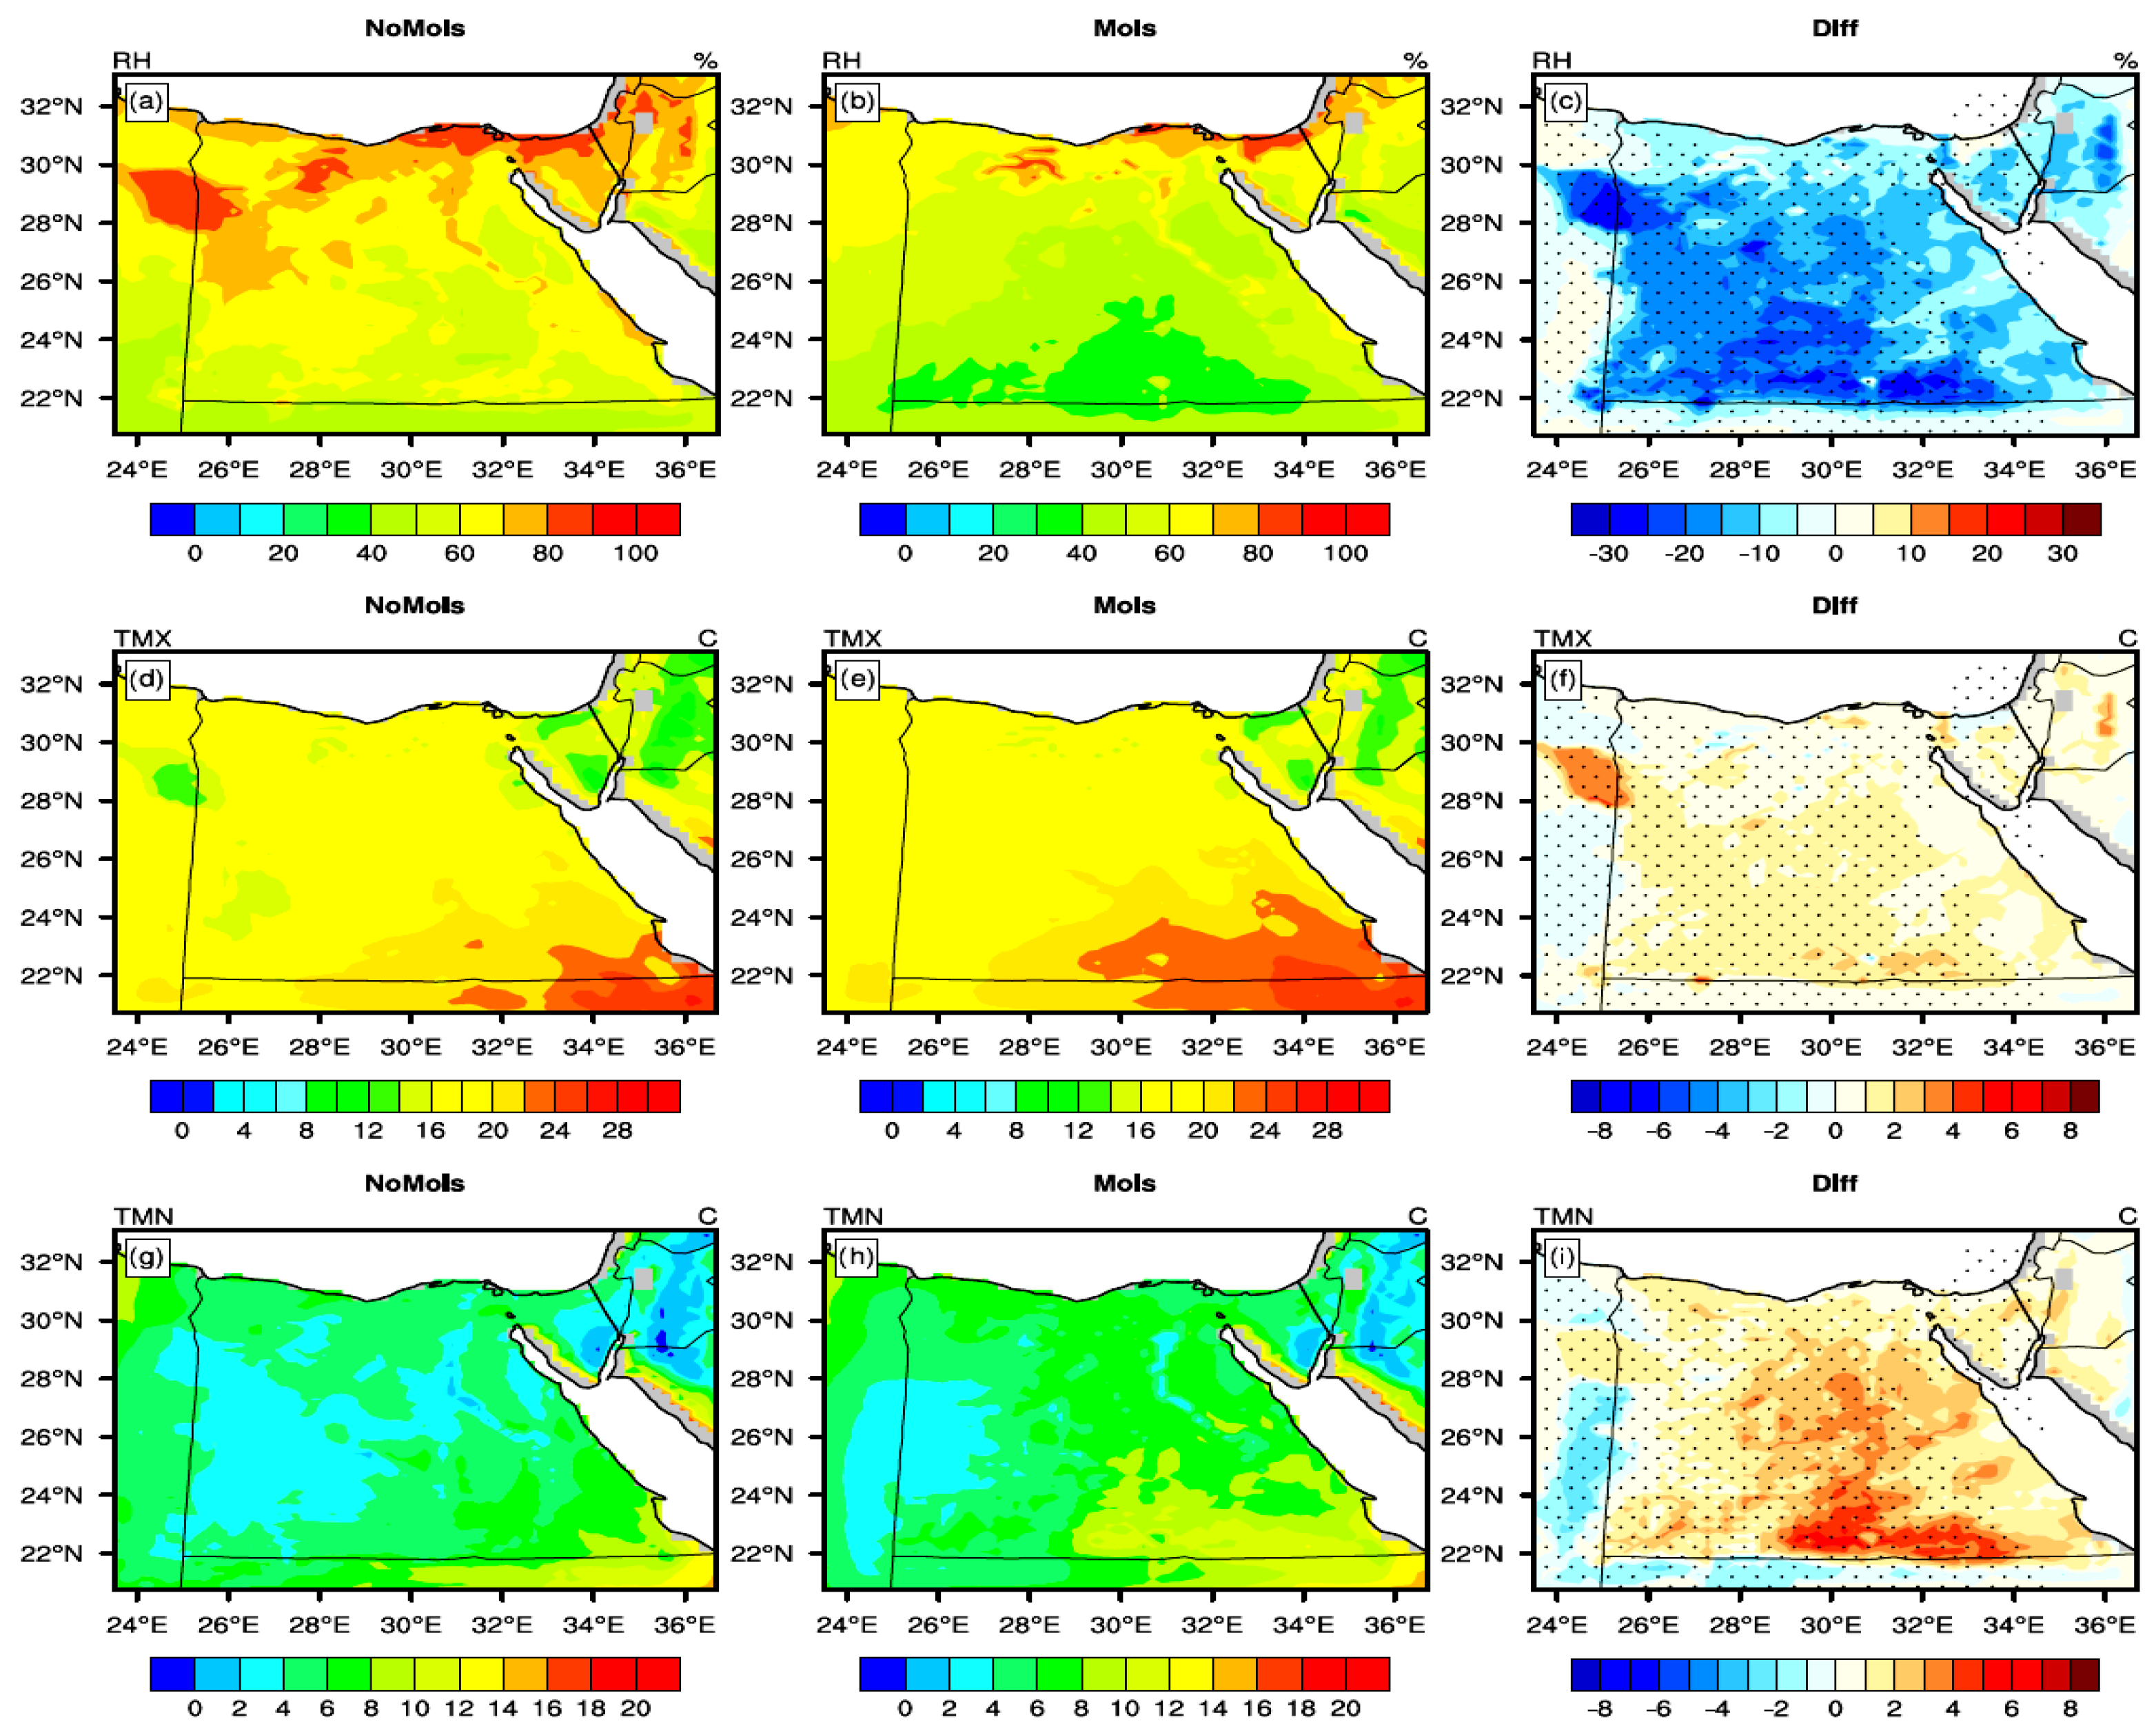
3.2.2. The Influence on Maximum/Minimum Air Temperature (TMX/TMN)

Figure 6 shows the simulated TMX (using the BATS/CLM45) with respect to the CRU for the seasons: spring (March−April−May; MAM), summer (June−July−August; JJA), autumn (September−October−November; SON) and winter (December−January−February; DJF). From Figure 6, it can be noted that the RegCM4 is able to reproduce the spatial pattern of the simulated TMX compared to the CRU in all seasons (Figure 6a–c,g–i,m–o,s–u). For instance, the TMX approaches its maximum values in the JJA followed by the SON and MAM and finally approaches its minimum values in the DJF. Additionally, it can be noted that the BATS induces an obvious warming effect particularly on the coasts of the Mediterranean Sea and Red Sea. Such behavior can be observed in the MAM, JJA, and SON (see Figure 6d,j,p) where the bias ranges between 3 and 7 °C. In the DJF, the situation is different (Figure 6v) because the warm bias approaches 2 °C.
Switching from the BATS to the CLM45 induces a notable impact on the simulated TMX in all seasons. For example, the CLM45 induces a cooling effect that can be obviously seen on the coasts of the Mediterranean Sea and Red Sea in all seasons (where the bias ranges between 2 and 4 °C; see Figure 6e,k,q,w). Additionally, the noted warm bias (induced with the BATS) has been replaced with a cold bias of 1–3 °C. Such behavior can be explained by the significant difference between the CLM45 and the BATS. For instance, it can be observed that the CLM45 is cooler than the BATS by 2–5 °C (Figure 6f,l,r,x).
Like TMX, the RegCM4 is able to capture the spatial pattern of the simulated TMN in all seasons with respect to the CRU (Figure 7a–c,g–i,m–o,s–u). Furthermore, the BATS shows a warm bias of 1–6 °C in the MAM, JJA, and SON (Figure 7d,j,p) and 1–6 °C in the DJF (Figure 7v). For the CLM45, the situation is quite different because there is a warm bias of 1–3 °C observed mainly in the Delta region, a cold bias (with the same order of magnitude in the MAM, JJA, and SON (Figure 7e,k,q), and −2 to +1 °C in the DJF (Figure 7w). Qualitatively, it can be observed that the CLM45 is cooler than the BATS (by 2–5 °C) and warmer than the BATS in the northern and eastern coasts of Egypt (by 1–4 °C; see Figure 7f,l,r,x). In conclusion, the BATS promotes a net warming effect, while the CLM45 induces a net cooling effect in association with the simulated TMX/TMN.

3.3. Climatological Annual Cycle

In this section, the behavior of the BATS/CLM45 concerning the climatological annual cycle is examined (for the fifteen locations reported in Table 1) with respect to the station observations (OBS).

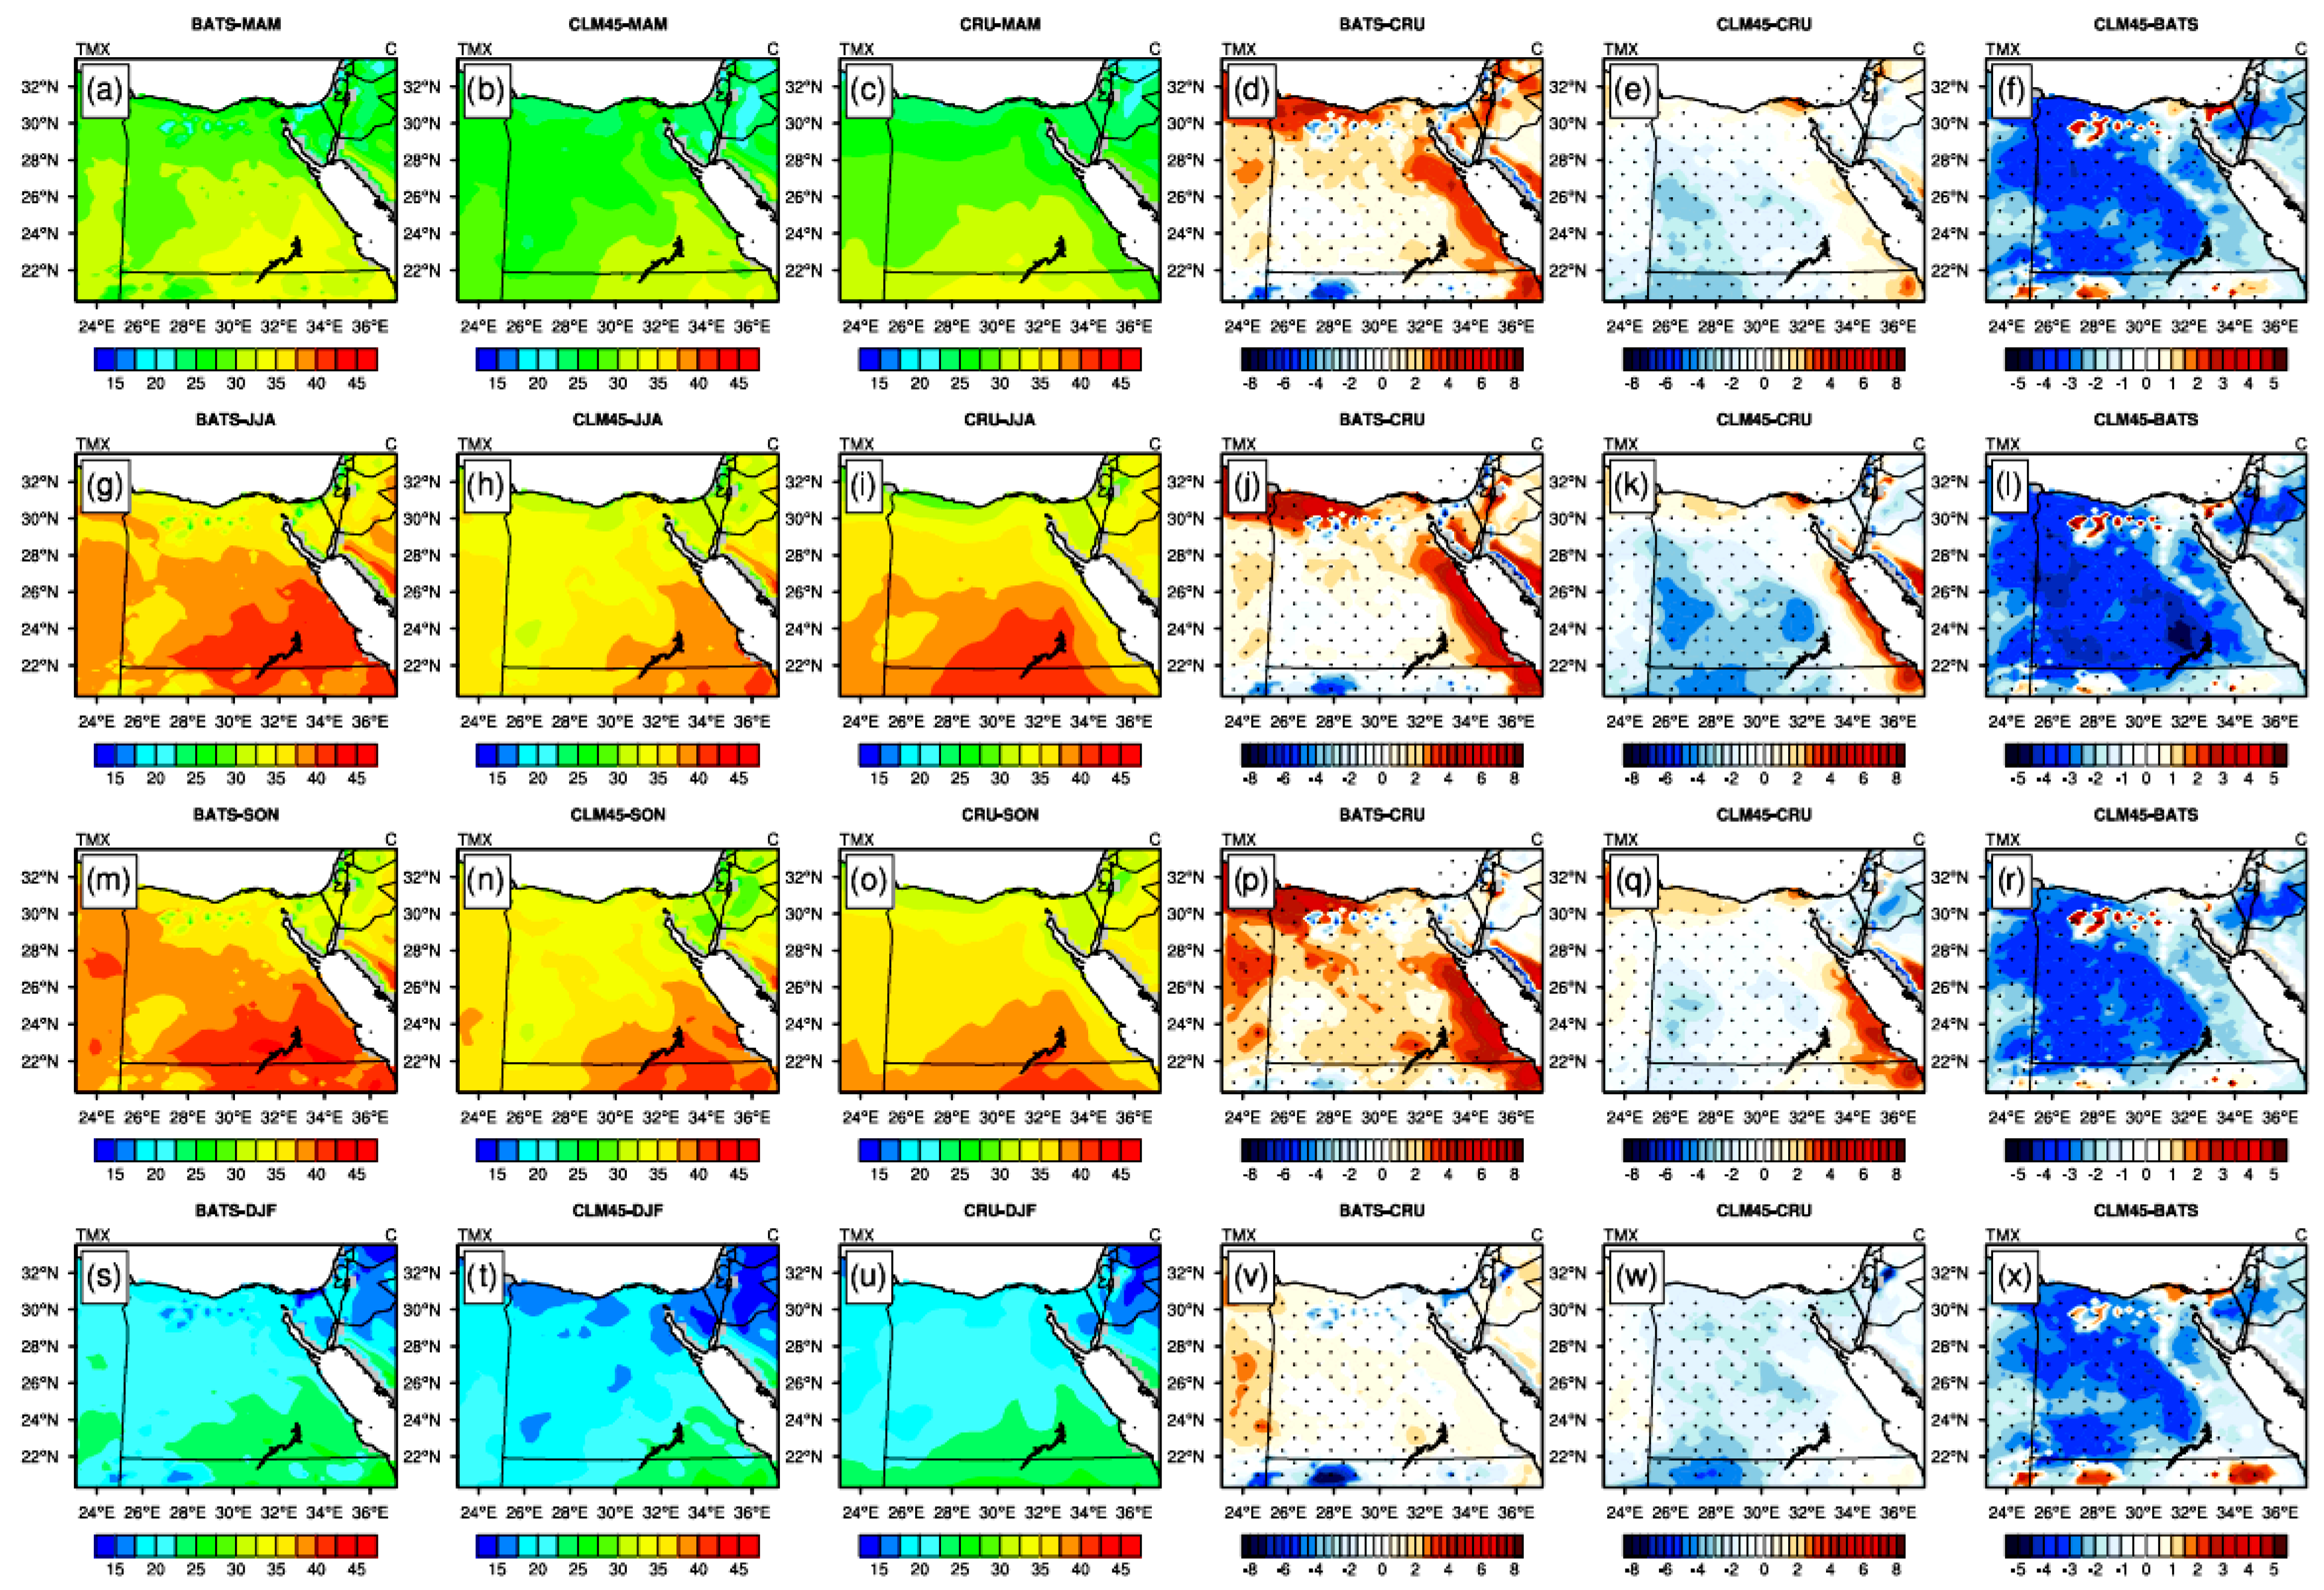
3.3.1. Maximum Air Temperature (TMX)

Figure 8 shows the climatological annual cycle of the simulated TMX compared to the OBS. From Figure 8, it can be noted that the BATS/CLM45 can reproduce the annual cycle of the TMX with respect to the OBS; however, the behavior of the BATS/CLM45 varies with the location and month. For instance, the BATS is close to the OBS in February and October in Alexandria. On the other hand, the CLM45 is close to the OBS in January, November and December. Additionally, both schemes overestimate the TMX during the rest of the months. The same behavior can be observed in Arish because the BATS is close to the OBS in the months of January to March and October to December, while the CLM45 is close to the OBS during the rest of the months.
Concerning Asswan, Assyut, Dakhla, Farafra, Luxor and Ras-Sedr, the BATS is close to the OBS, while the CLM45 underestimates the TMX in comparison with the OBS. In Cairo, Dabaa, Ismailia, Marsa-Matrouh, and Port-Said, it can be observed that both the BATS and the CLM45 underestimate the TMX compared to the OBS; however the CLM45 is closer to the OBS than the BATS. Finally, in Shallateen, the situation is different since there is no difference between the BATS and the CLM45 (in all months) with respect to the OBS.

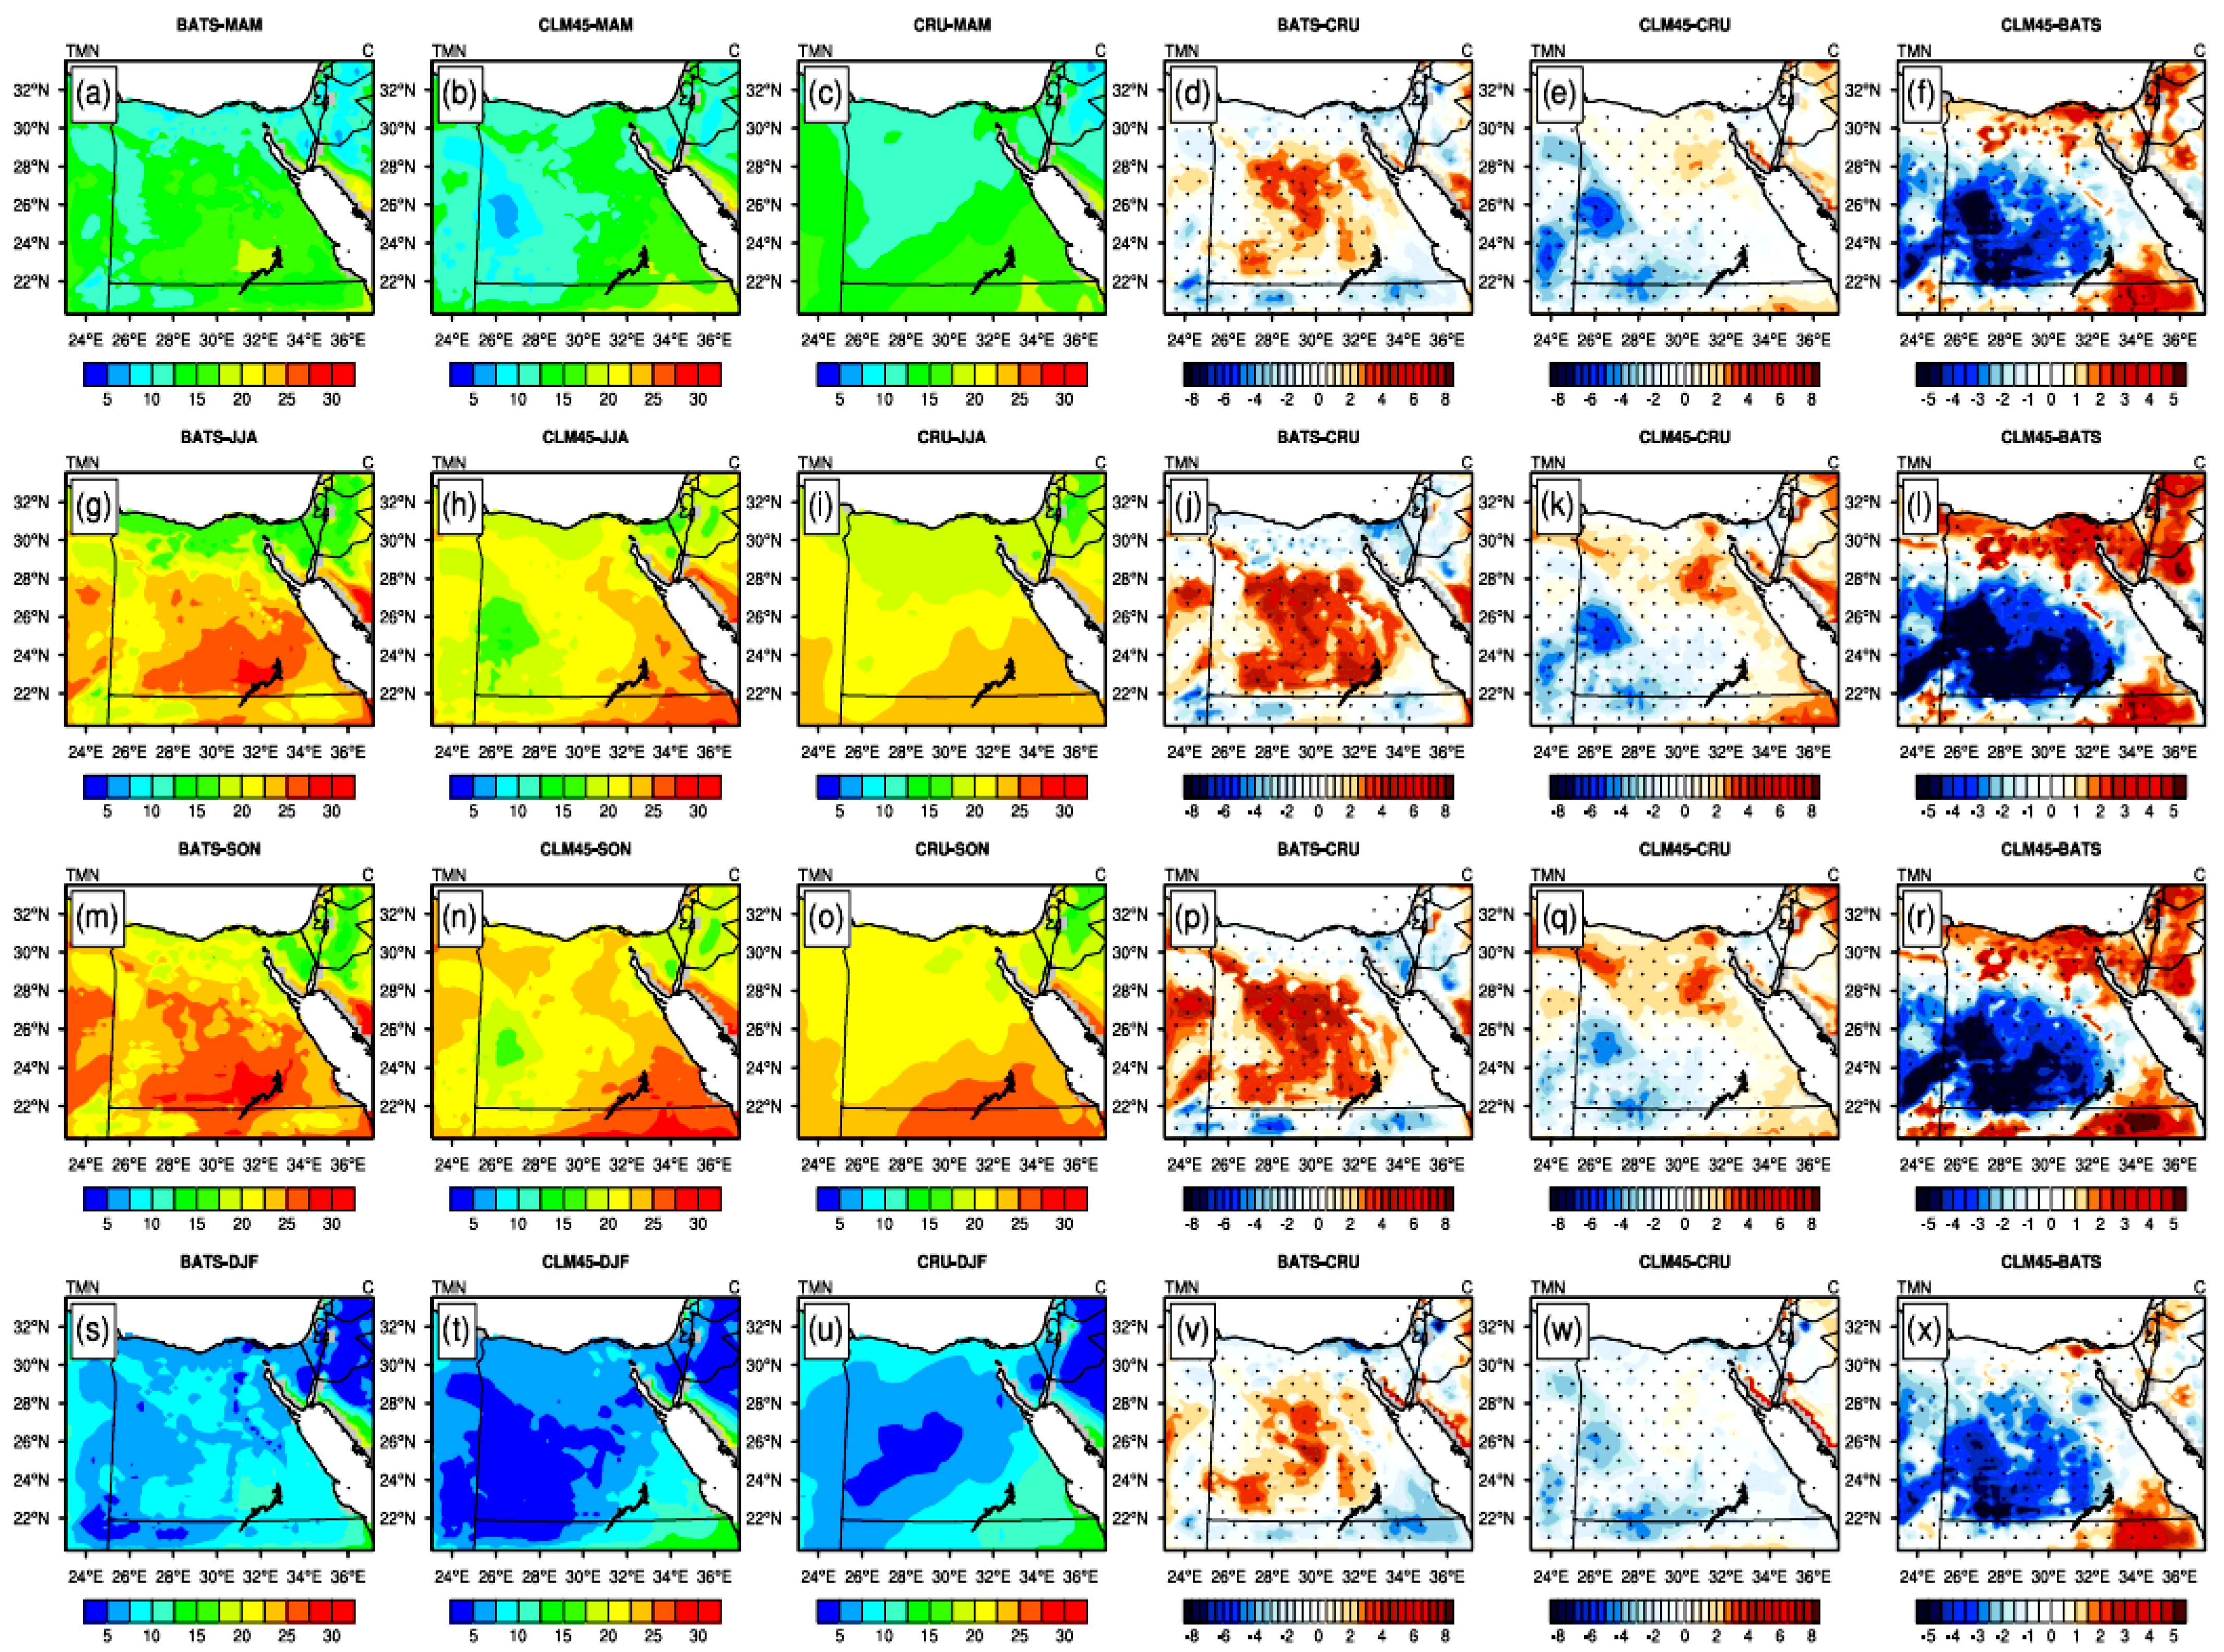
3.3.2. Minimum Air Temperature (TMN)

Like TMX, the BATS/CLM45 is able to simulate the climatological annual cycle of the TMN with respect to the OBS (Figure 9). However, the behavior of the BATS/CLM45 is different from the one noted in Section 3.3.1. For instance, in the majority of locations the CLM45 is closer to the OBS than the BATS, despite the observed over/underestimation of the simulated TMN (compared to the OBS). Additionally in Luxor, the BATS outperforms the CLM45 in simulating the TMN. Also in Dabaa and Hurgada, no scheme performs better than the other one. Finally, in Shallateen, there is no difference between the BATS and the CLM45 in comparison with the OBS. The noted behavior of the simulated TMX/TMN (with respect to the OBS) can be attributed to the fact that the local geographic features of the fifteen locations are not present in the static data of the RegCM4. Additionally, the behavior of the BATS/CLM45 has been quantified (with respect to the CRU for the fifteen locations) using the mean bias (MB) as a statistical metric (see Table 2).

4. Discussion and Conclusions

Soil moisture is an important variable in the global terrestrial hydrology cycle, and it controls the surface regional climate by perturbing the total evapotranspiration budget and the surface energy balance. Such effects have been investigated in various regions across the globe using the RegCM4 regional climate model [3,6]. However, the indicated effects of the soil moisture have been studied in wet regions. In arid regions (e.g., Egypt), such effects have not been examined till the present day. Additionally, the sensitivity of TMX/TMN of Egypt to the land surface parameterization (considering the initialization with a global satellite soil moisture product) has also not been investigated.
In the present study, the RegCM4 regional climate model was used to address the sensitivity of the simulated TMX/TMN of Egypt to different initial conditions of the soil moisture (bare soil against the ESACCI satellite soil moisture product). Additionally, the role of the land surface parameterization (BATS/CLM45) in simulating the TMX/TMN was also examined with respect to the CRU and station observations. To achieve this task, four 13-year simulations were conducted (1998–2010). In each simulation, the first three years were not considered in the analysis of the soil moisture to approach an equilibrium state based on [6,19].
The results showed that switching from the bare soil to the ESACCI satellite product induces a considerable influence on the simulated TMX/TMN through changes in the total albedo, solar radiation budget, planetary boundary layer height, sensible heat flux and near surface relative humidity. Additionally, switching from the BATS to the CLM45 led to decreases in the ground temperature, sensible heat flux, and planetary boundary layer height and near surface relative humidity. As a result, the heat flow (from the earth surface to the adjacent atmosphere layer and eventually to the whole planetary boundary layer) decreased. Such behavior can explain the warm (cold) bias of the BATS (CLM45) with respect to the CRU. Despite the noted biases, the CLM45 succeeded in reducing the observed warm bias of the BATS. Compared to the OBS, the behavior of the BATS/CLM45 varies with the location of interest concerning the TMX. For the TMN, the CLM45 outperforms the BATS in the majority of locations (see Figure 9).
It is important to observe that the global incident solar radiation is insensitive either to the soil moisture status or the land surface parameterization (Figure 2 and Figure S2). Such behavior suggests that the RSDS is the main driver controlling the PET followed by the daily mean air temperature [21]. In conclusion, the RegCM4 regional climate model can be recommended for future studies concerning the seasonal prediction/climate change of the daily TMX/TMN and temperature indices of Egypt (under different warming scenarios) when it is configured with the CLM45 land surface model and initialized with the ESACCI satellite product.
In comparison with the OBS, caution must be taken in selecting a suitable scheme at the location of study. Given the observed effects (by switching from bare soil to ESACCI satellite product and the land surface parameterization), it is recommended to investigate such effects in other arid regions (e.g., Arabian Peninsula) to ensure an optimized performance of the RegCM4 with respect to reanalysis products and station observations. In a future work, the points that need to be addressed are as follows:
  • Running the RegCM in a convective permitting mode and using parameterized convective schemes based on [18].
  • Assessing the diurnal and daily variations in the RegCM4−CLM45 regional coupled climate model with the results reported by [22].
Because of the notable influence of the ESACCI (relative to the bare soil) and the difference between the BATS and the CLM45 concerning the simulated TMX/TMN, it is suggested to examine the influence of ESACCI in various applications such as extreme storms [23] and atmospheric chemistry (e.g., surface ozone; [24]).

Supplementary Materials

The following supporting information can be downloaded at: https://www.mdpi.com/article/10.3390/ASEC2023-15353/s1, Figure S1: The figure shows the total albedo and the total cloud cover. Figure S2: The figure shows the solar radiation budget.

Author Contributions

Conceptualization, S.A.A.; methodology, S.A.A.; software, S.A.A.; validation, S.A.A. and S.M.M.; formal analysis, S.A.A.; investigation, S.A.A.; resources, S.A.A. and S.M.M.; data curation, S.A.A. and S.M.M.; writing—original draft preparation, S.A.A.; writing—review and editing, S.A.A.; visualization, S.A.A. and S.M.M.; supervision, S.A.A.; project administration, S.A.A. All authors have read and agreed to the published version of the manuscript.

Funding

No funding was received for this study.

Institutional Review Board Statement

Not applicable.

Informed Consent Statement

Not applicable.

Data Availability Statement

Data are contained within the article.

Acknowledgments

Egyptian Meteorological Authority (EMA) is acknowledged for providing the computational power to conduct the RegCM4 simulations and station observations to evaluate the RegCM4 performance in different locations concerning the climatological annual cycle. University of East Anglia is acknowledged for providing the Climate Research Unit of the monthly average daily maximum and minimum air temperature from the web link https://crudata.uea.ac.uk/cru/data/hrg/cru_ts_4.07/cruts.2304141047.v4.07/ (accessed on 20 June 2023).

Conflicts of Interest

The authors declare no conflict of interest.

References

  1. Fisher, B.J.; Huntzinger, N.D.; Schwalm, C.R.; Sitch, S. Modelling the terrestrial biosphere. Ann. Rev. Environ. Resour. 2014, 39, 91–123. [Google Scholar] [CrossRef]
  2. Stuart, F.C., III; Matson, P.A.; Mooney, H.A. Principles of Terrestrial Ecosystem Ecology; Spinger: New York, NY, USA, 2002; pp. 4–211. [Google Scholar]
  3. Anwar, S.A.; Zakey, A.; Robaa, S.; Wahab, M.M.A. The influence of two land-surface hydrology schemes on the regional climate of Africa using the RegCM4 model. Theor. Appl. Clim. 2019, 136, 1535–1548. [Google Scholar] [CrossRef]
  4. Giorgi, F.; Coppola, E.; Solmon, F.; Mariotti, L.; Sylla, M.B.; Bi, X.; Elguindi, N.; Diro, G.T.; Nair, V.; Giuliani, G.; et al. RegCM4: Model description and preliminary tests over multiple CORDEX domains. Clim. Res. 2012, 52, 7–29. [Google Scholar] [CrossRef]
  5. Oleson, K.W.; Lawrence, D.M.; Bonan, G.B.; Drewniak, B.; Huang, M.; Koven, C.D.; Levis, S.; Li, F.; Riley, W.J.; Subin, Z.M.; et al. Technical Description of Version 4.5 of the Community Land Model (CLM); NCAR Technical Note NCAR/TN-503þ STR; National Center for Atmospheric Research: Boulder, CO, USA, 2013. [Google Scholar]
  6. Anwar, S.A.; Srivastava, A.; Zerouali, B. On the role of land-surface hydrology schemes in simulating the daily maximum and minimum air temperatures of Australia using a regional climate model (RegCM4). J. Water Clim. Chang. 2023, 14, 989–1011. [Google Scholar] [CrossRef]
  7. Steiner, A.L.; Pal, J.S.; Rauscher, S.A.; Bell, J.L.; Diffenbaugh, N.S.; Boone, A.; Sloan, L.C.; Giorgi, F. Land surface coupling in regional climate simulations of the West African monsoon. Clim. Dyn. 2009, 33, 869–892. [Google Scholar] [CrossRef]
  8. Oleson, K.W.; Niu, G.; Yang, Z.; Lawrence, D.M.; Thornton, P.E.; Lawrence, P.J.; Stöckli, R.; Dickinson, R.E.; Bonan, G.B.; Levis, S.; et al. Improvements to the Community Land Model and their impact on the hydrological cycle. J. Geophys. Res. 2008, 113, G01021. [Google Scholar] [CrossRef]
  9. Dickinson, R.E.; Henderson-Sellers, A.; Kennedy, P.J. Biosphere-Atmosphere Transfer Scheme (BATS) Version 1e as Coupled to the NCAR Community Climate Model (No. NCAR/TN-387þ STR; University Corporation for Atmospheric Research: Boulder, CO, USA, 1993. [Google Scholar] [CrossRef]
  10. Maurya, R.K.S.; Sinha, P.; Mohanty, M.R.; Mohanty, U.C. Coupling of Community Land Model with RegCM4 for Indian Summer Monsoon Simulation. Pure Appl. Geophys. 2017, 174, 4251–4270. [Google Scholar] [CrossRef]
  11. Chung, J.X.; Juneng, L.; Tangang, F.; Jamaluddin, A.F. Performances of BATS and CLM land-surface schemes in RegCM4 in simulating precipitation over CORDEX Southeast Asia domain. Int. J. Clim. 2018, 38, 794–810. [Google Scholar] [CrossRef]
  12. Constantinidou, K.; Hadjinicolaou, P.; Zittis, G.; Lelieveld, J. Sensitivity of simulated climate over the MENA region related to different land surface schemes in the WRF model. Theor. Appl. Clim. 2020, 141, 1431–1449. [Google Scholar] [CrossRef]
  13. Dorigo, W.; Wagner, W.; Albergel, C.; Albrecht, F.; Balsamo, G.; Brocca, L.; Chung, D.; Ertl, M.; Forkel, M.; Gruber, A.; et al. ESA CCI Soil Moisture for improved Earth system understanding: State-of-the art and future directions. Remote Sens. Environ. 2017, 203, 185–215. [Google Scholar] [CrossRef]
  14. Gruber, A.; Scanlon, T.; van der Schalie, R.; Wagner, W.; Dorigo, W. Evolution of the ESA CCI Soil Moisture climate data records and their underlying merging methodology. Earth Syst. Sci. Data 2019, 11, 717–739. [Google Scholar] [CrossRef]
  15. Harris, I.; Osborn, T.J.; Jones, P.; Lister, D. Version 4 of the CRU TS monthly high-resolution gridded multivariate climate dataset. Sci. Data 2020, 7, 109. [Google Scholar] [CrossRef] [PubMed]
  16. Pal, J.S.; Giorgi, F.; Bi, X.; Elguindi, N.; Solmon, F.; Gao, X.; Rauscher, S.A.; Francisco, R.; Zakey, A.; Winter, J.; et al. Regional Climate Modeling for the Developing World: The ICTP RegCM3 and RegCNET. Bull. Am. Meteorol. Soc. 2007, 88, 1395–1410. [Google Scholar] [CrossRef]
  17. Grell, G.A.; Dudhia, J.; Stauffer, D.R. Description of the Fifth Generation Penn State/NCAR Mesoscale Model (MM5); NCAR Technical Note NCAR/TN-398+STR; Technical Note; National Center for Atmospheric Research (NCAR): Boulder, CO, USA, 1994; p. 121. [Google Scholar] [CrossRef]
  18. Giorgi, F.; Coppola, E.; Giuliani, G.; Ciarlo`, J.M.; Pichelli, E.; Nogherotto, R.; Raffaele, F.; Malguzzi, P.; Davolio, S.; Stocchi, P.; et al. The Fifth Generation Regional Climate Modeling System, RegCM5: Description and Illustrative Examples at Parameterized Convection and Convection-Permitting Resolutions. J. Geophys. Res. Atmos. 2023, 128, e2022JD038199. [Google Scholar] [CrossRef]
  19. Anwar, S.A.; Diallo, I. Modelling the Tropical African Climate using a state-of-the-art coupled regional climate-vegetation model. Clim. Dyn. 2022, 58, 97–113. [Google Scholar] [CrossRef]
  20. Kanamitsu, M.; Ebisuzaki, W.; Woollen, J.; Yang, S.K.; Hnilo, J.J.; Fiorino, M.; Potter, G.L. NCEP-DOE AMIP-II Reanalysis (R-2). Bull. Am. Meteorol. Soc. 2002, 83, 1631–1643. [Google Scholar] [CrossRef]
  21. Anwar, S.A.; Lazić, I. Estimating the Potential Evapotranspiration of Egypt Using a Regional Climate Model and a High-Resolution Reanalysis Dataset. Environ. Sci. Proc. 2023, 25, 29. [Google Scholar] [CrossRef]
  22. Frey, C.M.; Parlow, E.; Vogt, R.; Harhash, M.; Wahab, M.M.A. Flux measurements in Cairo. Part 1: In situ measurements and their applicability for comparison with satellite data. Int. J. Clim. 2011, 31, 218–231. [Google Scholar] [CrossRef]
  23. Mekawy, M.; Saber, M.; Mekhaimar, S.A.; Zakey, A.S.; Robaa, S.M.; Wahab, M.A. Evaluation of WRF Microphysics Schemes Performance Forced by Reanalysis and Satellite-Based Precipitation Datasets for Early Warning System of Extreme Storms in Hyper Arid Environment. Climate 2023, 11, 8. [Google Scholar] [CrossRef]
  24. Steiner, A.; Tawfik, A.; Shalaby, A.; Zakey, A.; Abdel-Wahab, M.; Salah, Z.; Solmon, F.; Sillman, S.; Zaveri, R. Climatological simulations of ozone and atmospheric aerosols in the Greater Cairo region. Clim. Res. 2014, 59, 207–228. [Google Scholar] [CrossRef]
Figure 1. The figure shows the interpolated ESACCI satellite soil moisture product on the RegCM4 curvilinear grid.
Engproc 56 00115 g001
Figure 2. The figure shows the comparison between NoMois and Mois for the variables: 1—total albedo (Al; (ac)); 2—surface upward short−wave radiation (RSUS; (df)); 3—surface net short wave radiation (RSNS; (gi)); and 4—downward short−wave radiation (RSDS; (jl)).
Engproc 56 00115 g002
Figure 3. The figure shows the comparison between NoMois and Mois for the variables: 1—planetary boundary layer height (PBL; (ac)) and 2—surface sensible heat flux. (SHF; (df)).
Engproc 56 00115 g003
Figure 4. The figure shows the comparison between NoMois and Mois for the variables: 1—near surface relative humidity (RH; (ac)); 2—near surface maximum air temperature (TMX; (df)); and 3—near surface minimum air temperature (TMN; (gi)).
Engproc 56 00115 g004
Figure 5. The figure shows the comparison between BATS and CLM45 land surface schemes for the variables: 1—ground temperature (TS; (ac)); 2—sensible heat flux (SHF; (df)); 3—planetary boundary layer height (PBL; (gi)); and 4—near surface relative humidity (RH; (jl)).
Engproc 56 00115 g005
Figure 6. The figure shows the simulated daily maximum air temperature over the period of 2001–2010 (TMX; in °C) for the seasons: MAM in the first row (af); JJA in the second (gl); SON in the third (mr); and DJF in the fourth (sx). For each row, BATS is on the left, followed by CLM45. CRU is the third from left, followed by BATS minus CRU, CLM45 minus CRU and the difference between CLM45 and BATS. Significant difference/bias is indicated with black dots using Student t-test with alpha equal to 5%.
Engproc 56 00115 g006
Figure 7. The figure shows the simulated daily minimum air temperature over the period of 2001–2010 (TMN; in °C) for the seasons: MAM in the first row (af); JJA in the second (gl); SON in the third (mr); and DJF in the fourth (sx). For each row, BATS is on the left, followed by CLM45. CRU is the third from left, followed by BATS minus CRU, CLM45 minus CRU, and the difference between CLM45 and BATS. Significant difference/bias is indicated with black dots using Student t-test with alpha equal to 5%.
Engproc 56 00115 g007
Figure 8. The figure shows the climatological annual cycle of the daily maximum air temperature over the period of 2001–2010 (TMX; in °C) for the fifteen locations indicated in Table 1. The BATS scheme is indicated in blue color, the CLM45 scheme in red color, and the station observation (OBS) in green color.
Engproc 56 00115 g008aEngproc 56 00115 g008bEngproc 56 00115 g008c
Figure 9. The figure shows the climatological annual cycle of the daily minimum air temperature over the period of 2001–2010 (TMN; in °C) for the fifteen locations indicated in Table 1. The BATS scheme is indicated in blue color, the CLM45 scheme in red color and the station observation (OBS) in green color.
Engproc 56 00115 g009aEngproc 56 00115 g009bEngproc 56 00115 g009c
Table 1. The table shows station coordinates, world meteorological organization (WMO) ID, and elevation above mean sea level (in meters).
StationWMO CodeLongitude (°E)Latitude (°N)Elevation (m)
Marsa-Matrouh6230627.2231.3325
Dabaa6230928.4730.9317
Alexandria6231829.9531.18−2.626
Port Said6233232.2031.280.8
Arish6233733.4931.0930.57
Cairo 6236631.4030.1364.12
Assyut6239331.0227.05226
Luxor6240532.7025.6783.64
Asswan6241432.7823.97192.53
Farafra6242327.9727.0577.79
Dakhla6243229.0025.29107.26
Ismailia6244032.2330.5910.14
Ras Sedr6245532.7229.593.26
Hurgada6246333.8227.187.79
Shallateen6247635.5823.1319.44
Table 2. The table shows the mean bias (MB; in °C) for the BATS/CLM45 concerning the simulated TMX/TMN for the fifteen locations indicated in Table 1.
StationTMXTMN
BATSCLM45BATSCLM45
Marsa-Matrouh−4.56−4.082.332.92
Dabaa−5.20−4.760.761.50
Alexandria1.772.76−3.32−1.02
Port Said−5.15−4.36−2.07−0.72
Arish−0.01−1.08−2.160.62
Cairo −3.13−2.57−5.36−3.94
Assyut0.47−1.70−0.870.94
Luxor−1.93−2.970.711.57
Asswan−0.14−1.37−2.240.25
Farafra0.70−2.213.351.48
Dakhla0.48−2.452.931.27
Ismailia−4.38−3.09−3.61−1.68
Ras Sedr−1.55−4.07−6.39−3.89
Hurgada−4.84−3.892.433.61
Shallateen−3.21−3.125.065.15
Disclaimer/Publisher’s Note: The statements, opinions and data contained in all publications are solely those of the individual author(s) and contributor(s) and not of MDPI and/or the editor(s). MDPI and/or the editor(s) disclaim responsibility for any injury to people or property resulting from any ideas, methods, instructions or products referred to in the content.

