
Differential Evolution Optimized Non-Orthogonal Multiple Access for Sum Rate Maximization †


 , , and
Abstract
:1. Introduction
2. Related Work
- A DE algorithm is developed to maximize the sum rate for a two-user NOMA system and to obtain converged values of the PA factors;
- The performance is validated by comparing the DE optimized system with random PA schemes;
- The sum rate and outage analysis is carried out for comparison.
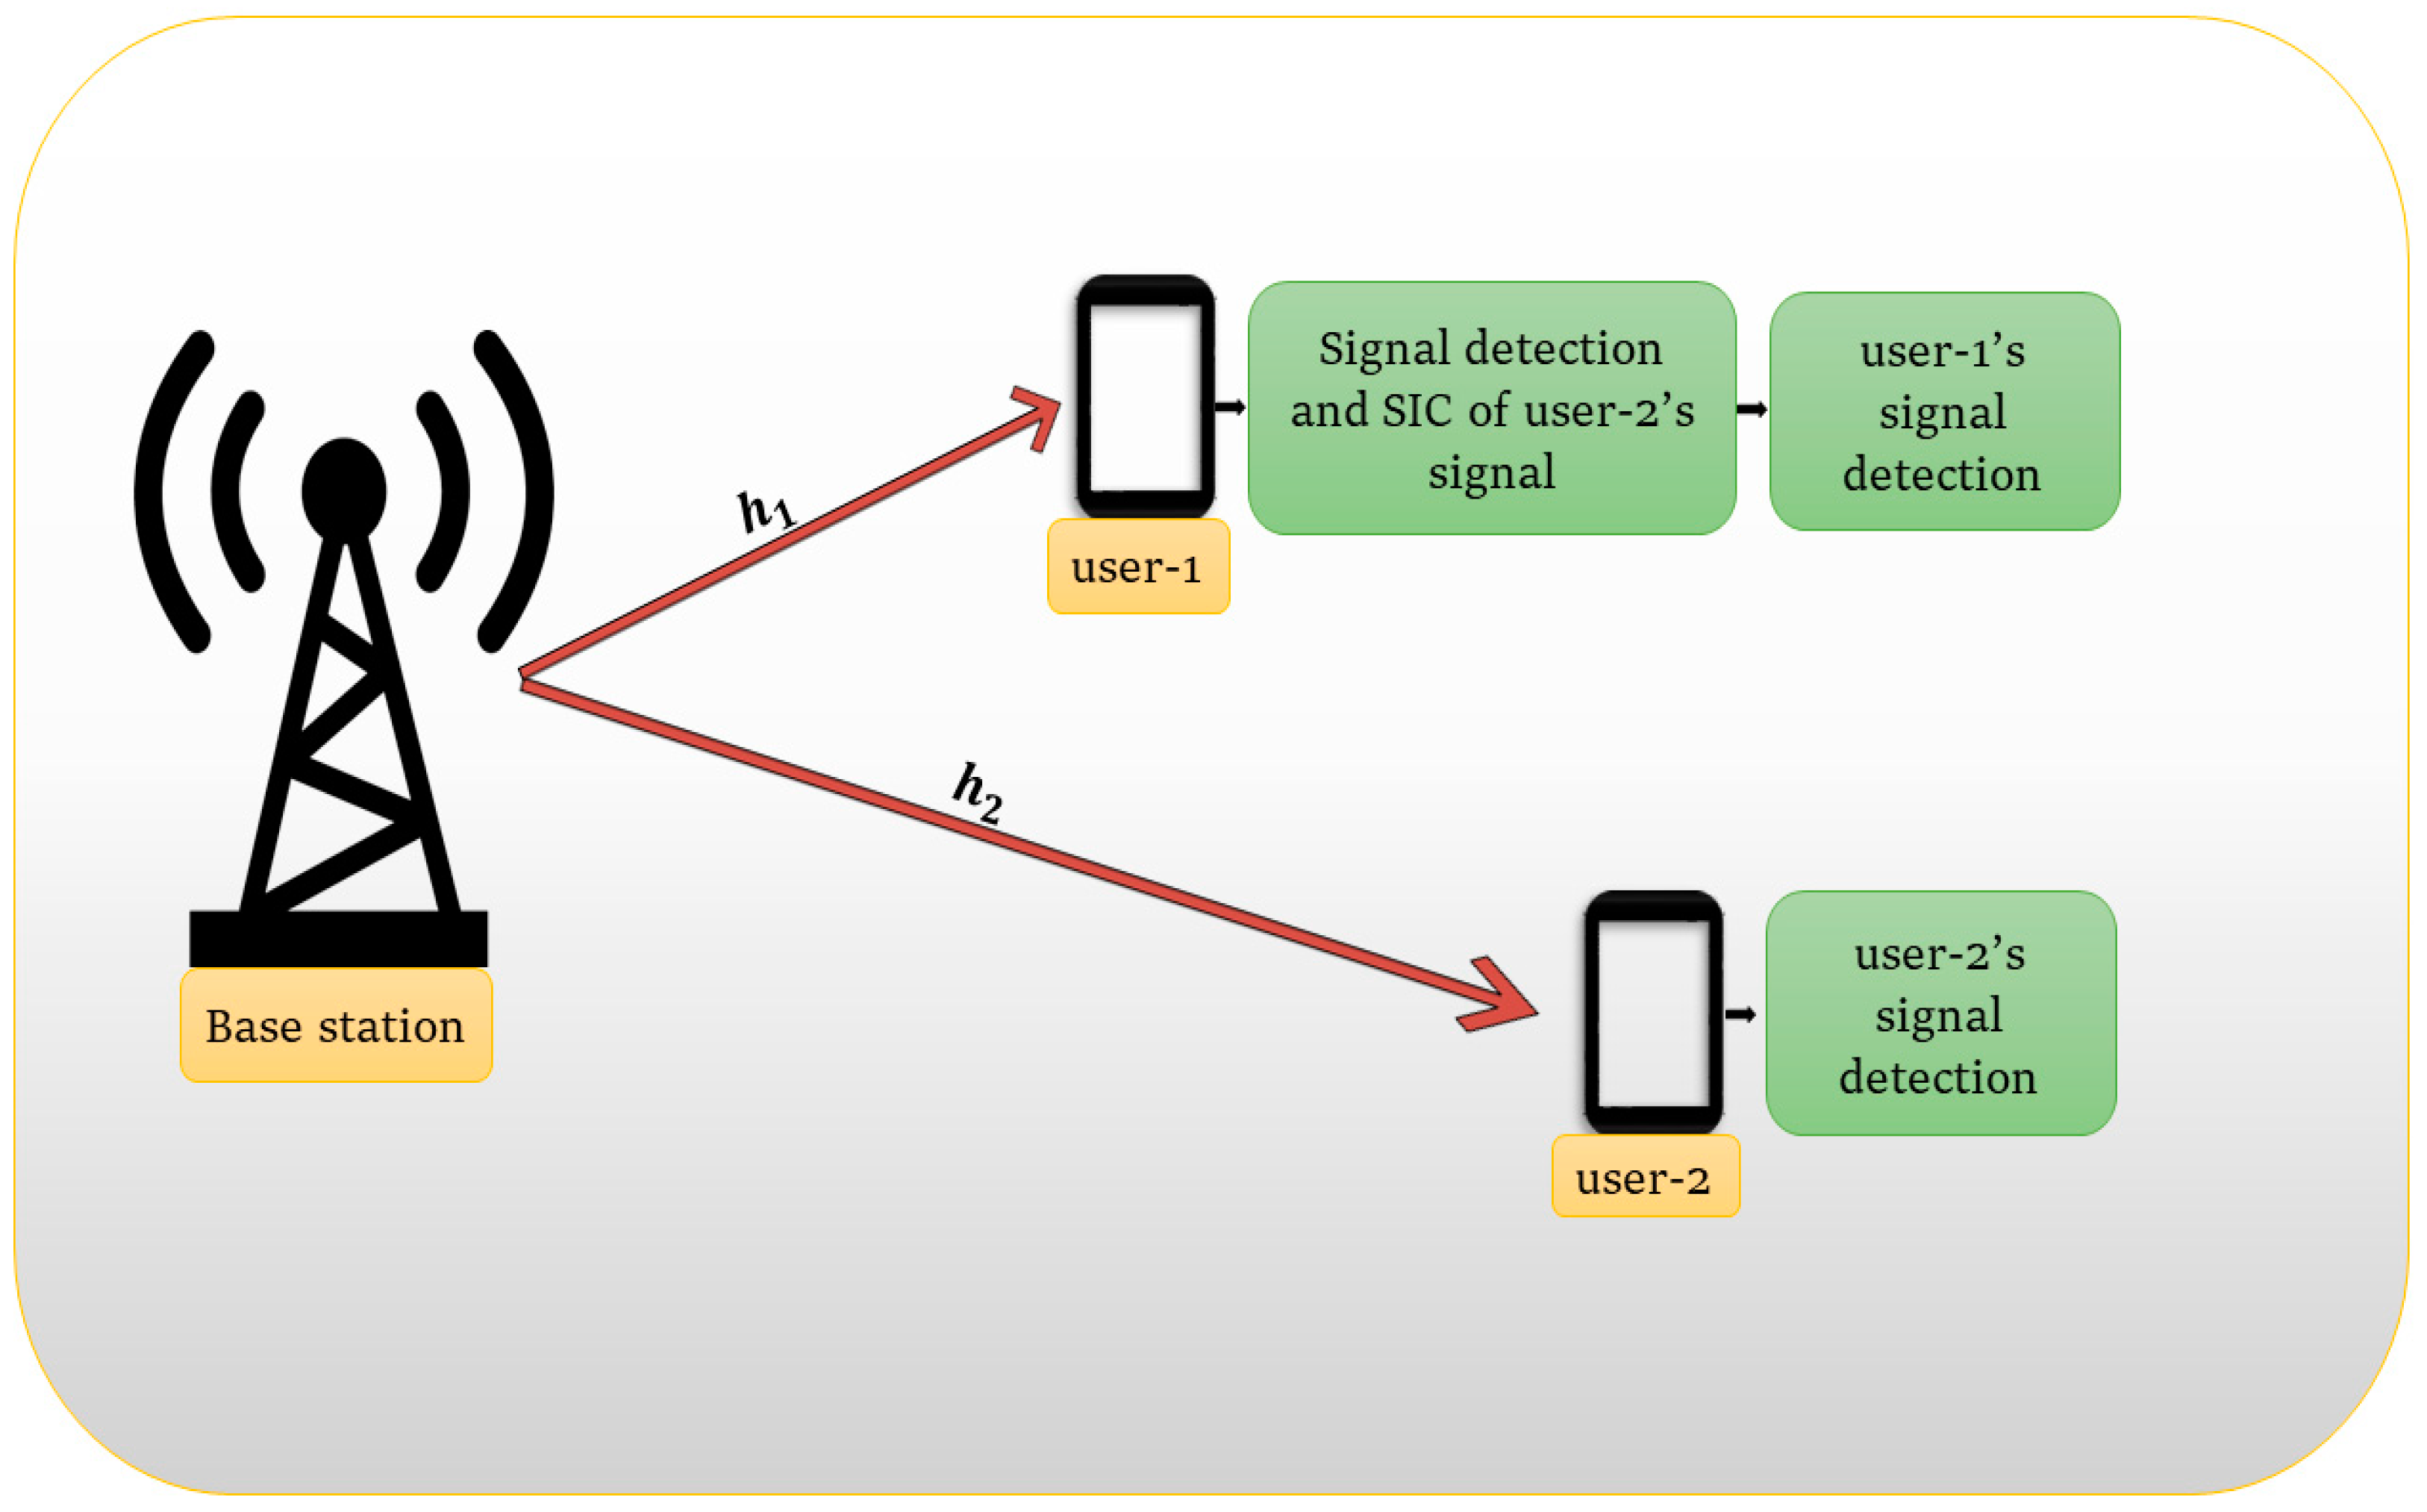
3. System Model
4. Power Factor Optimization Using DE Algorithm
| Algorithm 1: The DE algorithm for maximization of sum rate. |
| Inputs: Rayleigh fading channel coefficients of size . |
| Initialization: Random population of size with constraints in . |
| Steps: 1: Form of size by evaluating the sum rate for all individuals. 2: for 3: for do 4: Randomly select three position index of , 5: Generate a donor vector using 6: 7: for do 8: if rand < or then 9: 10: else 11: 12: end if 13: end for 14: end for 15: for do 16: Evaluate the fitness for 17: if is greater or equal to then 18: Replace with 19: end if 20: end for 21: end for 22: Repeat the process for number of channel coefficients and find the average of sum rate. |
5. Simulations and Discussions
6. Conclusions
Author Contributions
Funding
Institutional Review Board Statement
Informed Consent Statement
Data Availability Statement
Acknowledgments
Conflicts of Interest
References
- Gustavsson, U.; Frenger, P.; Fager, C.; Eriksson, T.; Zirath, H.; Dielacher, F.; Carvalho, N.B. Implementation challenges and opportunities in beyond-5G and 6G communication. IEEE J. Microw. 2021, 1, 86–100. [Google Scholar] [CrossRef]
- Chowdhury, M.Z.; Shahjalal, M.; Ahmed, S.; Jang, Y.M. 6G wireless communication systems: Applications, requirements, technologies, challenges, and research directions. IEEE Open J. Commun. Soc. 2020, 1, 957–975. [Google Scholar] [CrossRef]
- Thi Nguyen, T.T.; Do, D.T.; Chen, Y.C.; So-In, C.; Rahman, M.A. New look on relay selection strategies for full-duplex multiple-relay NOMA over Nakagami-m fading channels. Wirel. Netw. 2021, 27, 3827–3843. [Google Scholar] [CrossRef]
- Le, C.B.; Do, D.T.; Silva, A.; Khan, W.U.; Khalid, W.; Yu, H.; Nguyen, N.D. Joint design of improved spectrum and energy efficiency with backscatter NOMA for IoT. IEEE Access 2021, 10, 7504–7519. [Google Scholar] [CrossRef]
- Sheeba, J.H.; Kumaravelu, V.B.; Imoize, A.L. Rate Maximization of Cell-Edge Users Through Cooperative NonOrthogonal Multiple Access. In Proceedings of the 2023 4th International Conference on Signal Processing and Communication (ICSPC), Coimbatore, India, 23–24 March 2023; pp. 361–366. [Google Scholar]
- Agarwal, A.; Chaurasiya, R.; Rai, S.; Jagannatham, A.K. Outage probability analysis for NOMA downlink and uplink communication systems with generalized fading channels. IEEE Access 2020, 8, 220461–220481. [Google Scholar] [CrossRef]
- Alghasmari, W.F.; Nassef, L. Power allocation evaluation for downlink non-orthogonal multiple access (NOMA). Int. J. Adv. Comput. Sci. Appl. 2020, 11, 4. [Google Scholar] [CrossRef]
- Chen, R.; Shu, F.; Lei, K.; Wang, J.; Zhang, L. User clustering and power allocation for energy efficiency maximization in downlink non-orthogonal multiple access systems. Appl. Sci. 2021, 11, 716. [Google Scholar] [CrossRef]
- Fu, Y.; Zhang, M.; Salaun, L.; Sung, C.W.; Chen, C.S. Zero-forcing oriented power minimization for multi-cell MISO-NOMA systems: A joint user grouping, beamforming, and power control perspective. IEEE J. Sel. Areas Commun. 2020, 38, 1925–1940. [Google Scholar] [CrossRef]
- Deng, D.; Zhu, M. Joint UAV trajectory and power allocation optimization for NOMA in cognitive radio network. Phys. Commun. 2021, 46, 101328. [Google Scholar] [CrossRef]
- Jia, M.; Gao, Q.; Guo, Q.; Gu, X. Energy-efficiency power allocation design for UAV-assisted spatial NOMA. IEEE Int. Things J. 2020, 8, 15205–15215. [Google Scholar] [CrossRef]
- Kusaladharma, S.; Zhu, W.P.; Ajib, W.; Baduge, G.A.A. Achievable rate characterization of NOMA-aided cell-free massive MIMO with imperfect successive interference cancellation. IEEE Trans. Commun. 2021, 69, 3054–3066. [Google Scholar] [CrossRef]
- Taricco, G. Fair Power Allocation Policies for Power-Domain Non-Orthogonal Multiple Access Transmission with Complete or Limited Successive Interference Cancellation. IEEE Access 2023, 11, 46793–46803. [Google Scholar] [CrossRef]
- Abd-Elnaby, M.; Sedhom, G.G.; El-Rabaie, E.S.M.; Elwekeil, M. An Optimum Weighted Energy Efficiency Approach for Low Complexity Power Allocation in Downlink NOMA. IEEE Access 2022, 10, 80667–80679. [Google Scholar] [CrossRef]
- Liyn, L.P.; Ghani, H.A.; Roslim, F.N.; Hamzah, N.A.A.; Mohammed, S.M.A.; Aziz, N.H.A.; Aziz, A.A.; Geok, T.K.; Azizan, A. Ant-colony and nature-inspired heuristic models for NOMA systems: A review. IEEE Access 2020, 10, 126–132. [Google Scholar] [CrossRef]
- Storn, R.; Price, K. Differential Evolution—A Simple and Efficient Heuristic for Global Optimization over Continuous Spaces. J. Glob. Optim. 1997, 11, 341–359. [Google Scholar] [CrossRef]
- Kumaravelu, V.B.; Selvaprabhu, P.; Han, D.S.; Sarker, M.A.L.; Periyakarupan Gurusamy Sivabalan, V.; Sundarrajan Jayaraman, T.; Murugadass, A.; Evangeline, C.S. Blind reconfigurable intelligent surface-aided fixed non-orthogonal multiple access for intelligent vehicular networks. EURASIP J. Wirel. Commun. Netw. 2023, 1, 83. [Google Scholar] [CrossRef]
- Kumaravelu, V.B.; Imoize, A.L.; Soria, F.R.C.; Velmurugan, P.G.S.; Thiruvengadam, S.J.; Do, D.T.; Murugadass, A. RIS-Assisted Fixed NOMA: Outage Probability Analysis and Transmit Power Optimization. Future Int. 2023, 15, 249. [Google Scholar] [CrossRef]
- Jadhav, H.K.; Kumaravelu, V.B. Blind RIS Aided Ordered NOMA: Design, Probability of Outage Analysis and Transmit Power Optimization. Symmetry 2022, 14, 2266. [Google Scholar] [CrossRef]
- Kumaravelu, V.B.; Imoize, A.L.; Soria, F.R.C.; Velmurugan, P.G.S.; Thiruvengadam, S.J.; Murugadass, A.; Gudla, V.V. Outage Probability Analysis and Transmit Power Optimization for Blind-Reconfigurable Intelligent Surface-Assisted Non-Orthogonal Multiple Access Uplink. Sustainability 2022, 14, 13188. [Google Scholar] [CrossRef]

| Parameters | Values |
|---|---|
| Distance of user-1 from BS, | 300 m |
| Distance of user-2 from BS, | 600 m |
| Bandwidth, B | |
| Initial population size, | 50 |
| Number of iterations, | 100 |
| Scaling factor for mutation, | 0.85 |
| Crossover probability, | 0.8 |
| Lower bound for individual vectors, | 0 |
| Upper bound for individual vectors, | 1 |
| Path loss exponent, | 4 |
| Number of channel coefficients, | |
| Minimum data rate demand for user-1, | 1 bps/Hz |
| Minimum data rate demand for user-2, | 1 bps/Hz |
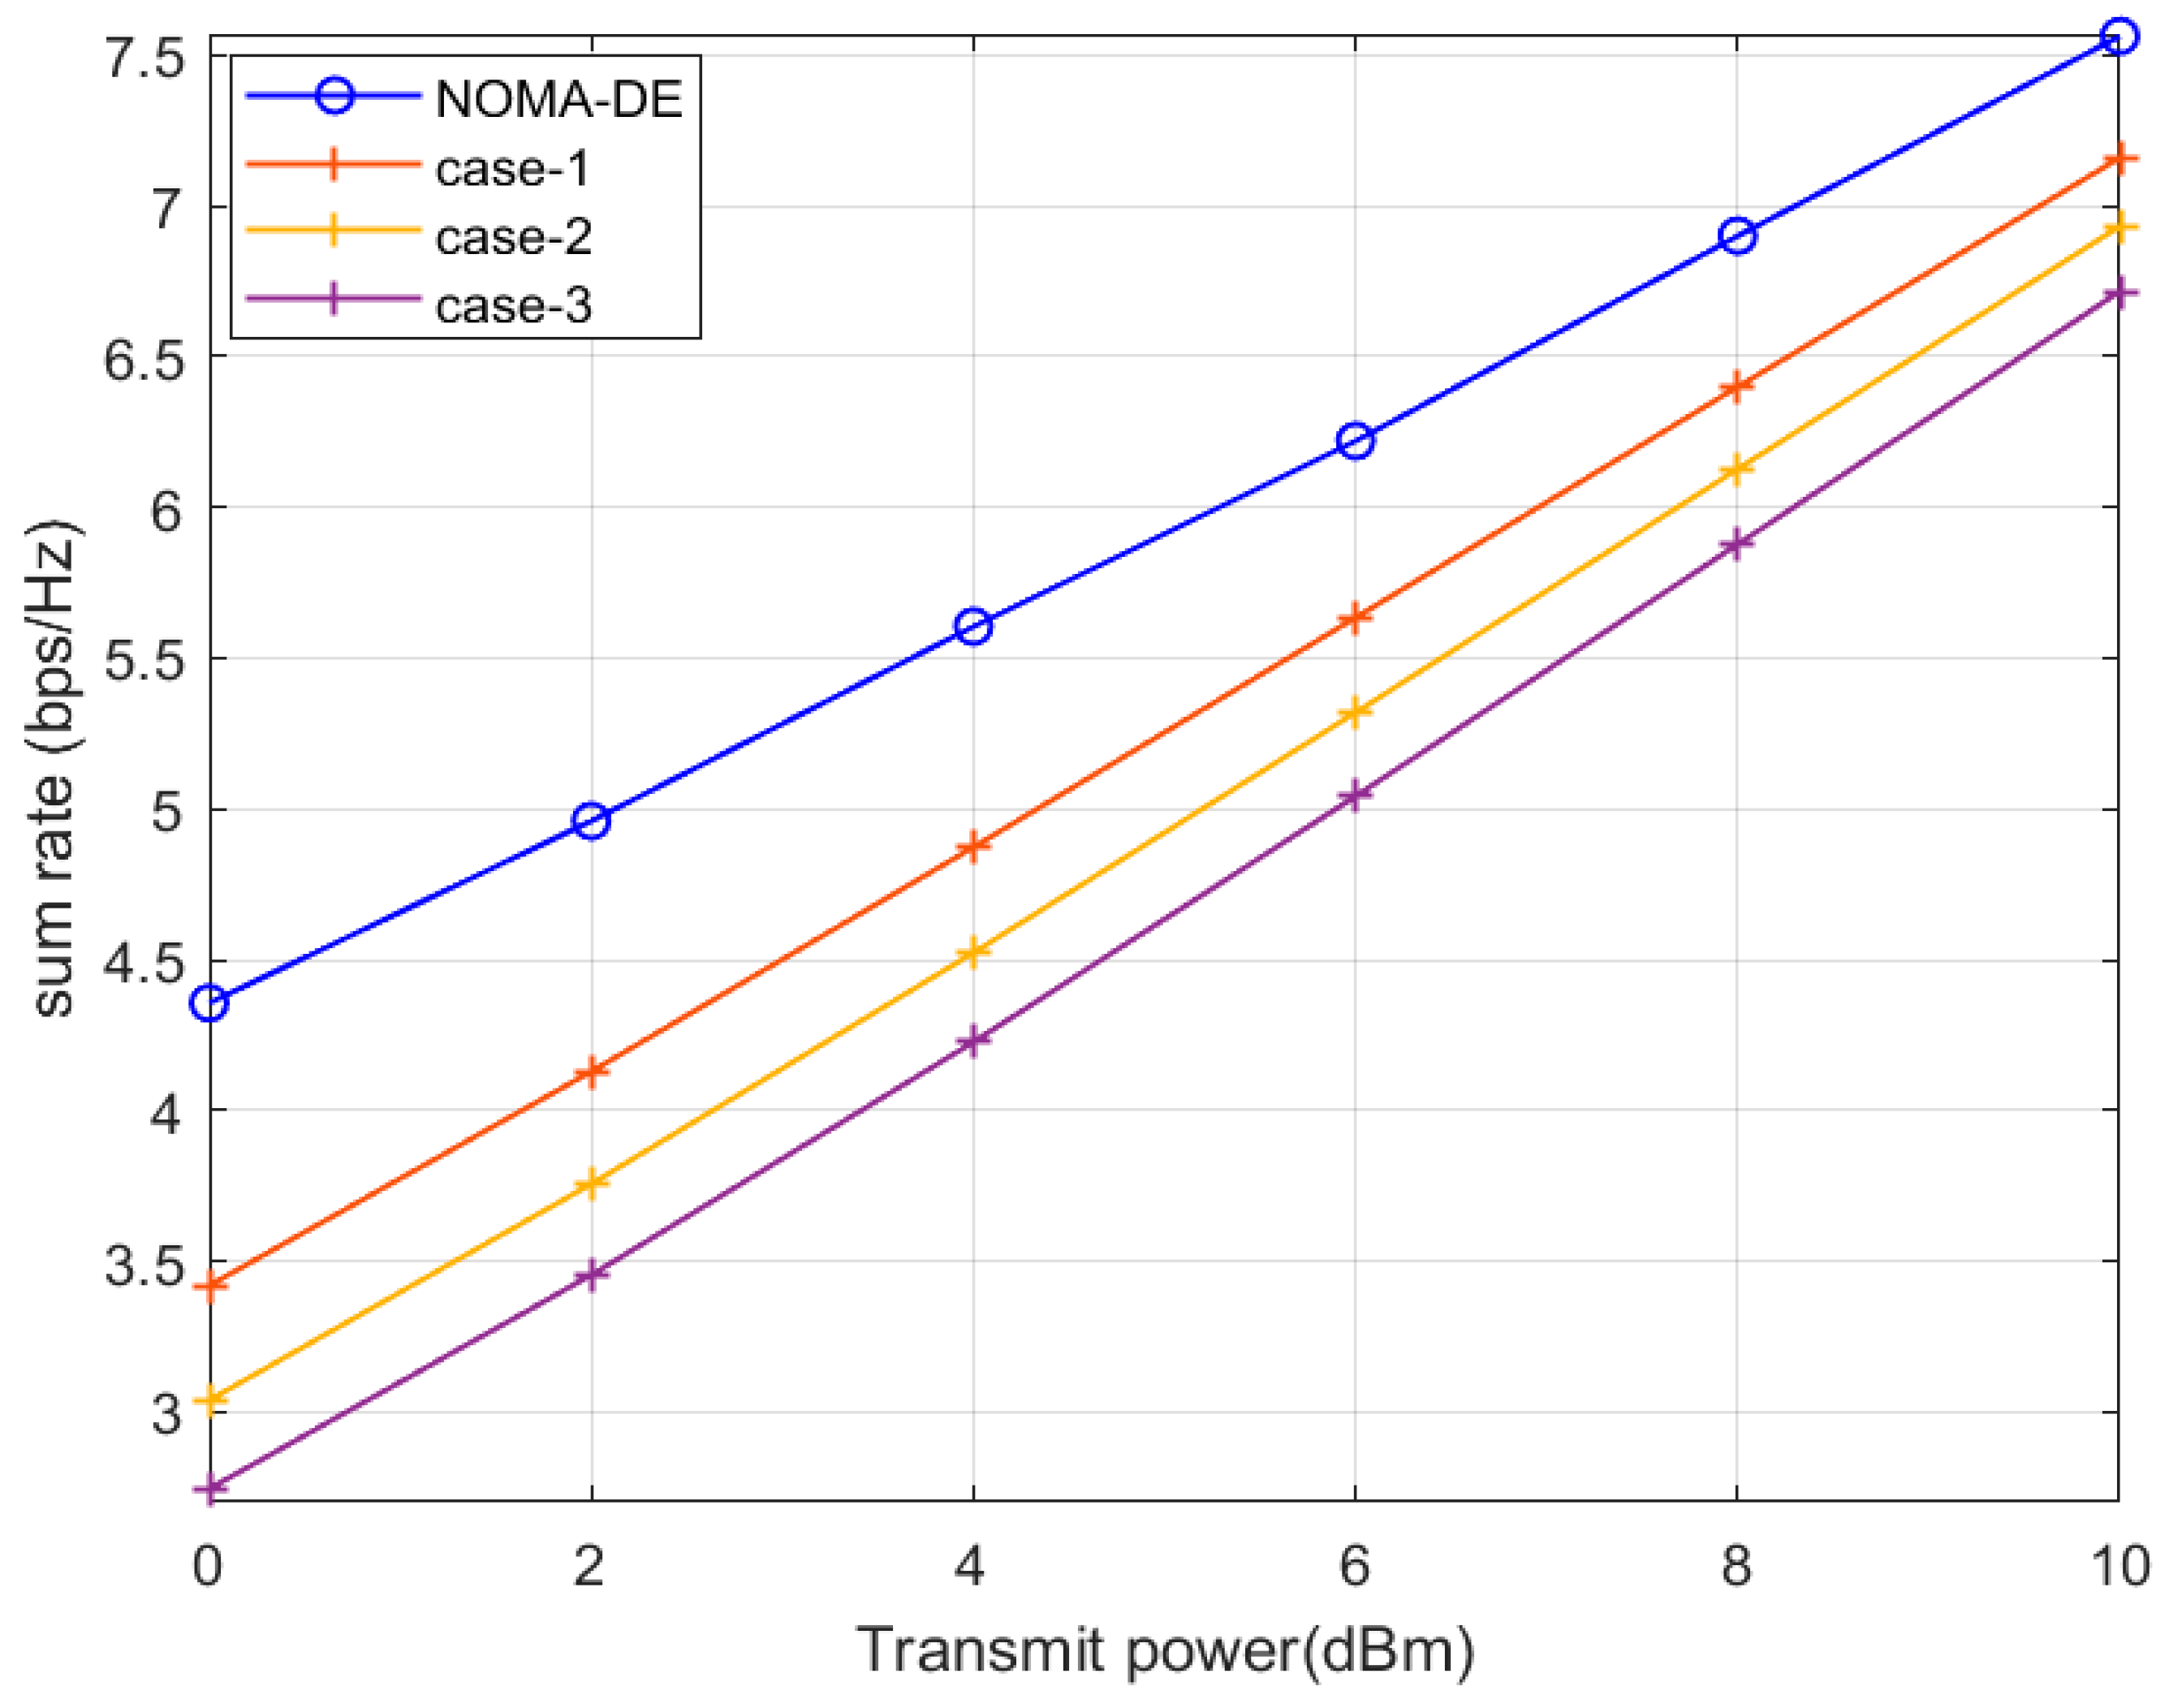
| Scheme | Sum Rate at 10 dBm Transmit Power | % of Sum Rate Improvement of NOMA-DE over Random PA |
|---|---|---|
| NOMA-DE | 7.57 bps/Hz | - |
| case-1 | 7.15 bps/Hz | 5.87% |
| case-2 | 6.93 bps/Hz | 9.24% |
| case-3 | 6.72 bps/Hz | 12.65% |
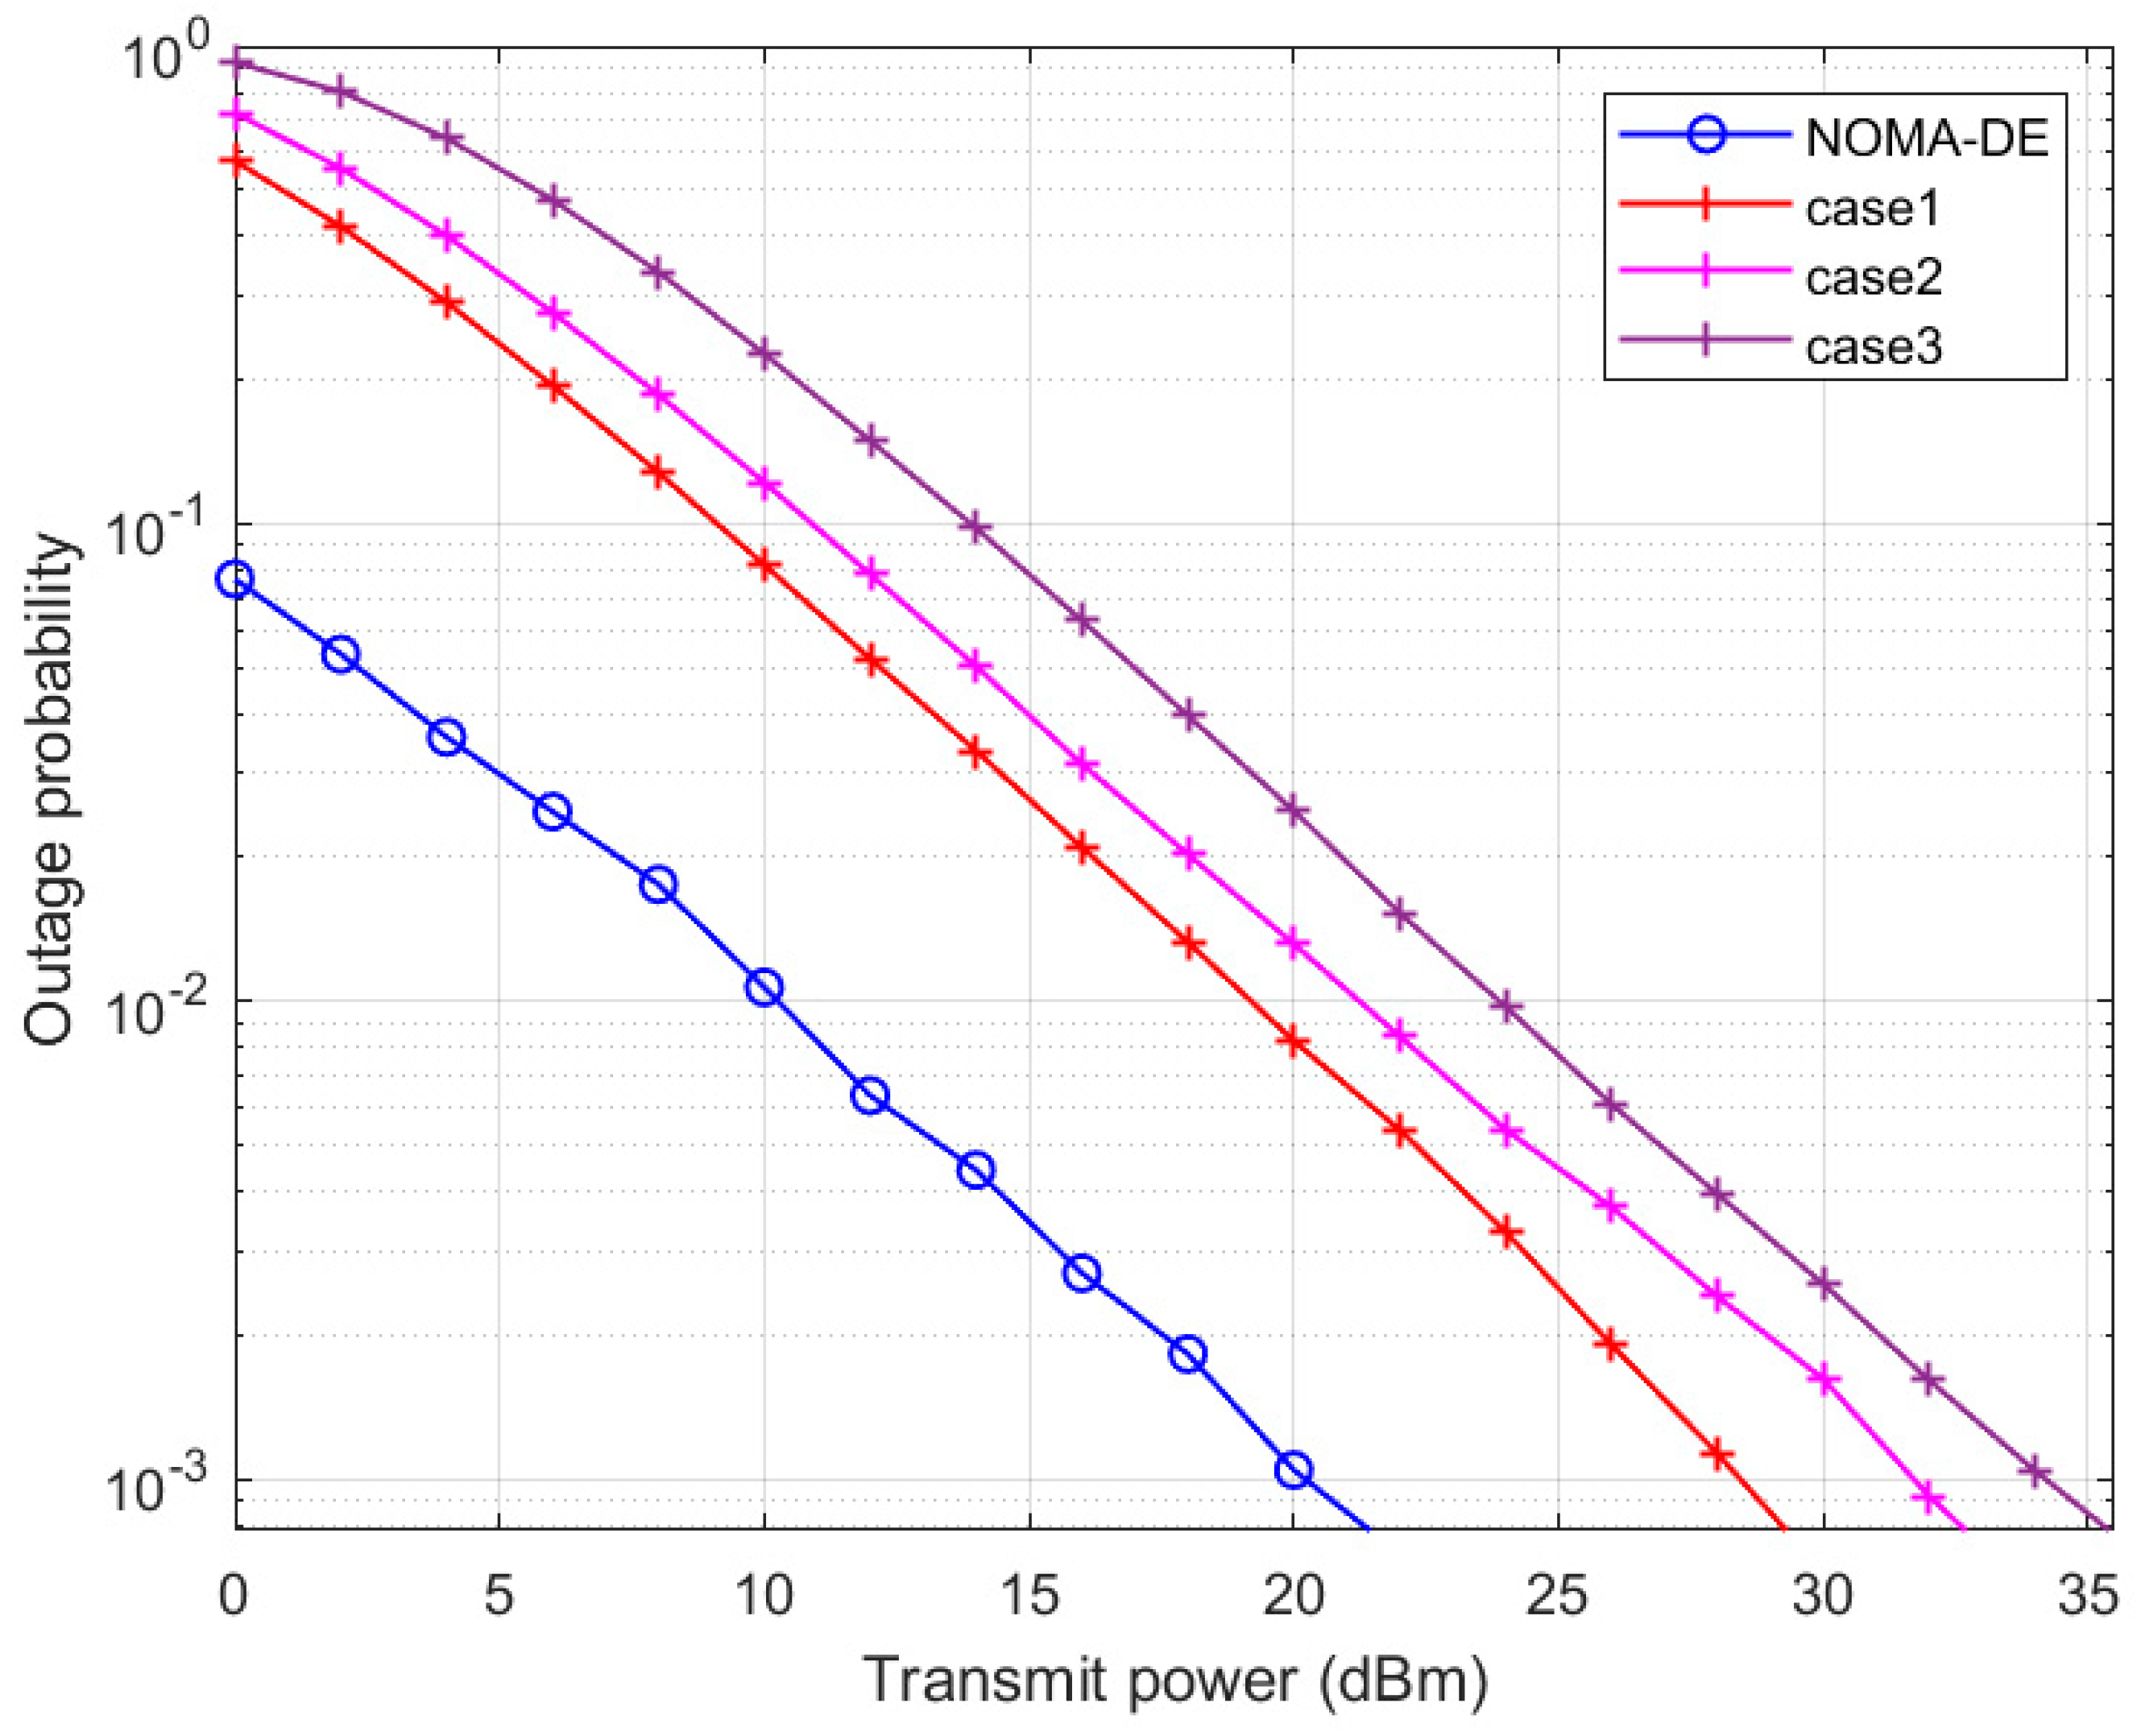
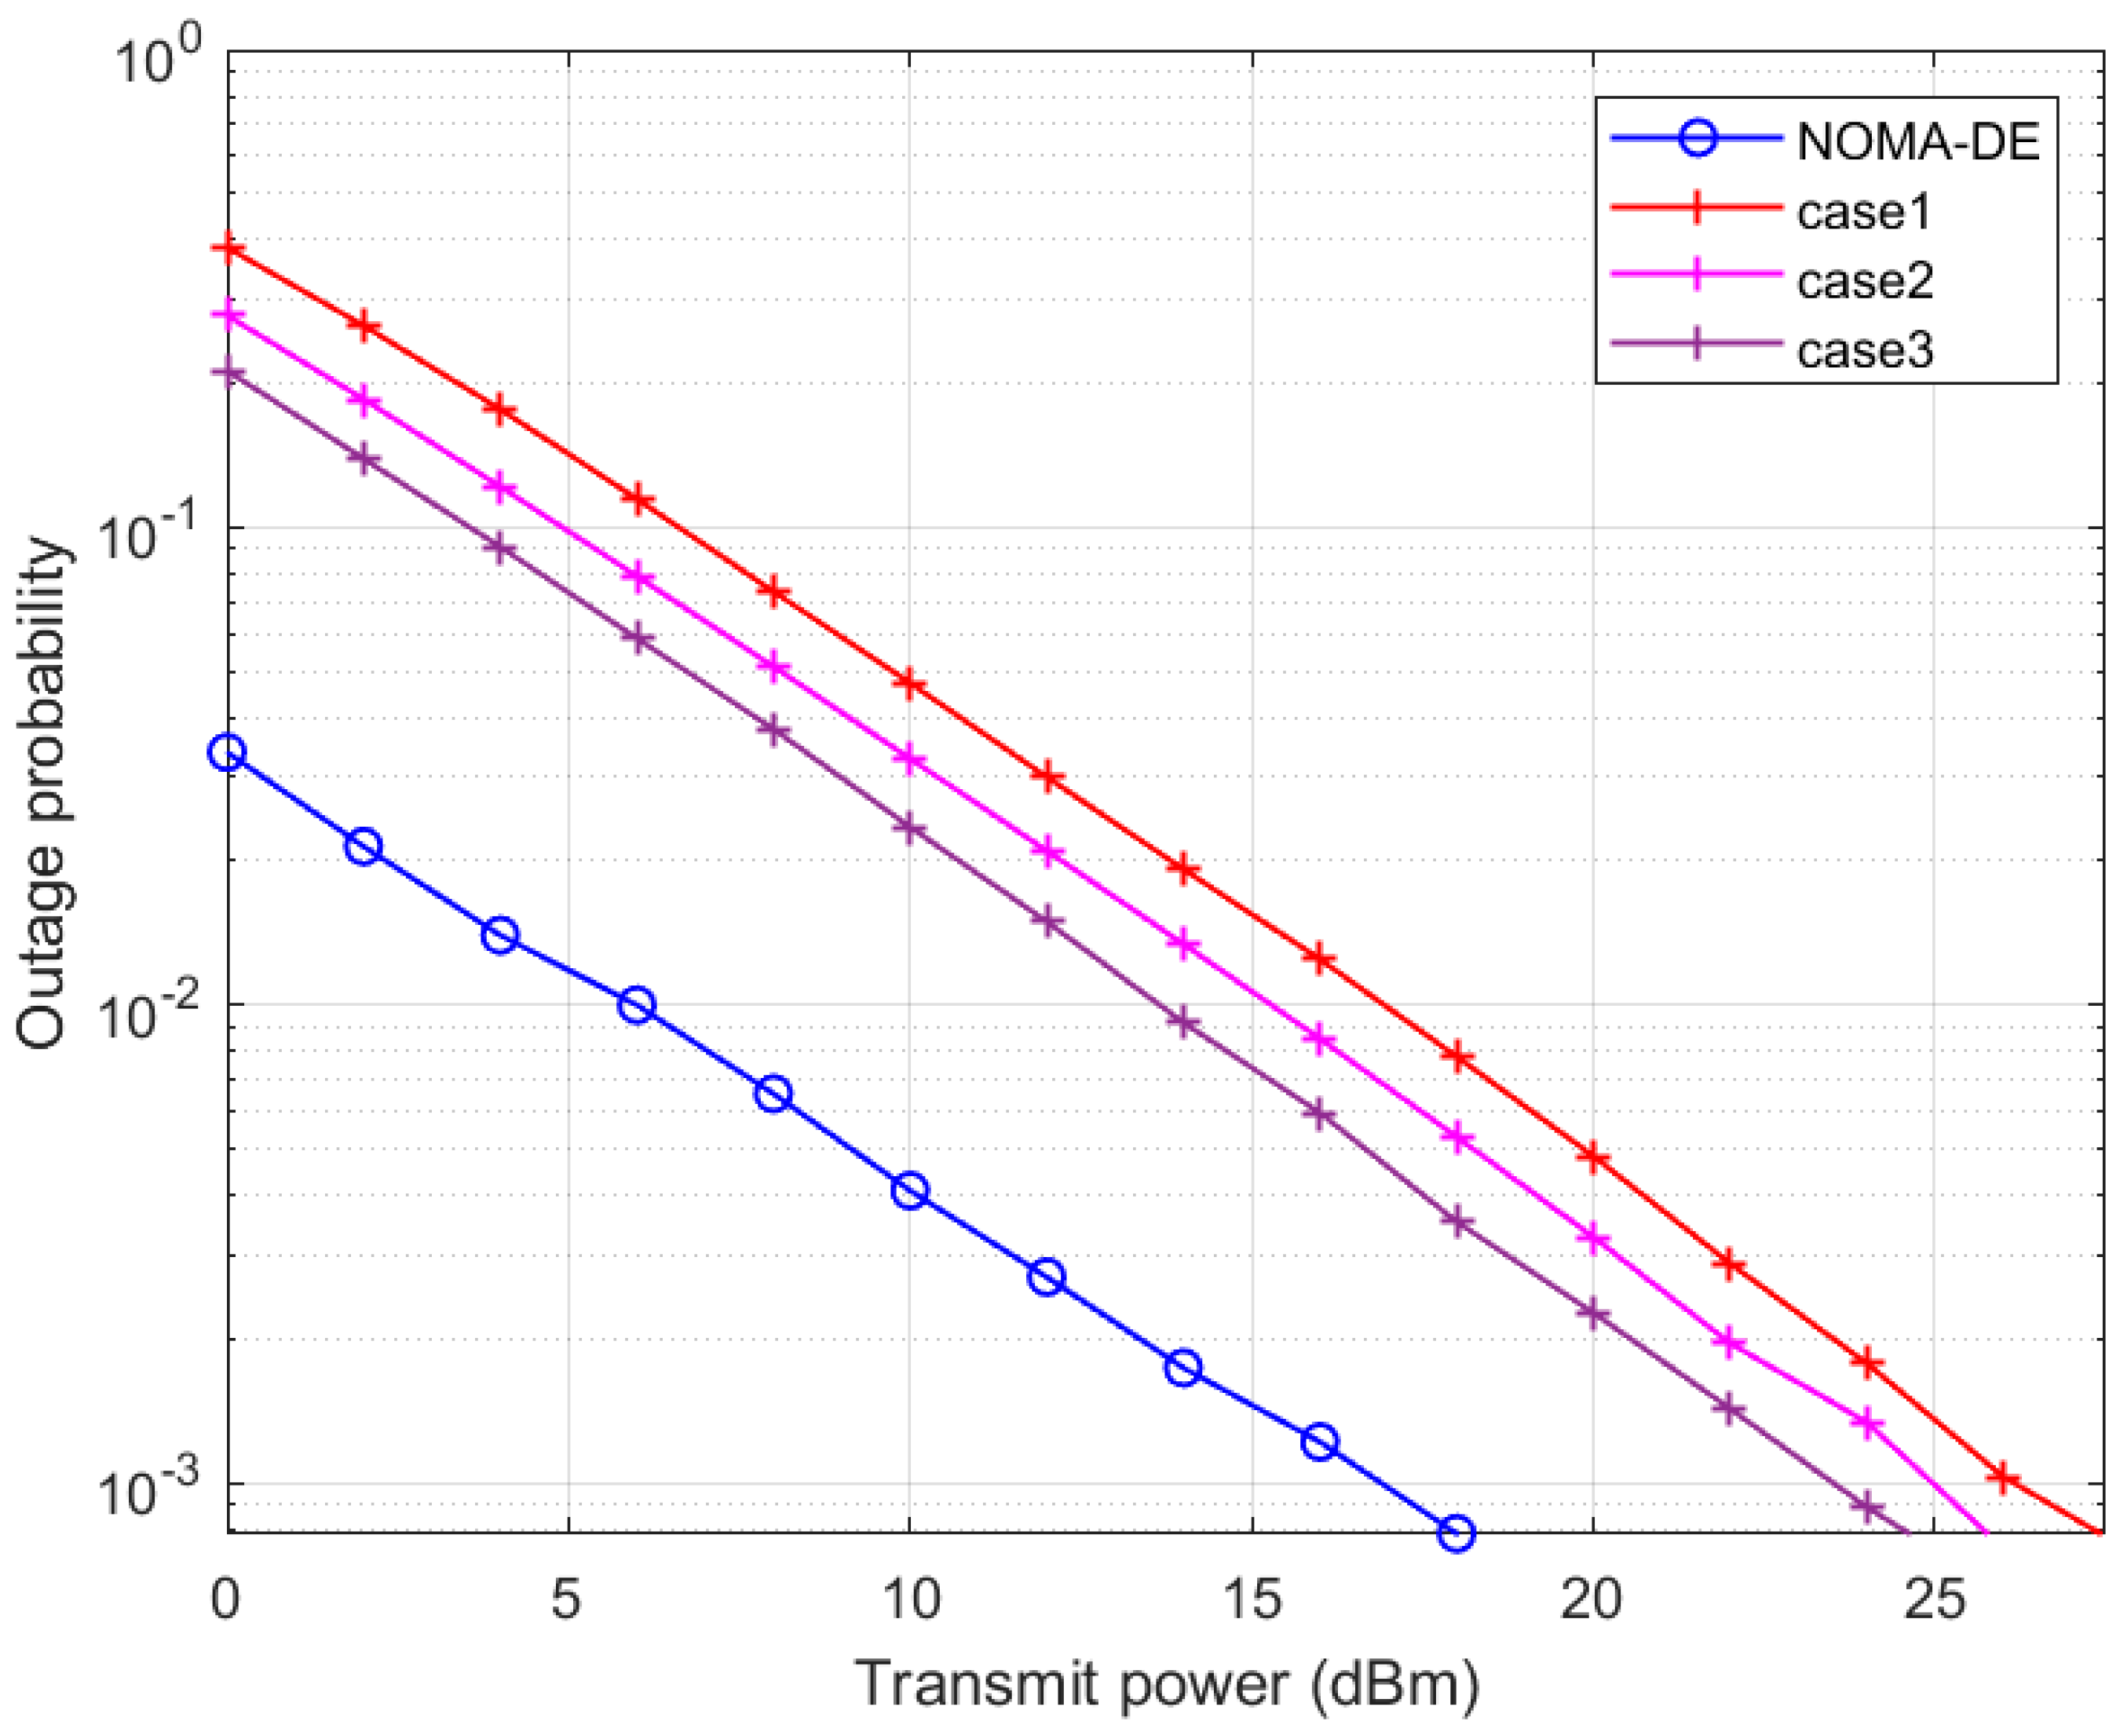
| Scheme | User-1 | User-2 | ||
|---|---|---|---|---|
| Transmit power (dBm) to achieve a target outage of | Improvement of DE over other cases. | Transmit power (dBm) to achieve a target outage of | Improvement of DE over other cases | |
| NOMA-DE | 20 dBm | - | 16.82 dBm | - |
| case-1 | 28.24 dBm | 8.24 dBm | 26 dBm | 9.18 dBm |
| case-2 | 31.50 dBm | 11.50 dBm | 24.90 dBm | 8.08 dBm |
| case-3 | 34.13 dBm | 14.13 dBm | 23.38 dBm | 6.56 dBm |
Disclaimer/Publisher’s Note: The statements, opinions and data contained in all publications are solely those of the individual author(s) and contributor(s) and not of MDPI and/or the editor(s). MDPI and/or the editor(s) disclaim responsibility for any injury to people or property resulting from any ideas, methods, instructions or products referred to in the content. |
© 2023 by the authors. Licensee MDPI, Basel, Switzerland. This article is an open access article distributed under the terms and conditions of the Creative Commons Attribution (CC BY) license (https://creativecommons.org/licenses/by/4.0/).
Share and Cite
Rayaroth, D.; Kumaravelu, V.B.; John Kennedy, H.S.; Bagadi, K.; Soria, F.R.C. Differential Evolution Optimized Non-Orthogonal Multiple Access for Sum Rate Maximization. Eng. Proc. 2023, 59, 101. https://doi.org/10.3390/engproc2023059101
Rayaroth D, Kumaravelu VB, John Kennedy HS, Bagadi K, Soria FRC. Differential Evolution Optimized Non-Orthogonal Multiple Access for Sum Rate Maximization. Engineering Proceedings. 2023; 59(1):101. https://doi.org/10.3390/engproc2023059101
Chicago/Turabian StyleRayaroth, Dipinkrishnan, Vinoth Babu Kumaravelu, Helen Sheeba John Kennedy, Kalapraveen Bagadi, and Francisco R. Castillo Soria. 2023. "Differential Evolution Optimized Non-Orthogonal Multiple Access for Sum Rate Maximization" Engineering Proceedings 59, no. 1: 101. https://doi.org/10.3390/engproc2023059101